Correlation-Induced Synchronization of Oscillations in Olfactory Bulb Neurons (original) (raw)
Abstract
Oscillations are a common feature of odor-evoked and spontaneous activity in the olfactory system in vivo and in vitro and are thought to play an important role in information processing and memory in a variety of brain areas. Theoretical and experimental studies have described several mechanisms by which oscillations can be generated and synchronized. Here, we investigate the hypothesis that correlated noisy inputs are able to generate synchronous oscillations in olfactory bulb mitral cells in vitro. We consider several alternative mechanisms and conclude that olfactory bulb synchronous oscillations are likely to arise because of the response of uncoupled oscillating neurons to aperiodic but correlated inputs. This mechanism has been described theoretically, but we provide the first experimental evidence that such a mechanism may underlie synchronization in real neurons. In physiological experiments, we show that this mechanism can generate gamma-band oscillations in populations of olfactory bulb mitral cells. This mechanism synchronizes oscillatory firing by using shared fast fluctuations in stochastic inputs across neurons, without requiring any synaptic or electrical coupling. We discuss the properties and limitations of synchronization by this mechanism and suggest that it may underlie fast oscillations in many brain areas.
Keywords: inhibition, olfactory bulb, synchronization, slice, oscillator, mitral cell
Introduction
Synchronized oscillatory activity in various frequency ranges is a prominent feature of neural activity in many brain areas (Buzsaki and Draguhn, 2004) including the olfactory bulb (Adrian, 1942). In the olfactory system, gamma frequency oscillations (20–80 Hz) have been observed since the earliest recordings (Adrian, 1942) and are enhanced during certain states and olfactory behaviors (Kay and Laurent, 1999; Ravel et al., 2003). The mechanisms by which olfactory bulb gamma oscillations are generated and synchronized are not, however, well understood. Some fast oscillations are intrinsic to the bulb circuitry (Neville and Haberly, 2003) even being observed in slice preparations (Friedman and Strowbridge, 2003; Lagier et al., 2004), suggesting that the intrinsic connectivity can give rise to synchronization. One long-standing hypothesis has been that recurrent and lateral inhibition mediated by dendrodendritic mitral cell-granule cell synapses (for review, see Schoppa and Urban, 2003) are critical for the generation and synchronization, respectively, of high-frequency oscillations in the olfactory bulb (Bressler and Freeman, 1980; Mori et al., 1981a; Segev, 1999). According to this hypothesis, mitral cell activity leads to recurrent inhibition, which in turn stops mitral cell firing for some period. Synchronization is then achieved via lateral inhibition between mitral cells. That is, when one mitral cell inhibits its own firing, it also inhibits other mitral cells. Thus, the timing of the pauses in firing will be similar across mitral cells (Desmaisons et al., 1999; Lagier et al., 2004). Decaying inhibition then allows resumption of firing, which again evokes recurrent and lateral inhibition. Several variants of this model have been proposed to explain olfactory bulb fast field potential oscillations (Mori and Takagi, 1978; Kay and Laurent, 1999; Powell et al., 1999; Segev, 1999; Neville and Haberly, 2003; Lagier et al., 2004). However, little direct evidence showing that this mechanism can account for synchronous fast oscillations in the olfactory system has been provided. Alteration of inhibition changes fast field potential oscillations in vivo and in vitro (Nusser et al., 2001; Friedman and Strowbridge, 2003; Lagier et al., 2004), but this is consistent with other mechanisms (see below).
Here, we examine the kinetics of lateral inhibition in the olfactory bulb and find them inconsistent with this proposed mechanism of gamma oscillations. We then use experimental and computational approaches to investigate the possibility that the olfactory bulb is using a different mechanism to generate synchronous oscillations. Specifically, we propose that a mechanism that has been described theoretically (Teramae and Tanaka, 2004; Nakao et al., 2005) generates oscillatory synchrony in olfactory bulb mitral cells. This mechanism, which involves noise-induced synchronization, has been the subject of considerable interest across biological physics (Springer and Paulsson, 2006) but has not previously been applied to real oscillating neurons. According to this mechanism, mitral cells firing in a roughly oscillatory pattern are synchronized by correlated, but aperiodic inputs received from common granule cells. Such a mechanism of generating synchronous oscillations has not been observed experimentally in neural systems, although it may explain some previously observed phenomena (Reyes, 2003; Hasenstaub et al., 2005).
Materials and Methods
Physiological experiments
Slice preparation.
Sagittal olfactory bulb slices (300–350 μm thick) were prepared from young mice [postnatal day 18 (P18) to P45, mostly between P21 and P35] as described previously (Urban and Sakmann, 2002). Mice were given intraperitoneal injections of anesthetic (0.1% ketamine/0.1% xylazine) until they were nonresponsive to foot pinch and then decapitated. Olfactory bulbs were removed and cut on a vibratome while submerged in ice-cold oxygenated Ringer's solution containing the following (in mm): 125 NaCl, 2.5 KCl, 25 NaHCO3, 1.25 NaH2PO4, 1 MgCl2, 25 glucose, 2 CaCl2. After slicing, slices were transferred to a warm (37°C) oxygenated incubating bath for 30–60 min and then allowed to equilibrate to room temperature before being transferred to the recording chamber.
Electrophysiology.
Whole-cell voltage recordings were obtained from the somata of identified mitral cells using infrared differential interference contrast microscopy (Stuart and Spruston, 1995). Slices were superfused continuously with oxygenated Ringer's solution containing the following (in mm): 125 NaCl, 2.5 KCl, 25 NaHCO3, 1.25 NaH2PO4, 1 MgCl2, 25 glucose, 2 CaCl2, warmed to 34–36°C. Whole-cell recordings were established using pipettes (resistances of 2–8 MΩ) filled with a solution containing the following (in mm): 120 potassium gluconate, 2 KCl, 10 HEPES, 10 sodium phosphocreatine, 4 MgATP, and 0.3 Na3GTP, adjusted to pH 7.3 with KOH. Voltage measurements were made in current-clamp mode with multiclamp 700A and 700B amplifiers (Molecular Devices, Foster City, CA). Data were filtered (4 kHz) and digitized at 10 kHz using an ITC-18 data acquisition board (Instrutech, Mineola, NY) controlled by custom software written in Igor (Wavemetrics, Lake Oswego, OR). APV (50 μm), CNQX (10 μm), and gabazine (10 μm) were added in some cases to block synaptic transmission. Drugs were obtained from Sigma (St. Louis, MO) and Tocris (Bristol, UK) (gabazine).
Data are reported as mean ± SEM. Significance was assessed by paired or unpaired Student's t tests, as appropriate. All animal care was performed in accordance with the guidelines of the Institutional Animal Care and Use Committee of Carnegie Mellon University.
Computational modeling: neural dynamics
All computer simulations were implemented in Matlab using the simple neural model proposed recently by Izhikevich (2004), which produces voltage traces reminiscent of many different CNS neurons:

with v as the membrane potential and u as the recovery variable. In all simulations shown, the parameters have the following values: a = 0.02, b = 0.2, c = −65, d = 2. This choice corresponds to a neuron showing subthreshold resonance, and displaying class II excitability (Rinzel and Ermentrout, 1989; Izhikevich, 2004). We chose this dynamical regime because type II excitability accounts for four properties of mitral cells: onset of repetitive firing at a finite frequency (Desmaisons et al., 1999), postinhibitory spikes (Desmaisons et al., 1999), subthreshold oscillations (Desmaisons et al., 1999; Galán et al., 2005), and partially negative phase-resetting curves (Galán et al., 2005). Nevertheless, stochastic synchrony was also observed in this model for type I excitability. The simulated mitral cells were not coupled to each other but rather received partially common inhibitory inputs from granule cells, which modeled granule-cell-mediated inhibition.
The total input to the cells had three components: (1) steady-state depolarizing current modeling input from olfactory receptor neurons, the amplitude of which was varied between 3.6 and 6 (arbitrary units) in different simulations to generate sustained firing at the desired frequency, (2) the (correlated) inhibitory input from granule cells, which typically had an amplitude of 1 or smaller, and (3) white noise uncorrelated inputs, the amplitude of which was varied between 0 and 20% of the peak synaptic current, describing background noise.
Generation of stimulus currents
The inputs injected into mitral cells or used in simulations consisted of a direct current step, the amplitude of which was chosen to elicit firing in the 25 Hz range, plus either a Poisson train of IPSC-like currents (IPSC noise) or white noise convolved with an α function. Individual IPSC noise traces were generated as a Poisson process convolved with an α function (τ = 3 ms) representing fast inhibitory synaptic response to incoming presynaptic spikes. The correlation between IPSC noise sweeps was produced in two steps: (1) for each correlation level (_C_in), an independent Poisson train was generated, plus an additional template Poisson train (P0). (2) For each input Poisson train (P1-P5), every event had a probability _C_in of being removed and every event of the template train had the same probability of being inserted in the input train. By proceeding this way, every input train shared on average a fraction _C_in of events with the template. These Poisson trains were then convolved with an α function (α(t) = (t/τ)e−t/τ), where τ = 3 ms to produce current traces (_T_0–_T_5) that were used as input to mitral cells.
For continuous input noise (α-noise), the cross-correlations were produced in three steps. (1) Uncorrelated white noise inputs of unit variance were generated. (2) These signals were linearly mixed by multiplying them with the Cholesky factor of a symmetric, positive-definite matrix with unitary diagonal elements. The off-diagonal elements of this matrix were randomly chosen from a uniform distribution between _C_in − 0.1 and _C_in + 0.1, where _C_in is the desired mean correlation value. The matrix generated this way is an estimator of the correlation matrix of the mixed signals. (3) The mixed (i.e., correlated) signals were convolved with an α function (τ = 3 ms) that models synaptic filtering.
Data analysis
In vivo and in vitro synchronous activity of large numbers of neurons generates local field potentials (LFPs), the amplitude of which varies with both the level and synchrony of neuronal activity. To compare the relative synchrony resulting from various kinds of inputs delivered to small numbers of real or modeled neurons, in some experiments, an estimate of the local field potential was calculated. This estimated LFP was the average of the low-pass filtered (6-pole Butterworth, 100 Hz cutoff) membrane potentials recorded in multiple cells, or in some cases across multiple responses in the same cell. The estimated LFP was inverted for display purposes to match LFPs that are recorded extracellularly in vitro and in vivo. Calculating the power spectrum of this estimated LFP gave us a means by which to compare the fraction of neurons responding at a given time to a particular stimulus and also allowed us to compare the degree to which cells were activated at the same time by different stimuli. Power spectra were calculated with the Welch method (i.e., averaging the spectra estimated over smaller, overlapping windows; total signal length, 10,000 ms; window size, 1024 ms; overlap, 512 ms). The cross-correlogram was computed to determine the degree to which responses generated in different neurons or in the same neuron by different inputs were synchronized in an oscillatory manner. Cross-spectra of signal pairs were calculated by multiplying the fast Fourier transform (FFT) of one signal with the complex conjugate of the FFT of the other signal over each window and then averaging across windows. The same techniques to quantify synchrony were used in the analysis of experimental data and data from simulations. In some cases, we computed the power spectrum of the cross-correlogram, which is the same as the cross-spectral density, and in other cases we reported simply the degree to which the two responses were correlated by giving the value of the cross-correlogram for zero time lag.
Using data from simulations, two standard data-analysis techniques (Matlab; signal processing toolbox) were applied to estimate the degree of synchrony induced by correlated input fluctuations in simulations: cross-correlation analysis and spectral analysis. The cross-correlations between simulated spike-train responses were calculated by first extracting a spike train from the simulated voltage traces to create a binary wave and then convolving these spike trains with Gaussians of half-width σ. For σ > 4 ms, the following calculations did not differ substantially, so we concluded that setting σ to 5 ms was a reasonable choice to allow tolerance for jitter without influencing the estimation of synchrony. In addition, we calculated the power spectrum of estimated local field potentials (see above).
Results
Properties of lateral IPSPs
We measured the properties of recurrent and lateral IPSPs using simultaneous whole-cell current-clamp recordings from mitral cells of the mouse main olfactory bulb. Similar to previous results (Urban and Sakmann, 2002), IPSPs in connected mitral cells consisted of aperiodic barrages of presumed unitary IPSPs (Fig. 1). Single unitary IPSPs had amplitudes of up to 7 mV and averaging IPSPs across many sweeps showed that the decay of the inhibition was slow (382 ± 55 ms; n = 5 pairs). The number of identifiable unitary IPSPs evoked per presynaptic stimulus was 12.2 ± 6.1 for presynaptic sweeps of 6.2 spikes per 100 ms square pulse (n = 5 pairs). The average decay time of these unitary events, which are thought to represent release from single granule cells, is ∼20 ms, typical of GABAA receptor-mediated IPSCs (Isaacson and Strowbridge, 1998). The number of these events varied with the level of presynaptic mitral cell activity and became difficult to determine when the presynaptic cell fired at high rates because of overlap of IPSPs. This suggests that the integrated lateral IPSPs received by a mitral cell after activation of large numbers of mitral cells will result in fluctuating hyperpolarization that decays slowly. This sort of input is unlikely to generate or stabilize gamma-band firing (Chow et al., 1998; Prinz et al., 2003).
Figure 1.
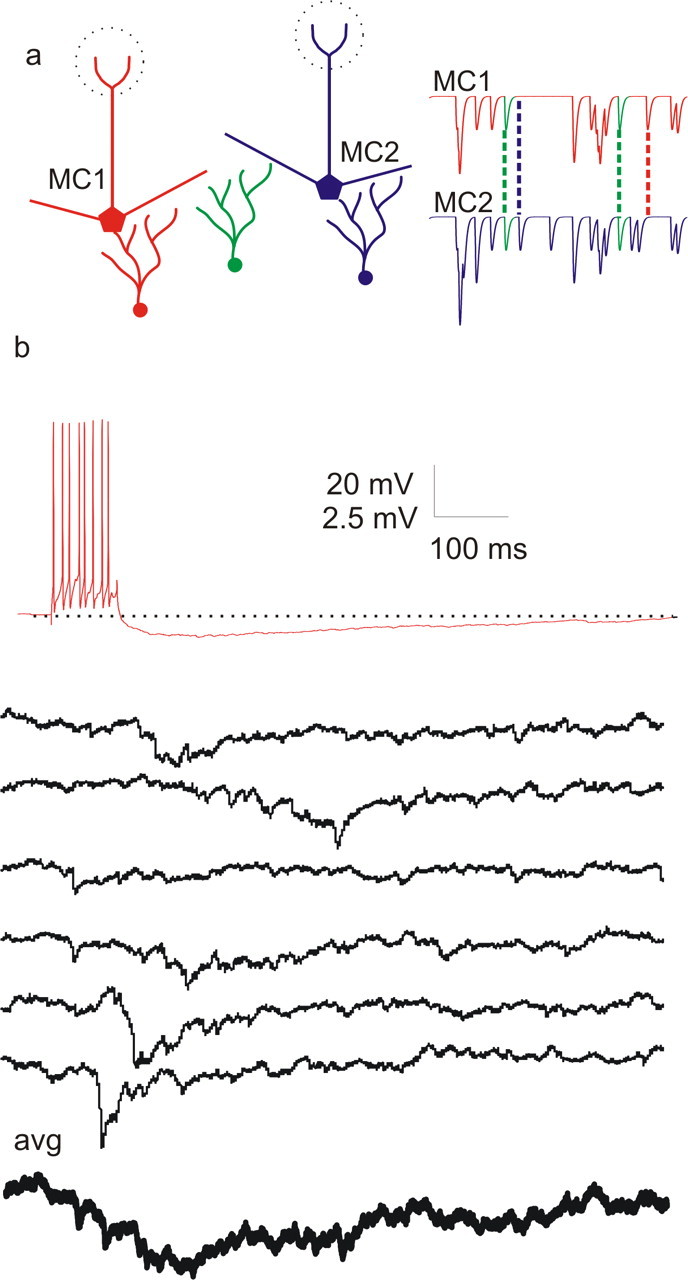
Properties of lateral IPSPs in the mouse olfactory bulb. a, Schematic showing two mitral cells (red and blue) receiving input from unshared (red and blue) and shared (green) granule cells. Spiking in green granule cells results in correlated IPSPs in the red and blue mitral cells. Inputs from such shared granule cells are proposed to be responsible for the correlated inputs that can give rise to the stochastic synchronization phenomenon described here. b, Voltage traces recorded from a pair of mitral cells in vitro coupled by disynaptic, granule cell-mediated inhibition. Spiking in one mitral cell (red trace) elicited by 100 ms current injection (400 pA) results in asynchronous IPSPs recorded in a second mitral cell (6 example traces, black). The average lateral IPSP (thick bottom trace) shows slow rise and slow decay times that are typical for unitary lateral IPSPs.
Effect of noise on mitral cell oscillatory firing
Because the slow time course of lateral IPSPs makes it unlikely that they cause global synchronization of mitral cells, we next examined the modulation of firing patterns in single mitral cells by inputs having properties similar to those of the barrages of granule cell-mediated IPSCs. Mitral cells were depolarized by constant current to elicit firing at frequencies in the gamma range (Fig. 2a,c). In vivo, mitral cells fire at this frequency when activated by receptor neuron input during odor stimulation (Margrie and Schaefer, 2003), and single mitral cells fire preferentially at approximately this frequency in vitro (Desmaisons et al., 1999; Balu et al., 2004). When Poisson-distributed IPSC-like currents (α functions with τ = 3 ms and Poisson rate of 50 Hz) were added to the steady-state input current, mitral cells still fired in an oscillatory manner, as indicated by the peak in their power spectra (Fig. 2b,c). We call this kind of input IPSC noise (see Materials and Methods). The addition of IPSC noise had little effect on average firing rates in mitral cells (27 ± 4 Hz control vs 30 ± 4 Hz with noise; n = 6 cells; p > 0.05) or on their power spectra (Fig. 2c). The power spectrum of the injected IPSC noise is largest at low frequency and decreases monotonically with frequency at a rate determined by the time constant of the α function (Fig. 2c). Thus, we concluded that the firing rate and oscillatory firing pattern of mitral cells are little altered by IPSC noise. Similar effects on the power spectrum were observed when injecting white noise convolved with an α function (τ = 3 ms; n = 4 cells; data not shown). Thus we conclude that during constant current input, single mitral cells show oscillatory firing, the rate of which is not significantly altered by the addition of barrages of inhibitory synaptic inputs. We next examined whether this IPSC-like input could influence the synchronous firing of pairs of mitral cells.
Figure 2.
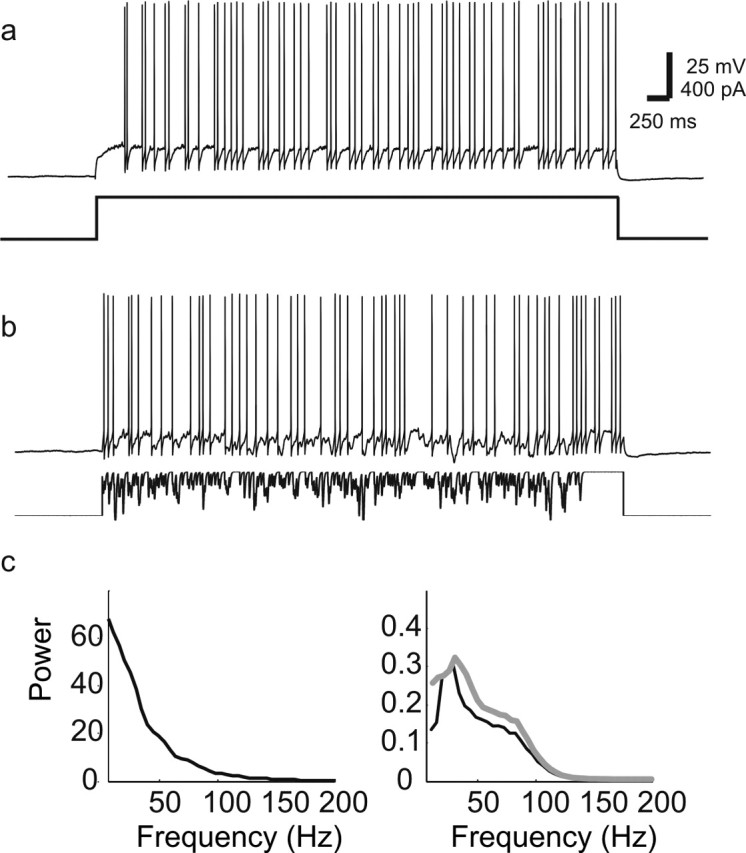
Response of single mitral cell to IPSC noise input. a, Mitral cell spike train in response to constant current input. b, Response of same cell to 400 pA current plus Poisson distributed train of α functions that we refer to as “IPSC noise” (rate, 50/s; α = 3 ms; amplitude, 60 pA). c, Power spectrum of IPSC noise input current from b (left) and average power spectrum (right) of six mitral cells given steady-state (black) and IPSC noise current injections (gray). Addition of IPSP noise resulted in a slightly broader power spectrum, mainly by enhancing the low frequency component, without affecting the frequency of the peak of the power spectrum.
Correlated noise elicits synchronized oscillatory firing of mitral cells
Because single mitral cells fire rhythmically even when receiving noisy input, we examined whether noise that is partially correlated across cells can synchronize oscillatory firing in different mitral cells. Sets of correlated IPSC noise-current traces (_T_0–_T_5, rate = 40 Hz; α functions, τ = 3 ms; amplitude, 20–60 pA) were generated by varying the probability (denoted as _C_in) that a given trace would have IPSCs occurring at the same time as the first trace in the set (_T_0, the template trace; see Materials and Methods). In the olfactory bulb, pairs of mitral cells receive input from overlapping populations of granule cells (1a). The value of _C_in corresponds roughly to the fraction of their total inhibitory input that two mitral cells receive from the same granule cells. This value can be thought of as representing both anatomical connectivity and also the relative activity of shared versus independent populations of granule cells. Moreover, _C_in is also the correlation coefficient of the given trace with the template trace. Preliminary simulations showed that in reduced models of spiking neurons (see Materials and Methods), correlated IPSC noise led to synchronous oscillatory firing (Fig. 3a,b). To test whether mitral cells showed similar behavior, we examined firing in seventeen mitral cells (seven under control conditions and ten in the presence of blockers of synaptic transmission) that were injected with the identical set of six correlated IPSC noise waveforms (_T_0–_T_5). The analysis of synchronization was performed for pairs of mitral cells recorded simultaneously and also at different times.
Figure 3.
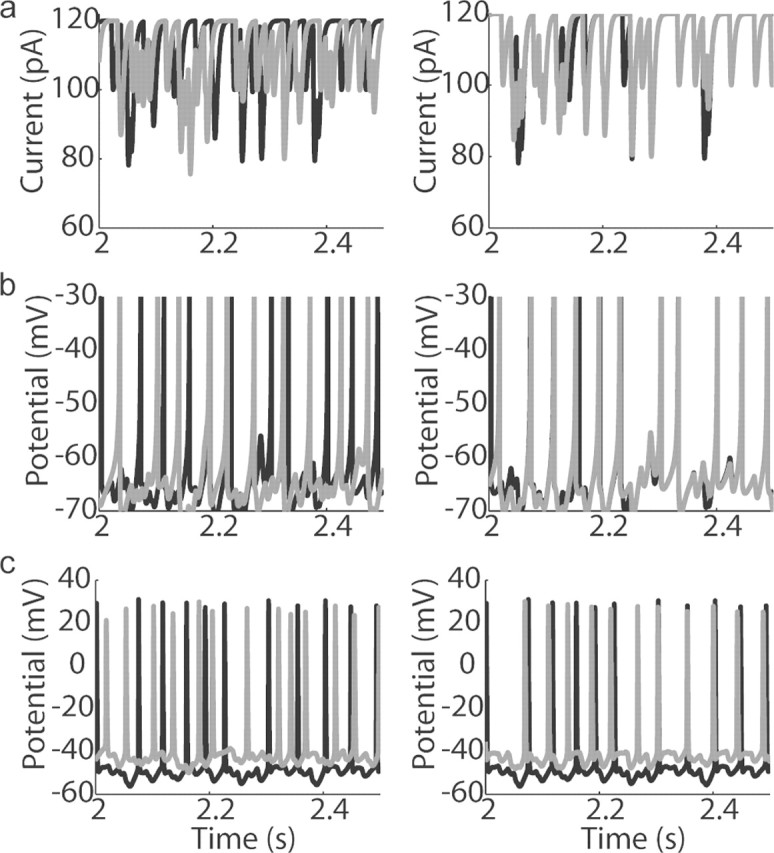
Increase of spike synchrony in response to correlated inputs. a, IPSC noise trains (see Materials and Methods) for two different values of _C_in (left, _C_in = 0.0; right, _C_in = 0.8). b, Numerical simulations of two model cells in response to inputs in a. Spiking in response to uncorrelated inputs appears uncorrelated, whereas spiking in response to correlated inputs is correlated and appears periodic. c, Similar to b, but voltage traces are recorded during injection of gray and black current waveforms into two different mitral cells. Note that uncorrelated inputs (b, c, left) produce spike trains that are roughly periodic but totally uncorrelated. On the contrary, the spikes evoked by highly correlated inputs (b, c, right) occur at similar times and still appear periodic. This shows that the response of a single cell to a similar IPSC spike train can be highly reliable, and that correlated Poisson trains of α functions are sufficient to synchronize spiking across different mitral cells.
Mitral cells were injected with these identical IPSC noise currents added to a steady-state current to elicit spiking between 11 and 35 Hz [average, 22 ± 7 Hz (SD); n = 17] (Fig. 3c). Injecting the same currents into different cells allowed us to compare the recorded spike trains across cells to determine whether populations of mitral cells like the ones recorded would synchronize when receiving input having a specified degree of correlation. Mitral cells injected with IPSC noise showed spiking that was increasingly correlated as _C_in was increased (correlation coefficient, 0.01 for _C_in = 0 vs 0.34 for _C_in = 0.8) (Fig. 3c). Moreover, this correlated spiking appeared to be periodic. To analyze this apparently synchronous oscillatory firing, we computed the cross-correlograms of the filtered voltage traces recorded from each mitral cell generated by the template current (_T_0) with those generated in every other cell by the same inputs (_T_0–_T_5) (Fig. 4a). For _C_in = 0, the cross-correlogram averaged across all pairs was flat, but for _C_in > 0.2 it had a clear central peak, indicating some synchronous events (Fig. 4a). Clear secondary peaks were present for _C_in values >0.4 (Fig. 4a), indicating that the input correlations synchronized the oscillatory firing across mitral cells. This observation was confirmed by computing the cross-spectral density (i.e., the power spectrum of the cross-correlogram), which showed a clear peak overlapping the gamma frequency band. The degree of synchrony (height of the cross-correlogram) and of the synchronous oscillation (peak of cross-spectral density) depended in a linear manner (_r_2 = 0.90) on the degree to which inputs were correlated (_C_in).
Figure 4.

IPSC noise inputs produce synchronized oscillatory firing in mitral cells. a, Average cross-correlograms of mitral cell spike trains computed from data similar to those shown in Figure 3. Cross-correlograms were calculated for spike trains recorded from different cells in which IPSC noise inputs with indicated degrees of correlation were injected. Level of correlation between input currents ranged from completely uncorrelated (_C_in = 0) to completely correlated (_C_in = 1.0) in steps of 0.2. Data were collected from 17 mitral cells, with 66 total pair-wise comparisons made. b, From this same data set, we computed the average cross-power spectrum (power spectrum of the cross-correlogram) of the recorded sweeps elicited by IPSC noise inputs with varying degrees of correlation. These cross-power spectra showed a clear increase with the degree of input correlation in the gamma band, indicating that increased input correlation causes an increase in the tendency of mitral cells to fire in a synchronous oscillatory manner. c, The fraction of the integrated power (from the plots in b, above) in the 15–40 Hz frequency range increases with increasing input correlation, indicating that the increase in output correlation is selective for this frequency band. d–f, Correlated events in the input have no oscillatory patterns but occur randomly in time. d, Red and black traces are responses to IPSC noise trains with _C_in = 0.4. The blue traces show IPSC events common to both black and red input currents. e, Autocorrelograms of traces in d. Black and red autocorrelograms are identical, indicating that both inputs have the same statistical properties. The autocorrelogram of the correlated events (blue) is a scaled version of black and red because of the lower number of events in the blue traces in a. Note that there is no oscillatory pattern in these autocorrelograms. f, Power spectra (red and black) and cross-power spectrum (blue) of the input currents in a. These decrease monotonically without showing a peak, indicating an oscillatory component in either the whole traces (black and red) or in the correlated part (blue).
To confirm that the correlated oscillatory firing was not induced by some unexpected periodic variation of the input, we calculated the average cross-correlogram and cross-power spectra of the injected traces (_T_0–_T_5) (Fig. 4d–f). As expected, the cross-correlogram showed a single central peak that scaled with the value of _C_in (Fig. 4e) and the cross-power spectrum is dominated by low frequencies (Fig. 4f), exactly as the power spectrum of IPSC noise itself (Fig. 2c). Thus, correlated IPSC noise is itself aperiodic and yet it produces correlated firing that is periodic, resulting in synchronized oscillations across mitral cells.
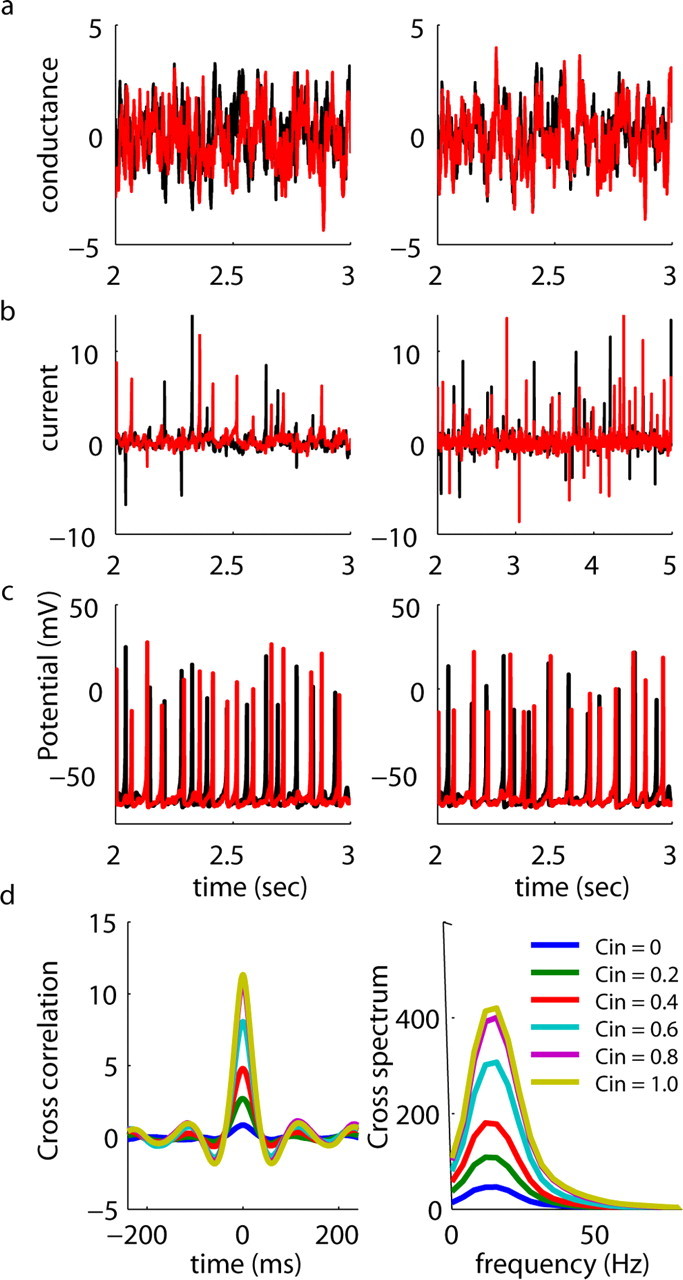
To test whether this phenomenon was influenced by our particular choice of noise input, we performed similar experiments and simulations for cells injected with correlated currents consisting of white noise filtered by α functions (τ = 3 ms) (Fig. 5) and also (in simulations only) for white noise conductance injections (Fig. 6) and EPSP-like Poisson-distributed current injections (data not shown). Because it contains fluctuations in all frequencies, white noise is the most generic kind of input that can be used for these sorts of experiments. We observed that all of these input types resulted in synchronized oscillatory firing. Neurons injected with filtered white noise showed enhanced synchronization as the correlation in the injected noise was increased (Fig. 5a,b). This synchronization was oscillatory, as indicated by the calculation of the cross-correlogram (Fig. 5c) and the cross-power spectrum (Fig. 5d), as in the case of IPSC noise above. Conductance noise injection (_E_rev = −75 mV) also generated synchronized oscillatory firing, consistent with the observation (Szucs et al., 2004) that neurons fire more reliably to conductance injections than to current injections. Thus, these data indicate that the effect that we observe is not caused by some unusual property of the stimuli that we chose, but rather that it is a general property of oscillatory systems receiving correlated fluctuating inputs.
Figure 5.

Filtered white noise inputs produce synchronized oscillatory firing in mitral cells. a, Uncorrelated (left) and partially correlated (right) filtered white noise current injections delivered to mitral cell pairs. b, Spike trains resulting from injection of noise traces shown above. Similar to data from Figure 3 in which cells were injected with IPSC noise, cells fire in a somewhat rhythmic manner and show correlated oscillatory firing when injected with correlated noise. c, Left, Average cross-correlograms of mitral cell spike trains computed from data similar to those shown in b. Cross-correlograms were calculated for spike trains recorded from different cells in which filtered white noise inputs with indicated degrees of correlation were injected. The level of correlation between input currents ranged from completely uncorrelated (_C_in = 0) to completely correlated (_C_in = 1.0) in steps of 0.2. (right). From this same data set, we computed cross-power spectra of the recorded sweeps elicited by IPSC noise inputs with varying degrees of correlation. These cross-power spectra showed a clear increase with the degree of input correlation in the gamma band, indicating that increased input correlation causes an increase in the tendency of mitral cells to fire in a synchronous, oscillatory manner.
Figure 6.
Conductance noise inputs produce synchronized oscillatory firing in simulated mitral cells. a, Weakly (_C_in = 0.1, left) and strongly (_C_in = 0.8, right) correlated filtered white noise conductance (_E_rev = −75 mV) injections delivered to simulated mitral cells. The scale is in arbitrary conductance units. b, Current injected because of the conductance changes shown above. c, Spike trains resulting from injection of noise traces shown above. Similar to data from Figures 3 in which simulated neurons were injected with IPSC noise, cells fire in a somewhat rhythmic manner and show correlated oscillatory firing when injected with correlated conductance noise. d, Left, average cross-correlograms of mitral cell spike trains computed from data similar to those shown in c. Cross-correlograms were calculated for spike trains from different simulated cells in which filtered white noise conductance inputs with indicated degrees of correlation were injected. Level of correlation between input currents ranged from completely uncorrelated (_C_in = 0) to completely correlated (_C_in = 1.0) in steps of 0.2. (right). From this same data set, we computed cross-power spectra of the recorded sweeps elicited by IPSC noise inputs with varying degrees of correlation. These cross-power spectra showed a clear increase with the degree of input correlation in the gamma band, indicating that increased input correlation causes an increase in the tendency of mitral cells to fire in a synchronous oscillatory manner.
Increasing noise amplitude reveals a trade-off between synchronization and oscillation
We next determined how synchrony of mitral cell output was influenced by the amplitude of the correlated input noise. We reasoned that in the limit of low-amplitude noise, the noise-induced fluctuations would be unable to influence firing times and, thus, unable to synchronize the oscillatory firing. In contrast, with high amplitude noise, the timing of most spikes would be determined by the occurrence of large positive fluctuations in the input, which should occur randomly in time. In this condition, correlations in spiking should be maximized, but firing would be nonoscillatory. Thus, there should be a noise amplitude that results in the optimal trade-off between synchronous and oscillatory firing. To perform this analysis, we switched our input currents from IPSC noise to white noise filtered by convolution with an α function (τ = 3 ms) as described above. This change allowed us to vary the amplitude of the input fluctuations by changing a single parameter (the variance of the noise) without changing the spectral properties of the input. In both simulations and in experiments on mitral cells, increasing the SD of the noise input (from 10–60 pA in experiments) resulted in a clear, nonlinear, increase in the correlation coefficient of spike trains generated by correlated (_C_in = 1.0) but not uncorrelated (_C_in = 0) inputs (n = 6 cells) (Fig. 7a). Thus, cells that are highly noise driven synchronize to common fluctuations in the noise. As predicted, higher levels of noise reduced the degree to which neurons fired in a periodic manner, as determined by measuring the coherence in firing of pairs of neurons (Fig. 7b). A similar result was seen using simulated neurons (Fig. 7c). Thus, there is a trade-off between correlation and oscillatory synchronization implying that there is an optimal level of noise for generating synchronized oscillatory firing by this mechanism. The amplitude of the noise required to elicit stochastic synchrony was quite comparable to the levels of voltage fluctuations (2–5 mV) (Fig. 7a,b) observed during periods of strong inhibition recorded in vivo (Margrie et al., 2001).
Figure 7.

Varying noise amplitude results in trade-off between synchrony and periodicity. a, The degree of output correlation increases with the amplitude of the input noise for correlated (_C_in = 1.0, closed circles) but not uncorrelated (_C_in = 0, open circles) filtered white noise inputs. Here, we plot the degree of input noise in terms of the SD of the membrane potential rather than of the input current to compensate for differences in membrane properties across neurons. Simulations (open and closed diamonds) show similar effects of noise amplitude when the magnitude of uncorrelated noise is ∼20% of the magnitude of the correlated noise. b, c, Experimental data (b) and simulations (c) and show the effect of the amplitude of correlated noise on the coherence of spike trains. For smaller noise amplitude (10–30 pA fluctuations) in b, the cross-power spectrum of neuronal output is not altered by the noisy correlated inputs, which shift only the relative timing of their action potentials. Therefore, the cross-power spectrum has a clear peak near the average firing rate of the neurons. In other words, the neurons filter the correlations on their intrinsic time scale. For larger noise amplitudes (40–60 pA in b), the periodicity of the neural firing is reduced and, as a consequence, the coherence peak broadens. Regardless of noise amplitude, the coherence rapidly decreases >40 Hz, which indicates that the neurons only take advantage of the input correlations that have a time scale is similar to or less than their intrinsic firing rate. c, A similar trade-off was seen in simulations. Values of input noise are as described in Materials and Methods.
Time-dependence of stochastic synchrony
Olfactory discrimination in rodents can be accomplished rapidly (Uchida and Mainen, 2003; Abraham et al., 2004) even in the time course of a single sniff (<300 ms). Thus, if the noise-induced synchronization that we have described is to play a role in olfactory coding, then synchronization of spiking needs to occur rapidly after an increase in correlation. Thus, we next investigated, in both simulations and experiments, how rapidly the increase in correlated spiking induced by stochastic synchronization occurs after a step change in the input correlation. To perform this analysis, we first generated a set of IPSC noise input currents of 2 s duration that had a step change in correlation (at t = 1 s), with no change in rate or amplitude of events (Fig. 8a, top). During the first second of the sweep, these ten inputs were completely uncorrelated (_C_in = 0). During the second half of the train, the input currents were identical (_C_in = 1), as can be seen from the average of these ten traces (Fig. 8a, bottom). This set of ten inputs was injected in an interleaved manner into eight real mitral cells and the oscillatory synchronization of the action potentials of these cells was calculated (Fig. 8b,c, black traces). In parallel, these same current traces were used as the inputs to a network of 10 simulated mitral cells (Fig. 8b,c, red traces). During the first second of the sweep, the real and simulated mitral cells fired in an oscillatory, but uncorrelated manner and, thus, the power spectrum of the estimated field potential generated by averaging the response to the 10 traces in any one cell was roughly flat (Fig. 8c, left). In contrast, during the second half of the trace (when the inputs were perfectly correlated), the power spectrum of the estimated field potential showed a large peak (average increase in peak amplitude of power spectrum for experimental data, 725 ± 85%) (Fig. 8c, right). To determine how rapidly the response of the mitral cell synchronized after this change in input correlation, we examined the magnitude of the fluctuations of the estimated LFP (i.e., the filtered averaged membrane potential) (Fig. 8b, bottom) for the population of cells to which we delivered these input currents. The LFP during the first second, when input currents were uncorrelated, showed little time-dependent fluctuation and no evidence of oscillation, indicating that the spike times across the different cells were uncorrelated. During the second half of the trace, when inputs were correlated, the estimated LFP showed large fluctuations that began within the first 50 ms after the increase in correlation, indicating that this mechanism can induce rapid synchronization.
Figure 8.
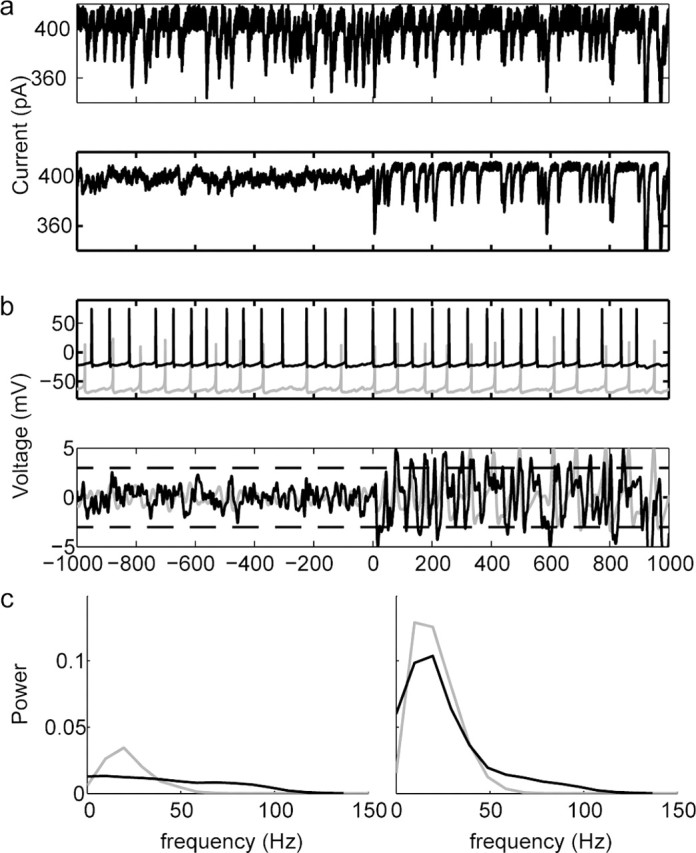
Stochastic synchronization occurs rapidly in response to a step change in input correlation. a, Top, Example single trace (of 10 similar traces) showing IPSC noise that was injected into a mitral cell. The rate and amplitude of the simulated IPSCs are constant across the two second traces. Bottom, Average across all 10 IPSC noise traces injected into mitral cells. Because of the step change in correlation across traces at t = 0, the average trace goes from nearly flat before t = 0 to having large fluctuations after t = 0. b, Top, Two example spike trains (one from a mitral cell and one from simulation) evoked by the inputs shown above in a. Firing pattern and rate are not obviously different for times before and after t = 0. Bottom, Estimated LFP calculated from all 10 cells injected with the IPSC noise having time-varying correlation shown above (black) and from a simulation of 10 neurons receiving the same inputs as were injected into the mitral cells. The amplitude of the estimated LFP increases rapidly after the step change in correlation. c, The average power spectra of the estimated LFPs of the mitral cell voltages (black) and from the simulated neurons (gray) recorded during the uncorrelated (left) or correlated (right) IPSC noise inputs show that the real and simulated mitral cells show strong oscillations after, but not before, the increase in input correlation.
Effect of input spectra on oscillatory synchronization
We next used simulations to test how this noise-induced oscillatory synchronization depends on the characteristics of the injected current. In particular, we asked how oscillatory synchronization varied as high-frequency components of the noise were eliminated. This was done both for IPSC noise and for filtered white noise by convolving the original signal (Poisson train or white noise) with α functions of different time constants while preserving the integrated power of the noise input. Based on previous work, we predicted that the synchronization of neurons at high frequencies would be reduced as fast fluctuations were eliminated (Chow et al., 1998; Prinz et al., 2003). Eliminating these fast fluctuations is the equivalent of changing the time constant of inhibition and, thus, we would predict that synchronization of gamma-like oscillations will become more difficult as the time constant of the α function is increased. Indeed, the degree of oscillatory synchronization (as determined by computing the power spectrum of the estimated local field potential) with either IPSC noise or filtered white noise inputs peaked when the α function has a time to peak of ∼20 ms (Fig. 9a,b). Moreover, increasing the time-to-peak of the α function also decreased the peak frequency of the oscillation, indicating that fast fluctuations are needed for fast synchronization.
Figure 9.
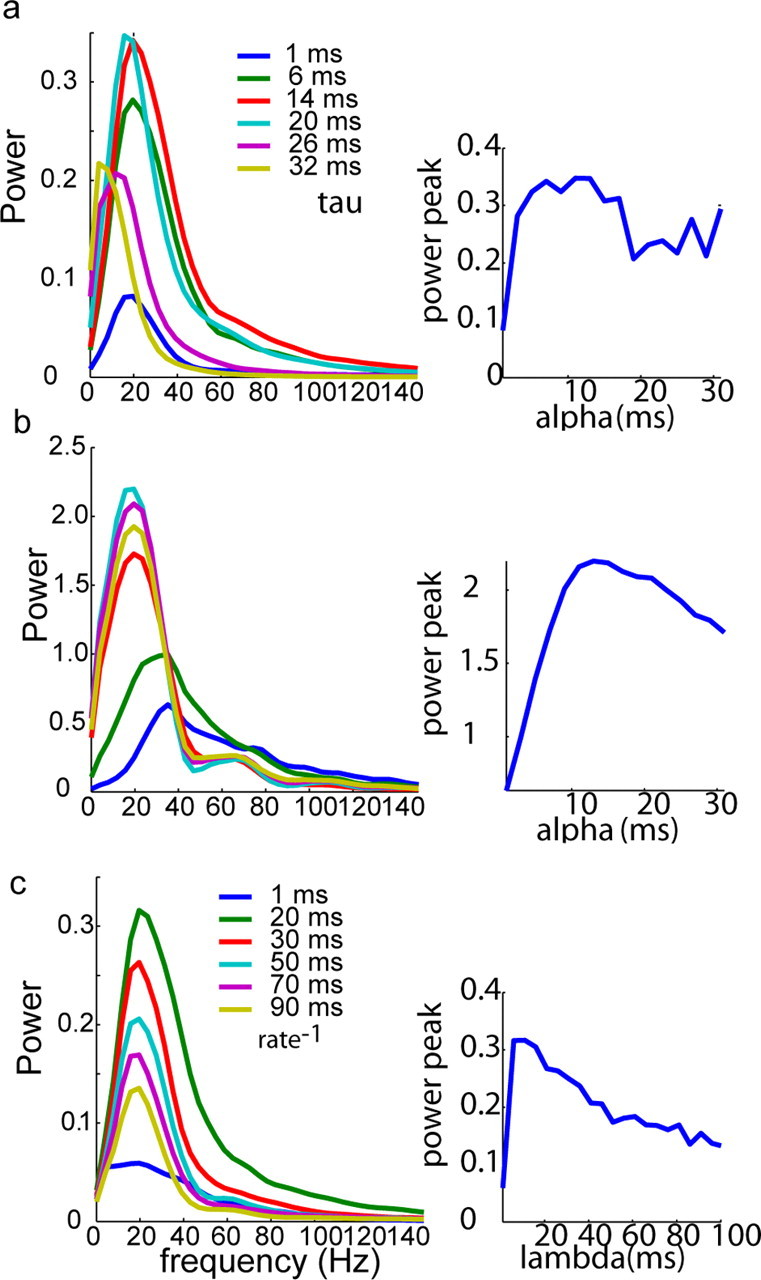
Dependence of oscillatory synchrony on spectral properties of the inputs. a, Left, Degree of synchronous oscillations as measured by the averaged cross-power spectrum (power spectrum of the cross-correlogram) is shown for simulated mitral cells (similar to Fig. 6c) when given IPSC noise consisting of α functions having τs ranging from 1 to 32 ms. Right, Plot of the peak of the cross-power spectra shown on the left of this figure versus the τ of the α function. The maximal cross-power spectrum peak was observed for α functions having times to peak ∼12 ms. Slower α functions (higher τs) reduced the peak and lowered the peak frequency. b, Similar to a except, instead of IPSC noise, the same effect was observed when white noise convolved with an α function with the indicated τ used as stimulus. c, Similar to a except the expected waiting time (average rate−1) of the Poisson process is varied for a fixed τ (2.5 ms). The peak is seen when there are, on average, several events per cycle. Altering the Poisson rate did not alter the peak frequency of the synchronized oscillations.
We also hypothesized that for input fluctuations to produce synchronization, common fluctuations must occur at a rate similar to or greater than the frequency of the oscillation. Thus, we used simulations to test how changing the Poisson rate of IPSC noise inputs influenced oscillatory synchronization, while again preserving the integrated power of the noisy input current. We observed that the degree of oscillatory synchronization (as determined by computing the power spectrum of the estimated local field potential) is maximal when the average interevent interval of the Poisson train is ∼20 ms (Fig. 9c). Changing the interval had no effect on the frequency of the oscillation, in agreement with phase oscillator models of mitral cells (Galán et al., 2005). Thus, these results indicate that the noise-induced synchronization that we describe is strongest when correlated fluctuations occur on a time scale that is similar to the frequency of the oscillations.
Discussion
Summary
Here, we show that lateral inhibition has slow average kinetics that are incompatible with generating fast oscillations in the olfactory bulb and we describe a new mechanism (stochastic synchrony) for generating synchronous oscillations in brain networks based on correlated but aperiodic fluctuations in their input. Using both experimental and computational approaches, we show that the key requirements for this mechanism are that (1) neurons receive partially correlated fast (relative to the period of the oscillation) inputs and (2) that neurons fire at a roughly constant rate. We demonstrate that this mechanism can cause synchronous firing of olfactory bulb mitral cells recorded in vitro, and we propose that this mechanism may resolve the apparent paradox of how lateral inhibition (which has, on average, a slow decay time) can lead to the synchronization of fast gamma oscillations in olfactory bulb mitral cells.
Can stochastic synchrony explain olfactory bulb gamma oscillations?
Gamma oscillations are a prominent feature of olfactory bulb activity in vivo (Adrian, 1942; Kay and Laurent, 1999; Neville and Haberly, 2003) and are generated by intrinsic bulbar circuitry (Friedman and Strowbridge, 2003; Lagier et al., 2004). However, the current view (Mori et al., 1981b; Kay, 2003; Neville and Haberly, 2003) that generation of these oscillations is caused by recurrent and lateral inhibition is incompatible with the properties of these phenomena (Isaacson and Strowbridge, 1998; Schoppa et al., 1998; Margrie and Schaefer, 2003). Noise-induced oscillatory synchrony provides an explanation of why persistent excitation and fluctuating inhibition are required for gamma oscillations and this explanation is compatible with the known physiological properties and anatomical bases of these phenomena (Friedman and Strowbridge, 2003; Lagier et al., 2004). We have demonstrated stochastic synchrony in mitral cells by delivering artificial inputs consisting of partially correlated signals of a variety of forms. Although the average frequency of our synchronous oscillations (∼22 Hz) is closer to the typical β frequency (∼10–20 Hz) than the typical frequency for gamma oscillations (∼30–80 Hz), β oscillations may require cortical feedback not present in our experiments, which gamma frequency oscillations do not (Friedman and Strowbridge, 2003; Neville and Haberly, 2003; Lagier et al., 2004). Moreover, the mechanism that we described should apply across a wide range of frequencies, provided that the requirements (discussed below) are met. This leads to the question of whether the IPSCs received by mitral cells in vivo are likely to elicit such correlation-induced synchrony? IPSC noise synchronizes mitral cell firing when events occur across a range of input frequencies (Fig. 9) and when the individual IPSCs are as small as 10 pA. These are similar to the properties of individual IPSCs recorded in mitral cells (Isaacson and Strowbridge, 1998; Desmaisons et al., 1999; Schoppa, 2006). Moreover, because granule cells make highly divergent projections onto mitral cells, a spike in a single granule cell will evoke correlated inhibition in hundreds of nearby mitral cells. Thus, active granule cells may lead to strong synchronous input to nearby mitral cells. Estimating the expected degree of correlation is difficult, but synchronous events occurring at a rate of 10 Hz, as required by our mechanism, are compatible with in vivo recordings (Margrie et al., 2001; Margrie and Schaefer, 2003).
The IPSC noise we injected is itself insensitive to actual granule cell-mediated inhibition in that real inhibition is tied to the output across many mitral cells. Thus, correlations in mitral cell output that are generated through stochastic synchrony will cause additional granule-cell firing which will in turn provide additional correlated input to the mitral cells. In this way, the correlation received by mitral cells will be a dynamic variable, the value of which will be evolving as a function of mitral and granule cell activity. Our experiments and simulations, which do not have such feedback, are a simplification of this phenomenon, which we are actively investigating.
Relation to other mechanisms of synchronization
Synchronous oscillations in brain networks are generally thought to be generated by periodic input or by intrinsic network dynamics (Buzsaki and Draguhn, 2004). In contrast, in stochastic synchrony, firing of individual neurons that is roughly oscillatory is synchronized by the influence of partially correlated but aperiodic transient inputs; neither synaptic coupling nor oscillatory input is required. Stochastic synchrony works for many input types, including low-pass filtered white noise inputs, suggesting that any kind of common fluctuation can drive cells to synchronize. Thus, stochastic synchrony may provide an answer to the question of how brain neuronal networks generate widespread synchronous population activity, when the behavior of any single neuron (and thus, any single input) is often well described as an aperiodic Poisson train (Buzsaki and Draguhn, 2004).
Several other examples of noise-induced synchrony have been reported in the theoretical and experimental literature, but this is the first experimental evidence for oscillatory synchronization of neurons based on such a mechanism in the absence of oscillatory input. In theoretical work, noise-induced synchronization similar to what we describe has been observed in response to white noise inputs or to Poisson trains (Teramae and Tanaka, 2004; Nakao et al., 2005). In experimental systems, stochastic resonance has been used to explain the noise-dependent entrainment of neuronal firing to a subthreshold oscillatory input in a variety of systems (Wiesenfeld and Moss, 1995), including crayfish mechanoreceptors (Douglass et al., 1993; Moss and Pei, 1995). Similarly, in simulations of uncoupled Hodgkin–Huxley-type neurons, noise can cause synchronization, provided that neurons also receive a common subthreshold oscillatory signal (Wang et al., 2004). However, in our case, mitral cells receive no periodic input. Noisy inputs to weakly coupled neural networks have been shown to generate synchronous oscillations (Pikovsky, 1992) and this phenomenon has been argued to explain synchronization of neurons in the electrosensory organ of weakly electric fish (Doiron et al., 2004). In this system, correlated noise from multiple sources causes synchronous oscillations of pyramidal neurons in vivo. In contrast, stochastic synchrony does not require coupling of any kind. Finally, stochastic synchrony differs from, but is related to noise-induced reliable firing (Bryant and Segundo, 1976; Mainen and Sejnowski, 1995). In stochastic synchrony, firing need not and, in fact, must not be driven reliably by the noise, because if noise drives firing then the firing will be aperiodic rather than oscillatory. That is, very high-amplitude noise will result in perfectly correlated firing, but the cross-spectral density, our measure of oscillatory synchronization, will be flat. Moreover, our description of stochastic synchrony emphasizes similar spiking patterns across different neurons that receive similar, but nonidentical inputs. In contrast, reliability is measured across trials in which the same neuron receives identical inputs. Our results can be interpreted as indicating that reliability of firing is robust to differences in the noise and in the properties of the neurons. Stochastic synchrony is similar to synchronization of integrate-and-fire neurons activated by balanced excitatory and inhibitory synaptic conductances when the spike trains of individual neurons have low coefficients of variation (Stroeve and Gielen, 2001).
Synchronization outside the olfactory system
Here, we consider stochastic synchrony as a mechanism for generating oscillations in the olfactory bulb. However, its general requirements suggest that it might be a more general mechanism for generating synchronization. Stochastic synchrony requires that neurons receive partially correlated input, either excitatory or inhibitory. This is likely to be a common feature of brain areas in which there is dense local connectivity or a strong topographic input.
A second key requirement of stochastic synchrony is that different neurons fire at approximately the same rate and that this firing be roughly oscillatory. This is required because the average firing rate of individual neurons is not modified by changing the degree of correlation across the inputs and, thus, neurons cannot equalize their firing rates in response to changes in correlation. This similarity of firing rates in the network can be achieved either if all of the neurons receive similar levels of input, or if the firing rates of the neurons are relatively insensitive to changes in input current. Interestingly, in vivo recordings from mouse olfactory bulbs have shown that mitral cell frequency versus current (FI) curves are rather flat, maintaining firing rates of ∼40 Hz for a wide range of steady-state input currents (Margrie and Schaefer, 2003). Moreover, mitral cells (Galán et al., 2005) show class II membrane excitability. This kind of excitability is associated with relatively flat, logarithmic FI curves (Tateno et al., 2004). Finally, stochastic synchrony requires that neurons fire repeatedly for periods of at least several times the duration of the oscillation frequency. Cortical up states, which can last for seconds, would certainly provide a sufficiently long period of elevated firing and may be periods in which correlated inputs to multiple firing cells would be expected (Hasenstaub et al., 2005). Thus, we would predict that stochastic synchrony may play a role in synchronizing cortical neurons during up states, consistent with recent reports (Hasenstaub et al., 2005).
Footnotes
*R.F.G. and N.F.-T. contributed equally to this work.
N. Fourcaud-Trocmé's present address: Neurosciences et Systèmes Sensoriels, Centre National de la Recherche Scientifique Unité Mixte de Recherche 5020, Université Claude Bernard Lyon 1, 50 avenue Tony Garnier, 69366 Lyon Cedex 07, France.
This work was supported by National Institute on Deafness and Other Communication Disorders Grant DC005798 and National Science Foundation Grant MS0513500.
References
- Abraham NM, Spors H, Carleton A, Margrie TW, Kuner T, Schaefer AT (2004). Maintaining accuracy at the expense of speed: stimulus similarity defines odor discrimination time in mice. Neuron 44:865–876. [DOI] [PubMed] [Google Scholar]
- Adrian ED (1942). Olfactory reactions in the brain of the hedgehog. J Physiol (Lond) 100:459–473. [DOI] [PMC free article] [PubMed] [Google Scholar]
- Balu R, Larimer P, Strowbridge BW (2004). Phasic stimuli evoke precisely timed spikes in intermittently discharging mitral cells. J Neurophysiol 92:743–753. [DOI] [PubMed] [Google Scholar]
- Bressler SL, Freeman WJ (1980). Frequency analysis of olfactory system EEG in cat, rabbit, and rat. Electroencephalogr Clin Neurophysiol 50:19–24. [DOI] [PubMed] [Google Scholar]
- Bryant HL, Segundo JP (1976). Spike initiation by transmembrane current: a white-noise analysis. J Physiol (Lond) 260:279–314. [DOI] [PMC free article] [PubMed] [Google Scholar]
- Buzsaki G, Draguhn A (2004). Neuronal oscillations in cortical networks. Science 304:1926–1929. [DOI] [PubMed] [Google Scholar]
- Chow CC, White JA, Ritt J, Kopell N (1998). Frequency control in synchronized networks of inhibitory neurons. J Comput Neurosci 5:407–420. [DOI] [PubMed] [Google Scholar]
- Desmaisons D, Vincent JD, Lledo PM (1999). Control of action potential timing by intrinsic subthreshold oscillations in olfactory bulb output neurons. J Neurosci 19:10727–10737. [DOI] [PMC free article] [PubMed] [Google Scholar]
- Doiron B, Lindner B, Longtin A, Maler L, Bastian J (2004). Oscillatory activity in electrosensory neurons increases with the spatial correlation of the stochastic input stimulus. Phys Rev Lett 93:048101. [DOI] [PubMed] [Google Scholar]
- Douglass JK, Wilkens L, Pantazelou E, Moss F (1993). Noise enhancement of information transfer in crayfish mechanoreceptors by stochastic resonance. Nature 365:337–340. [DOI] [PubMed] [Google Scholar]
- Friedman D, Strowbridge BW (2003). Both electrical and chemical synapses mediate fast network oscillations in the olfactory bulb. J Neurophysiol 89:2601–2610. [DOI] [PubMed] [Google Scholar]
- Galán RF, Ermentrout GB, Urban NN (2005). Efficient estimation of phase-resetting curves in real neurons and its significance for neural-network modeling. Phys Rev Lett 94:158101. [DOI] [PMC free article] [PubMed] [Google Scholar]
- Hasenstaub A, Shu Y, Haider B, Kraushaar U, Duque A, McCormick DA (2005). Inhibitory postsynaptic potentials carry synchronized frequency information in active cortical networks. Neuron 47:423–435. [DOI] [PubMed] [Google Scholar]
- Isaacson JS, Strowbridge BW (1998). Olfactory reciprocal synapses: dendritic signaling in the CNS. Neuron 20:749–761. [DOI] [PubMed] [Google Scholar]
- Izhikevich EM (2004). Which model to use for cortical spiking neurons? IEEE Trans Neural Netw 15:1063–1070. [DOI] [PubMed] [Google Scholar]
- Kay LM (2003). Two species of gamma oscillations in the olfactory bulb: dependence on behavioral state and synaptic interactions. J Integr Neurosci 2:31–44. [DOI] [PubMed] [Google Scholar]
- Kay LM, Laurent G (1999). Odor- and context-dependent modulation of mitral cell activity in behaving rats. Nat Neurosci 2:1003–1009. [DOI] [PubMed] [Google Scholar]
- Lagier S, Carleton A, Lledo PM (2004). Interplay between local GABAergic interneurons and relay neurons generates gamma oscillations in the rat olfactory bulb. J Neurosci 24:4382–4392. [DOI] [PMC free article] [PubMed] [Google Scholar]
- Mainen ZF, Sejnowski TJ (1995). Reliability of spike timing in neocortical neurons. Science 268:1503–1506. [DOI] [PubMed] [Google Scholar]
- Margrie TW, Schaefer AT (2003). Theta oscillation coupled spike latencies yield computational vigour in a mammalian sensory system. J Physiol (Lond) 546:363–374. [DOI] [PMC free article] [PubMed] [Google Scholar]
- Margrie TW, Sakmann B, Urban NN (2001). Action potential propagation in mitral cell lateral dendrites is decremental and controls recurrent and lateral inhibition in the mammalian olfactory bulb. Proc Natl Acad Sci USA 98:319–324. [DOI] [PMC free article] [PubMed] [Google Scholar]
- Mori K, Takagi SF (1978). An intracellular study of dendrodendritic inhibitory synapses on mitral cells in the rabbit olfactory bulb. J Physiol (Lond) 279:569–588. [DOI] [PMC free article] [PubMed] [Google Scholar]
- Mori K, Nowycky MC, Shepherd GM (1981a). Electrophysiological analysis of mitral cells in the isolated turtle olfactory bulb. J Physiol (Lond) 314:281–294. [DOI] [PMC free article] [PubMed] [Google Scholar]
- Mori K, Nowycky MC, Shepherd GM (1981b). Analysis of a long-duration inhibitory potential in mitral cells in the isolated turtle olfactory bulb. J Physiol (Lond) 314:311–320. [DOI] [PMC free article] [PubMed] [Google Scholar]
- Moss F, Pei X (1995). Stochastic resonance. Neurons in parallel. Nature 376:211–212. [DOI] [PubMed] [Google Scholar]
- Nakao H, Arai K-S, Nagai K, Tsubo Y, Kuramoto Y (2005). Synchrony of limit-cycle oscillators induced by random external impulses. Phys Rev E Stat Nonlin Soft Matter Phys 72:026220. [DOI] [PubMed] [Google Scholar]
- Neville KR, Haberly LB (2003). Beta and gamma oscillations in the olfactory system of the urethane-anesthetized rat. J Neurophysiol 90:3921–3930. [DOI] [PubMed] [Google Scholar]
- Nusser Z, Kay LM, Laurent G, Homanics GE, Mody I (2001). Disruption of GABAA receptors on GABAergic interneurons leads to increased oscillatory power in the olfactory bulb network. J Neurophysiol 86:2823–2833. [DOI] [PubMed] [Google Scholar]
- Pikovsky A (1992). Statistics of trajectory separation in noisy dynamical systems. Phys Lett A 165:33–36. [Google Scholar]
- Powell KR, Koppelman LF, Holtzman SG (1999). Differential involvement of dopamine in mediating the discriminative stimulus effects of low and high doses of caffeine in rats. Behav Pharmacol 10:707–716. [DOI] [PubMed] [Google Scholar]
- Prinz AA, Thirumalai V, Marder E (2003). The functional consequences of changes in the strength and duration of synaptic inputs to oscillatory neurons. J Neurosci 23:943–954. [DOI] [PMC free article] [PubMed] [Google Scholar]
- Ravel N, Chabaud P, Martin C, Gaveau V, Hugues E, Tallon-Baudry C, Bertrand O, Gervais R (2003). Olfactory learning modifies the expression of odour-induced oscillatory responses in the gamma (60–90 Hz) and beta (15–40 Hz) bands in the rat olfactory bulb. Eur J Neurosci 17:350–358. [DOI] [PubMed] [Google Scholar]
- Reyes AD (2003). Synchrony-dependent propagation of firing rate in iteratively constructed networks in vitro. Nat Neurosci 6:593–599. [DOI] [PubMed] [Google Scholar]
- Rinzel J, Ermentrout B (1989). Analysis of neural excitability and oscillations. In: Methods in neuronal modeling: from synapses to networks (Koch C, Segev I, eds) pp. 135–169. Cambridge, MA: MIT.
- Schoppa NE (2006). Synchronization of olfactory bulb mitral cells by precisely timed inhibitory inputs. Neuron 49:271–283. [DOI] [PubMed] [Google Scholar]
- Schoppa NE, Urban NN (2003). Dendritic processing within olfactory bulb circuits. Trends Neurosci 26:501–506. [DOI] [PubMed] [Google Scholar]
- Schoppa NE, Kinzie JM, Sahara Y, Segerson TP, Westbrook GL (1998). Dendrodendritic inhibition in the olfactory bulb is driven by NMDA receptors. J Neurosci 18:6790–6802. [DOI] [PMC free article] [PubMed] [Google Scholar]
- Segev I (1999). Taming time in the olfactory bulb. Nat Neurosci 2:1041–1043. [DOI] [PubMed] [Google Scholar]
- Springer M, Paulsson J (2006). Biological physics: harmonies from noise. Nature 439:27–28. [DOI] [PubMed] [Google Scholar]
- Stroeve S, Gielen S (2001). Correlation between uncoupled conductance-based integrate-and-fire neurons due to common and synchronous presynaptic firing. Neural Comput 13:2005–2029. [DOI] [PubMed] [Google Scholar]
- Stuart G, Spruston N (1995). Probing dendritic function with patch pipettes. Curr Opin Neurobiol 5:389–394. [DOI] [PubMed] [Google Scholar]
- Szucs A, Vehovszky A, Molnar G, Pinto RD, Abarbanel HD (2004). Reliability and precision of neural spike timing: simulation of spectrally broadband synaptic inputs. Neuroscience 126:1063–1073. [DOI] [PubMed] [Google Scholar]
- Tateno T, Harsch A, Robinson HP (2004). Threshold firing frequency-current relationships of neurons in rat somatosensory cortex: type 1 and type 2 dynamics. J Neurophysiol 92:2283–2294. [DOI] [PubMed] [Google Scholar]
- Teramae JN, Tanaka D (2004). Robustness of the noise-induced phase synchronization in a general class of limit cycle oscillators. Phys Rev Lett 93:204103. [DOI] [PubMed] [Google Scholar]
- Uchida N, Mainen ZF (2003). Speed and accuracy of olfactory discrimination in the rat. Nat Neurosci 6:1224–1229. [DOI] [PubMed] [Google Scholar]
- Urban NN, Sakmann B (2002). Reciprocal intraglomerular excitation and intra- and interglomerular lateral inhibition between mouse olfactory bulb mitral cells. J Physiol (Lond) 542:355–367. [DOI] [PMC free article] [PubMed] [Google Scholar]
- Wang S, Liu F, Wang W, Yu Y (2004). Impact of spatially correlated noise on neuronal firing. Phys Rev E Stat Nonlin Soft Matter Phys 69:011909. [DOI] [PubMed] [Google Scholar]
- Wiesenfeld K, Moss F (1995). Stochastic resonance and the benefits of noise: from ice ages to crayfish and SQUIDs. Nature 373:33–36. [DOI] [PubMed] [Google Scholar]