Dynamics of Hippocampal and Cortical Activation during Consolidation of a Nonspatial Memory (original) (raw)
Abstract
Observations of temporally graded retrograde amnesia after hippocampal damage suggest that the hippocampal region plays a critical, time-limited role in memory consolidation. However, these observations do not indicate where permanent memory is stored, nor do they clarify whether the hippocampus normally remains involved in a nonessential way. Evidence from multiple neural imaging studies indicate the time-limited role of the hippocampus and suggest that the anterior cingulate cortex is a critical storage site of different types of long-term memory. However, each of the previous studies examined spatial memory, leaving open the question of whether different cortical areas support long-term memory for other types of material. We characterized the course of involvement of cortical and hippocampal areas in animals trained in an explicitly nonspatial task. First, we confirmed previous findings that hippocampal damage produces temporally graded retrograde amnesia for the social transmission of a food preference (STFP) within our experimental protocol. Damage to the hippocampal region 1 d, but not 21 d, after training impaired subsequent recall of STFP. Then, we characterized the anatomical patterns of activation of the immediate early gene c-fos during retrieval of STFP immediately and 1, 2, and 21 d after training. The ventral subiculum was activated during retrieval shortly after learning, but the level of activation declined at successive times. In contrast, olfactory recipient regions including piriform, entorhinal, and orbitofrontal cortex showed the opposite pattern, increasingly greater activation in successively later retrieval tests. These findings support the view that different cortical networks support long-term memory for different types of information.
Keywords: memory, hippocampus, piriform, orbitofrontal, retrograde amnesia, consolidation
Introduction
The observation of temporally graded retrograde amnesia after damage to the medial temporal lobe suggests that structures in that area support a process of consolidation of memories that are eventually stored elsewhere in the brain (for review, see Milner et al., 1998). However, neuropsychological analyses of retrograde amnesia after focal brain damage do not indicate which other brain areas are the sites of permanent memory storage, nor do they indicate whether the hippocampus normally remains involved, albeit in a nonessential way. One way to address these issues is by comparing neural activation in different brain areas during retrieval tests given over the course of the consolidation period. These studies compared neural activation in several brain areas simultaneously by measuring glucose consumption or expression of the early immediate genes c-fos and zif268. In rats, prefrontal, anterior cingulate, and retrosplenial cortical areas become increasingly activated during retrieval tests during the course of a few weeks after training in a radial maze task, whereas hippocampal and entorhinal areas show declining activation over the same period (Bontempi et al., 1999; Maviel et al., 2004). Similarly, Frankland et al. (2004) reported increases in activation of the anterior cingulate, infralimbic, prelimbic, and temporal cortices and decreases in CA1 activation during expression of contextual fear memory over 5 weeks. These results suggest that cortical areas become increasingly involved in retrieval of memories, whereas involvement of the hippocampal region decreases over time. Some have suggested that the anterior cingulate may be a particularly important site for permanent memory storage. However, each of the tasks used in these studies relies on memory for spatial information, leaving open the question of whether the anterior cingulate or other particular cortical areas are consistently among the critical sites for permanent memory storage or whether different areas are storage sites for divergent types of memory.
To determine the generality of cortical areas involved in long-term memory storage, we examined Fos expression during stages of retrieval of a nonspatial form of hippocampal-dependent memory, the social transmission of food preference (STFP). In STFP, a subject rat is exposed to a demonstrator rat that has recently eaten a scented food. Subsequently, the subject demonstrates its memory for the odor through a preference for the same scented food (Galef et al., 1985). This form of learning is independent of spatial information (Alvarez et al., 2002). Damage to the hippocampus after training results in a temporally graded retrograde amnesia (Winocur, 1990; Winocur et al., 2001; Clark et al., 2002), making this an ideal task to study consolidation of a nonspatial memory. Experiment 1 confirmed the phenomenon of temporally graded retrograde amnesia in our STFP protocol after selective lesions of the hippocampus. Experiment 2 examined the anatomical patterns of Fos activation during retrieval of STFP immediately (IMM) and 1, 2, and 21 d after training in the hippocampus and various cortical regions.
Materials and Methods
Experiment 1
Subjects.
Forty Long–Evans male rats (Harlan Sprague Dawley, Indianapolis, IN) weighing 250–275 g at the beginning of the study served as subjects. Twelve additional Long–Evans male rats weighing 225–250 g at the beginning of the study served as demonstrator rats. All animals underwent extensive handling for ∼5 min daily over at least 2 weeks before training and testing commenced.
Social transmission of food preference task.
Animals were handled for 2 weeks, habituated to the testing room, and trained to eat powdered rat chow (Purina rat chow 5001; Purina Mills, St. Louis, MO) out of metal cups (4.5 cm height, 7.5 cm diameter, 3 cm opening; Lab Products, Seaford, DE). After handling and habituation, animals were food deprived the day before training by allowing access to four food pellets in the previous 24 h. On the training day, all animals were allowed to habituate to the test room for 10 min. One rat, the demonstrator, was then given a food cup filled with odorant-scented chow for 30 min with access to water. After the 30 min feeding period, the demonstrator was taken out of its cage and placed in the home cage of the subject rat that was not previously exposed to odorant-scented chow. The demonstrator and subject were allowed to interact for 20 min without any barrier between them. Each subject was exposed to three different demonstrators at 1 h intervals.
Before testing on STFP, animals were food deprived on the previous day by allowing access to only four pellets of food. Subjects were tested immediately (probe test) and 30 d after the training procedure by placing two preweighed food cups filled with odorized chow in their home cage. One of the cups was filled with chow that was given to the demonstrator rats, whereas the second cup was filled with a different scented chow. Cup placement was counterbalanced to eliminate any left-right response bias. Subjects were given 45 min to eat from the two cups, after which the cups were weighed to determine the amount of food eaten. The trained food and comparison food were counterbalanced between thyme (1%) and basil (0.7%). The mean percentage preference score for the trained odor was calculated as follows: (weight of trained food eaten/weight of all food eaten) × 100.
Experimental design.
Animals were randomly assigned to four different groups (n = 10). One group received radiofrequency (RF) hippocampal lesions 1 d after training on the STFP task (1 DAY hippocampus). A second group received RF hippocampal lesions 21 d after training (21 DAY hippocampus). The final two groups served as sham surgery controls with one group undergoing the sham procedure 1 d after training (1 DAY sham) and the second undergoing the sham surgery 21 d after training (21 DAY sham). Animals underwent a probe STFP test immediately after training to ensure acquisition of the task before the lesion was performed. One subject was eliminated from the 21 DAY hippocampal group because of an unrelated illness. One subject in the 1 DAY sham and one subject in the 21 DAY sham group were eliminated, because they failed to show STFP during the initial probe test.
Hippocampal lesion.
Bilateral lesions of the dorsal and ventral hippocampus, including CA1, CA3, dentate gyrus and the subiculum, were created with RF current as described below. Recent studies have shown that RF lesions result in a less severe deficit than fiber-sparing neurotoxic lesions, possibly because neurotoxins can leak to other regions in the brain (Fortin et al., 2002; Agster et al., 2002). Importantly, RF lesions also allow for direct control over the timing of damage to the hippocampus.
Subjects were anesthetized with isoflurane (1.5%) and oxygen throughout the surgery and received periodic subcutaneous injections of lactated ringers to prevent dehydration. The rat’s head was shaved and placed in a stereotaxic instrument (Kopf Instruments, Tujunga, CA). The skull was exposed by a midline incision and leveled. A section of the skull was removed bilaterally, and a 100 μm nichrome-wire electrode (0.4–0.7 mm uninsulated tip) was lowered at 10 different anteroposterior (AP) and mediolateral (ML) locations in each hemisphere. At three of the AP and ML coordinates, two hippocampal regions were damaged using different dorsoventral (DV) coordinates (Paxinos and Watson, 1998) (Table 1). Before each lesion, the electrode was allowed to settle for 30 s, and then 8–11 mA RF current (Radionics RFG-4A, Burlington, MA) was applied to each location for 1 min. After each lesion, the electrode remained in place for 1 min and then was raised. In each hemisphere of the sham-operated controls, the electrode was lowered to DV −1.6 for each of the 10 different AP and ML coordinates used in the lesion animals. The electrode was left in place for 2.5 min without passing any RF current. The skin was sutured, and a topical antibiotic was administered to prevent infection. Animals were allowed to recover for at least 9 d before being tested on the STFP task.
Table 1.
Coordinates and RF current used to make hippocampal lesions
| Anteroposterior | Mediolateral | Dorsoventral | Radiofrequency current (mA) |
|---|---|---|---|
| −2.2 | ±1.0 | −3.5 | 8 |
| −3.2 | ±1.4 | −3.3 | 8 |
| ±3.0 | −3.3 | 8 | |
| −4.0 | ±2.5 | −3.3 | 8 |
| ±3.7 | −3.3 | 8 | |
| −4.8 | ±4.9 | −6.6 | 9 |
| −5.4 | 8 | ||
| ±4.3 | −6.9 | 9 | |
| −3.5 | 9 | ||
| −5.4 | ±2.8 | −3.6 | 10 |
| ±5.0 | −5.6 | 9 | |
| −5.5 | 11 | ||
| −6.3 | ±4.6 | −6.4 | 10 |
Histology.
Animals were anesthetized using an overdose (100 mg/kg) of sodium pentobarbital and perfused transcardially with 0.9% saline followed by 350 ml of 4% paraformaldehyde in 0.1 m PBS. Brains were removed and postfixed in 4% paraformaldehyde for 1 h before being placed in 30% sucrose/PBS at 4°C until they sank. Coronal 50 μm slices of the hippocampus were cut on a freezing, sliding microtome and stained with 0.25% thionin for lesion size analysis.
Statistical analysis.
The percentage of trained food eaten and the total amount of food eaten during retrieval was analyzed using 2 × 2 ANOVAs designed to compare measures at 1 DAY or 21 DAY tests for lesion and sham conditions. One-sample t tests were conducted to determine whether the distribution of foods eaten differed from chance.
Lesion size was calculated by reconstructing the lesion in four different hippocampal sections at AP −3.72 mm, −5.16 mm, −6.00 mm, and −6.60 mm from bregma (Paxinos and Watson, 2005) using Canvas 7 (ACD Systems of America, Miami, FL). The total lesion size was estimated as the sum of the sizes of bilateral tissue destroyed at the four AP coordinates divided by the sum of the bilateral hippocampal area in the control animals. Lesion size in the two hippocampal lesion groups was analyzed using an independent t test to determine whether there were group differences in lesion size. Significant levels were set to 0.05.
Results
Histological analysis.
An independent t test revealed no significant difference in lesion size between the 1 DAY and 21 DAY hippocampal groups (t(17) = 1.791; p = 0.174). The average percentage hippocampal damage in the 1 DAY hippocampal group was 76% (range, 66–89%) and in the 21 DAY hippocampal group was 68% (range, 47–84%) (Fig. 1). Sparing of the hippocampus was seen mainly in the dorsolateral and dorsomedial portions of the ventral hippocampus. In nine of the animals, the posterior portion of the lesion involved damage in the entorhinal cortex, but this was generally minor. In 12 of the animals, there was also damage in the anterior portions of the presubiculum and parasubiculum. A Mann–Whitney test revealed no difference in the amount of trained food eaten between subjects with entorhinal cortex damage and those subjects without entorhinal cortex damage in the 1 DAY and 21 DAY groups, indicating differences between groups were not attributable to entorhinal cortex damage. A Pearson’s correlation also revealed no correlation between the amount of subiculum damage in the 1 DAY and 21 DAY groups and the amount of trained food eaten at test.
Figure 1.
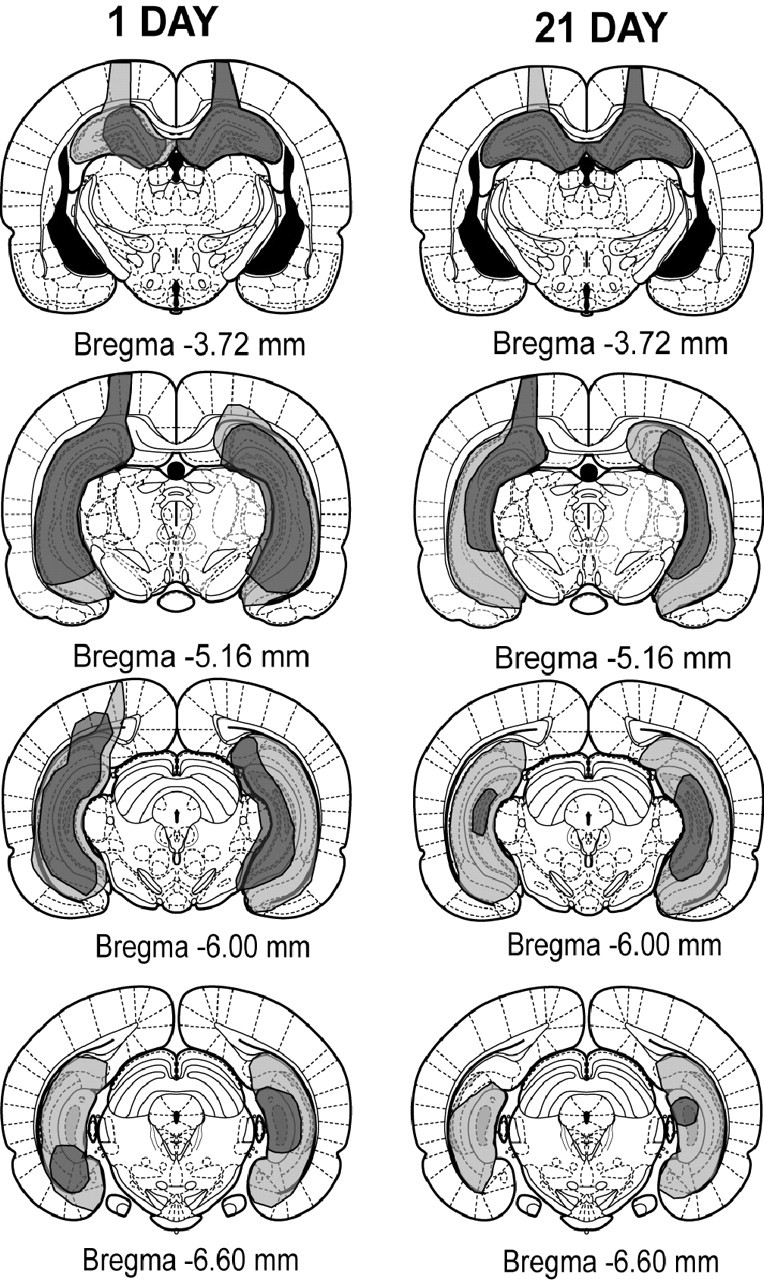
Reconstruction of the smallest (dark gray) and largest (light gray) lesion in the 1 DAY and 21 DAY hippocampal groups. Numbers represent AP coordinates from bregma taken from Paxinos and Watson (2005).
Behavioral performance.
The percentage of trained food eaten was entered into a 2 (day) × 2 (treatment condition) ANOVA that revealed a significant day-by-treatment condition interaction (F(1,33) = 4.179; p ≤ 0.05) (Fig. 2A), indicating that the percentage of trained food eaten 30 d after training differed between the groups depending on when the lesion occurred. Animals in the 1 DAY hippocampal group failed to retrieve the STFP, which is reflected in chance performance on the test (48.55 ± 11.04; t(9) = 0.131; p = 0.899), whereas animals in the 21 DAY hippocampal group showed robust STFP (81.76 ± 5.8; t(8) = 5.475; p = 0.001) (Fig. 2A). There was no significant main effect of day (F(1,33) = 1.815; p = 0.187) or treatment condition (F(1,33) = 0.533; p = 0.471), indicating that the combination of the lesion and the timing of that lesion determined the amount of trained food eaten at test. The significant interaction was not secondary to the total amount of food eaten between groups, because a 2 (day) × 2 (treatment condition) ANOVA failed to reveal any significant effects (Fig. 2B). These findings indicate that selective hippocampal lesions made within 1 d of training result in a severe deficit in memory at 30 d, whereas hippocampal damage 3 weeks after training did not prevent retrieval of the memory of STFP, thereby confirming temporally graded retrograde amnesia for this form of nonspatial memory after selective hippocampal damage.
Figure 2.
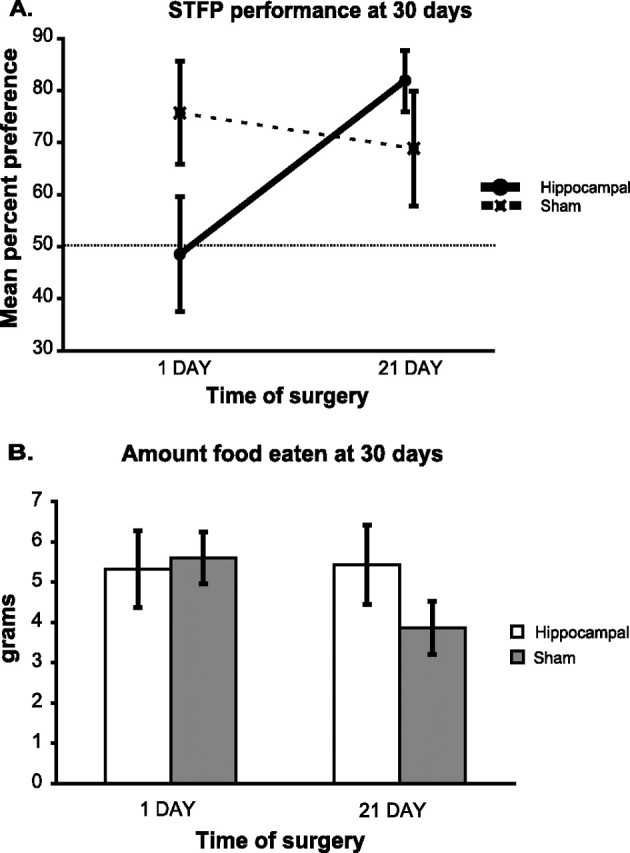
Behavioral results from experiment 1. A, Mean percentage preference scores during testing 30 d after training on STFP in animals that received RF hippocampal surgery (circles) or sham surgery (rectangles) 1 or 21 d after training. The dotted line at 50% equals chance performance. B, The mean total amount of food eaten (grams) during testing 30 d after training on STFP did not differ among animals that received RF hippocampal lesion (white bars) or sham surgery (gray bars) 1 or 21 d after training. All data are shown as mean ± SEM.
Experiment 2
Subjects.
Subjects were 32 Long–Evans male rats (Charles River, Wilmington, MA) weighing 250–275 g at the beginning of the study. Thirty-two Long–Evans male rats of the same weight served as control animals. Twenty-one additional Long–Evans male rats weighing 225–250 g at the beginning of the study served as demonstrators.
Experimental design.
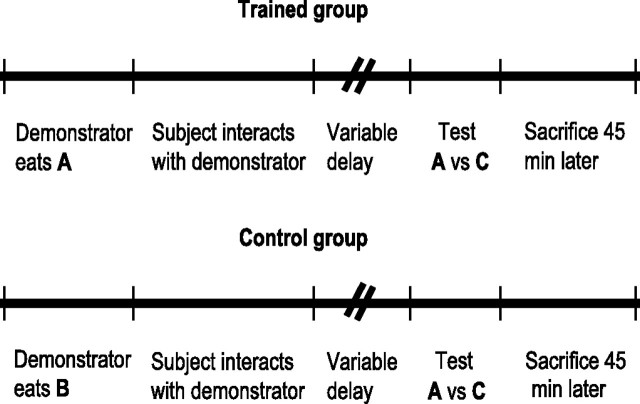
All training procedures used were identical to those described above. The testing procedure was also the same, except for the following alterations in testing for the control groups. Demonstrators for the subject animals were given access to powdered rat chow scented with a particular odor designated odor A (see below). During testing, subjects were given a choice of A or powdered chow scented with another odor, designated odor C. Subject animals were divided into four groups and tested immediately (IMM), 1 d (1 DAY), 2 d (2 DAY), or 21 d (21 DAY) after training depending on group assignment. Control animals were also divided into four groups and were treated exactly the same as subject animals, except that demonstrators for control animals were given access to powdered chow scented with another odor B. At testing, control rats were given the same A versus C choice that subjects were given (Fig. 3). A and B were counterbalanced across powdered rat chow mixed with thyme (1%) and basil (0.7%), whereas C was always powdered rat chow mixed with oregano (1%). After 45 min of eating from the two food cups, the cups were taken away, and subjects waited in their home cages for 45 more minutes, after which they were killed and brain tissue was processed for Fos expression. The experimenters observed no obvious differences in behavior between the control animals and experimental animals during visual observation from outside the testing room. Animals that did not eat at least 1 g of food during testing or managed to flip over the food cups were eliminated from the study.
Figure 3.
Design of experiment 2. Animals in the trained group were allowed to interact with a demonstrator rat that had eaten A and then tested after a variable delay on their preference for A compared with C. Animals in the control group were allowed to interact with a demonstrator that had eaten B and then tested after a variable delay on their preference for A compared with C.
Histology and immunocytochemistry.
Animals were anesthetized using an overdose (100 mg/kg) of sodium pentobarbital and perfused transcardially with 0.9% saline followed by 350 ml of 4% paraformaldehyde in 0.1 m PBS. Brains were removed and postfixed in 4% paraformaldehyde for 1 h before being placed in 30% sucrose/PBS at 4°C until they sank. Coronal 50 μm slices were cut on a freezing sliding microtome and collected into an antifreeze solution and maintained at −20°C for later Fos labeling.
Fos labeling was done according to the procedure set forth by Halem et al. (1999). Free-floating sections were first rinsed of antifreeze solution with four PBS washes of 45 min each at room temperature. Sections were then pretreated with a 7.5% normal goat serum (NGS) in 0.1% Triton X-100/PBS solution for 3 h. Sections were incubated in Fos primary antibody (Santa Cruz Biotechnology, Santa Cruz, CA) diluted 1:5000 in 2% NGS in 0.1% Triton X-100/PBS solution for 16 h. Sections were then rinsed in 1.5% NGS in 0.1% Triton X-100/PBS solution three times for 10 min each, after which they were incubated with biotinylated goat anti-rabbit immunoglobulin G (Vector Laboratories, Burlington, CA) diluted 1:200 in 2% NGS and 0.1% Triton X-100/PBS for 1 h. Sections were washed for 15 min in PBS, after which they were treated with 3% hydrogen peroxide in PBS for 30 min. Sections were then washed three times with PBS for 10 min each and incubated in avidin-biotin-peroxidase complex solution (ABC Kit; Vector Laboratories) for 45 min. Slides were again rinsed three times in PBS for 10 min each and reacted with 0.025% 3,3′-diaminobenzidine with nickel intensification (DAB Kit; Vector Laboratories) for 5 min and rinsed three times for 10 min in PBS. Sections were mounted on slides, dehydrated, and coverslipped.
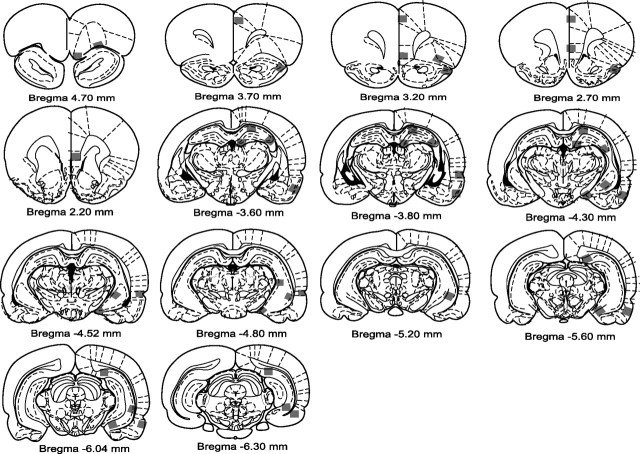
Images using a 20× objective microscope (Olympus BX51; Olympus Optical, Tokyo, Japan) and a Nikon (Tokyo, Japan) DXM 1200 digital camera were captured using Image Pro Plus 4.5 software (version 4.5.1; Media Cybernetics, Silver Spring, MD), which yielded an area of 0.696 × 0.557 mm. Images of the hippocampus were taken, because performance on this task is known to be dependent on the hippocampus and included dorsal CA1 (CA1), ventral CA1 (VCA1), dorsal CA3 (CA3), ventral CA3 (VCA3), dorsal dentate gyrus (DG), ventral dentate gyrus (VDG), dorsal subiculum (DSUB), and ventral subiculum (VSUB) (Fig. 4). Cortical images analyzed included the orbitofrontal cortex (OFC), olfactory cortical areas including the anterior (APIR) and posterior piriform (PPIR) cortices, medial temporal lobe cortices including the lateral entorhinal (LENT) and perirhinal (PERI) cortex, the anterior cingulate cortex (ACC), and the infralimbic (IL) cortex (Fig. 4). Typically, images included cortical layers 1, 2, 3, and 4, although no attempt was made to differentiate Fos expression in different cortical layers. These areas were selected for analysis, because olfactory information processed by the olfactory bulbs is sent to the piriform cortex and lateral entorhinal cortex (Haberly and Price, 1977), and the piriform cortex sends prominent projections to the perirhinal cortex and entorhinal cortex (Burwell and Amaral, 1998). The OFC is also reciprocally connected with the medial temporal lobe, including the perirhinal and entorhinal cortices and receives direct inputs from the piriform cortex (Deacon et al., 1983; Price et al., 1991; Barbas, 2000). ACC and IL were included, because previous studies using spatial-based tasks have shown their importance in long-term memory storage (Bontempi et al., 1999; Frankland et al., 2004; Maviel et al., 2004).
Figure 4.
Areas examined for Fos-IR expression. Gray rectangles show the areas where images were captured and counted for Fos-IR expression. The numbers beneath each picture represent AP coordinates from bregma taken from Paxinos and Watson (1998).
All slides were coded to conceal the subject group from the experimenter, and then the number of Fos-immunoreactive (Fos-IR) cells was counted manually. A cell was considered Fos-IR only if the black round Fos-IR nucleus appeared to be at least half as dark as the darkest labeled nucleus on each image during visual inspection. Three separate sections of each area of interest were counted for Fos-IR and then averaged. Sections for analysis were chosen to sample a wide range of the area of interest using stereotaxic coordinates (Fig. 4) and were identified by visual comparison to a stereotaxic atlas (Paxinos and Watson, 1998).
Statistical analysis
The mean percentage preference score for the trained food (A) was calculated as follows: (weight of A eaten/weight of all food eaten) × 100. ANOVA was used to determine whether there were significant group differences in the percentage of A eaten and the total amount of food eaten. One-sample t tests were used to determine whether the percentage of trained food eaten in each group was different from chance selection of the two food cups. Mean Fos-IR counts from all of the control animals were obtained for each area examined and were then used to normalize each individual subject’s Fos-IR count in the corresponding area. Previous studies have shown that there is an increase or decrease in activation in cortical and hippocampal areas, respectively, as the time between training and testing increases (Bontempi et al., 1999; Frankland et al., 2004; Maviel et al., 2004). Therefore, our analyses focused on comparing the normalized Fos-IR counts for each brain area across retrieval test times. The simplest model to explain these changes is a linear model, which assumes with an increase in time, activation increases, decreases, or stays the same. A one-way ANOVA with linear contrasts was conducted on the normalized means to determine whether there were any significant group differences in the number of Fos-IR cells and to determine whether the relationship between groups was linear (i.e., as time increased, did activation increase/decrease or stay the same). Differences between groups were examined using a Tukey post hoc test. To directly test whether the ventral hippocampus is more important than the dorsal hippocampus during retrieval of the STFP task, a paired-samples t test was conducted comparing the normalized mean of each dorsal and ventral hippocampal subdivision in the experimental group collapsed across days. Significance levels were set to 0.05.
Results
Behavioral performance
ANOVA revealed no difference in the mean percentage preference scores or amount of food eaten between the four different control groups. Consequently, these subgroups were collapsed into one control group. A subsequent ANOVA revealed a significant difference in the amount of trained food (A) eaten between the collapsed control group and the four experimental groups (IMM, 1 DAY, 2 DAY, and 21 DAY; F(4,55) = 21.515; p < 0.001) (Fig. 5_A_). _Post hoc_ tests revealed that all four experimental groups ate significantly more A than the collapsed control group (mean ± SEM; control, 33.26 ± 4.84%; IMM, 84.77 ± 3.97%; 1 DAY, 91.32 ± 2.63%; 2 DAY, 80.89 ± 5.78%; 21 DAY, 75.92 ± 5.82%; all, _p_ < 0.001). One-sample _t_ tests revealed all four experimental groups ate significantly more of the trained food than that expected by chance (IMM, _t_(6) = 8.765; 1 DAY, _t_(7) = 15.693; 2 DAY, _t_(7) = 5.345; 21 DAY, _t_(6) = 4.451; all, _p_ < 0.005) (Fig. 5_A_), indicating successful memory of the STFP in all four experimental groups. ANOVA revealed no significant differences between the control group and experimental groups in the amount of food eaten (_F_(4,55) = 0.720; _p_ > 0.05) (Fig. 5B), indicating the differences in the percentage of A eaten were not a result of differences in the total amount of food eaten.
Figure 5.
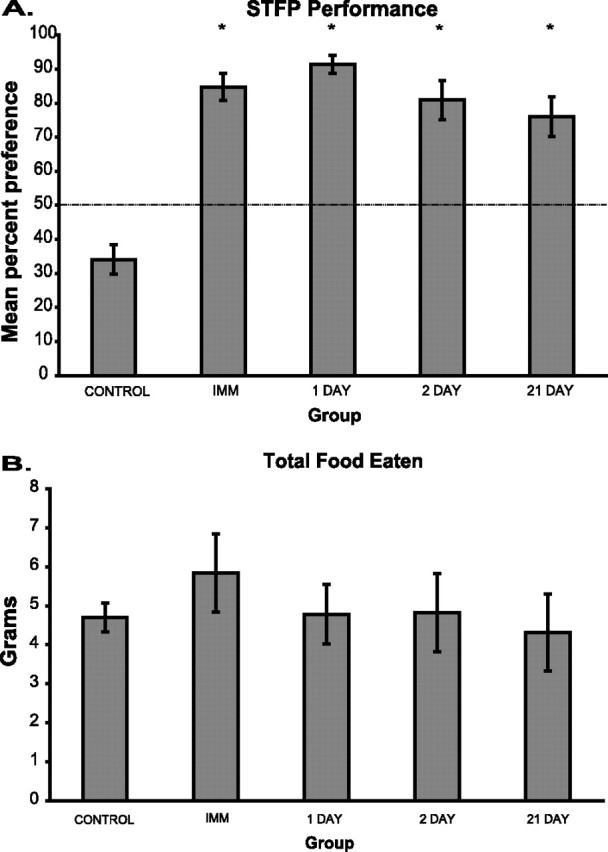
Behavioral results from experiment 2. A, The percentage of A eaten by control animals and the four experimental groups. Animals tested IMM and 1, 2, and 21 d after training all show successful performance on the STFP task. The dashed line indicates chance performance on the task. The asterisk indicates a significant difference from the control subjects. B, The mean total amount of food eaten in grams is not different between any of the groups examined. All data reported are mean ± SEM.
Control animals seemed to prefer to eat C, or the oregano scented food, over A (thyme or basil scented food). The control group ate A significantly less than expected by chance (t(29) = −3.458; p = 0.002), indicating that control animals ate significantly more C than chance, implying a natural preference for oregano-scented food. Thus, it is likely that subject animals would have chosen to eat a disproportionate amount of C if they had not been exposed to demonstrator rats that had eaten A.
c-fos analysis
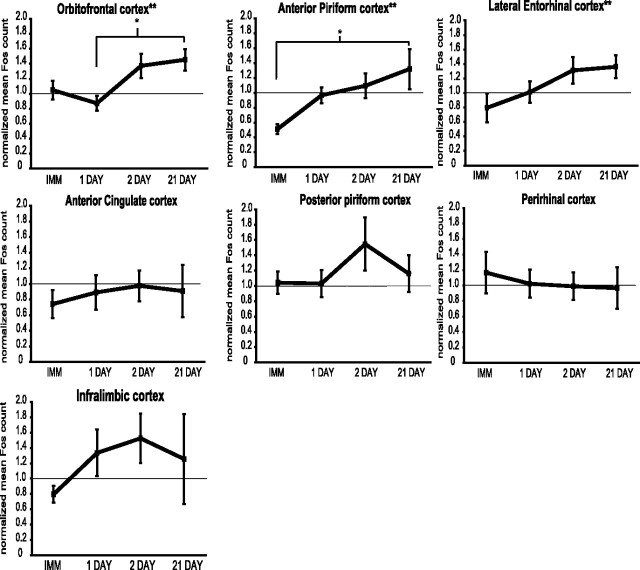
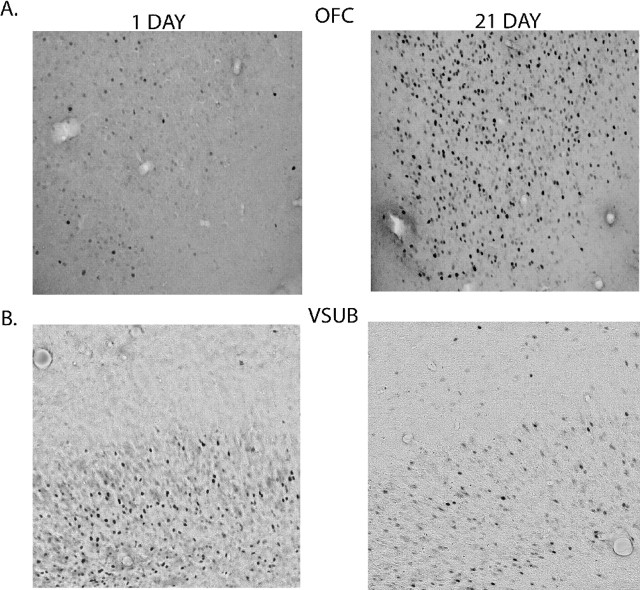
ANOVA revealed no significant difference in the mean Fos-IR cell counts between control groups in all areas examined except for the ventral dentate gyrus (F(3,26) = 3.337; p = 0.035; see below). ANOVA revealed a significant difference in the number of Fos-IR cells between the normalized means of the experimental groups in the OFC (F(3,26) = 4.141; p = 0.016) (Fig. 6), APIR (F(3,26) = 3.925; p = 0.020) (Fig. 6), and VDG (F(3,26) = 7.377; p = 0.001) (Fig. 7). In the OFC, linearity contrast revealed a significant linear trend between experimental groups (F(1,26) = 7.628; p = 0.01), indicating that as the training experience became more remote, the number of Fos-IR cells in the OFC increased. A Tukey post hoc test revealed a significant difference (p = 0.026) in the number of Fos-IR cells between the 1 DAY group (0.873 ± 0.099) and the 21 DAY group (1.46 ± 0.144), indicating a significant increase in Fos-IR in the 21 DAY group compared with the 1 DAY group. There was also a strong trend toward a significant difference (p = 0.055) between the number of Fos-IR cells in the OFC of the 1 DAY group compared with the 2 DAY group (1.37 ± 0.163). Figure 8A provides images of the Fos-IR seen in the OFC in the 1 DAY and 21 DAY groups.
Figure 6.
Normalized Fos-IR cell counts in the cortex. Normalized Fos-IR cell counts for animals tested on STFP IMM and 1, 2, or 21 d after training are shown. The double asterisks indicate a significant linear trend was observed between groups. Dotted lines indicate the mean of the control animals. The single asterisk indicates a significant difference between experimental groups. Data are reported as normalized mean ± SEM.
Figure 7.
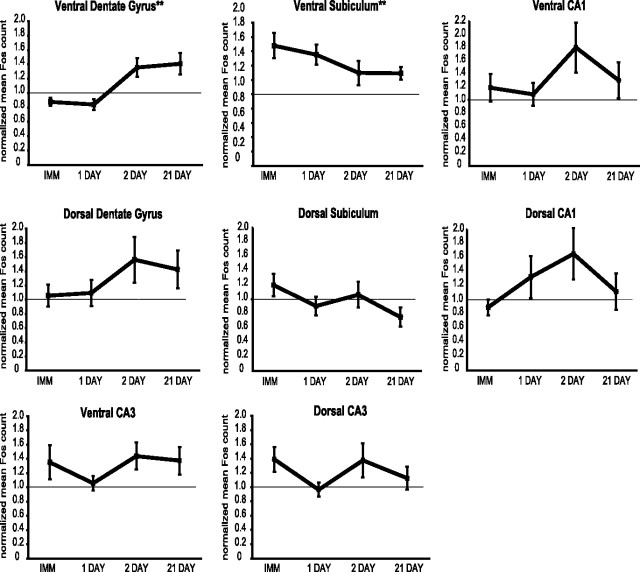
Normalized Fos-IR cell counts in the hippocampus. Normalized Fos-IR cell counts for animals tested on STFP IMM and 1, 2, or 21 d after training are shown. The asterisks indicate a significant linear trend was observed between groups. Dotted lines indicate the mean of the control animals. Data are reported as normalized mean ± SEM.
Figure 8.
Images of Fos-IR expression. A, Pictures of Fos-IR expression observed in the OFC in the 1 DAY and 21 DAY group. B, Pictures of Fos-IR expression observed in the VSUB in the 1 DAY and 21 DAY group.
In the APIR, linearity contrast revealed a significant linear trend between groups (F(1,26) = 11.097; p = 0.003) (Fig. 6), indicating that as the training session became more remote, the number of APIR cells expressing Fos-IR during retrieval increased. A Tukey post hoc test revealed a significant difference (p = 0.014) in the number of Fos-IR cells between the IMM group (0.513 ± 0.066) and the 21 DAY group (1.32 ± 0.269), indicating a significant increase in Fos-IR in the 21 DAY compared with the IMM group in the APIR.
In the VDG, linearity contrast revealed a significant linear trend between groups (F(1,26) = 17.34; p < 0.001) (Fig. 7), indicating that as the training session became more remote, the number of VDG cells expressing Fos-IR during retrieval increased. However, whether this increase is learning related is unclear, because Fos-IR was also significantly elevated in control groups over the same time periods.
Linearity contrasts also revealed significant linear trends between groups in the LENT (F(1,26) = 6.226; p = 0.019) (Fig. 6), indicating that the number of LENT cells expressing Fos-IR during retrieval significantly increased as the training session became more remote. The VSUB also showed a significant linear trend (F(1,26) = 4.238; p ≤ 0.05) (Fig. 7), indicating that the number of VSUB cells expressing Fos-IR during retrieval significantly decreased as the training session became more remote. Figure 8B provides images of the Fos-IR seen in the VSUB in the 1 DAY and 21 DAY groups. Table 2 provides mean Fos counts with SEM in areas where significant differences were found. All other areas, including the cortical regions of ACC, IL, PPIR, and PERI as well as hippocampal regions including CA1, CA3, DG, DSUB, VCA1, and VCA3, failed to show any significant differences between groups in the number of cells expressing Fos-IR at different retrieval times.
Table 2.
Fos counts obtained in each group of animals
| Brain area | Controls | IMM | 1 DAY | 2 DAY | 21 DAY |
|---|---|---|---|---|---|
| APIR | 61.69 ± 4.49 | 31.62 ± 4.07 | 59.67 ± 6.68 | 67.56 ± 10.17 | 81.43 ± 16.59 |
| OFC | 71.33 ± 4.78 | 74.86 ± 9.02 | 62.25 ± 7.03 | 97.98 ± 11.61 | 103.81 ± 10.25 |
| LENT | 49.09 ± 4.02 | 39.05 ± 9.84 | 49.71 ± 7.27 | 64.33 ± 9.09 | 66.81 ± 7.78 |
| VSUB | 32.87 ± 2.73 | 55.19 ± 5.83 | 51.04 ± 4.67 | 42.71 ± 5.59 | 42.38 ± 2.91 |
A paired-sample t test revealed a significant difference in the normalized Fos-IR mean of the experimental group in the VSUB compared with the DSUB (t(29) = 5.575; p < 0.001). This indicates that the increase in Fos-IR in the VSUB of animals in the experimental group compared with control animals was significantly greater (1.45 ± 0.077) during retrieval of STFP in the ventral subiculum than in the dorsal subiculum (.980 ± 0.079). No other ventral hippocampal normalized mean revealed a significant difference from the corresponding dorsal hippocampal subdivision.
Discussion
Experiment 1 indicated that substantial damage to the hippocampus 1 d after training impairs performance during retention testing 30 d after learning, whereas hippocampal damage 21 d after training had no effect. Therefore, animals no longer require an intact hippocampus 21 d after training to successfully recall STFP, indicating that consolidation was completed within 21 d. A previous study reported that lesions limited to both dorsal and ventral CA1, CA3, and DG 5 d after training in STFP resulted in spared STFP, suggesting that consolidation was complete within 5 d (Winocur et al., 2001). However, another previous study found that more substantial damage to the hippocampus, including the subiculum, 10 d, but not 30 d, after training impaired retrieval 10 d after surgery, suggesting that consolidation occurs some time after 10 d but before 30 d (Clark et al., 2002). These differences in the time frame of consolidation suggest that more complete hippocampal damage, which includes the subiculum, results in a longer observed consolidation period. In particular, damage limited to the CA1, CA3 and DG of the hippocampus cause no impairment (Bunsey and Eichenbaum, 1995; Alvarez et al., 2001) or only a small impairment (Winocur et al., 2001) in STFP performance, whereas damage to the hippocampus, including the subiculum, results in a marked deficit (Bunsey and Eichenbaum, 1995; Alvarez et al., 2001; Clark et al., 2002). Importantly, in the present study, hippocampal lesions that included the subiculum resulted in a temporally graded retrograde amnesia limited to 21 d, indicating consolidation of STFP occurs within 21 d when using the training procedures in this study.
In Experiment 2, we used neuroimaging with Fos to show that the number of Fos-IR cells in cortical regions, including the OFC, APIR, and LENT, increased as the training experience became more remote in a nonspatial hippocampal-dependent task. The increase in Fos-IR cells in the cortex was mirrored by a decrease in the number of Fos-IR cells in the VSUB. These findings imply that initially a subfield of the hippocampus, specifically the ventral subiculum, is important for the memory of a socially transmitted food preference, and over time this importance decreases as cortical regions such as the OFC, APIR, and LENT become important. The observation of decreasing involvement of the ventral subicular area of the hippocampus corresponds to the temporally graded retrograde amnesia as a consequence of hippocampal damage. Furthermore, the complementary increasing involvement of entorhinal, piriform, and orbital prefrontal cortices indicates that consolidation involves the transfer of memory processing to a network of medial temporal and olfactory cortical areas. These conclusions will be explored in greater detail below.
What part of the hippocampus is involved in nonspatial memory, and for how long?
The ventral hippocampus seems to serve a preferential role in the retrieval of information during STFP. No other subfield of the hippocampus showed a significant decrease or increase in Fos-IR associated with learning over the course of the consolidation period. We did observe an increase in Fos-IR in the VDG, but this increase could not be distinguished from a similar trend for increasing Fos expression observed in controls and therefore cannot be unambiguously associated with learning. Also, direct comparison of the increase in Fos-IR counts in the experimental groups during retrieval of STFP revealed a greater increase in the VSUB than the DSUB. These findings are consistent with a previous study showing an increase in c-fos activation in the ventral hippocampus but not the dorsal hippocampus during acquisition and retrieval 2 d after training in the STFP task (Countryman et al., 2005). These findings contrast with previous reports that the dorsal and ventral hippocampus are both activated during retrieval of memory in the radial maze (Bontempi et al., 1999; Maviel et al., 2004) and that the dorsal hippocampus is activated in retrieval of a consolidated fear memory (Frankland et al., 2004). This pattern of findings suggests that both the dorsal and ventral hippocampus play a role in the recent retrieval of spatial memory. In contrast, the present results suggest that hippocampal activation is limited to the ventral subiculum in STFP.
Are different cortical areas involved in olfactory and spatial memory?
Previous studies using spatial memory tasks have led to the suggestion that the anterior cingulate may play a general role in the storage of long-term memories, such that this area integrates the cortical representations necessary for long-term memory (Frankland et al., 2004). The present findings do not support the generality of this conclusion. Instead, the present results reveal that permanent memories for STFP are supported by a network of olfactory recipient regions, including the piriform cortex, entorhinal cortex, and orbitofrontal cortex. In the present study, there was no change in the number of Fos-IR cells in the anterior cingulate cortex of animals performing across testing periods, nor did Fos-IR counts in the anterior cingulate significantly differ from those in control animals at any time point examined. Also, whereas previous studies on spatial memory have indicated that the involvement of the entorhinal cortex decreases during consolidation (Bontempi et al., 1999; Frankland et al., 2004; Maviel et al., 2004), in the present study, lateral entorhinal involvement increased over time. The differences in the pattern of increasingly activated cortical areas indicate that distinct cortical networks are responsible for the long-term storage for different types of memory.
Results from the current study show retrieval of the STFP task either immediately or 1 d after training does not significantly activate the orbitofrontal cortex when compared with control animals. However, a recent study has shown that cholinergic depletion of the orbitofrontal cortex before training impairs STFP task performance when tested 2 d after training (Ross et al., 2005). The impairment in performance after cholinergic depletion of the orbitofrontal cortex during testing 2 d after training might be attributable to an impairment in acquiring the social transmission of food preference task, but it is also possible that the cholinergic depletion caused an impairment in retrieval. There was a strong trend toward significant activation in the orbitofrontal cortex during retrieval 2 d after training, suggesting that the orbitofrontal cortex is important for retrieval of the STFP task at that time. The finding that the orbitofrontal cortex may be activated during retrieval of STFP 2 d after training makes it possible that the deficit seen in STFP task performance after cholinergic lesion of the orbitofrontal cortex during testing was caused by a retrieval deficit and not an acquisition deficit.
The present results suggest that different cortical networks may be responsible for the long-term storage of olfactory and spatial memory. Previous studies have shown the importance of the anterior cingulate cortex in the long-term storage of spatial memory, whereas the current study reveals a role for a different set of cortical areas, including the orbitofrontal cortex, anterior piriform cortex, and lateral entorhinal cortex, in retrieval of a remote nonspatial memory. The difference in these cortical networks supports the view that different cortical areas are responsible for the long-term storage of different types of memory.
Footnotes
This work was supported by National Institute of Mental Health grants to H.E. The technical assistance provided by Elizabeth Baker, Alan Rahi, and Lauren Williams is gratefully acknowledged.
References
- Agster KL, Fortin NJ, Eichenbaum H (2002). The hippocampus and disambiguation of overlapping sequences. J Neurosci 22:5760–5768. [DOI] [PMC free article] [PubMed] [Google Scholar]
- Alvarez P, Lipton PA, Melrose R, Eichenbaum H (2001). Differential effects of damage within the hippocampal region on memory for a natural, nonspatial odor-odor association. Learn Mem 8:79–86. [DOI] [PMC free article] [PubMed] [Google Scholar]
- Alvarez P, Wendelken L, Eichenbaum H (2002). Hippocampal formation lesions impair performance in an odor-odor association task independently of spatial context. Neurobiol Learn Mem 78:470–476. [DOI] [PubMed] [Google Scholar]
- Barbas H (2000). Connections underlying the synthesis of cognition, memory, and emotion in primate prefrontal cortices. Brain Res Bull 52:319–330. [DOI] [PubMed] [Google Scholar]
- Bontempi B, Laurent-Demir C, Destrade C, Jaffard R (1999). Time-dependent reorganization of brain circuitry underlying long-term memory storage. Nature 400:671–675. [DOI] [PubMed] [Google Scholar]
- Bunsey M, Eichenbaum H (1995). Selective damage to the hippocampal region blocks long-term retention of a natural and nonspatial stimulus-stimulus association. Hippocampus 5:546–556. [DOI] [PubMed] [Google Scholar]
- Burwell RD, Amaral DG (1998). Cortical afferents of the perirhinal, postrhinal, and entorhinal cortices of the rat. J Comp Neurol 398:179–205. [DOI] [PubMed] [Google Scholar]
- Clark RE, Broadbent NJ, Zola SM, Squire LR (2002). Anterograde amnesia and temporally graded retrograde amnesia for a nonspatial memory task after lesions of hippocampus and subiculum. J Neurosci 22:4663–4669. [DOI] [PMC free article] [PubMed] [Google Scholar]
- Countryman RA, Orlowski JD, Brightwell JJ, Oskowitz AZ, Colombo PJ (2005). CREB phosphorylation and c-Fos expression in the hippocampus of rats during acquisition and recall of a socially transmitted food preference. Hippocampus 15:56–67. [DOI] [PubMed] [Google Scholar]
- Deacon TW, Eichenbaum H, Rosenberg P, Eckman KW (1983). Afferent connections of the perirhinal cortex in the rat. J Comp Neurol 220:168–290. [DOI] [PubMed] [Google Scholar]
- Fortin NJ, Agster KL, Eichenbaum H (2002). Critical role of the hippocampus in memory for sequences of events. Nat Neurosci 5:458–462. [DOI] [PMC free article] [PubMed] [Google Scholar]
- Frankland PW, Bontempi B, Talton LE, Kaczmarek L, Silva AJ (2004). The involvement of the anterior cingulate cortex in remote contextual fear memory. Science 304:881–883. [DOI] [PubMed] [Google Scholar]
- Galef BG Jr, Kennett DJ, Stein M (1985). Demonstrator influence on observer diet preference: effects of simple exposure and the presence of a demonstrator. Anim Learn Behav 13:25–30. [Google Scholar]
- Haberly LB, Price JL (1977). The axonal projection patterns of the mitral and tufted cells of the olfactory bulb in the rat. Brain Res 129:152–157. [DOI] [PubMed] [Google Scholar]
- Halem HA, Cherry JA, Baum MJ (1999). Vomeronasal neuroepithelium and forebrain Fos responses to male pheromones in male and female mice. J Neurobiol 39:249–263. [PubMed] [Google Scholar]
- Maviel T, Durkin TP, Menzaghi F, Bontempi B (2004). Sites of neocortical reorganization critical for remote spatial memory. Science 305:96–99. [DOI] [PubMed] [Google Scholar]
- Milner B, Squire LR, Kandel ER (1998). Cognitive neuroscience and the study of memory. Neuron 20:445–468. [DOI] [PubMed] [Google Scholar]
- Paxinos G, Watson C (1998). In: The rat brain in stereotaxic coordinates Ed 4 San Diego: Academic.
- Paxinos G, Watson C (2005). In: The rat brain in stereotaxic coordinates Ed 5 San Diego: Academic.
- Price JL, Carmichael T, Carnes KW, Clugnet M, Kuroda M, Ray JPDavis J, Eichenbaum H (1991). Olfactory input to the prefrontal cortex. In: Olfaction as a model for computational neuroscience pp. 101–120. Cambridge, MA: MIT.
- Ross RS, McGaughy J, Eichenbaum H (2005). Acetylcholine in the orbitofrontal cortex is necessary for the acquisition of a socially transmitted food preference. Learn Mem 12:302–306. [DOI] [PMC free article] [PubMed] [Google Scholar]
- Winocur G (1990). Anterograde and retrograde amnesia in rats with dorsal hippocampal or dorsomedial thalamic lesions. Behav Brain Res 38:145–154. [DOI] [PubMed] [Google Scholar]
- Winocur G, McDonald RM, Moscovitch M (2001). Anterograde and retrograde amnesia in rats with large hippocampal lesions. Hippocampus 11:18–26. [DOI] [PubMed] [Google Scholar]
