Toll-Like Receptor 2 Signaling in Response to Brain Injury: An Innate Bridge to Neuroinflammation (original) (raw)
Abstract
Reactive gliosis is a prominent feature of neurodegenerative and neuroinflammatory disease in the CNS, yet the stimuli that drive this response are not known. There is growing appreciation that signaling through Toll-like receptors (TLRs), which is key to generating innate responses to infection, may have pathogen-independent roles. We show that TLR2 was selectively upregulated by microglia in the denervated zones of the hippocampus in response to stereotactic transection of axons in the entorhinal cortex. In mice lacking TLR2, there were transient, selective reductions in lesion-induced expression of cytokines and chemokines. Recruitment of T cells, but not macrophages, was delayed in TLR2-deficient mice, as well as in mice lacking TNFR1 (tumor necrosis factor receptor 1). TLR2 deficiency also affected microglial proliferative expansion, whereas all of these events were unaffected in TLR4-mutant mice. Consistent with the fact that responses in knock-out mice had all returned to wild-type levels by 8 d, there was no evidence for effects on neuronal plasticity at 20 d. These results identify a role for TLR2 signaling in the early glial response to brain injury, acting as an innate bridge to neuroinflammation.
Keywords: hippocampus, neuroinflammation, axotomy, cytokines, chemokines, microglia, leukocytes
Introduction
The CNS responds to injury by initiating inflammatory responses. Participation of the immune system may be beneficial, or cause additional pathology (Schwartz, 2003; Jones et al., 2005). The molecular mechanism of neuronal-immune cross talk remains unclear. There is much interest in whether glial cells mediate this communication, specifically in directing leukocyte entry to the CNS.
Microglia are resident myeloid cells that constitute the innate immune system in the CNS. They become rapidly and robustly activated in response to injury or pathological events in the CNS. Rapid programs of response have been collectively termed CNS innate (inherent) responses (Nguyen et al., 2002; Streit et al., 2004; Hauwel et al., 2005; Owens et al., 2005). They include secretion of cytokines and chemokines that regulate the kinetics and cellular composition of the inflammatory response, upregulation of cell surface molecules, and expansion of local microglial populations. This reactive microgliosis is a prominent feature of neurodegenerative and neuroinflammatory disease (Carson, 2002; Nguyen et al., 2002; Streit, 2004; Streit et al., 2004; Ladeby et al., 2005a). However, the signals that induce microglia to initiate innate responses are not defined.
Innate immune responses to infection are initiated by germline-encoded pattern recognition receptors (PRRs) that signal immediate response to invariant structures that are expressed by pathogens, but not the host (Gordon, 2002; Janeway and Medzhitov, 2002). Among these are Toll-like receptors (TLRs), an evolutionarily conserved family of PRRs (Gordon, 2002; Janeway and Medzhitov, 2002; Akira and Takeda, 2004). TLRs may also have pathogen-independent roles, by initiating responses to host-derived, endogenous ligands. Recent in vitro studies have primarily focused on identifying such ligands for TLR2 and TLR4, which are best known to recognize bacterial lipoproteins/peptidoglycan and lipopolysaccharide (LPS), respectively (Gordon, 2002; Akira and Takeda, 2004; Tsan and Gao, 2004; Rifkin et al., 2005). However, concern over endotoxin contamination has made it difficult to confirm whether endogenous signaling accounts for these responses (Tsan and Gao, 2004). Both TLR2 and TLR4 are constitutively expressed in the CNS (Laflamme et al., 2001; Bsibsi et al., 2002; Olson and Miller, 2004; Carpentier et al., 2005; Jack et al., 2005; Kielian, 2006), and may be upregulated in the absence of pathogenic stimuli (Nguyen et al., 2001; Tanga et al., 2004; Turrin and Rivest, 2004).
Axonal degeneration in the hippocampus, triggered by stereotactic lesioning of axons in the entorhinal cortex, causes rapid glial activation without junctional disruption of the blood–brain barrier (Fagan and Gage, 1994; Jensen et al., 1997; Bechmann and Nitsch, 2000; Babcock et al., 2003; Ladeby et al., 2005a). Responsive microglia and astrocytes initiate a cascade of events that promote later chemokine-driven entry of leukocytes from blood (Babcock et al., 2003). We have addressed whether TLR2 or TLR4 signaling drives this response. We show that lack of TLR2 reduces early cytokine and chemokine expression, and delays T cell recruitment and microglial proliferative response. These events are TLR4 independent. Our results point to an endogenous role for TLR2 signaling in regulating the neuroinflammatory response to axonal injury.
Materials and Methods
Animals/surgery.
TLR2-deficient mice (Werts et al., 2001) were backcrossed to C57BL/6 for 6–10 generations. C57BL/6-backcrossed tumor necrosis factor receptor 1 (TNFR1)-deficient mice were maintained as a colony from breeders originally donated by Dr. Tak Mak (Ontario Cancer Institute, Ontario, Canada). Control C57BL/6 mice were purchased from Charles River Canada (St. Constant, Quebec, Canada) or the The Jackson Laboratory (Bar Harbor, ME). TLR4-defective C3H/HeJ mice, which have a point mutation that renders this receptor nonfunctional (Poltorak et al., 1998), were purchased from The Jackson Laboratory, and C3H/HeN mice (Charles River Canada) were used as wild-type (WT) controls. All animals were maintained under specific pathogen-free conditions according to Canadian Council on Animal Care guidelines, as administered by the McGill University (Montreal, Quebec, Canada) Animal Care Committee. Some TLR2-deficient and C57BL/6 mice (Taconic, Ry, Denmark) were housed in the Laboratory of Biomedicine at the University of Southern Denmark.
Under anesthesia, animals were placed into a stereotactic apparatus for wireknife transection of axons in the entorhinal cortex, as described previously (Babcock et al., 2003; Wirenfeldt et al., 2005). Hippocampi from unmanipulated or sham-operated mice were also analyzed (data not shown). Mice were perfused with PBS for RNA or flow cytometric analysis at various times after lesion. For these studies, the control contralateral and the lesion-reactive hippocampi were dissected from individual mice. Briefly, a scalpel was used to make an incision between the two hemispheres of the brain, to a depth that extended through the cortical layers only. The entire cortex was lifted and unfolded to each side, revealing the hippocampi on the exposed surfaces. Small incisions were made at the level of the fornix, and then the hippocampi were peeled out using the back of the scalpel blade, with careful removal of the entorhinal cortex (e.g., site of axonal transection). If attached, the choroid plexus on the hippocampal surface facing the lateral ventricles was removed by tracing the scapel blade over the tissue.
For immunohistochemical studies or in situ hybridization, mice were perfused with PBS, followed by 4% paraformaldehyde (PFA) or Borax-buffered 4% PFA, respectively. The brain was removed, embedded in OCT (EMS, Hatfield, PA), and frozen in 2-methylbutane cooled on dry ice.
Quantitative real-time RT-PCR.
RNA was isolated from isolated hippocampus and converted to cDNA as described previously (Babcock et al., 2003). Quantitative real-time RT-PCR was done using the ABI PRISM 7700 Sequence Detection System (Applied Biosystems, Foster City, CA) as described previously for matrix metalloproteinase 12 (MMP12) and 18S (Toft-Hansen et al., 2004), and for newly described primer (Sigma, Oakville, Ontario, Canada) and FAM-MGB Probe (Applied Biosystems) sequences. These were TLR2 (forward, CTG GAG CAT CCG AAT TGC AT; reverse, GTT TGC TGA AGA GGA CTG TTA TGG; probe, CCT CAG ACA AAG CGT CA), TLR4 (forward, CTC TGA TCA TGG CAC TGT TCT TCT; reverse, TCT GAT CCA TGC ATT GGT AGG T; probe, CTG CAT AGA GGT AGT TCC), TLR1 (forward, GTT TTA ATG AGT GTT TGT GAA TGC AGT T; reverse, ATT CCT GAG GTC CCT GCT ATT CTT; probe, CTA CAG AAA CGT CCT ATA CC), CD14 (forward, TTT CAG AAT CTA CCG ACC ATG GA; reverse, TCT GGC GTG CAC CAG AAG CA; probe, CGT GTG CTT GGC TTG), myeloid differentiating factor 88 (MyD88) (forward, CAG ACA GAC TAT CGG CTT AAG TTG TG; reverse, TCT GTA GAT AAT CGT CAG AAA CAA CCA; probe, GCT AAT TGA GAA AAG GTG TC), CCL2 (forward, TCT GGG CCT GCT GTT CAC A; reverse, CCT ACT CAT TGG GAT CAT CTT GCT; probe, CTC AGC CAG ATG CAG TT), tumor necrosis factor α (TNFα) (forward, CCA AAT GGC CTC CCT CTC AT; reverse, TCC TCC ACT TGG TGG TTT GC; probe, CTC ACA CTC AGA TCA T), CXCL10 (forward, GCC GTC ATT TTC TGC CTC AT; reverse, GGC CCG TCA TCG ATA TGG; probe, GGA CTC AAG GGA TCC), interleukin-1β (IL-1β) (forward, CTT GGG CCT CAA AGG AAA GAA; reverse, AAG ACA AAC CGT TTT TCC ATC TTC; probe, AGC TGG AGA GTG TGG AT), and CCL5 (forward, GGA GTA TTT CTA CAC CAG CAG CAA; reverse, CAC ACA CTT GGC GGT TCC TT; probe, TGC AGT CGT GTT TGT C). The specificity of our primers and probes was confirmed by sequence homology search using BLAST (basic local alignment search tool) (www.ncbi.nlm.nih.gov/BLAST/). Primer–probe sets were designed to span introns to not pick up genomic signal. A higher primer concentration was used for the IL-1β reaction only (800 nm).
In situ hybridization.
TLR2+ and IκBα+ cells were localized to the lesion-reactive hippocampus using radioactive-labeled TLR2-specific probes, as described previously (Laflamme et al., 2001). To identify the source of TLR2, sections were additionally stained with anti-iba1 to label microglia/macrophages (Laflamme et al., 2001).
RNase protection assay.
RNase protection assays (RPAs) were performed as described previously (Babcock et al., 2003) using the mCK-5c template (BD Biosciences, Mississauga, Ontario, Canada) and ∼15 μg of RNA from individual, isolated contralateral and lesion-reactive hippocampi, at 3 and 24 h after lesion.
Flow cytometry.
Homogenates of individual microdissected hippocampi were prepared as described previously, using a protocol that did not select for cells of particular buoyant density (Babcock et al., 2003; Wirenfeldt et al., 2005). Antibodies to CD45 and CD11b or T cell receptor β (TCRβ) (BD Biosciences) were used to stain for microglia/macrophages or T cells, respectively. Microglia were distinguished from macrophages based on lower levels of CD45 (Sedgwick et al., 1998; Babcock et al., 2003). Biotinylated rat anti-mouse monoclonal antibody specific for TLR2 (clone 6C2; eBioscience, San Diego, CA) or isotype control (IgG2b; BD Biosciences) were detected using allophycocyanin-conjugated streptavidin (BD Biosciences). Data was collected on a FACScan or a FACSCalibur and analyzed using CellQuest Pro (BD Biosciences). Total cell numbers were calculated by adjusting for the fraction of the sample collected (determined by measuring the sample volume before and after acquisition).
Stringent guidelines were adopted for detection of rare events. The total number of events collected for each sample was 1–3 million events before forward-scatter (FSC)/side-scatter (SSC) gating. The flow cytometer was thoroughly washed between samples. Positive staining was determined based on fluorescence levels compared with isotype controls (BD Biosciences) or autofluorescence controls. Specifically, cells stained with CD45 only or CD45 in conjunction with isotype controls for TCRβ or CD11b were used to identify the background fluorescence and/or nonspecific binding of the CD45high population. This approach was taken because of the high level of autofluorescence observed in the CD45dim microglial population (Babcock et al., 2003; Wirenfeldt et al., 2005). The amount of antibody added was carefully titrated, such that essentially no background staining was evident in these isotype controls. The variance between replicate runs of the same sample was estimated to be as low as 0.012% (SD).
For assessment of proliferative response at 24 h and 8 d after lesion, 90 mg/kg 5-bromo-2′-deoxyuridine (BrdU) (BD Biosciences) was administered intraperitoneally to C57BL/6 and TLR2-deficient mice, at 24, 16, and 8 h before killing. Single-cell suspensions of isolated hippocampi were prepared and resuspended in HBSS with 2% fetal calf serum (Sigma) containing 2 μg/ml Fc Block (BD Biosciences), 50 μg/ml hamster IgG (Jackson ImmunoResearch, West Grove, PA), and 0.1% sodium azide. Cells were stained for surface markers using antibodies against CD11b and CD45 (BD Biosciences), and then fixed and stained with anti-BrdU, per the manufacturer's instructions (BD Biosciences). For the 8 d analysis, cells were simultaneously additionally labeled with anti-human glial fibrillary acidic protein (GFAP), which cross-reacts with mouse GFAP (Invitrogen, San Diego, CA) or an IgG1 isotype control (Caltag Laboratories, Burlingame, CA). Mice that had been lesioned but not injected with BrdU served as negative controls.
The physical properties of cell populations was examined by comparing FSC and SSC properties of cells in contralateral and lesion-reactive hippocampi. FSC/SSC plots were gated to show only CD11b+CD45dim (microglial) or GFAP+ (astroglial) cells. GFAP+ astrocytes did not express CD11b or CD45, as expected. Dead cells were excluded via FSC threshold. Scatter intensities were calculated using CellQuest Pro and are reported as percentage increases in the lesion-reactive hippocampus versus the contralateral hippocampus isolated from the same mouse at 24 h, 2 d, 5 d, or 8 d after lesion.
Immunohistochemistry.
For staining TLR2 on glial cells, 8–10 μm sections were blocked for nonspecific staining using 10% FCS in PBS for 30 min at room temperature. Sections were incubated overnight with biotinylated rat anti-TLR2 (6C2; eBioscience) in blocking buffer, at 4°C. This antibody did not stain TLR2-deficient tissues (supplemental Fig. 1_B_, available at www.jneurosci.org as supplemental material). After extensive washing (PBS plus 1% Triton X-100), sections were incubated with biotinylated goat anti-rat antibody (GE Healthcare, Hillerød, Denmark) at room temperature for 1 h, followed by streptavidin-conjugated alkaline phosphatase (DakoCytomation, High Wycombe, UK) for 1 h at room temperature. TLR2 expression was visualized using a Vector Red substrate kit (Vector Laboratories, Burlingame, CA) according to the manufacturer's instructions. For double staining, rabbit anti-iba1 (DakoCytomation) or rabbit anti-GFAP (DakoCytomation) was added at 4°C overnight. These antibodies were detected using Alexa 488-conjugated donkey anti-rabbit antibody (Invitrogen), subsequent to extensive washing. Sections were mounted using Gelvatol and viewed using an Olympus (Tokyo, Japan) BX51 microscope. Control sections stained using rat anti-IgG2b (BD Biosciences) at the same concentration as the TLR2 antibody, or anti-TLR2 followed by 1% rabbit serum, showed no staining.
For CD45 and CD11b staining, 10- to 12-μm-thick horizontal cryostat sections were adhered to SuperfrostD/Plus slides (Fischer Scientific, Montreal, Quebec, Canada), fixed in 4% PFA, and then incubated in 1% Triton X (20 min each). Sections were blocked for nonspecific staining using 20% normal goat serum in PBS, and then for endogenous biotin using an avidin–biotin kit (Vector). Primary rat anti-CD11b (Serotec, Hornby, Ontario, Canada), rat anti-CD45 (Serotec), or rat anti-GFAP (Zymed, Markham, Ontario, Canada) antibodies were added at room temperature for 1 h, and then a biotinylated rabbit anti-rat secondary antibody (Vector Laboratories) was applied for 45 min. Control sections stained using rat anti-IgG2b (Serotec) or rat IgG (Jackson Immuno Research) at the same concentration as the primary antibodies showed no fluorescence. Alexa 555-conjugated streptavidin (Invitrogen) was used to visualize the staining on a Leica (Nussloch, Germany) DMIRE2 microscope, after being counterstained with 0.01% Hoechst dye (Invitrogen).
Enzymatic staining for acetylcholinesterase (AChE) was performed on perfusion-fixed material using a modification of the thiocholine method (Drojdahl et al., 2002). Degenerating fibers and terminals were visualized in parallel sections using Fluoro-Jade (Histo-Chem, Jefferson, AR) (Nguyen et al., 2001).
Results
Microglia upregulate TLR2 in response to axonal injury
TLR2 was constitutively expressed in the hippocampus, because mRNA was easily detectable in unmanipulated and contralateral hippocampus by quantitative RT-PCR (Fig. 1 A) (data not shown). After axonal injury, TLR2 mRNA was significantly upregulated in the lesion-reactive hippocampus by 3 h, relative to the unlesioned hippocampus in the contralateral hemisphere of the brain (Fig. 1 A). We localized TLR2+ cells to the molecular layers of the hippocampus, where axons and terminals break down and glia become activated, showing positive signal by in situ hybridization (ISH) at 3 h (supplemental Fig. 1_A_, available at www.jneurosci.org as supplemental material), and by fluorescence microscopy at 3 d (Fig. 1 E_–_H; supplemental Fig. 1_B_, available at www.jneurosci.org as supplemental material). Flow cytometric staining showed that CD11b+CD45dim microglial cells upregulated TLR2 at 24 h after lesion, relative to the contralateral hippocampus (Fig. 1 B,C) or unmanipulated hippocampus or cortex (data not shown), and that GFAP-positive cells did not upregulate TLR2 (Fig. 1 D). TLR2-expressing cells were identified as microglia in tissue sections by double immunofluorescent staining with iba-1 (Fig. 1 E,G). Although not all of the iba-1-positive cells (Fig. 1 E,G, green cells) in the region of glial response stained positive for TLR2, it appeared that only microglia expressed TLR2, because there were no red cells that did not coincide with green (Fig. 1 E,G). Importantly, there was no detectable double staining with anti-GFAP antibody (Fig. 1 F,H). The greater sensitivity of flow cytometry accounts for the shift in staining of the whole microglial population in Figure 1 C, not just the high expressing cells that were detected by immunofluorescence in Figure 1 E. TLR2-stained cells were undetectable by fluorescence microscopy in the contralateral unlesioned hippocampus (data not shown), and only weak staining was detected by flow cytometry (Fig. 1 B,C). Given this greater sensitivity, the lack of signal by flow cytometry underlines that, in this system, astrocytes did not upregulate TLR2.
Figure 1.
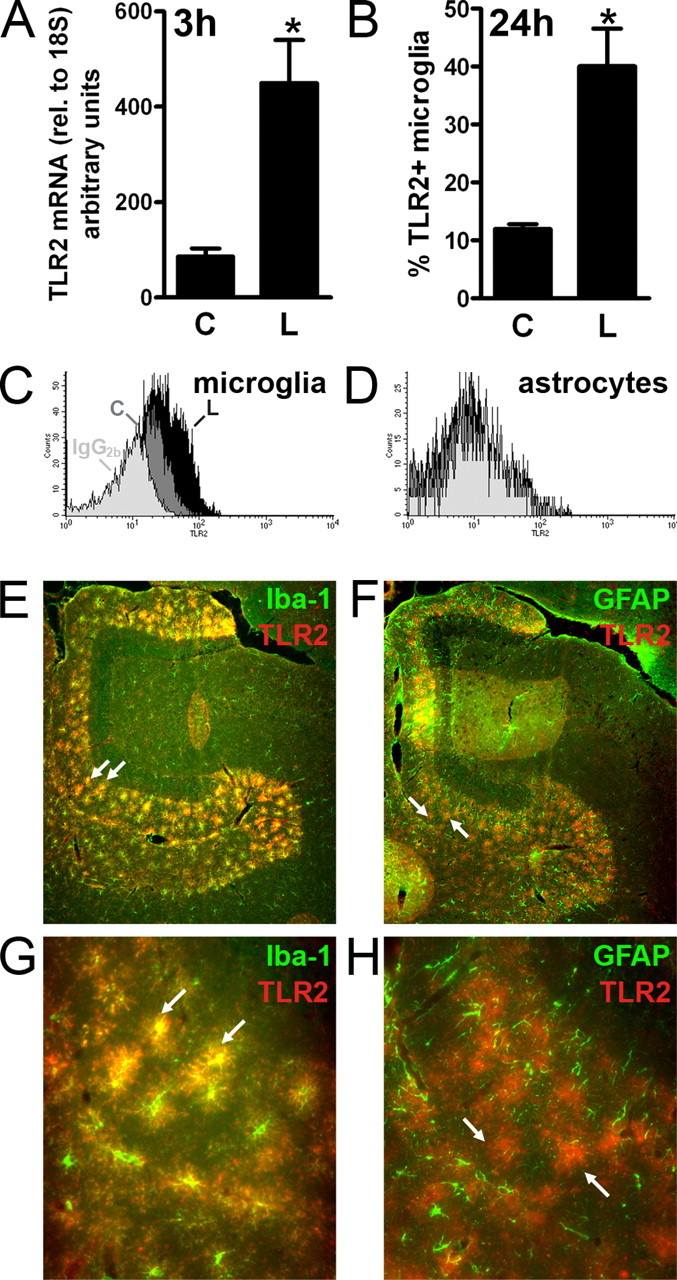
TLR2 is upregulated by microglia in denervated zones of the hippocampus. A, Levels of TLR2 mRNA, measured by quantitative RT-PCR and normalized to 18S, were increased in lesion-reactive hippocampi (L) from C57BL/6 mice relative to contralateral hippocampi (C) at 3 h (n = 10). Results are expressed as mean ± SE. B, Flow cytometric quantification of percentage CD11b+CD45dim microglia from contralateral (C) and lesion-reactive (L) hippocampi that stained with a monoclonal antibody specific for TLR2 24 h after lesion (n = 4). Asterisks in A and B indicate statistically significant differences between C and L (p < 0.05). C, Representative histogram overlay shows positive staining with anti-TLR2 of CD11b+CD45dim microglia from lesion-reactive hippocampus (L) (black profiles) versus staining of microglia from contralateral hippocampus (C) (dark gray profiles), relative to background staining with an IgG2b isotype control antibody (light gray profiles). D, Similar to C except that TLR2 staining was gated on GFAP+ cells. E, G, Immunofluorescence photomicrographs of the outer molecular layer of the dentate gyrus from a lesion-reactive hippocampus, stained with anti-iba-1 (green) and anti-TLR2 (red), 3 d after lesion. The zone of glial reactivity is clearly defined by reactive iba-1+ microglia. Many of these are double stained for TLR2, with the combined green and red fluorescence shown as yellow (2 examples are indicated by arrows). F, H, Similar to E, G, except that reactive astrocytes are stained in green with anti-GFAP. Reactive astrocytes and microglia define an overlapping zone of glial response. Reactive astrocytes do not double stain with anti-TLR2, because green and red cells do not coincide. The arrows indicate two examples of TLR2+ (red) cells that do not express GFAP. Original magnifications: E, F, 10×; G, H, 40×.
We also examined the expression of other surface molecules and intracellular proteins associated with signaling through TLR2. Both TLR1, which, like TLR6, can dimerize with TLR2, and CD14, a coreceptor for either TLR2 or TLR4 (Ozinsky et al., 2000; Werts et al., 2001; Asea et al., 2002; Akira and Takeda, 2004) were constitutively expressed and upregulated after axonal injury (supplemental Fig. 1_C_,D, available at www.jneurosci.org as supplemental material). TLR1+2 heterodimer signaling is implicated in inflammatory cytokine responses (Sandor et al., 2003). TLR6 expression was not examined. Detection of MyD88 and IκBα mRNA by quantitative RT-PCR and ISH, respectively, (supplemental Fig. 1_E_,F, available at www.jneurosci.org as supplemental material), is consistent with downstream signaling by TLRs in microglia at these times, although these intermediates may also be involved in other signaling pathways.
The early increase in TLR2 expression by microglia pointed to a specific role for TLR2 in directing the neuroinflammatory response to axonal injury, and prompted us to examine responses in TLR2-deficient mice.
TLR2 selectively regulates early cytokine and chemokine expression
We compared early glial cytokine and chemokine expression in the lesion-reactive hippocampus of C57BL/6 wild-type and TLR2-deficient mice at 3 h after lesion. There is no significant infiltration of blood-derived leukocytes to the hippocampus as early as 3 h (Babcock et al., 2003), so CNS-resident cells are the most likely sources of cytokines and chemokines at this time. Rapid upregulation of transcripts for the cytokines TNFα (30-fold increase) and IL-1β (10-fold increase) occurred in the lesion-reactive hippocampus of wild-type mice, relative to contralateral hippocampi (Fig. 2 A). Strikingly, TNFα mRNA levels were greatly diminished in hippocampi from TLR2-deficient mice, which expressed only ∼30% of levels seen in wild-type controls (Fig. 2 A). TNFα levels remained significantly lower in TLR2-deficient mice at 24 h (Fig. 2 D). IL-1β mRNA levels were similar in wild-type and TLR2-deficient mice at 3 h (Fig. 2 A) and 24 h (data not shown).
Figure 2.

Selective effects of TLR2 signaling on early cytokine/chemokine expression induced by axonal injury. Cytokine and chemokine transcripts were measured in contralateral (C) and lesion-reactive (L) hippocampi from WT and TLR2-deficient mice by quantitative real-time PCR (A, C, D, G; n = 7–10) or RPA (B, E, F; n = 3) at times indicated (3 h, 24 h, or 3 d). Cytokine and chemokine mRNA levels measured by real-time PCR were normalized to 18S, and those measured by RPA to levels of L32. Values are expressed as arbitrary units and cannot be compared between panels. Results are expressed as mean ± SE. NS, Not statistically significant. *p < 0.05.
We also examined the effects of TLR2 deficiency on early lesion-induced chemokine expression, by RPA. Compared with wild-type mice, lesion-induced levels of CCL3, CCL4, CXCL2, and CXCL10 mRNA were significantly reduced in the absence of TLR2 signaling (Fig. 2 B). In contrast, mRNA levels of the chemokine CCL2 were similar in hippocampi from wild-type and TLR2-deficient mice (Fig. 2 B). CCL5 levels, which do not show an early increase after lesion (Babcock et al., 2003), were also similar in wild-type and TLR2-deficient mice at 3 h. The chemokines CXCL10 and CCL2 have been specifically implicated in leukocyte entry to the CNS (Babcock et al., 2003; Christensen et al., 2004). We confirmed, using quantitative RT-PCR, that expression of CXCL10, but not CCL2, was reduced in absence of TLR2 at 3 h (Fig. 2 C).
Together, these results show that absence of TLR2 selectively reduces early cytokine and chemokine responses to axonal injury. Whereas TNFα and several chemokines are significantly dependent on TLR2 signaling, CCL2 and IL-1β are TLR2 independent. Cytokine/chemokine expression is therefore triggered by at least two signaling pathways.
TLR2 regulates T cell infiltration but not macrophage recruitment
We then examined leukocyte infiltration in response to axonal degeneration in TLR2-deficient mice relative to wild-type controls. We have previously shown that CCL2-driven macrophage infiltration begins at 12 h after lesion, whereas entry by T cells starts at 24 h (Babcock et al., 2003). T cells have been stained in the lesion-reactive hippocampus by others (Bechmann et al., 2001), as well as in other lesion-reactive regions of the CNS (Raivich et al., 1998). Infiltrating cells enter the parenchyma in denervated zones by crossing the glia limitans that surrounds blood vessels (Bechmann et al., 2005).
The small proportion of CD11b+CD45high macrophages detected in contralateral unlesioned hippocampus rapidly increased in the lesion-reactive hippocampus after axonal injury in wild-type mice (Fig. 3 A,B). This population was clearly distinguishable from the resident CD11b+CD45dim resident population, even by 8 d after axotomy (Fig. 4 A, compare top right, bottom right quadrants) Consistent with previous observations (Babcock et al., 2003), macrophage proportions peaked in the lesion-reactive hippocampus of wild-type mice at 2 d, and had begun to decrease by 5 d (Fig. 3 A,B). Macrophage recruitment was unaffected by TLR2 deficiency. Similar macrophage proportions were observed in lesion-reactive hippocampi of TLR2-deficient and wild-type mice at 24 h, 2 d, 5 d, and 8 d (Fig. 3 A,B) (data not shown). Analysis of mean numbers (±SE) of macrophages also showed no significant differences between lesion-reactive hippocampi from wild-type and TLR2-knock-out mice at 24 h (464 ± 135 vs 396 ± 111, respectively) or 8 d (226 ± 23 vs 207 ± 25, respectively), compared with ∼100 cells detected in contralateral hippocampi (n = 6–9/group). Both strains also showed equivalent upregulation of macrophage-associated MMP12 mRNA at 24 h (data not shown) (Toft-Hansen et al., 2004). Together with our observation that early CCL2 expression is TLR2 independent, these data suggest that TLR2 does not regulate CCL2-driven macrophage infiltration in response to axonal injury.
Figure 3.

TLR2 deficiency delays infiltration by T cells but not macrophages. Flow-cytometric evaluation of the proportion of CD11b+CD45high macrophages at 2 d (A) and 5 d (B) after lesion in contralateral (C) and lesion-reactive (L) hippocampi showed no differences in macrophage infiltration between WT and TLR2-deficient (TLR2 KO) mice (n = 7). C, Flow cytometry profiles show an increased proportion of TCRβ+CD45high T cells (boxes) in lesion-reactive hippocampus (L) versus contralateral hippocampus (C) at 2 d after lesion. Quantification of proportions of TCRβ+ cells at 2 d (D), 5 d (E), and 8 d (F) revealed delayed T cell infiltration in TLR2-deficient mice (n = 6–8). G, Analysis of TNFR1-deficient (TNFR1 KO) mice at 2 and 5 d after lesion shows delayed lesion-induced T cell recruitment, as for TLR2-deficient mice. Data are presented as T cell proportions in the lesion-reactive hippocampus relative to the contralateral hippocampus, on an individual mouse basis. Results are expressed as mean ± SE. NS, Not statistically significant. *p < 0.05.
Figure 4.

TLR2 deficiency impairs microglial expansion. A, The proportion of CD11b+CD45dim microglia increased in lesion-reactive hippocampi (L) from wild-type mice (WT) relative to contralateral hippocampi (C) after axonal lesion (bottom right quadrants; shown for 8 d after lesion). Microglia were clearly distinguished from macrophages (mφ), which expressed higher levels of CD45 (CD45high; top right quadrants). B, Quantification shows that percentage increase in microglial expansion relative to the contralateral hippocampus became statistically significant from 2 d after lesion and that expansion at 2 and 5 d was similar in TNFR1-deficient mice as in WT. Expansion was significantly reduced in TLR2-deficient mice at 2 and 5 d but returned to WT levels at 8 d (n = 5–16, except 90 d where n = 2). Results are expressed as mean ± SE. *p < 0.05.
Importantly, however, TLR2 deficiency affected the T cell response to axonal injury. At 2 d after lesion, T cells consistently infiltrated the hippocampus of wild-type mice (Fig. 3 C,D). This represented an increase from ∼100 T cells in control hippocampi to ∼300 T cells in the lesion-reactive hippocampus. The detection of a small number of T cells in the contralateral hippocampus is consistent with published reports (Brabb et al., 2000). The number of T cells that enter would be sufficient to induce biological effect, if activated. Consistent with previous observations (Babcock et al., 2003), T cell proportions declined slightly from 2 to 5 d in wild-type mice (Fig. 3 D,E). Unlike wild-type mice, significant lesion-induced T cell recruitment did not occur in TLR2-deficient mice at 2 d after lesion (Fig. 3 D). TLR2-deficient mice showed recovery of T cell response by 5 d after lesion (Fig. 3 E). T cell proportions were significantly higher in TLR2-deficient mice than in wild-type mice at 5 d, but were similar to T cell proportions at 2 d in wild-type mice. At 8 d after lesion, T cell infiltration remained equivalently elevated in the lesion-reactive hippocampus of both TLR2-deficient and wild-type mice, and there was no longer a significant difference in T cell recruitment between TLR2-deficient and wild-type mice (Fig. 3 F). Together, these data suggest that TLR2 deficiency delays T cell infiltration, and that macrophage and T cell recruitment are directed by separate pathways. Whereas TLR2 signaling regulates T cell entry, macrophage infiltration occurs via a TLR2-independent pathway.
TNFR1 deficiency mimics effect of TLR2 deficiency on T cell infiltration
To address mechanism for delayed T cell entry at 2 d, we asked whether TNFα played a role, because this cytokine has been described to induce chemokines that promote T cell entry to the CNS (Murphy et al., 2002). Mice deficient in the TNFR1 receptor, previously implicated in CNS inflammation (Eugster et al., 1999), were lesioned, and T cell entry to the hippocampus evaluated at 2 and 5 d after lesion. Results were strikingly similar to what was observed in TLR2-deficient mice, with a delay in lesion-induced T cell recruitment at 2 d and a rebound at 5 d (to levels equivalent to WT at 2 d) (Fig. 3 G). Like TLR2-deficient mice, TNFR1 deficiency also had no effect on macrophage recruitment (data not shown). This points to a role for TNFα in TLR2 regulation of T cell entry. We then asked whether this might correlate to potential TNFα-driven chemokine responses. Chemokine RPA data showed that, whereas overall levels of all chemokine messages were reduced by 24 h (data not shown), levels of CCL4, reduced in TLR2-deficient mice at 3 h, were now equivalent to controls (Fig. 2 E). CCL4 has been implicated in T cell entry to the CNS in experimental autoimmune encephalomyelitis (EAE) (Babcock and Owens, 2003), and is induced in the CNS by TNFα (Glabinski et al., 2003). At 24 h, levels of CXCL10 remained lower in TLR2-deficient mice, whereas CCL5 levels were equivalent in knock-out and wild-type mice (Fig. 2 F) (data not shown). Additional analysis by real-time PCR showed that CXCL10 levels became equivalent, and CCL5 levels remained equivalent, in TLR2-deficient and wild-type mice at 3 d after lesion (Fig. 2 G) (data not shown). Together, these data identify TNFα and at least three chemokines as candidate mediators whose relative levels regulate early T cell entry in response to injury. Whether these mediators act via a cascade has not been determined.
TLR2 regulates responses by microglia
Expansion of the microglial population occurs in the lesion-reactive hippocampus after axonal injury. A number of studies have shown that this results from proliferation by resident microglia, migration into denervated zones, and by differentiation of blood-derived cells into ramified or CD45dim microglia (Jensen et al., 1994; Hailer et al., 1999; Rappert et al., 2004; Bechmann et al., 2005; Ladeby et al., 2005b; Wirenfeldt et al., 2005). Microglial expansion can be detected using flow cytometry to compare the proportion of CD45dim microglia in the lesion-reactive hippocampus to that in the contralateral hippocampus (Fig. 4 A). Such analyses identify a statistically significant increase in microglial expansion by 2 d after lesion (n = 16), but not at earlier times (Fig. 4 B). In wild-type mice, the microglial population increased by 37% at 2 d, reaching a 70% increase after 5 d (Fig. 4 B). In contrast, microglial expansion in hippocampi from TLR2-deficient mice showed increases of only 16 and 37% at 2 and 5 d, respectively, significantly less than what was observed in wild-type controls (Fig. 4 B). At 8 d, microgial expansion was equivalent in wild-type and TLR2-deficient mice, both showing increases of ∼60% (63 vs 50%) (Fig. 4 B). There was no statistically significant difference in mean numbers of microglia in lesion-reactive hippocampi at 8 d (33,857 ± 2148 in wild-type vs 35,000 ± 2166 in TLR2-knock-out, compared with ∼23,000 in contralateral hippocampi; n = 6–9 per group). Interestingly, microglial expansion was unaffected in TNFR1-deficient mice at 2 and 5 d (Fig. 4 B). The zone of microglial reactivity, clearly delineated in wild-type mice, was less well defined in TLR2-deficient mice (Fig. 5 A,B). Occasional CD11b+ or CD45+ (supplemental Fig. 2, available at www.jneurosci.org as supplemental material) cells that can be seen in the dentate gyrus likely include both macrophages and activated microglia.
Figure 5.
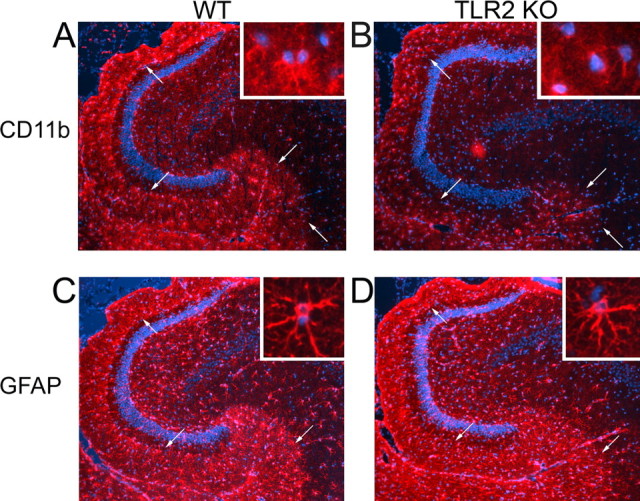
TLR2 signaling affects microglial, but not astroglial reactivity in denervated zones. A_–_D, CD11b (A, B) and GFAP (C, D) staining in lesion-reactive hippocampi of WT and TLR2-deficient mice at 5 d after lesion (n = 4). The arrows delineate reactive zones. The insets show high magnification images of microglia and astrocytes from the denervated outer molecular layer of the dentate gyrus. A, Inset, shows a cell doublet, consistent with proliferation, and an isolated CD11b+ cell. The morphology of cells identified by nuclear staining in the inset in B is less clearly defined because of weak CD11b staining. The GFAP staining shows the well defined laminar organization of glial response characteristic of the entorhinal lesion. Original magnification, 10 and 40×.
We asked whether early microglial responses were also affected by TLR2 signaling, because TLR2 deficiency had a profound effect on cytokine and chemokine expression within the first 24 h of injury. Given that bone marrow chimera studies showed that the CD45dim microglial population was mostly supplemented by immigrating cells after 5 d (Wirenfeldt et al., 2005) and that migration from adjacent hippocampal zones (Jensen et al., 1994; Rappert et al., 2004) could not account for observed effects in entire hippocampal isolates, we asked whether TLR2 deficiency affected microglial proliferation. Lesion-induced proliferation of the CD11b+CD45dim microglial population became detectable at 24 h, as measured by BrdU incorporation detected by flow cytometry (Fig. 6 A), approaching statistical significance in wild-type mice (p = 0.051). In contrast, the number of BrdU+ microglia was unchanged in lesioned TLR2-deficient mice (p = 0.459), and the difference in the number of proliferating microglia in the lesion-reactive hippocampus of wild-type and TLR2-deficient mice was statistically significant (Fig. 6 A). Thus, TLR2 signaling regulates early microglial proliferative expansion. By 8 d, both wild-type and TLR2-deficient mice showed equivalent BrdU-assayed microglial proliferation in the lesion-reactive hippocampus (data not shown), consistent with equivalence in microglial numbers at this time. Proliferative responses are known to have mostly subsided by 10 d (Hailer et al., 1999).
Figure 6.
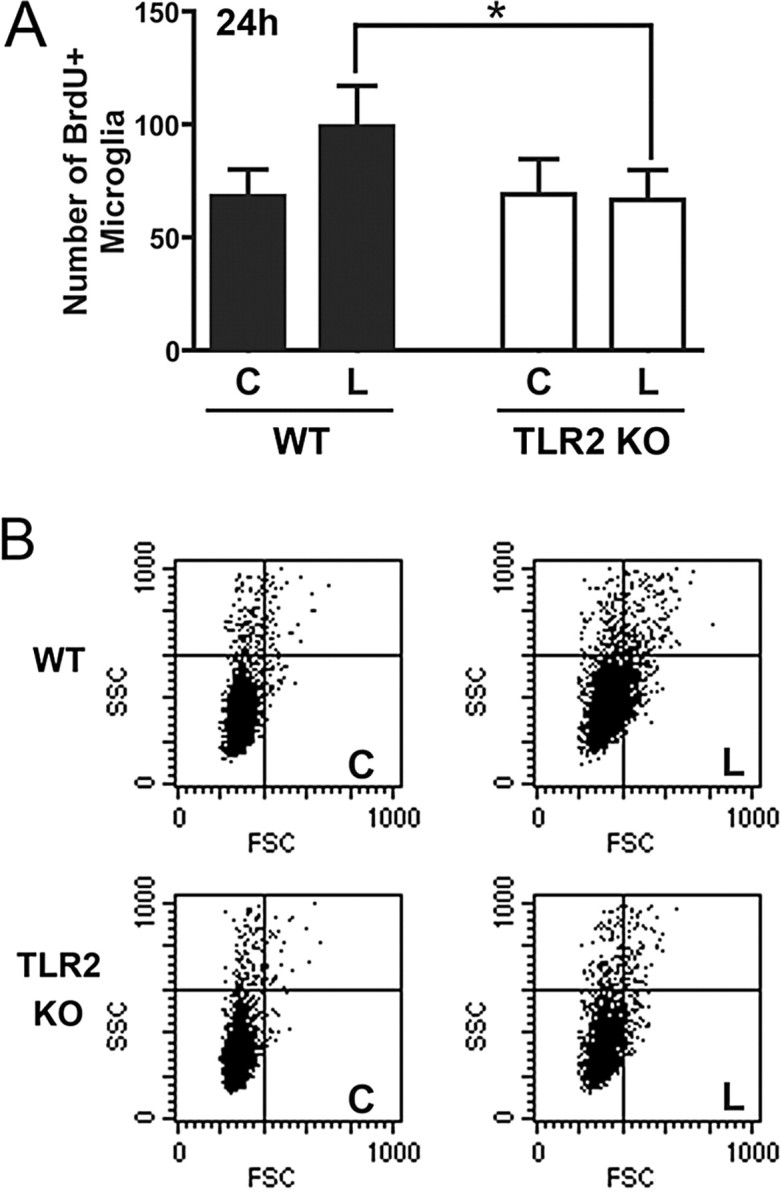
TLR2 deficiency impairs early microglial response. A, Microglial proliferation was assessed by BrdU incorporation by CD11b+CD45dim microglia in the lesion-reactive (L) and contralateral (C) hippocampi of WT and TLR2-deficient (TLR2 KO) mice at 24 h. Results are expressed as mean ± SE. *p < 0.05. B, The physical properties of microglial populations in contralateral and lesion-reactive hippocampi are shown on FSC/SSC dot plots, which are gated on CD11b+CD45dim (microglial) cells.
Flow cytometry was additionally used to examine physical properties of the microglial population at 24 h, because most cell surface markers are upregulated at later times and glial morphology in tissue sections is difficult to quantify. Microglial activation induces characteristic changes in FSC, which correlates with cell size, and SSC, which is indicative of cellular complexity (e.g., physical characteristics of nucleus, cytoplasm, and membrane) (Sedgwick et al., 1998). Within 24 h after lesion, increases in population FSC and SSC were clearly seen in CD11b+CD45dim microglia from lesion-reactive hippocampi of wild-type mice (Fig. 6 B, compare C and L for wild-type). Increased microglial FSC/SSC was less pronounced in the lesion-reactive hippocampus of TLR2-deficient mice (Fig. 6 B), and this difference was statistically significant (Table 1). The FSC/SSC characteristics of microglia were followed through 8 d after lesion (Table 1). Responses peaked by 2 d in both mice, and had mostly diminished by 8 d. The transient increase in SSC for TLR2-deficient microglia at 5 d did not correspond to patterns of cell expansion (Fig. 4 B) or FSC characteristics. The TLR2-dependent reduction in microglial response at 24 h was therefore transient, as were other aspects of the injury-induced inflammatory response in TLR2-deficient mice.
Table 1.
FSC and SSC changes in the microglial population after axonal lesion
| 24 h | 2 d | 5 d | 8 d | |
|---|---|---|---|---|
| % Increase FSC | ||||
| WT | 9.7 ± 0.8 | 22.6 ± 1.4 | 8.3 ± 1.1 | 3.5 ± 1.1 |
| TLR2 KO | 5.5 ± 1.0* | 22.7 ± 3.2 | 7.0 ± 1.6 | 5.5 ± 0.7 |
| % Increase SSC | ||||
| WT | 10.2 ± 1.7 | 33.9 ± 3.0 | 19.4 ± 1.1 | 6.5 ± 2.0 |
| TLR2 KO | 4.8 ± 1.6* | 33.9 ± 5.2 | 25.8 ± 2.9* | 7.1 ± 1.7 |
We also examined whether TLR2 signaling regulated responses by astrocytes. Astrocytes did not upregulate TLR2, and astroglial activation appeared similar in wild-type and TLR2-deficient mice, based on the reactivity of GFAP+ cells in denervated zones (Fig. 5 C,D). Astrocyte proliferation in denervated rat hippocampus peaks at 7 d, later than the microglial peak (Hailer et al., 1999). Flow cytometric analysis of BrdU incorporation and FSC/SSC changes by GFAP-stained cells at 8 d indicated that astrocyte proliferation was detectable, as an approximate doubling of the number of BrdU+GFAP+ cells and an increase in FSC and SSC, but that neither of these indices of astrogliosis was affected by TLR2 deficiency (supplemental Fig. 3, available at www.jneurosci.org as supplemental material).
TLR2 does not influence the lesion-induced reorganization of AChE-positive fibers
To determine whether TLR2 deficiency affected neuronal plasticity, we stained AChE-positive septohippocampal fibers that are left intact by the lesion. Increased intensity of AChE, found in cholinergic fibers, in the outer molecular layer of the dentate gyrus is associated with a postlesional plasticity response (Steward, 1992; Fagan and Gage, 1994; Drojdahl et al., 2002). At both 5 d (data not shown), before this response is easily detectable, and at 20 d after axotomy (Fig. 7 A,B), when the response is well developed, there was no difference in the lesion-induced increase in AChE intensity in the dentate gyrus of TLR2-deficient and wild-type mice. In addition, the distribution of AChE-positive fibers was similar in unmanipulated dentate gyrus from TLR2-deficient and wild-type mice (Fig. 7 C,D). We confirmed that lesion-induced neuronal pathology was equivalent in wild-type and knock-out mice using Fluoro-Jade staining of degenerating axons and terminals (data not shown).
Figure 7.
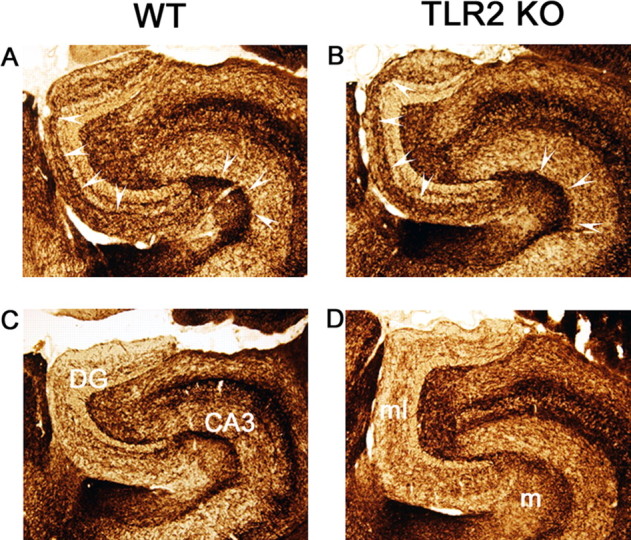
TLR2 deficiency has no effect on lesion-induced plasticity of AChE-positive cholinergic afferents. AChE staining of lesion-reactive (top panels) and unlesioned contralateral (bottom panels) hippocampus from WT (A, C) and TLR2-deficient (TLR2 KO) (B, D) mice. The arrowheads delineate the characteristic lesion-induced increase in AChE staining intensity in the inner part of the outer molecular layer of the dentate gyrus (DG), and in the molecular layer (m) of CA3. AChE staining is similar in TLR2-deficient and wild-type mice, 20 d after lesion. ml, Dentate molecular layer; m, stratum moleculare of CA3. Original magnification, 10×.
TLR4 signaling does not regulate the innate response to axonal injury
We then addressed whether the neuroinflammatory response was regulated by signaling through TLR4, which we found to be constitutively expressed in the hippocampus but not upregulated after axonal injury (Fig. 8 A). Expression of TNFα (Fig. 8 B) and CXCL10 (data not shown), both reduced by TLR2 deficiency, were not significantly different in hippocampi from TLR4-defective mice and their wild-type controls. CCL2 was also unaffected by TLR4 deficiency (Fig. 8 C). There was no difference in infiltration by T cells or macrophages at 1, 2, or 5 d after lesion, and no inhibition of microglial expansion at 5 d (Fig. 8 D_–_F) (data not shown). Therefore, TLR4 signaling does not appear to regulate the endogenous hippocampal glial response to entorhinal axonal lesion.
Figure 8.

TLR4 signaling does not regulate innate responses to axonal injury. Quantitative RT-PCR showing no increase in TLR4 mRNA in lesion-reactive (L) versus contralateral (C) hippocampi in C57BL/6 (WT) mice (n = 9) (A), and no difference in TNFα (B) or CCL2 (C) levels between C3H/HeJ (TLR4-defective) and C3H/HeN (WT) mice at 3 h after lesion, after normalization to 18S. Flow cytometry showed similar proportions of infiltrating macrophages at 24 h (D) and T cells at 2 d (E), as well as microglial expansion at 5 d (F). Results are expressed as mean ± SE. NS, Not statistically significant. *p < 0.05.
Discussion
We have identified a role for TLR2 in the initial microglial response to axonal injury. We show that endogenous signaling by TLR2, but not TLR4, strongly impacts early glial cytokine and chemokine responses, and controls kinetics of T cell recruitment and of reactivity/expansion of the microglial population. Our data identify two pathways for initial response to axonal injury: (1) TLR2-dependent regulation of microglial response and T cell recruitment, and (2) TLR2-independent macrophage entry and astrocyte response (supplemental Fig. 4, available at www.jneurosci.org as supplemental material).
There is much interest in the role of TLRs in the CNS (Kielian, 2006). TLR2 signaling has been implicated in microglial responses such as are associated with repair via clearance of myelin debris in the denervated hippocampus (Bechmann and Nitsch, 2000; Drojdahl et al., 2002; Fenger et al., 2006). Phagocytes were shown to contain the TLR2 ligand peptidoglycan within multiple sclerosis lesions (Schrijver et al., 2001), and to use the TLR2/4 coreceptor CD14 to bind and phagocytose fibrillar β-amyloid (Fassbender et al., 2004; Liu et al., 2005), making CD14 and TLRs potential therapeutic targets in the injured or diseased CNS. Defects in phagocytic clearance mechanisms are implicated in failed CNS regeneration (Steward, 1992; David and Lacroix, 2003) and in amyloid plaque-induced neurotoxicity (Streit, 2004). Consistent with the transient effects of TLR2, we detected no changes in long-term reorganization of AChE-containing, cholinergic septo-hippocampal fibers and terminals in the lesion-reactive dentate gyrus. However, this does not preclude that TLR2 might influence neuronal survival, regeneration, or neurogenesis in other models, and indeed TLR ligands exert both beneficial and pathological effects in the CNS. Administration of the TLR2 ligand zymosan promoted regeneration after optic nerve crush injury (Leon et al., 2000), and systemic injection of the TLR4 ligand LPS accelerated myelin clearance in the injured spinal cord (Vallieres et al., 2005). Intrahippocampal LPS injections enhanced β-amyloid clearance in aged transgenic mice that develop Alzheimer's disease-like pathology (DiCarlo et al., 2001; Malm et al., 2005), although contradictory results were obtained in younger mice (Qiao et al., 2001). In contrast, direct injection of TLR ligands into the healthy brain or spinal cord induced robust inflammation that caused tissue damage and, in some cases, behavioral deficits (Szczepanik et al., 1996; Fitch et al., 1999; Popovich et al., 2002). TLR4 and TLR9 ligands may mediate neuronal and oligodendrocyte injury indirectly, via effects on microglia (Lehnardt et al., 2002, 2003; Iliev et al., 2004).
The selective effects of TLR2 deficiency in our study are of interest. It is tempting to ascribe the selective effects on leukocyte entry (viz., delayed T cell infiltration without effect on macrophage recruitment) to specific regulation of glial cytokine/chemokine expression. Our finding that TLR2 signaling impacts expression of several chemokines, but not CCL2, mirrors findings in dendritic cells (Re and Strominger, 2001) and cultured microglia (Olson and Miller, 2004). Leukocyte infiltration was previously shown to be dependent on CCL2 signaling through its receptor, CCR2 (Babcock et al., 2003) (A. A. Babcock and T. Owens, unpublished observations). Cytokines such as IL-1β that were unaffected by TLR2 deficiency also may have contributed to macrophage entry.
The identity of TLR2-regulated chemotactic signal(s), and whether they are directly induced by TLR2 signaling or indirectly via cytokines such as TNFα, is of interest. That an identical delay in T cell entry was seen in TNFR1- and TLR2-deficient mice points to a role for TNFα. The TNFR1 receptor is implicated in transducing TNFα-induced proinflammatory signals (Eugster et al., 1999). An analogous delay in chemokine induction and T cell entry has been described in TNFα-deficient mice with EAE (Murphy et al., 2002). Because TNFα and a number of chemokines (CXCL10, CXCL2, CCL3, CCL4) were significantly reduced, but not completely ablated in TLR2-deficient mice, it is also possible that residual lower cytokine and/or chemokine levels provoked eventual T cell recruitment, to restore T cell response by 5 d. Alternatively, compensatory signals may restore chemokine levels at later times, as was seen for CCL4 (24 h) and CXCL10 (3 d), and this recovery may contribute to rebound of T cell entry. CXCL10 is a strong candidate for recruiting T cell response (Dufour et al., 2002; Christensen et al., 2004). Activated T cells express the CXCL10 receptor, CXCR3. Studies in EAE suggest that other CXCR3 ligands (CXCL9 and CXCL11) may compensate for CXCL10 deficiency (Klein et al., 2004); however, these were not induced after entorhinal cortex lesion (Rappert et al., 2004). CCL4, CCL3, and CCL5 likely do not mediate T cell recruitment via the CCR5 receptor, which we have shown to be unnecessary (Babcock et al., 2003), but could potentially affect T cell recruitment via CCR1. CCL5 is important for T cell trafficking and was unaffected by TLR2 deficiency. Upregulation of CXCL2 was TLR2 dependent, although CXCL2 predominantly acts on neutrophils (Babcock and Owens, 2003). In the absence of detailed information on the cellular source of each cytokine and chemokine, a model based on direct effects of TLR2-expressing microglia must remain speculative, although we did not identify any other TLR2-expressing cell type. Finally, regulation of levels of expression of adhesion molecules that guide T cell entry to the CNS may also have played a role.
TLR2 signaling also regulated early stage microglial activation and expansion after injury, but its effect was only transient. The kinetics of response suggested that TLR2 regulated proliferation, rather than in entry of circulating precursors (Hailer et al., 1999; Bechmann et al., 2005; Ladeby et al., 2005b; Wirenfeldt et al., 2005). Immunohistochemical studies in rats suggested that microglial proliferation begins at ∼24 h (Fagan and Gage, 1994), and we showed that lesion-induced microglial proliferation was significantly reduced in TLR2-deficient mice at this time, compared with wild-type mice. We also noted that changes in physical properties of the microglial population at 24 h were inhibited by TLR2 deficiency. Microglia stimulated with the TLR2 ligand lipoteichoic acid developed ruffled membranes and proliferated in vitro (Jiang-Shieh et al., 2005), so it is also possible that lack of direct TLR2-induced nuclear factor κB (NFκB) signaling contributed to reduced microglial activation/proliferation. The lack of effect of TNFR1 deficiency on microglial response is consistent with that interpretation, because TNFR1 can signal via an NFκB-independent pathway, and also with other results in the same lesion model (Fenger et al., 2006). We do not know whether TLR2 associates with TLR1 or TLR6 for the responses we have studied. Restoration of microglial response in the case of direct TLR2 signaling would be most economically explained by redundancy in TLR signals. Recovery of levels of microglial-activating chemokines may restore microglial numbers at 8 d, just as for T cells. Additional studies should resolve these issues.
Microglia constitutively expressed TLR2 and rapidly upregulated this receptor after axonal injury. The kinetics of response suggests that early effects on TNFα and chemokine expression were attributable to constitutive TLR2 expression. Both astrocytes and microglia have been shown to express TLRs in vitro (Olson and Miller, 2004; Carpentier et al., 2005; Jack et al., 2005). However, by immunofluorescence microscopy and flow cytometry, we failed to find evidence that astrocyte responses showed TLR2 dependence, unlike for microglia. Upregulation of TLR2 after axonal lesion may enhance microglial responses to degenerating axons. Enhanced capacity for response may also occur during motor neuron degeneration or after pilocarpine-induced seizures, in which microglial upregulation of TLR2 has been described (Nguyen et al., 2001; Turrin and Rivest, 2004).
Several endogenous TLR2 ligands have been proposed, including heat shock proteins, necrotic cells, fatty acids, and the transcription factor high mobility group box 1 (Li et al., 2001; Asea et al., 2002; Gordon, 2002; Lee et al., 2004; Tsan and Gao, 2004; Rifkin et al., 2005). Release of such “danger signals” (Matzinger, 2002) from injured axons may initiate the innate CNS response. The lipid-rich CNS environment is a likely source of potential ligands for TLR2, most TLR ligands being strongly hydrophobic (Seong and Matzinger, 2004). Concern over endotoxin contamination has made it difficult to conclusively demonstrate a role for heat shock proteins in endogenous TLR signaling (Tsan and Gao, 2004). This was not a factor in our model, because CNS responses were similar in TLR4-defective mice and wild-type controls. Although it is difficult to completely rule out trace amounts of contaminants carried into the CNS, we feel that this is not a concern. The innate responses that we measured were distal from the actual site of tissue injury, and remained protected by the blood–brain barrier (Fagan and Gage, 1994; Jensen et al., 1997).
There is growing appreciation that TLRs play pathogen-independent roles. TLR2 affected ventricular remodeling after myocardial infarction (Shishido et al., 2003) and TLR4 regulated behavioral hypersensitivity in models of painful neuropathy (Tanga et al., 2005) and the inflammatory response to liver ischemia/reperfusion (Zhai et al., 2004). Evolutionary forerunners of TLRs in Drosophila have endogenous roles in dorsoventral patterning and neural functions; few are implicated in generation of immune response (Brennan and Anderson, 2004). The concept of pattern recognition may extend to host-derived ligands (Gordon, 2002). Endogenous TLR2 signaling is now shown to influence responses to CNS injury, in addition to its well established role in protecting against infection.
Footnotes
This work was supported by the Multiple Sclerosis Society of Canada. A.A.B., H.T.-H., and J.M.M. received studentships from the Multiple Sclerosis Society of Canada, H.H.N. was funded by the Danish Multiple Sclerosis Society, and L.D.-O. was funded by the Warwara Larsen Fond. We thank Lyne Bourbonniere and Dr. Simone Zehntner for assistance with RNase protection assays, and Lene Jørgensen and Lise Lyck for help with tissue sectioning and immunohistochemical protocols.
References
- Akira and Takeda, 2004.Akira S, Takeda K. Toll-like receptor signalling. Nat Rev Immunol. 2004;4:499–511. doi: 10.1038/nri1391. [DOI] [PubMed] [Google Scholar]
- Asea et al., 2002.Asea A, Rehli M, Kabingu E, Boch JA, Bare O, Auron PE, Stevenson MA, Calderwood SK. Novel signal transduction pathway utilized by extracellular HSP70: role of toll-like receptor (TLR) 2 and TLR4. J Biol Chem. 2002;277:15028–15034. doi: 10.1074/jbc.M200497200. [DOI] [PubMed] [Google Scholar]
- Babcock and Owens, 2003.Babcock A, Owens T. Chemokines in experimental autoimmune encephalomyelitis and multiple sclerosis. Adv Exp Med Biol. 2003;520:120–132. doi: 10.1007/978-1-4615-0171-8_8. [DOI] [PubMed] [Google Scholar]
- Babcock et al., 2003.Babcock AA, Kuziel WA, Rivest S, Owens T. Chemokine expression by glial cells directs leukocytes to sites of axonal injury in the CNS. J Neurosci. 2003;23:7922–7930. doi: 10.1523/JNEUROSCI.23-21-07922.2003. [DOI] [PMC free article] [PubMed] [Google Scholar]
- Bechmann and Nitsch, 2000.Bechmann I, Nitsch R. Involvement of non-neuronal cells in entorhinal-hippocampal reorganization following lesions. Ann NY Acad Sci. 2000;911:192–206. doi: 10.1111/j.1749-6632.2000.tb06727.x. [DOI] [PubMed] [Google Scholar]
- Bechmann et al., 2001.Bechmann I, Peter S, Beyer M, Gimsa U, Nitsch R. Presence of B7-2 (CD86) and lack of B7-1 (CD(80) on myelin phagocytosing MHC-II-positive rat microglia is associated with nondestructive immunity in vivo. FASEB J. 2001;15:1086–1088. doi: 10.1096/fj.00-0563fje. [DOI] [PubMed] [Google Scholar]
- Bechmann et al., 2005.Bechmann I, Goldmann J, Kovac AD, Kwidzinski E, Simburger E, Naftolin F, Dirnagl U, Nitsch R, Priller J. Circulating monocytic cells infiltrate layers of anterograde axonal degeneration where they transform into microglia. FASEB J. 2005;19:647–649. doi: 10.1096/fj.04-2599fje. [DOI] [PubMed] [Google Scholar]
- Brabb et al., 2000.Brabb T, von Dassow P, Ordonez N, Schnabel B, Duke B, Goverman J. In situ tolerance within the central nervous system as a mechanism for preventing autoimmunity. J Exp Med. 2000;192:871–880. doi: 10.1084/jem.192.6.871. [DOI] [PMC free article] [PubMed] [Google Scholar]
- Brennan and Anderson, 2004.Brennan CA, Anderson KV. Drosophila: the genetics of innate immune recognition and response. Annu Rev Immunol. 2004;22:457–483. doi: 10.1146/annurev.immunol.22.012703.104626. [DOI] [PubMed] [Google Scholar]
- Bsibsi et al., 2002.Bsibsi M, Ravid R, Gveric D, van Noort JM. Broad expression of Toll-like receptors in the human central nervous system. J Neuropathol Exp Neurol. 2002;61:1013–1021. doi: 10.1093/jnen/61.11.1013. [DOI] [PubMed] [Google Scholar]
- Carpentier et al., 2005.Carpentier PA, Begolka WS, Olson JK, Elhofy A, Karpus WJ, Miller SD. Differential activation of astrocytes by innate and adaptive immune stimuli. Glia. 2005;49:360–374. doi: 10.1002/glia.20117. [DOI] [PubMed] [Google Scholar]
- Carson, 2002.Carson MJ. Microglia as liaisons between the immune and central nervous systems: functional implications for multiple sclerosis. Glia. 2002;40:218–231. doi: 10.1002/glia.10145. [DOI] [PMC free article] [PubMed] [Google Scholar]
- Christensen et al., 2004.Christensen JE, Nansen A, Moos T, Lu B, Gerard C, Christensen JP, Thomsen AR. Efficient T-cell surveillance of the CNS requires expression of the CXC chemokine receptor 3. J Neurosci. 2004;24:4849–4858. doi: 10.1523/JNEUROSCI.0123-04.2004. [DOI] [PMC free article] [PubMed] [Google Scholar]
- David and Lacroix, 2003.David S, Lacroix S. Molecular approaches to spinal cord repair. Annu Rev Neurosci. 2003;26:411–440. doi: 10.1146/annurev.neuro.26.043002.094946. [DOI] [PubMed] [Google Scholar]
- DiCarlo et al., 2001.DiCarlo G, Wilcock D, Henderson D, Gordon M, Morgan D. Intrahippocampal LPS injections reduce Abeta load in APP+PS1 transgenic mice. Neurobiol Aging. 2001;22:1007–1012. doi: 10.1016/s0197-4580(01)00292-5. [DOI] [PubMed] [Google Scholar]
- Drojdahl et al., 2002.Drojdahl N, Hegelund IV, Poulsen FR, Wree A, Finsen B. Perforant path lesioning induces sprouting of CA3-associated fibre systems in mouse hippocampal formation. Exp Brain Res. 2002;144:79–87. doi: 10.1007/s00221-002-1025-9. [DOI] [PubMed] [Google Scholar]
- Dufour et al., 2002.Dufour JH, Dziejman M, Liu MT, Leung JH, Lane TE, Luster AD. IFN-γ-inducible protein 10 (IP-10; CXCL10)-deficient mice reveal a role for IP-10 in effector T cell generation and trafficking. J Immunol. 2002;168:3195–3204. doi: 10.4049/jimmunol.168.7.3195. [DOI] [PubMed] [Google Scholar]
- Eugster et al., 1999.Eugster HP, Frei K, Bachmann R, Bluethmann H, Lassmann H, Fontana A. Severity of symptoms and demyelination in MOG-induced EAE depends on TNFRI. Eur J Immunol. 1999;29:626–632. doi: 10.1002/(SICI)1521-4141(199902)29:02<626::AID-IMMU626>3.0.CO;2-A. [DOI] [PubMed] [Google Scholar]
- Fagan and Gage, 1994.Fagan AM, Gage FH. Mechanisms of sprouting in the adult central nervous system: cellular responses in areas of terminal degeneration and reinnervation in the rat hippocampus. Neuroscience. 1994;58:705–725. doi: 10.1016/0306-4522(94)90449-9. [DOI] [PubMed] [Google Scholar]
- Fassbender et al., 2004.Fassbender K, Walter S, Kuhl S, Landmann R, Ishii K, Bertsch T, Stalder AK, Muehlhauser F, Liu Y, Ulmer AJ, Rivest S, Lentschat A, Gulbins E, Jucker M, Staufenbiel M, Brechtel K, Walter J, Multhaup G, Penke B, Adachi Y, et al. The LPS receptor (CD14) links innate immunity with Alzheimer's disease. FASEB J. 2004;18:203–205. doi: 10.1096/fj.03-0364fje. [DOI] [PubMed] [Google Scholar]
- Fenger et al., 2006.Fenger C, Drojdahl N, Wirenfeldt M, Sylvest L, Jorgensen OS, Meldgaard M, Lambertsen KL, Finsen B. Tumor necrosis factor and its p55 and p75 receptors are not required for axonal lesion-induced microgliosis in mouse fascia dentata. Glia. 2006;54:591–605. doi: 10.1002/glia.20405. [DOI] [PubMed] [Google Scholar]
- Fitch et al., 1999.Fitch MT, Doller C, Combs CK, Landreth GE, Silver J. Cellular and molecular mechanisms of glial scarring and progressive cavitation: in vivo and in vitro analysis of inflammation-induced secondary injury after CNS trauma. J Neurosci. 1999;19:8182–8198. doi: 10.1523/JNEUROSCI.19-19-08182.1999. [DOI] [PMC free article] [PubMed] [Google Scholar]
- Glabinski et al., 2003.Glabinski AR, Bielecki B, Kolodziejski P, Han Y, Selmaj K, Ransohoff RM. TNF-alpha microinjection upregulates chemokines and chemokine receptors in the central nervous system without inducing leukocyte infiltration. J Interferon Cytokine Res. 2003;23:457–466. doi: 10.1089/107999003322277874. [DOI] [PubMed] [Google Scholar]
- Gordon, 2002.Gordon S. Pattern recognition receptors: doubling up for the innate immune response. Cell. 2002;111:927–930. doi: 10.1016/s0092-8674(02)01201-1. [DOI] [PubMed] [Google Scholar]
- Hailer et al., 1999.Hailer NP, Grampp A, Nitsch R. Proliferation of microglia and astrocytes in the dentate gyrus following entorhinal cortex lesion: a quantitative bromodeoxyuridine-labelling study. Eur J Neurosci. 1999;11:3359–3364. doi: 10.1046/j.1460-9568.1999.00808.x. [DOI] [PubMed] [Google Scholar]
- Hauwel et al., 2005.Hauwel M, Furon E, Canova C, Griffiths M, Neal J, Gasque P. Innate (inherent) control of brain infection, brain inflammation and brain repair: the role of microglia, astrocytes, “protective” glial stem cells and stromal ependymal cells. Brain Res Brain Res Rev. 2005;48:220–233. doi: 10.1016/j.brainresrev.2004.12.012. [DOI] [PubMed] [Google Scholar]
- Iliev et al., 2004.Iliev AI, Stringaris AK, Nau R, Neumann H. Neuronal injury mediated via stimulation of microglial Toll-like receptor-9 (TLR9) FASEB J. 2004;18:412–414. doi: 10.1096/fj.03-0670fje. [DOI] [PubMed] [Google Scholar]
- Jack et al., 2005.Jack CS, Arbour N, Manusow J, Montgrain V, Blain M, McCrea E, Shapiro A, Antel JP. TLR signaling tailors innate immune responses in human microglia and astrocytes. J Immunol. 2005;175:4320–4330. doi: 10.4049/jimmunol.175.7.4320. [DOI] [PubMed] [Google Scholar]
- Janeway Jr and Medzhitov, 2002.Janeway CA, Jr, Medzhitov R. Innate immune recognition. Annu Rev Immunol. 2002;20:197–216. doi: 10.1146/annurev.immunol.20.083001.084359. [DOI] [PubMed] [Google Scholar]
- Jensen et al., 1994.Jensen MB, Gonzalez B, Castellano B, Zimmer J. Microglial and astroglial reactions to anterograde axonal degeneration: a histochemical and immunocytochemical study of the adult rat fascia dentata after entorhinal perforant path lesions. Exp Brain Res. 1994;98:245–260. doi: 10.1007/BF00228413. [DOI] [PubMed] [Google Scholar]
- Jensen et al., 1997.Jensen MB, Finsen B, Zimmer J. Morphological and immunophenotypic microglial changes in the denervated fascia dentata of adult rats: correlation with blood-brain barrier damage and astroglial reactions. Exp Neurol. 1997;143:103–116. doi: 10.1006/exnr.1996.6337. [DOI] [PubMed] [Google Scholar]
- Jensen et al., 2000.Jensen MB, Hegelund IV, Lomholt ND, Finsen B, Owens T. IFNγ enhances microglial reactions to hippocampal axonal degeneration. J Neurosci. 2000;20:3612–3621. doi: 10.1523/JNEUROSCI.20-10-03612.2000. [DOI] [PMC free article] [PubMed] [Google Scholar]
- Jiang-Shieh et al., 2005.Jiang-Shieh YF, Yeh KY, Wei IH, Chang CY, Chien HF, Tsai RY, Chang ML, Lee AW, Pai MH, Wu CH. Responses of microglia in vitro to the gram-positive bacterial component, lipoteichoic acid. J Neurosci Res. 2005;82:515–524. doi: 10.1002/jnr.20663. [DOI] [PubMed] [Google Scholar]
- Jones et al., 2005.Jones TB, McDaniel EE, Popovich PG. Inflammatory-mediated injury and repair in the traumatically injured spinal cord. Curr Pharm Des. 2005;11:1223–1236. doi: 10.2174/1381612053507468. [DOI] [PubMed] [Google Scholar]
- Kielian, 2006.Kielian T. Toll-like receptors in central nervous system glial inflammation and homeostasis. J Neurosci Res. 2006;883:711–730. doi: 10.1002/jnr.20767. [DOI] [PMC free article] [PubMed] [Google Scholar]
- Klein et al., 2004.Klein RS, Izikson L, Means T, Gibson HD, Lin E, Sobel RA, Weiner HL, Luster AD. IFN-inducible protein 10/CXC chemokine ligand 10-independent induction of experimental autoimmune encephalomyelitis. J Immunol. 2004;172:550–559. doi: 10.4049/jimmunol.172.1.550. [DOI] [PubMed] [Google Scholar]
- Ladeby et al., 2005a.Ladeby R, Wirenfeldt M, Garcia-Ovejero D, Fenger C, Dissing-Olesen L, Dalmau I, Finsen B. Microglial cell population dynamics in the injured adult central nervous system. Brain Res Brain Res Rev. 2005a;48:196–206. doi: 10.1016/j.brainresrev.2004.12.009. [DOI] [PubMed] [Google Scholar]
- Ladeby et al., 2005b.Ladeby R, Wirenfeldt M, Dalmau I, Gregersen R, Garcia-Ovejero D, Babcock A, Owens T, Finsen B. Proliferating resident microglia express the stem cell antigen CD34 in response to acute neural injury. Glia. 2005b;50:121–131. doi: 10.1002/glia.20159. [DOI] [PubMed] [Google Scholar]
- Laflamme et al., 2001.Laflamme N, Soucy G, Rivest S. Circulating cell wall components derived from gram-negative, not gram-positive, bacteria cause a profound induction of the gene-encoding Toll-like receptor 2 in the CNS. J Neurochem. 2001;79:648–657. doi: 10.1046/j.1471-4159.2001.00603.x. [DOI] [PubMed] [Google Scholar]
- Lee et al., 2004.Lee JY, Zhao L, Youn HS, Weatherill AR, Tapping R, Feng L, Lee WH, Fitzgerald KA, Hwang DH. Saturated fatty acid activates but polyunsaturated fatty acid inhibits Toll-like receptor 2 dimerized with Toll-like receptor 6 or 1. J Biol Chem. 2004;279:16971–16979. doi: 10.1074/jbc.M312990200. [DOI] [PubMed] [Google Scholar]
- Lehnardt et al., 2002.Lehnardt S, Lachance C, Patrizi S, Lefebvre S, Follett PL, Jensen FE, Rosenberg PA, Volpe JJ, Vartanian T. The Toll-like receptor TLR4 is necessary for lipopolysaccharide-induced oligodendrocyte injury in the CNS. J Neurosci. 2002;22:2478–2486. doi: 10.1523/JNEUROSCI.22-07-02478.2002. [DOI] [PMC free article] [PubMed] [Google Scholar]
- Lehnardt et al., 2003.Lehnardt S, Massillon L, Follett P, Jensen FE, Ratan R, Rosenberg PA, Volpe JJ, Vartanian T. Activation of innate immunity in the CNS triggers neurodegeneration through a Toll-like receptor 4-dependent pathway. Proc Natl Acad Sci USA. 2003;100:8514–8519. doi: 10.1073/pnas.1432609100. [DOI] [PMC free article] [PubMed] [Google Scholar]
- Leon et al., 2000.Leon S, Yin Y, Nguyen J, Irwin N, Benowitz LI. Lens injury stimulates axon regeneration in the mature rat optic nerve. J Neurosci. 2000;20:4615–4626. doi: 10.1523/JNEUROSCI.20-12-04615.2000. [DOI] [PMC free article] [PubMed] [Google Scholar]
- Li et al., 2001.Li M, Carpio DF, Zheng Y, Bruzzo P, Singh V, Ouaaz F, Medzhitov RM, Beg AA. An essential role of the NF-κB/Toll-like receptor pathway in induction of inflammatory and tissue-repair gene expression by necrotic cells. J Immunol. 2001;166:7128–7135. doi: 10.4049/jimmunol.166.12.7128. [DOI] [PubMed] [Google Scholar]
- Liu et al., 2005.Liu Y, Walter S, Stagi M, Cherny D, Letiembre M, Schulz-Schaeffer W, Heine H, Penke B, Neumann H, Fassbender K. LPS receptor (CD14): a receptor for phagocytosis of Alzheimer's amyloid peptide. Brain. 2005;128:1778–1789. doi: 10.1093/brain/awh531. [DOI] [PubMed] [Google Scholar]
- Malm et al., 2005.Malm TM, Koistinaho M, Parepalo M, Vatanen T, Ooka A, Karlsson S, Koistinaho J. Bone-marrow-derived cells contribute to the recruitment of microglial cells in response to beta-amyloid deposition in APP/PS1 double transgenic Alzheimer mice. Neurobiol Dis. 2005;18:134–142. doi: 10.1016/j.nbd.2004.09.009. [DOI] [PubMed] [Google Scholar]
- Matzinger, 2002.Matzinger P. The danger model: a renewed sense of self. Science. 2002;296:301–305. doi: 10.1126/science.1071059. [DOI] [PubMed] [Google Scholar]
- Murphy et al., 2002.Murphy CA, Hoek RM, Wiekowski MT, Lira SA, Sedgwick JD. Interactions between hemopoietically derived TNF and central nervous system-resident glial chemokines underlie autoimmune inflammation in the brain. J Immunol. 2002;169:7054–7062. doi: 10.4049/jimmunol.169.12.7054. [DOI] [PubMed] [Google Scholar]
- Nguyen et al., 2001.Nguyen MD, Julien JP, Rivest S. Induction of proinflammatory molecules in mice with amyotrophic lateral sclerosis: no requirement for proapoptotic interleukin-1beta in neurodegeneration. Ann Neurol. 2001;50:630–639. doi: 10.1002/ana.1256. [DOI] [PubMed] [Google Scholar]
- Nguyen et al., 2002.Nguyen MD, Julien JP, Rivest S. Innate immunity: the missing link in neuroprotection and neurodegeneration? Nat Rev Neurosci. 2002;3:216–227. doi: 10.1038/nrn752. [DOI] [PubMed] [Google Scholar]
- Olson et al., 2004.Olson JK, Miller SD. Microglia initiate central nervous system innate and adaptive immune responses through multiple TLRs. J Immunol. 2004;173:3916–3924. doi: 10.4049/jimmunol.173.6.3916. [DOI] [PubMed] [Google Scholar]
- Owens et al., 2005.Owens T, Babcock AA, Millward JM, Toft-Hansen H. Cytokine and chemokine inter-regulation in the inflamed or injured CNS. Brain Res Brain Res Rev. 2005;48:178–184. doi: 10.1016/j.brainresrev.2004.12.007. [DOI] [PubMed] [Google Scholar]
- Ozinsky et al., 2000.Ozinsky A, Underhill DM, Fontenot JD, Hajjar AM, Smith KD, Wilson CB, Schroeder L, Aderem A. The repertoire for pattern recognition of pathogens by the innate immune system is defined by cooperation between Toll-like receptors. Proc Natl Acad Sci USA. 2000;97:13766–13771. doi: 10.1073/pnas.250476497. [DOI] [PMC free article] [PubMed] [Google Scholar]
- Poltorak et al., 1998.Poltorak A, He X, Smirnova I, Liu MY, Van Huffel C, Du X, Birdwell D, Alejos E, Silva M, Galanos C, Freudenberg M, Ricciardi-Castagnoli P, Layton B, Beutler B. Defective LPS signaling in C3H/HeJ and C57BL/10ScCr mice: mutations in Tlr4 gene. Science. 1998;282:2085–2088. doi: 10.1126/science.282.5396.2085. [DOI] [PubMed] [Google Scholar]
- Popovich et al., 2002.Popovich PG, Guan Z, McGaughy V, Fisher L, Hickey WF, Basso DM. The neuropathological and behavioral consequences of intraspinal microglial/macrophage activation. J Neuropathol Exp Neurol. 2002;61:623–633. doi: 10.1093/jnen/61.7.623. [DOI] [PubMed] [Google Scholar]
- Qiao et al., 2001.Qiao X, Cummins DJ, Paul SM. Neuroinflammation-induced acceleration of amyloid deposition in the APPV717F transgenic mouse. Eur J Neurosci. 2001;14:474–482. doi: 10.1046/j.0953-816x.2001.01666.x. [DOI] [PubMed] [Google Scholar]
- Raivich et al., 1998.Raivich G, Jones LL, Kloss CU, Werner A, Neumann H, Kreutzberg GW. Immune surveillance in the injured nervous system: T-lymphocytes invade the axotomized mouse facial motor nucleus and aggregate around sites of neuronal degeneration. J Neurosci. 1998;18:5804–5816. doi: 10.1523/JNEUROSCI.18-15-05804.1998. [DOI] [PMC free article] [PubMed] [Google Scholar]
- Rappert et al., 2004.Rappert A, Bechmann I, Pivneva T, Mahlo J, Biber K, Nolte C, Kovac AD, Gerard C, Boddeke HW, Nitsch R, Kettenmann H. CXCR3-dependent microglial recruitment is essential for dendrite loss after brain lesion. J Neurosci. 2004;24:8500–8509. doi: 10.1523/JNEUROSCI.2451-04.2004. [DOI] [PMC free article] [PubMed] [Google Scholar]
- Re and Strominger, 2001.Re F, Strominger JL. Toll-like receptor 2 (TLR2) and TLR4 differentially activate human dendritic cells. J Biol Chem. 2001;276:37692–37699. doi: 10.1074/jbc.M105927200. [DOI] [PubMed] [Google Scholar]
- Rifkin et al., 2005.Rifkin IR, Leadbetter EA, Busconi L, Viglianti G, Marshak-Rothstein A. Toll-like receptors, endogenous ligands, and systemic autoimmune disease. Immunol Rev. 2005;204:27–42. doi: 10.1111/j.0105-2896.2005.00239.x. [DOI] [PubMed] [Google Scholar]
- Sandor et al., 2003.Sandor F, Latz E, Re F, Mandell L, Repik G, Golenbock DT, Espevik T, Kurt-Jones EA, Finberg RW. Importance of extra- and intracellular domains of TLR1 and TLR2 in NF(kappa)B signaling. J Cell Biol. 2003;162:1099–1110. doi: 10.1083/jcb.200304093. [DOI] [PMC free article] [PubMed] [Google Scholar]
- Schrijver et al., 2001.Schrijver IA, van Meurs M, Melief MJ, Wim Ang C, Buljevac D, Ravid R, Hazenberg MP, Laman JD. Bacterial peptidoglycan and immune reactivity in the central nervous system in multiple sclerosis. Brain. 2001;124:1544–1554. doi: 10.1093/brain/124.8.1544. [DOI] [PubMed] [Google Scholar]
- Schwartz, 2003.Schwartz M. Macrophages and microglia in central nervous system injury: are they helpful or harmful? J Cereb Blood Flow Metab. 2003;23:385–394. doi: 10.1097/01.WCB.0000061881.75234.5E. [DOI] [PubMed] [Google Scholar]
- Sedgwick et al., 1998.Sedgwick JD, Ford AL, Foulcher E, Airriess R. Central nervous system microglial cell activation and proliferation follows direct interaction with tissue-infiltrating T cell blasts. J Immunol. 1998;160:5320–5330. [PubMed] [Google Scholar]
- Seong and Matzinger, 2004.Seong SY, Matzinger P. Hydrophobicity: an ancient damage-associated molecular pattern that initiates innate immune responses. Nat Rev Immunol. 2004;4:469–478. doi: 10.1038/nri1372. [DOI] [PubMed] [Google Scholar]
- Shishido et al., 2003.Shishido T, Nozaki N, Yamaguchi S, Shibata Y, Nitobe J, Miyamoto T, Takahashi H, Arimoto T, Maeda K, Yamakawa M, Takeuchi O, Akira S, Takeishi Y, Kubota I. Toll-like receptor-2 modulates ventricular remodeling after myocardial infarction. Circulation. 2003;108:2905–2910. doi: 10.1161/01.CIR.0000101921.93016.1C. [DOI] [PubMed] [Google Scholar]
- Steward, 1992.Steward O. Signals that induce sprouting in the central nervous system: sprouting is delayed in a strain of mouse exhibiting delayed axonal degeneration. Exp Neurol. 1992;118:340–351. doi: 10.1016/0014-4886(92)90192-s. [DOI] [PubMed] [Google Scholar]
- Streit, 2004.Streit WJ. Microglia and Alzheimer's disease pathogenesis. J Neurosci Res. 2004;77:1–8. doi: 10.1002/jnr.20093. [DOI] [PubMed] [Google Scholar]
- Streit et al., 2004.Streit WJ, Mrak RE, Griffin WS. Microglia and neuroinflammation: a pathological perspective. J Neuroinflammation. 2004;1:14. doi: 10.1186/1742-2094-1-14. [DOI] [PMC free article] [PubMed] [Google Scholar]
- Szczepanik et al., 1996.Szczepanik AM, Fishkin RJ, Rush DK, Wilmot CA. Effects of chronic intrahippocampal infusion of lipopolysaccharide in the rat. Neuroscience 70:57–65. receptor 6. Int Immunol. 1996;13:933–940. doi: 10.1016/0306-4522(95)00296-u. [DOI] [PubMed] [Google Scholar]
- Tanga et al., 2004.Tanga FY, Raghavendra V, DeLeo JA. Quantitative real-time RT-PCR assessment of spinal microglial and astrocytic activation markers in a rat model of neuropathic pain. Neurochem Int. 2004;45:397–407. doi: 10.1016/j.neuint.2003.06.002. [DOI] [PubMed] [Google Scholar]
- Tanga et al., 2005.Tanga FY, Nutile-McMenemy N, DeLeo JA. The CNS role of Toll-like receptor 4 in innate neuroimmunity and painful neuropathy. Proc Natl Acad Sci USA. 2005;102:5856–5861. doi: 10.1073/pnas.0501634102. [DOI] [PMC free article] [PubMed] [Google Scholar]
- Toft-Hansen et al., 2004.Toft-Hansen H, Nuttall RK, Edwards DR, Owens T. Key metallopro teinases are expressed by specific cell types in experimental autoimmune encephalomyelitis. J Immunol. 2004;173:5209–5218. doi: 10.4049/jimmunol.173.8.5209. [DOI] [PubMed] [Google Scholar]
- Tsan and Gao, 2004.Tsan MF, Gao B. Endogenous ligands of Toll-like receptors. J Leukoc Biol. 2004;76:514–519. doi: 10.1189/jlb.0304127. [DOI] [PubMed] [Google Scholar]
- Turrin and Rivest, 2004.Turrin NP, Rivest S. Innate immune reaction in response to seizures: implications for the neuropathology associated with epilepsy. Neurobiol Dis. 2004;16:321–334. doi: 10.1016/j.nbd.2004.03.010. [DOI] [PubMed] [Google Scholar]
- Vallieres et al., 2005.Vallieres N, Berard JL, David S, Lacroix S. Systemic injections of lipopolysaccharide accelerates myelin phagocytosis during Wallerian degeneration in the injured mouse spinal cord. Glia. 2005;53:103–113. doi: 10.1002/glia.20266. [DOI] [PubMed] [Google Scholar]
- Werts et al., 2001.Werts C, Tapping RI, Mathison JC, Chuang TH, Kravchenko V, Saint Girons I, Haake DA, Godowski PJ, Hayashi F, Ozinsky A, Underhill DM, Kirschning CJ, Wagner H, Aderem A, Tobias PS, Ulevitch RJ. Leptospiral lipopolysaccharide activates cells through a TLR2-dependent mechanism. Nat Immunol. 2001;2:346–352. doi: 10.1038/86354. [DOI] [PubMed] [Google Scholar]
- Wirenfeldt et al., 2005.Wirenfeldt M, Babcock AA, Ladeby R, Lambertsen KL, Dagnaes-Hansen F, Leslie RG, Owens T, Finsen B. Reactive microgliosis engages distinct responses by microglial subpopulations after minor central nervous system injury. J Neurosci Res. 2005;82:507–514. doi: 10.1002/jnr.20659. [DOI] [PubMed] [Google Scholar]
- Zhai et al., (2004).Zhai Y, Shen XD, O'Connell R, Gao F, Lassman C, Busuttil RW, Cheng G, Kupiec-Weglinski JW. Cutting edge: TLR4 activation mediates liver ischemia/reperfusion inflammatory response via IFN regulatory factor 3-dependent MyD88-independent pathway. J Immunol. 2004;173:7115–7119. doi: 10.4049/jimmunol.173.12.7115. [DOI] [PubMed] [Google Scholar]