A Syntaxin 1, Gαo, and N-Type Calcium Channel Complex at a Presynaptic Nerve Terminal: Analysis by Quantitative Immunocolocalization (original) (raw)
Abstract
Presynaptic CaV2.2 (N-type) calcium channels are subject to modulation by interaction with syntaxin 1 and by a syntaxin 1-sensitive GαO G-protein pathway. We used biochemical analysis of neuronal tissue lysates and a new quantitative test of colocalization by intensity correlation analysis at the giant calyx-type presynaptic terminal of the chick ciliary ganglion to explore the association of CaV2.2 with syntaxin 1 and GαO. CaV2.2 could be localized by immunocytochemistry (antibody Ab571) in puncta on the release site aspect of the presynaptic terminal and close to synaptic vesicle clouds. Syntaxin 1 coimmunoprecipitated with CaV2.2 from chick brain and chick ciliary ganglia and was widely distributed on the presynaptic terminal membrane. A fraction of the total syntaxin 1 colocalized with the CaV2.2 puncta, whereas the bulk colocalized with MUNC18-1. GαO, whether in its trimeric or monomeric state, did not coimmunoprecipitate with CaV2.2, MUNC18-1, or syntaxin 1. However, the G-protein exhibited a punctate staining on the calyx membrane with an intensity that varied in synchrony with that for both Ca channels and syntaxin 1 but only weakly with MUNC18-1. Thus, syntaxin 1 appears to be a component of two separate complexes at the presynaptic terminal, a minor one at the transmitter release site with CaV2.2 and GαO, as well as in large clusters remote from the release site with MUNC18-1. These syntaxin 1 protein complexes may play distinct roles in presynaptic biology.
Keywords: calcium channel, presynaptic, N-type, CaV2.2, α1B subunit, syntaxin, G-protein, GαO, transmitter release site, n-sec-1, MUNC18-1, intensity correlation analysis, intensity correlation quotient, colocalization, immunocytochemistry
Introduction
N-type (CaV2.2) Ca channels are known to play an important role in the gating of transmitter release at presynaptic terminals. Previous reports have demonstrated that this channel type can be inhibited via two pathways that involve syntaxin 1 and G-protein. Modulation of the channels by syntaxin 1 was demonstrated by coexpression in oocytes or cell lines (Bezprozvanny et al., 1995; Wiser et al., 1996; Degtiar et al., 2000; Jarvis and Zamponi, 2001a,b; Lu et al., 2001). Evidence for syntaxin 1-dependent Ca channel inhibition in intact nerve terminals has recently been indicated in synaptosomes (Bergsman and Tsien, 2000) and was shown directly by the effect of syntaxin 1 cleavage with botulinum toxin C1 on the presynaptic Ca current (Stanley, 2003).
N-type Ca channels are known to be inhibited via trimeric G-proteins, and this inhibition has been demonstrated directly in the presynaptic nerve terminal with both G-protein receptor ligands (Yawo and Chuhma, 1993; Takahashi et al., 1998; Mirotznik et al., 2000) and intracellular GTP analogs (Stanley and Mirotznik, 1997; Mirotznik et al., 2000). We have recently shown at the chick calyx presynaptic terminal that this inhibitory pathway uses a PTX-sensitive member of the GαO/i family, most likely GαO (Mirotznik et al., 2000). This modulation pathway is of particular interest because of its potential for the rapid control of synaptic transmission (for review, see Hille, 1994; Ikeda and Dunlap, 1999; Jarvis and Zamponi, 2001b). We noted that botulinum-mediated cleavage of syntaxin essentially eliminated the inhibition of presynaptic Ca channels via the GαO-gated pathway (Stanley and Mirotznik, 1997). The above findings could be explained if syntaxin 1 was a key element of a protein complex at the transmitter release site that included N-type Ca channels and GαO. The primary motivation for this study was to test this hypothesis.
We used two main experimental approaches. Conventional coimmunoprecipitation (coIP) and pull-down assays were used to test for stable protein complexes. In addition, we used the large chick ciliary ganglion calyx terminal for high-resolution immunocytochemistry, combined with a novel method to test for protein colocalization by staining intensity correlation. Conventional colocalization is based on a dye-overlay method such as the superimposition of antibody (Ab) 1, colored red, on Ab 2, colored green, to give yellow. Although simple, this technique only provides an indication of the coexistence of two proteins. It does not address the more fundamental question of whether the intensity of staining for the two proteins vary in synchrony, as would be predicted if they are components of the same complex. We developed an immunostain analysis method based on relative staining intensities for such a test. We used this method to demonstrate that at the nerve terminal syntaxin is a part of two different complexes: one associated with the N-type channel and GαO at the release site, as predicted, and a second much more prominent complex with MUNC18 that appears to be remote from the release sites.
Materials and Methods
Antibodies
Calcium channel. Antibodies were prepared commercially (Research Genetics) against peptides synthesized according to a published sequence for the “synprint” region of the chick CaV2.2 α subunit II-III loop (Lu and Dunlap, 1999) (GenBank accession number: AF173015). The amino acid (AA) sequences and our Ab (Ab) codes and binding titers (BT) are: KHHRHRDKEKLGEQEKG Ab571 (AA 871-888; BT >204800) and GAEAPRKHHRHRDKEKL Ab572 (AA 866-882; BT = 2666). Experiments were performed with Ab571, unless specified.
Primary antibodies. Mouse monoclonal antibodies used in this study were: GαO, GαOAB-1 (Lab Vision, Freemont, CA); syntaxin (Sigma, St. Louis, MO); Gβ, MUNC18 (BD Transduction Lab, San Diego, CA), and SV2, Na/K pump (Developmental Studies Hybridoma Bank, Iowa City, IA). Affinity-purified polyclonal antibodies were: neurofilaments, AB1991 (Chemicon, Temecula, CA); MUNC18 (ABR); syntaxin (Sigma); SV2 (Stressgen, Vancouver, British Columbia, Canada); CaV2.1, CW65 (Fletcher et al., 2001), CaV2.2, CW21 (also termed CW14; McEnery et al., 1997). CW65 and CW21 were gifts from M. McEnery (Case Western Reserve University, Cleveland, OH).
Biochemistry
Tissue lysates. A 15 d chick embryo brain was homogenized on ice for 30 min in lysis buffer: 25 mm Tris, pH 7.5, 150 mm NaCl, 100 mm NaF, 5 mm EDTA, 1 mm Na3VO4 1 mm, and 1% Triton X-100 and protease inhibitors: 1 μg/ml leupeptin, 2 μg/ml aprotinin, and 1 mm PMSF. This was followed by centrifugation for 15 min at 15,000 × g. Protein concentrations were determined with Bio-Rad (Hercules, CA) protein assay reagent (catalog #500-0006). Chick ciliary ganglion lysates were prepared as for chick brain using 150 ganglia per preparation.
Western blots. Western blots were performed using standard procedures. Briefly, each lane was loaded with 50 μg of tissue lysate, except where specified. Samples were run on SDS-PAGE and transferred to Immobilon-P transfer membranes (Millipore, Bedford, MA) at 25 V overnight. The membranes were blocked for 1 hr in 5% skim milk powder in TBST at room temperature. All Ab incubations were for 1 hr at room temperature. Primary Ab (standard technique) concentrations were as follows: rabbit polyclonal anti-MUNC18, 1:1000; anti-CaV2.1 CW65, 1:100; Ab571, 1:200; and anti-CaV2.2 CW21, 1:100. Monoclonal anti-MUNC18, 1:3000; anti-syntaxin, 1:1000; anti-Na/K pump, 1:1000; and GαOAB-1, 1:800. Secondary Ab concentrations were: goat anti-mouse conjugated to horseradish peroxidase (HRP; Stressgen) 1: 4000, goat anti-rabbit IgG HRP (Stressgen) 1:5000. Blots were probed with Enhanced Chemiluminescence reagent (NEN Life Science) before exposure with photographic film.
Immunoprecipitation. Fresh chick brain lysate (0.5-1.0 mg) in 300 μl of lysis buffer was precleared by a 1 hr incubation with protein A beads (Pierce, Rockford, IL) for polyclonal and protein A/G-agarose beads (Oncogene, Cambridge, MA) for monoclonal antibodies and were then spun at low frequency for ∼1 min. In experiments with GTPγS, the cleared chick brain lysate was incubated with 200 μm GTPγS for 10 min at room temperature followed by 20 min on ice. Controls were incubated without GTPγS. The lysate was incubated overnight with 1 μg of Ab571, 3 μg of rabbit anti-MUNC18-1, or 0.5 μg of GαO AB-1 Ab, respectively, to capture Ab-protein complexes. Normal rabbit IgG (Sigma) was used for controls. Fresh protein A or protein A/G-agarose beads (20 μl original bead slurry per sample) were incubated with lysate-antibody mixture at 4°C for 2 hr. Protein bound beads were washed three times with lysis buffer. The immunoprecipitates were boiled in 2× SDS sample buffer before SDS-PAGE.
Glutathione S_-transferase-syntaxin 1A synthesis and purification._ Syntaxin constructs in pGEX-4T-3 vectors (from G. Zamponi, University of Calgary) were transformed in Escherichia coli BL21 cells (Novagen, Madison, WI). Proteins were purified using standard procedures. Briefly, protein expressed in BL21 was released by sonication and incubated with glutathione Sepharose beads followed by washing with PBST buffer. The bound glutathione _S_-transferase (GST)-syntaxin protein was eluted from the Sepharose beads using 10 mm glutathione (Sigma). Proteins samples were concentrated with Centriprep columns (catalog #YM-10; Amicon, Beverly, MA) followed by SDS-PAGE and immunoblot. For some experiments we used purified syntaxin protein only by removing the GST carrier with protease cleavage using 4 μg/ml thrombin.
Experimental preparations
Chick calyx preparation. This preparation has been described in detail previously (Stanley and Goping, 1991; Stanley, 1991; Sun and Stanley, 1996; Mirotznik et al., 2000). Briefly, ciliary ganglia are dissected from 15 d chick embryos and dissociated in a combination of enzymes that preserve functional calyx nerve terminals. The ganglia are triturated gently, and the cells and cell fragments are allowed to adhere to glass coverslips at 37°C for further experimentation.
Hippocampal neuron culture. Postnatal rat hippocampal neurons were prepared as previously described (Brewer, 1997), with some modifications. Briefly, hippocampi were dissected from 2-3 d-old rats and incubated in 2 mg/ml papain (Worthington, Freehold, NJ) at 30°C for 30 min. The tissue was triturated using flame-polished Pasteur pipettes in Neurobasal A/B27 [2% B27 supplement (v/v), 2 mm l-glutamine, and 0.05 mg/ml gentamycin, Life Technologies, Grand Island, NY], and the neurons were separated on an Optiprep (Life Technologies) density gradient. The neuron-enriched layer was plated on poly-d-lysine-coated (Sigma) German glass coverslips (Bellco Glass, Vineland, NJ) at 4 × 10⁴ cells/coverslip, in 12-well plates and maintained in Neurobasal A/B27. Cultures were fed at 4 d in culture (DIC) at which time one-half of the media was removed and replaced with an equal volume of fresh media. Cultures were grown in Neurobasal A/B27 and used at 8-10 DIC when neuron purity was >85%, as assessed by MAP-2-positive immunofluorescence.
Fluorescence microscopy
Immunostaining. Dissociated chick ciliary ganglion cells were fixed in (mm): cyclohexylamine, 150; EGTA, 20; MgCl2, 20; PIPES, 20; and paraformaldehyde, 2.5% w/v for 45 min. Fixation was stopped in Tris buffer (mm: Tris, 150; MgCl2, 20; and NaN3, 20) for 1 hr and then Ab buffer (mm: NaCl, 500; MgCl2, 10; NaN3, 10; and Tris, 20 with BSA 0.1% w/v) for 1 hr at room temperature. Nonspecific background staining was blocked with Ab buffer containing 5% normal donkey serum for 30 min before staining. Hippocampal cultures were fixed in 4% paraformaldehyde for 20 min at 20°C then permeabilized in 0.25% Triton X-100 in PBS for 5 min. The cultures were washed with PBS three times and treated with 5% BSA in PBS for 2 hr before Ab application.
Primary antibodies were diluted in Ab buffer before application as follows: Ab571 1:200; SV2 monoclonal, 1:1; MUNC18 polyclonal, 1:50; syntaxin monoclonal, 1:200; and GαO monoclonal, 1:100. All secondary antibodies (Jackson ImmunoResearch, West Grove, PA) were used at a 1:200 dilution in Ab buffer. Incubation was either overnight at 4°C or at room temperature for 1-2 hr, for both primary and secondary antibodies. In the pretty-poly technique (for a detailed description of the method see: Morris and Stanley, 2003) antibodies were used at: anti-SV2 1:100; Ab571, 1:50; and ant-Na/K pump, 1:50.
Immunostaining with two rabbit polyclonal antibodies, combined with standard secondary Ab staining with a mouse monoclonal antibody (mAb) was performed as described in detail (Morris and Stanley, 2003).
Microscopy. The calyx synapses were imaged on a Zeiss Axioplan upright microscope using a 100×, 1.4 numerical aperture lens and standard FITC-Texas Red fluorescence cubes with a black and white (B/W) Zeiss Axiocam 1300 × 1030 pixel B/W camera. Z stack image pairs were captured at an interplane distance of 200 nm. Images were deblurred off-line by an iterative deconvolution protocol (Zeiss) using a theoretical point-spread function and were pseudocolored for presentation. Regions of interest (ROIs), either the release face of the calyx terminal or the surface membrane regions of isolated calyces, were identified by eye based primarily on the location of syntaxin staining, which we have previously shown highlights the surface membrane region (Stanley and Mirotznik, 1997).
Intensity correlation analysis
Rationale. The standard test for the colocalization of two proteins by immunocytochemistry generally involve tagging the first, protein A, one color (usually green), and the second, protein B, a different and contrasting color (usually red). Each color is imaged separately, and proteins are deemed to be colocalized in areas stained with the combined color when the two images are overlain (in this case, red plus green = yellow), a method that can be termed the “dye-overlay” method. This method is both simple and widely used but has a number of drawbacks. The images are subject to both the characteristics of the display method and the perception of the investigator (with this method the pre-overlay images are generally first adjusted for threshold, brightness, and contrast). Furthermore, the dye-overlap method is in essence a binary test of whether the two stains occur in the same or in different regions. It does not address the much more fundamental question of whether the two target proteins are elements of a common complex.
In the present study we take advantage of the high resolution in the z as well as x and y axes after iterative deconvolution deblurring to compare the intensities of staining for two target proteins by intensity correlation analysis (ICA). We suppose that if two proteins are parts of the same complex then their staining intensities should vary in synchrony, whereas if they are on different complexes or structures they will exhibit asynchronous staining. We term these dependent and segregated staining, respectively. The ICA method is illustrated here with control tissue staining examples and mathematical models of predicted staining patterns.
ICA imaging method. Only image segments that were free of pixel saturation were used in this analysis. The light paths with the two filter sets were carefully adjusted to ensure the alignment of light emitted from a point in the sample through different filter sets. All comparisons were made from pairs of single image planes after iterative deconvolution deblurring of the entire image stack through the cell or cell fragment. Image layers selected for analysis were converted into 8-bit monochromatic images. Fluorescence intensity was quantified in matched ROIs for each pair of images (e.g., the synaptic release face) and converted into a data set of paired (dye A/dye B) intensity pairs (MetaMorph version 4.5; Universal Imaging Corporation, West Chester, PA). Mean background staining was measured from an area outside the cell regions and was subtracted from each file. Staining intensity pairs were plotted and analyzed using Origin 7.0 (Microcal Software, Northampton, MA). Image sets were analyzed after removing pixel staining pairs with double 0-level intensity values, reflecting nonstained areas, which can markedly skew the data.
Control images. To develop the method, we first generated three control double-stained images. In the first we stained the calyx nerve terminal with both monoclonal and polyclonal antibodies against the same target protein, SV2 (an integral protein of the secretory vesicle) (Fig. 1 A). As expected, this resulted in an image in which the staining intensities of the two dyes varied in close synchrony, yielding an example of an image where the staining of dyes A and B were highly dependent. In the second control we stained for two target proteins that are known to be in relatively distinct compartments of the cell and exhibit a segregated pattern of staining (SV2 vs Na-K pump, a surface membrane marker) (Fig. 1_C_). The third test case exhibited a complex staining pattern with patches of both distinct and overlapping staining (SV2 vs neurofilaments) (Fig. 1 E). In each case we normalized the intensity values for each stain and plotted the intensities of stain A against stain B for each pixel (Fig. 1 B,D,F, left panels). The dependent staining in Figure 1 A resulted, as would be expected, in a highly correlated plot. The control image with the opposite, segregated, staining (Fig. 1 D) resulted, however, in a more complex relationship in which the data tended to cluster along both axes. Finally, the image with the more complex staining gave a scatterplot with a mixture of these features (Fig. 1 F). To develop a method to analyze such staining intensity scatter plots, we next devised a set of simulated intensity scatter plots in which we could define the staining relationships.
Figure 1.
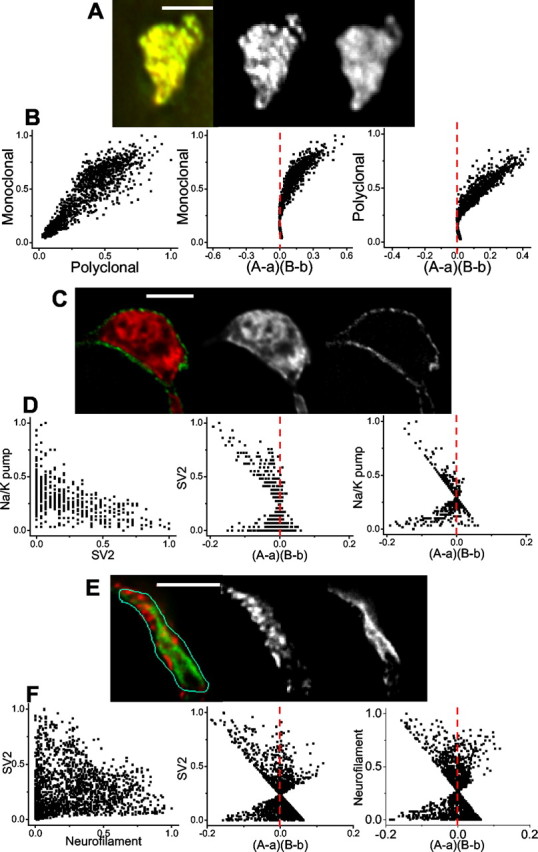
Intensity correlation analysis, experimental models. Each panel in A, C, and E shows a calyx nerve terminal stained with two antibodies with the overlay on the left and the individual B/W image pairs on the right. Each panel in B, D, and F shows intensity correlation plots on the left together with the respective plots of stain A (center) and B (right) pixel intensities against their (A - a)(B - b) values (see Results, Intensity correlation analysis). A, B, Experimental example of dependent staining: calyx nerve terminal stained for SV2 with monoclonal (red, left panel; B/W center panel) and polyclonal (green, left panel; B/W right panel) tagged antibodies. ICQ = 0.48, psign test < 0.001. C,D, Experimental example of segregated staining. Calyx terminal stained for SV2 (red, left panel; B/W center panel) and Na/K pump (green, left panel; B/W right panel). ICQ = -0.19, _p_sign test < 0.001. E, F, Experimental example of complex staining. A calyx nerve terminal stained with a mAb against SV2 (red, left panel; B/W center panel) and polyclonal antibody against neurofilament (green, left panel; B/W right panel). Scale bars, 5 μm.
Simulated staining intensity plots. We generated staining patterns (Fig. 2 A-D, left panels) in which the two intensities vary randomly (A), in a dependent manner (B), and in a segregated manner (C). In addition, we generated a model in which one staining intensity was random and its pair was segregated (D).
Figure 2.
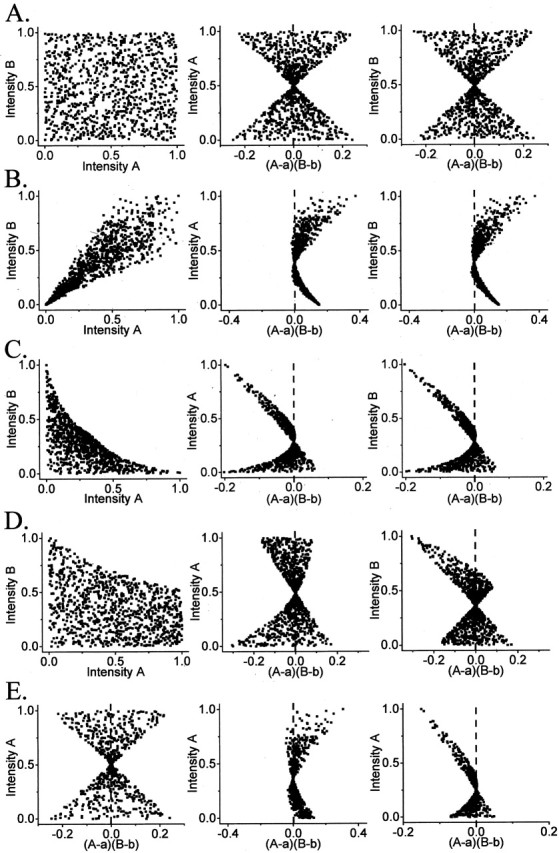
Intensity correlation analysis, simulated models. In each of rows 1A through 1D the left panel shows a scatterplot of 1000 paired A i versus B i staining intensities (normalized to 1.0), whereas the center and right panels show plots of individual A i and B i staining intensities against their respective calculated (A i - a)(B i - b) values. A, Intensity plot of simulating random staining. Plot of random A and random B intensity values. ICQ = 0.023; _p_sign test > 0.05. B, Intensity plot of simulating dependent staining. A and B are two sets of 1000 random numbers modified by the relation: Xi = Xi*C, where X is A or B, respectively, and C is a serial number incrementing from 0.001-1.000. ICQ = +0.39; _p_sign test < 0.001. _C,_ Intensity plot model simulating segregated staining. Each of 1000 pairs of two sets of random numbers _A_ _R_ _, B_ _R_ were modified by the relations: _A_ _i_ = _A_ _R_/(1 + 2*_B_ _R_) and _B_ _i_ = _B_ _R_/(1 + 2*_A_ _R_). ICQ = -0.269, psign test < 0.001. _D,_ Intensity plot model simulating random _A_ staining distribution but with segregated _B_ staining. _A_ is a set of 1000 random numbers. _B_ is a second set of 1000 random numbers, _B_ _R_, modified by the relation: _B_ _i_ = _B_ _R_/(1 + _A_) ICQ = -0.12; psign test < 0.001. _E,_ Effect of thresholding. Each of the distributions in Figure 1 A-C, center panel were modified by deleting the data pairs with the lowest 33% of _A_ values to simulate the effect of thresholding one data set. The _A_ and _B_ data sets were normalized, and the (_A_ - _a_)(_B_ - _b_) and ICQ values were recalculated. ICQ values: left, random distributions +0.003, _p_sign test > 0.05; center, dependent distribution +0.250, _p_sign test < 0.001; right, segregated distribution -0.287, _p_sign test < 0.001. Note the retention of the key features of the non-thresholded plots.
ICA. The ICA method is based on the principle that for any set of values the sum of the differences from the mean equal zero, i.e., ΣN(A i - a) = 0, where a is the mean of the distribution with N values of Ai. In our case N is the number of pixels, and A i is the staining intensity for each pixel. It follows that for N pixels associated with two sets of random staining intensities (A i and B i), the sum of the product of their differences will also tend to zero, thus ΣN(A i - a)(B i - b) ≈ 0. However, this is not the case if the two intensities are dependent (when the product tends to be a positive value) or if they are segregated (when the product tends to be a negative value). Thus, with dependent staining ΣN(A i - a)(B i - b) > 0, whereas with segregated staining ΣN(A i - a)(B i - b) < 0.
We used this property to test for dependent or segregated staining. In practice, we set up a five column spreadsheet (Origin; Microcal). We inserted the paired pixel staining intensity values for dye A and B from our ROIs into the first pair of columns. A scatterplot of the raw pixel values was used to test for any obvious data limitations requiring correction by adjustment of the threshold (lowest value of the distribution). The A and B staining intensity columns were then normalized to a 0-1.0 range in the third and fourth columns, and the arithmetic means of each column (a, b) were determined. A scatterplot of the normalized A versus B staining intensities provides the first clues to their staining relationship (Fig. 1 B, left panel). The (A i - a)(B i - b) relationship was calculated for each pixel in the fifth column. ICA plots were then generated for each variable against its (A i - a)(B i - b) value (Fig. 1 B, center, right panels).
ICA analysis of the simulated staining patterns. ICA plots for random values of A and B (Fig. 2 A, left panel) generated a symmetrical hourglass-shaped scatterplots (Fig. 2 A, middle, right panels) with its waist defined by the distribution means. Plots for the simulated dependent (Fig. 2 B, middle, right panels) or segregated (Fig. 2_C_, middle, right panels) staining patters generated hourglass figures that were markedly skewed toward positive or negative values, respectively. The ICA scatterplots tend to emphasize the high-intensity pixels for each variable providing evidence for a one-sided staining relationships such as when A is random but B is segregated from A, as illustrated in Figure 2 D.
ICA analysis of the control images. ICA plots were generated for the control staining images. Consistent with the simulated data, the correlated staining (Fig. 1 A) yielded an hourglass figure with a positive skew (Fig. 1 B, center, right panels), whereas the segregated staining gave one with a negative skew (Fig. 1 D). The image from Figure 1 F generated a complex pattern with plumes of points projecting from the hourglass. Errors can be introduced if the original images are poorly deblurred. The best way to deal with the issue of residual background staining is to raise the staining threshold. Such an adjustment decreases the number of pixels but, at least in the simulated data does not alter the fundamental staining relationships (Fig. 2 E).
Intensity correlation quotient. We devised an easily calculated and statistically testable quotient to provide an overall index of whether the staining intensities are associated in a random, a dependent or a segregated manner. Although the ΣN(A i - a)(B i - b) value is an indication of these relationships, its usefulness is compromised by the complexity of analysis because the individual (A i - a)(B i - b) values were in all cases non-normally distributed (Shapiro-Wilk test). However, we found that the nonparametric sign test provides an excellent, simple, and practical analysis method. This test uses solely the polarity of each (A i - a)(B i - b) value and has the intrinsic advantage of removing any bias in the test for pixels of particularly high or low staining intensity.
For each image we counted the number of pixels that generated positive or negative (A i - a)(B i - b) values. A ratio of the number of positive values to the total number of pixel pairs is a fraction that reflects the degree of dependency. The intensity correlation quotient (ICQ) was generated by subtracting 0.5 from this value (to distribute the quotients to the -0.5 to +0.5 range). With random (or mixed) staining ICQ = ∼0; dependent staining 0 < ICQ ≤ +0.5, and for segregated staining 0 > ICQ ≥ -0.5. The normal approximation of the sign test was used to test if these values were significantly different from 0. The sign test analysis correctly predicted dependent, segregated, and random correlations for all of the simulated staining models, including the random-segregated model (Fig. 2).
We next tested the ICQ method on the control staining pairs in Figure 1. The ICQ values were +0.48 (_p_sign test < 0.001) for the dependent data in Figure 1 B, and -0.19 (_p_sign test < 0.001) for the segregated staining in Figure 1 D, consistent with predictions. The plot in Figure 1 F generated an ICQ of +0.017 that was not significantly different from 0 (psign test > 0.1). This ICQ value most likely results from regions with both dependent and segregated stained areas in this image. The interpretation of this finding for this specific set of Ab stains is beyond the scope of this report.
Statistical analysis. Values are presented as mean ± SE. Tests for significance are with Student's t test (p) or by means of the normal approximation of the sign test (psign test).
Results
Characterization of the Ab571 Antibody
Ab specificity
Western blot with Ab571 (200× dilution; 0.27 mg/ml) against chick brain (N = 22) (Fig. 3_A_) lysate yielded a high molecular weight band at ∼250 kDa, the approximate molecular weight for CaV2.2. An identical band was observed with Ab572 (data not shown). Similar bands were obtained with rat brain lysates (data not shown), demonstrating that this Ab cross-reacts with CaV2.2 in a wide range of species. We demonstrated that Ab571 identifies the same target protein as a well characterized Ab against CaV2.2, CW21, both on a Western blot and in proteins immunoprecipitated with Ab571 (N = 2) (Fig. 3_B_). Ab571 also identified the doublet band of 6His-tagged CaV2.2 II-III loop (N = 3) (Fig. 3_C_) (fusion protein from G. Zamponi). Thus, we concluded that Ab571 is specific for CaV2.2. Our primary use for this Ab is in the identification and characterization of presynaptic Ca channels. As such it was important to determine if it cross-reacts with the P-type (α1A; CaV2.1) channel, the main alternative presynaptic Ca channel, at least in the rat CNS. We compared Ab571 with a previously characterized Ab against CaV2.1, CW65. The two antibodies identified distinct molecular weight protein bands in both chick (N = 6) (Fig. 3_D_) and rat brain lysates (data not shown). Thus, Ab571 is specific for N-type versus P-type Ca channels.
Figure 3.
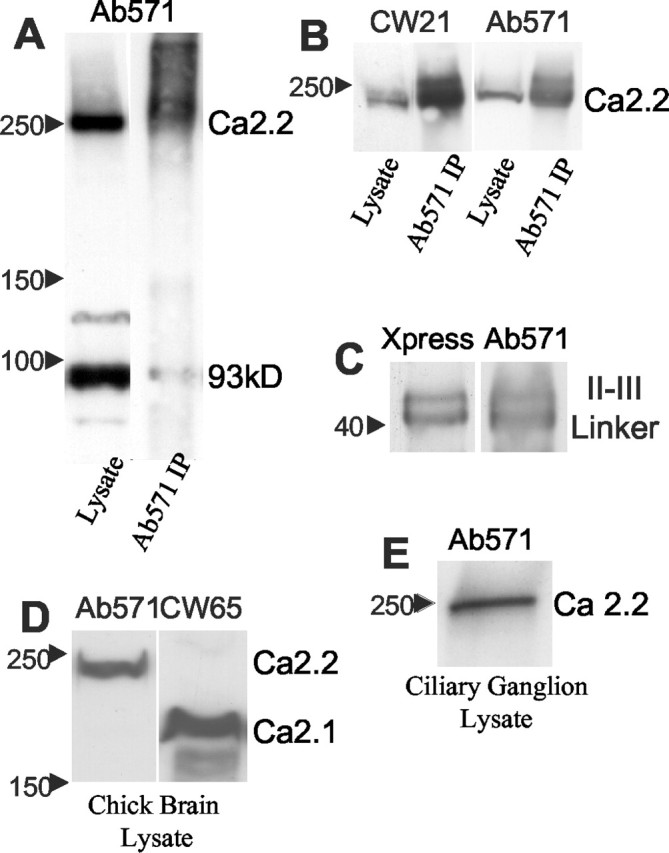
Biochemical characterization of Ab571. A, AB571 identifies a protein band corresponding to the molecular weight of the N-type Ca channel. Western blot analysis of chick brain (left column) and Ab571 immunoprecipitate (right column) both exhibit strong bands at ∼250 kDa that correspond to CaV2.2. The Western blot also exhibits a prominent band at ∼93 kDa that does not, however, immunoprecipitate. B, Comparison of Ab571 and CW21 Ab blots. The two panels are from the same gel and show the high molecular weight range of a Western blot (left column) and an Ab571 immunoprecipitate (right column). The left panel was probed with CW21 (CaV2.2) and the right panel with Ab571. Note the indistinguishable high molecular weight band. C, Ab571 recognizes rat CaV 2.2 II-III loop fusion protein. Ab571 identified the same band doublet as Ab against the fusion protein 6His tag. Western blot, 2.5 μg/lane. D, Ab571 distinguishes N-type and P-type Ca channels. The Ca channel identified by Ab571 in chick brain lysate (left) has a molecular weight that is distinct from that identified by the CaV 2.1-specific CW65 Ab (P type) channel (right). E, Ab571 identifies the N-type channel in chick ciliary ganglion. Western blot of chick ciliary ganglion lysate demonstrating a high molecular weight band corresponding to the N-type Ca channel.
Western blots with Ab571 consistently gave a second prominent band at ∼93 kDa (Fig. 3_A_, left column), suggesting either the presence of a Ca channel fragment or cross-reaction with a different antigen. We examined this binding further because a major different antigen might limit the usefulness of the Ab for both biochemical and immunocytochemical uses. The protein was unlikely to be a Ca channel fragment because it was not precipitated by Ab572. The 93 kDa band was markedly reduced after a low-frequency spin (1000 × g) of the chick brain lysate before Ab addition (data not shown). This finding strongly suggests that the contaminant is an antigen associated with a dense cell organelle, most likely the nucleus. This hypothesis was supported by the finding that nuclei were routinely stained when Ab571 was used at high concentration in immunocytochemistry (data not shown). Fortunately, the 93 kDa band was greatly reduced when Ab571 target proteins were immunoprecipitated (Fig. 3_A_, right column), suggesting that in the nondenatured brain lysate the contaminating protein antigen is physically sequestered from Ab access. We did not characterize this antigen further. The minimal contaminating bands obtained when Ab571 was used to IP chick brain suggests that this Ab can serve as a tool for coIP of proteins that complex with the N-type Ca channel. Even if this Ab precipitated a nuclear protein complex, it is highly unlikely that any component would correspond to a presynaptic protein.
Localization of the Ca channel at nerve terminals
Hippocampal neuron cultures. Staining of hippocampal neuron cultures with Ab571 yielded small bright puncta that coursed along the same tracks as stains for the nerve terminal-associated protein syntaxin (Fig. 4_A_), or SV2, an integral membrane protein of the secretory vesicle (Fig. 4_B_). However, because these structures are very small it is not possible to discern if the staining patterns reflect actual protein associations. Rat brain neurons use several Ca channel types, notably the P type, to gate transmitter release. Hence, at least some of the secretory vesicle clusters stained with SV2 but not associated with an Ab571 puncta may well be associated with nerve terminals that use an alternative Ca channel type.
Figure 4.
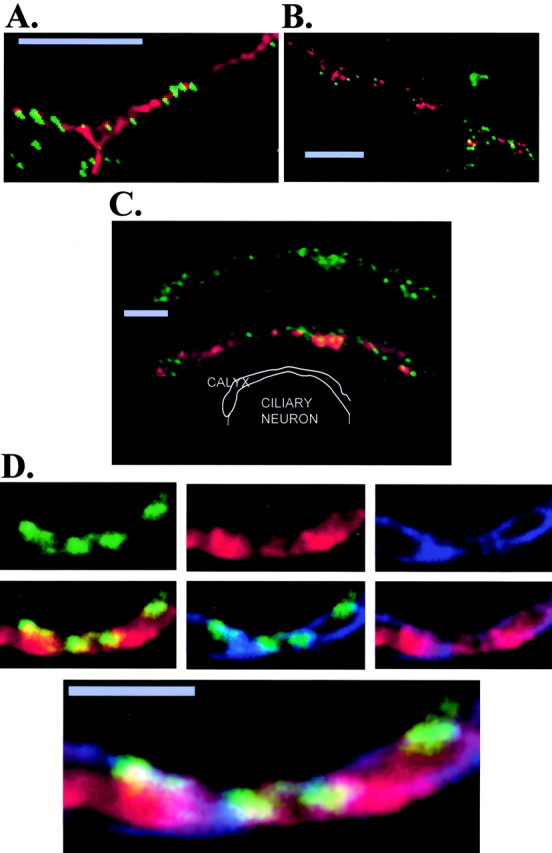
Ab571 staining localized release sites at the chick ciliary ganglion calyx nerve terminal. A, Primary hippocampal neuron culture stained with Ab571 (green) and monoclonal anti-syntaxin (red). Note Ca channel puncta are along the same trajectories as the syntaxin staining, consistent with the synaptic contacts formed by a nerve fiber process onto an underlying postsynaptic neuron (data not shown). B, As for A except double-stained with monoclonal anti-SV2 (red). Some colocalization of the two dyes was noted in both A and B, but puncta of single stained syntaxin, SV2, or Ca channels were also evident. C, An optical section through a calyx presynaptic terminal attached to postsynaptic ciliary neuron stained for Ca channels (Ab571; green, top panel) and both Ab571 and synaptic vesicle clusters (SV2; red, bottom panel). A diagram (not to scale) of the synapse is presented in the bottom panel. D, Calyx terminal stained with Ab571 (top left panel) rabbit polyclonal SV2 (top center panel), and Na-K pump (top right panel) using the pretty-poly multiple polyclonal immunostaining technique (see Results). The next three (middle row) panels show colocalization of Ab517 and SV2 (left panel, middle row), Ab571 and Na-K pump (center panel, middle row), and SV2 and Na-K pump (right panel, middle row). The bottom panel is a triple overlay of the three stains. The ciliary neuron is above the calyx. Note the Ca channel clusters on the transmitter release face aspect and the secretory vesicle clouds overlapping the channels and distal from the release site. The staining in the image has been adjusted digitally to enhance the resolution of the three structures. Some distortion of sizes (such as surface membrane thickness) is a result of both the membrane coursing through the image plane at an angle and of limitations in the resolution of the light microscope. Scale bars: A, B, 5 μm; C,D, 2 μm.
Dissociated chick ciliary ganglion. Ab571 identified a ∼250 kDa band in chick ciliary ganglion lysate (N = 6) (Fig. 3_E_) as in the chick brain lysate, confirming that the N-type Ca channel could be identified in this tissue. Ab571 immunostaining of dissociated chick ciliary ganglion neurons (Stanley and Goping, 1991) with Ab571 resulted in low intensity, but above background, stain of the ciliary neuron cytoplasm (data not shown). This staining could be accounted for by the local synthesis of Ca channels because these neurons also use N-type Ca channels at their presynaptic nerve terminals (Gray et al., 1992; White et al., 1997).
The calyx nerve terminal has two main advantages that combine to make it the preparation of choice for Ca channel/release site protein staining experiments at a fast transmitting synapse. First, virtually all the presynaptic Ca channels are N-type (Stanley and Atrakchi, 1990; Yawo and Chuhma, 1993) and second, the large size of this terminal permits the differentiation of specific regions of the terminal within the resolution of the light microscope (Stanley and Mirotznik, 1997; Mirotznik et al., 2000; Chen et al., 2002).
Ab571 stained the calyx nerve terminals in small bright puncta that were located in the presynaptic release face region (Fig. 4_C_, top panel) as well as some puncta that appeared to be located within the terminal itself (as was confirmed by costaining with a surface membrane marker, the Na-K pump; data not shown).
Ab571 stained puncta associate with synaptic vesicle clusters. Synaptic vesicle clouds (localized with anti-SV2) were associated with many Ca channel clusters (Fig. 4_C_). To confirm that these Ca channel clusters were located in the presynaptic region, we triple-stained calyx terminals with a monoclonal for Na-K pumps to mark the surface membrane, and two rabbit polyclonal antibodies against the other two targets, Ab571 and SV2, using the pretty-poly technique (Morris and Stanley, 2003). This demonstrated clearly that the Ab571 stains puncta on the release face aspect of the calyx abutting intracellular synaptic vesicle clouds (Fig. 4_D_).
The immunostaining results, together with the biochemical analysis of Ab571 binding, confirm that this Ab can be used to localize Ca channels at the release sites in these presynaptic nerve terminals.
Syntaxin 1 localization
Syntaxin 1 associates with MUNC18
We have previously demonstrated that syntaxin 1 is widely distributed at the nerve terminal and is both on the Schwann cell aspect (the nonsynaptic face) as well as the synaptic aspect that abuts the ciliary neuron (Stanley and Mirotznik, 1997), although staining was consistently more intense on the synaptic aspect. Several recent studies have concluded that syntaxin forms a strong association with MUNC18-1 (Pevsner et al., 1994), a protein that has been hypothesized to bind to syntaxin after vesicular fusion (Dulubova et al., 1999, 2003). Our findings were consistent with a syntaxin 1/MUNC18-1 complex in that chick brain syntaxin 1 coimmunoprecipitated with MUNC18 (Fig. 5_A_). We used immunocytochemistry to test if these two proteins were associated at the presynaptic terminal (Fig. 5_B_). A visual inspection of the staining pairs suggested colocalization of the proteins at the surface membrane. We used the ICA method to test for a staining relation between syntaxin and MUNC18 (Fig. 5_C_) (see Materials and Methods). The (A - a)(B - b) plots were strongly skewed toward positive values (Fig. 5_C_, middle and bottom panels), consistent with a highly dependent staining pattern. Furthermore, the calculated ICQ values were consistently positive and highly significant (+0.21 ± 0.03; p < 0.001; N = 6). This analysis provides compelling evidence that staining for syntaxin 1 varies in synchrony with that for MUNC18-1, consistent with the formation of a complex within the nerve terminal.
Figure 5.
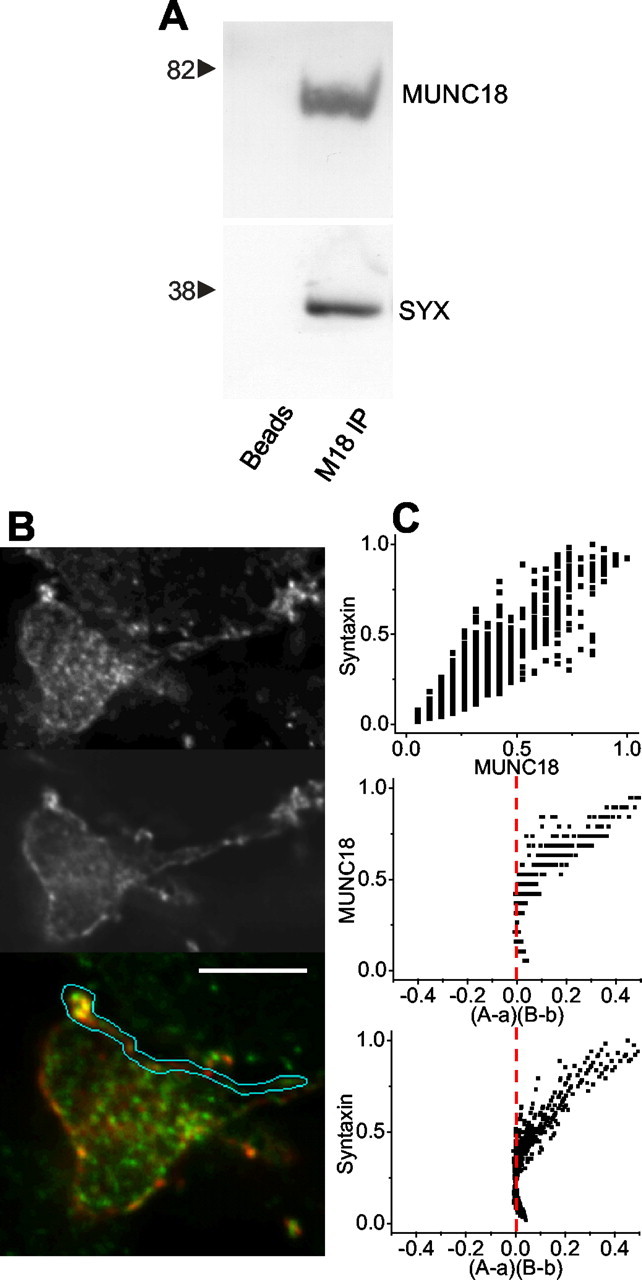
Syntaxin association with MUNC18. A, Immunoprecipitation of MUNC18 from chick brain lysate coprecipitates syntaxin 1 (right column). The left column is a bead control. B, An optical section through a calyx nerve terminal synapse stained for MUNC18 (B/W top panel; green, bottom panel) and syntaxin 1 (B/W center panel; red, bottom panel). The release site membrane has been isolated for colocalization analysis. Scale bar, 5 μm. C, Intensity correlation analysis for syntaxin staining compared with MUNC18. Top panel, Scatter plot of pixel staining intensities for MUNC18 and syntaxin 1. Center and bottom panels, ICA plots of MUNC18-1 and syntaxin 1 staining intensities against their respective (A - a)(B - b) values. ICQ = +0.34; _p_sign test < 0.001.
Syntaxin 1 association with Ca channels
Ab571 immunoprecipitation of N-type Ca channels from chick brain lysate coprecipitated syntaxin 1 (Fig. 6_A_). Immobilized chick brain Ca channels could also be used to pull down syntaxin 1 fusion protein (Fig. 6_A_). Interestingly, the addition of either of two syntaxin 1 fusion protein variants reduced the intensity of the coprecipitated native syntaxin 1 band. This finding raises the possibility that the Ca channel-syntaxin coprecipitation reflects, at least in part, a complex that is formed in vitro during the incubation of the antibodies with the lysate. Hence, it cannot be concluded with confidence from such results alone that this complex actually exists in situ.
Figure 6.
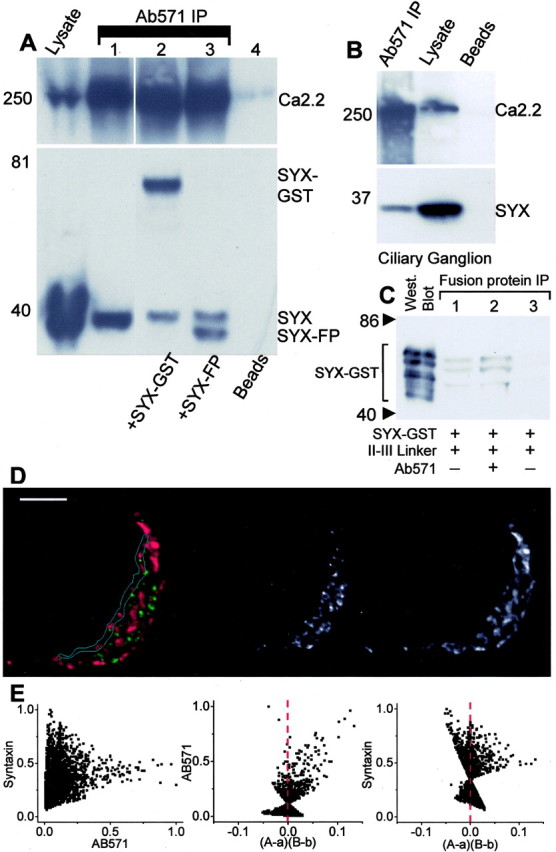
Syntaxin 1 association with Ca channels. A, Western blot of chick brain lysate (left lane) together with blots of Ab571 immunoprecipitates (columns 1-4) probed with Ab571 (top panel) or syntaxin 1 (bottom panel). Native syntaxin 1 (#1), GST-syntaxin 1 (#2), and syntaxin 1 fusion protein (#3) added to the lysate all coprecipitated with CaV2.2. Column 4 is a bead control. B, Ab571 coprecipitates syntaxin 1 from chick ciliary ganglion lysate. C, Ab571 does not occlude syntaxin 1 binding to a Ca channel II-III loop fusion protein. Left column, Western blot of (rat) syntaxin 1-glutathione _S_-transferase fusion protein (5 μg). Columns 1-3, II-III loop fusion protein IP, syntax in 1-glutathione _S_-transferase co-IP. Column1, Syntaxin 1-glutathione _S_-transferase (5 μg throughout) co-IP with 6 His-tagged II-III loop (5 μg) using Xpress Ab. Column 2, as in (column 1) but after pretreatment of the II-III loop fusion protein with Ab571. Column 3, bead control as in column 2 but without Xpress Ab. D, E, As in Figure 5_B,C_ but comparing the intensities of Ca channel (green, left panel; B/W center panel) and syntaxin 1 (red, left panel; B/W right panel) staining. Note the very wide range of syntaxin 1 pixel intensities at low Ca channel staining intensities plus the tail region at the higher Ca channel staining intensities. Scale bar, 5 μm. ICQ = +0.11; _p_sign test < 0.01.
To obtain further insight into the association of these proteins, we examined their location at the transmitter release face of the calyx presynaptic nerve terminal by immunocytochemistry. Calyx terminals were costained with Ab571 and monoclonal anti-syntaxin 1 antibodies. We considered the possibility that Ab571 might be prevented from localizing syntaxin 1-bound Ca channels because both the Ab and syntaxin 1 bind to a similar region of the II-III loop (Vance et al., 1999). This possibility is rendered unlikely by the findings that syntaxin 1-complexed Ca channel was immunoprecipitated by Ab571 (Fig. 6_A,B_) and that pretreatment with Ab571 did not block binding of syntaxin 1-glutathione _S_-transferase, as tested by fusion protein coIP (N = 3) (Fig. 6_C_). Hence, it appears that syntaxin 1 and Ab571 do not occlude each other from their respective binding sites. Syntaxin 1 staining was widely distributed across the nerve terminal, and it was not possible to determine by visual inspection alone whether the protein was colocalized with the Ca channels (Fig. 6). We performed a more detailed analysis of the release face region by ICA. Although in some terminals there was evidence of a dependent relation between Ca channel and syntaxin 1 (Fig. 6_D,E_), this was not consistent (ICQ = +0.07 ± 0.04, 0.1 < p < 0.05; N = 9). However, at all terminals examined, the pixels with high Ca channel staining intensity were invariably associated with at least some syntaxin staining (Fig. 6_E_, left panel). This was even more evident in the (A - a)(B - b) plot in which a dependent staining pattern was evident in the Ab571 scatterplot but not the syntaxin 1 plot (Fig. 6_E_, center and right panels, respectively). As discussed above, we interpret these findings to conclude that the release face Ca channels are associated with syntaxin 1 but, conversely, that the majority of the syntaxin 1 is not associated with the channels.
GαO association with the presynaptic Ca channel
GαO is not a stable component of a Ca channel protein complex
We used immunoprecipitation with Ab571 to test if GαO is part of a complex with the Ca channel in either its monomeric, α subunit, or trimeric α/βγ state. The latter was examined by performing the precipitations in the presence or absence of GTPγS, a sterically restricted tonic G-protein activator. GαO did not coIP with the Ca channel, whether in the resting Gβγ bound, or GTPγS-activated Gβγ-free state (Fig. 7_A_). Similar results were obtained when the brain lysate was solubilized with 3-[(3-cholamidopropyl)dimethylammonio]-1-propanesulfonate (data not shown).
Figure 7.

Association of GαO with the Ca channel. A, Immunoprecipitation of GαO coprecipitated Gβ from chick brain lysate in the absence (left column) but not in the presence (second column) of the G-protein activator GTPγS. Immunoprecipitation of CaV2.2 failed to coprecipitate GαO with or without GTPγS. B, Isolated calyx terminal stained for CaV2.2 (green, top image; bottom left B/W image) and GαO (red, top image; bottom right B/W image). Membrane regions used for quantitative analysis are identified. Scale bar, 2 μm. C The GαO staining intensity (B) is compared with that for CaV2.2 with the method as described in Figure 5_B,C_. Note the positively skewed intensity versus (A - a)(B - b) plots, consistent with dependent staining. ICQ = +0.15; _p_sign test < 0.001.
GαO is associated with presynaptic Ca channels
Calyx terminals were stained with both Ab571 and GαO. Because G-protein stains both the presynaptic and postsynaptic synapse membranes (Mirotznik et al., 2000), we restricted our colocalization analysis to fully isolated calyx nerve terminals (Fig. 7_B_). A visual inspection of the stains on the membrane provided suggestive evidence for a colocalization of GαO with Ca channels. However, the ICA analysis was consistently in favor of such an association, both with respect to the staining amplitude (A - a)(B - b) plots (Fig. 7_C_) and positive ICQ values (all p < 0.001) in five calyces (+0.12, +0.13, +0.10, +0.15, +0.10; mean 0.12 ± 0.01, p t test < 0.001). Thus, despite the lack of evidence for a biochemical link between the Ca channel and GαO, the immunocytochemical evidence suggests that these two proteins vary in synchrony on the calyx membrane and are likely components of the same complex. The Gβ Ab could not be used for immunocytochemistry and hence precluded a test colocalization with the Ca channel.
GαO association with syntaxin
We next tested for a biochemical association of syntaxin 1 with GαO. However, neither immunoprecipitation of syntaxin nor of GαO succeeded in the coIP of the other protein (data not shown). Staining for GαO and syntaxin yielded visual evidence for colocalization on the surface membrane (Fig. 8_A_). In addition, a strongly dependent staining pattern on the calyx membrane was indicated both by positively skewed ICA scatter plots (Fig. 8_B_) and by positive ICQ values in three calyces (+0.19, +0.21, +0.25; _p_sign test < 0.001).
Figure 8.

Association of GαO with syntaxin 1 on the nerve terminal membrane. A, Optical section through an isolated calyx presynaptic nerve terminal stained for syntaxin 1 (red, left panel; B/W center panel) and GαO (green, left panel; B/W right panel). Scale bar, 5 μm. B, Intensity correlation plots of GαO with respect to syntaxin (Fig. 5_B,C_). Note the positively skewed intensity versus (A - a)(B - b) plots, consistent with dependent staining. ICQ = +0.25; _p_sign test < 0.001.
GαO association with MUNC18
Our results indicate a high degree of colocalization of syntaxin 1 with MUNC18 on the calyx membrane and, in addition that syntaxin 1 also correlated with GαO. We therefore tested whether GαO was also associated with MUNC18. However, the two proteins did not coprecipitate (N = 4, data not shown), and positive ICQ values were obtained only in four of eight calyces, with an average ICQ value that was not significantly different from 0 (+0.07 ± 0.04, 0.1 > p > 0.05; N = 8). These results argue against a strong association between MUNC18 and GαO in the calyx membrane.
Discussion
In earlier reports (Stanley and Mirotznik, 1997; Mirotznik et al., 2000) we suggested that presynaptic Ca channels, syntaxin 1, and GαO are components of a common functional complex at the presynaptic nerve terminal release site. The present study was initiated to test this idea using biochemical and morphological approaches. Our findings provide support for an N-type Ca channel-GαO-syntaxin complex at the intact terminal and, further, identify a second prominent syntaxin 1 complex with MUNC18-1.
This study was made possible by the high affinity and selective Ab571 that we have shown to identify CaV2.2 (N-type, α1B Ca channels) on the basis of molecular weight, II-III loop binding site, by comparison with a previously well characterized Ab and by selectivity from CaV2.1 (Fig. 3). Furthermore, Ab571 selectively immunoprecipitates N-type Ca channels (Fig. 3_A,B_) and coprecipitates associated proteins (Fig. 6 A,B), whereas immunostaining with Ab571 localizes N-type Ca channel clusters at both chick and rat nerve terminals (Fig. 4_A-C_). The Ca channels were located on the synaptic aspect of the calyx nerve terminal surface membrane and associated with secretory vesicles clusters (Fig. 4_D_).
The development of the ICA-ICQ costaining analysis is a key element of this study. ICA analysis involves generating scatter-plots of stain A or stain B against the product of the difference of each pixel A and B intensities from their respective means. The resulting plots emphasize the high intensity stained pixels and allow us to identify protein pairs that vary in synchrony, randomly, or independently within the cell. This technique is distinguished from the usual dye-overlap method by its focus on the variations in protein concentrations across the cell and not simply their locations. Perhaps the worst limitation of the dye-overlapmethod is that when one protein target is distributed across most or all of the cell, a second protein will be identified as colocalized even when its distribution is totally random with respect to the first. The ICA method avoids this mistake because if a randomly distributed protein overlaps with a broadly staining one, it will not be reported as associated because it does not vary in synchrony (simulation data not shown). We also present the ICQ, which serves as a statistically testable, single-value assessment of the relationship between the stained protein pairs. Although more naive than the ICA, its simplicity and utility make it an attractive tool for general use. We plan to develop a more sophisticated analysis based on the actual (A - a)(B - b) values (as apart from just their polarity) in due course. The ICA-ICQ analysis represents a powerful complement to standard biochemical IP tests for the analysis of protein complexes. The strength of the IP approach lies in identifying proteins bound in high-affinity complexes. However, it has disadvantages in missing any low-affinity associations (because of the necessary washing steps) and in the requirement for solubilization of the tissue, effectively eliminating virtually all clues not only to the location of the complex within the intact cell, but even from which cell or tissue type the complex originates. Other limitations include differentiating natural complex from those formed in vitro during lysate incubation (Fig. 6 A). ICA-ICQ analysis, on the other hand, has advantages in identifying potential low-affinity protein complexes and in retaining information on the cellular and subcellular location. Its limitations include the failure to distinguish two proteins that are parts of a molecular complex from two that are components of a common (small) organelle. Other limitations, such as the occlusion of Ab binding sites because of the protein interactions and an inability to distinguish direct from indirect protein-protein binding, are common to both IP and ICA techniques.
Our study focuses on syntaxin 1, which is known to associate with a number of cytoplasmic and membrane proteins. A number of reports have concluded that syntaxin 1 can exist in an open, active configuration, as well as a closed inactive one stabilized by MUNC18-1 (Hata et al., 1993; Kee et al., 1995; Misura et al., 2000). To test for a syntaxin 1/MUNC18-1 complex in situ we stained for MUNC18 and syntaxin 1 and performed a quantitative analysis of staining dependency. We find that these proteins exhibit a strong staining intensity correlation (Fig. 5). This indicates that syntaxin 1 and MUNC18 vary in synchrony and suggests that the majority of presynaptic syntaxin 1 exists in a chaperoned and possibly inactive form (Pevsner et al., 1994; Garcia et al., 1995; Hata and Südhof, 1995).
We next examined the association of syntaxin 1 with the N-type Ca channel. Considerable evidence supports direct binding of these two proteins in vitro (Saisu et al., 1991; Yoshida et al., 1992; David et al., 1993; Sheng et al., 1994; Schmid et al., 1995; Vance et al., 1999) and their association has been demonstrated previously at the presynaptic terminal (Bouvier et al., 1996; Seagar and Takahashi, 1998). We first used Ab571 to confirm that syntaxin 1 coimmunoprecipitates with the N-type Ca channel in both chick brain and ciliary ganglion lysates (Fig. 6_A,B_). Immunocytochemical staining demonstrated that syntaxin 1 was consistently present in regions of high Ca channel staining. Previous studies have also noted a colocalization of syntaxin with the presynaptic Ca channel but that the distribution of syntaxin extends beyond that of the release sites (Bouvier et al., 1996; Raciborska et al., 1998). Our findings suggest that this syntaxin 1 is in a nonrelease site complex with MUNC18-1. At the release site syntaxin 1 is in a complex with N-type channel, a link that may play a role in the regulation of presynaptic Ca channel properties (see Introduction). It is unlikely that syntaxin tethers the Ca channel to the release site since its cleavage does not cause the large membrane particles at freeze-fractured frog neuromuscular terminals, previously attributed to Ca channels, to drift away (Stanley et al., 2003). Nonetheless, syntaxin 1 appears to play an important role in the formation of the secretory vesicle docking site itself (Stanley et al., 2003).
We next examined the association of GαO, a prime candidate as the modulator of Ca channels (Mirotznik et al., 2000), with the presynaptic channels. We performed numerous IP trials to test for a molecular complex that included GαO and CaV2.2. Invariably, precipitation of either protein invariably failed to co-IP the other, whether or not the G-protein α subunit was in its resting (trimeric) or activated (monomeric) state. Thus, under our conditions we were unable to demonstrate a stable complex between GαO and the N-type Ca channel, as reported (McEnery et al., 1994). In contrast, double staining of the calyx nerve terminals for GαO and CaV2.2 yielded evidence of highly synchronous staining, consistent with the conclusion that at the presynaptic nerve terminal membrane GαO is a component of Ca channel complex. Thus, it remains possible that our solubilization protocols used for IP were more stringent than that used by McEnery et al. (1994), effectively dissociating an existing low-affinity complex.
These findings provide additional insight into the interrelationship between the presynaptic Ca channel and two proteins known to play a prominent role in its modulation. Our hypothesis of a tri-protein complex was supported by both an association between the presynaptic Ca channel with both syntaxin 1 and the G-protein, a finding supported further by the colocalization of G-protein with syntaxin 1. In addition, our findings provide evidence for two syntaxin 1 complexes in the nerve terminal. The first one is associated with the Ca channel at the transmitter release site, as would be expected for both a role in vesicle fusion and also in the modulation of the channel itself. The observation that G-protein modulation of presynaptic Ca channels is disrupted by syntaxin 1 cleavage (Stanley and Mirotznik, 1997) is consistent with the idea that the localization of the G-protein to the Ca channel requires syntaxin 1 and that these proteins form a functional complex for channel modulation. However, by far the majority of the syntaxin 1 protein appears to be in association with MUNC18 at a location that is distinct from the Ca channel and, by inference, the release site. We do not know the role of the putative syntaxin 1-MUNC18-1 complex. It could reflect a syntaxin pool reserve for rapid transmitter turnover or may serve a separate role in nerve terminal function.
Footnotes
This work was supported by Canadian Institutes of Health Research awards MOP38091 and 57716 and a Canada Research Chair to E.F.S. We thank Drs. Shuzo Sugita, Lyanne Schlichter, and Rajesh Khanna for comments, Gerald Zamponi (University of Calgary) for constructs, and Maureen McEnery (Case Western Reserve University, School of Medicine) for antibodies.
Correspondence should be addressed to Dr. Elise F. Stanley, MP14-320, Toronto Western Research Institute, 399 Bathurst Street, Toronto, Ontario, M5T 2S8 Canada. E-mail: estanley@uhnres.utoronto.ca.
Copyright © 2004 Society for Neuroscience 0270-6474/04/244070-12$15.00/0
*
Q.L., A.L., and T.J.M. contributed equally to this work.
References
- Bergsman JB, Tsien RW (2000) Syntaxin modulation of calcium channels in cortical synaptosomes as revealed by botulinum toxin C1. J Neurosci 20: 4368-4378. [DOI] [PMC free article] [PubMed] [Google Scholar]
- Bezprozvanny I, Scheller RH, Tsien RW (1995) Functional impact of syntaxin on gating of N-type and Q-type calcium channels. Nature(Lond) 378: 623-626. [DOI] [PubMed] [Google Scholar]
- Bouvier JA, Charvin N, Boudier JL, Fathallah M, Tagaya M, Takahashi M, Seagar M (1996) Distribution of components of the SNARE complex in relation to transmitter release sites at the frog neuromuscular junction. Eur J Neurosci 8: 545-552. [DOI] [PubMed] [Google Scholar]
- Brewer GJ (1997) Isolation and culture of adult rat hippocampal neurons. J Neurosci Methods 71: 143-155. [DOI] [PubMed] [Google Scholar]
- Chen S, Zheng X, Schulze KL, Morris T, Bellen H, Stanley EF (2002) Enhancement of presynaptic calcium current by cysteine string current. J Physiol (Lond) 538: 383-389. [DOI] [PMC free article] [PubMed] [Google Scholar]
- David P, El Far O, Martin-Mouto N, Poupon MF, Takahashi M, Seagar MJ (1993) Expression of synaptotagmin and syntaxin associated with N-type calcium channels in small cell lung cancer. FEBS Lett 326: 135-139. [DOI] [PubMed] [Google Scholar]
- Degtiar VE, Scheller RH, Tsien RW (2000) Syntaxin modulation of slow inactivation of N-type calcium channels. J Neurosci 20: 4355-4367. [DOI] [PMC free article] [PubMed] [Google Scholar]
- Dulubova I, Sugita S, Hill S, Hosaka M, Fernandez I, Sudhof TC, Rizo J (1999) A conformational switch in syntaxin during exocytosis: role of munc18. EMBO J 18: 4372-4382. [DOI] [PMC free article] [PubMed] [Google Scholar]
- Dulubova I, Yamaguchi T, Arac D, Li H, Huryeva I, Min SW, Rizo J, Sudhof TC (2003) Convergence and divergence in the mechanism of SNARE binding by Sec1/Munc18-like proteins. Proc Natl Acad Sci USA 100: 32-37. [DOI] [PMC free article] [PubMed] [Google Scholar]
- Fletcher CF, Tottene A, Lennon VA, Wilson SM, Dubel SJ, Paylor R, Hosford DA, Tessarollo L, McEnery MW, Pietrobon D, Copeland NG, Jenkins NA (2001) Dystonia and cerebellar atrophy in Cacna1a null mice lacking P/Q calcium channel activity. FASEB J 15: 1288-1290. [DOI] [PubMed] [Google Scholar]
- Garcia EP, McPherson PS, Chilcote TJ, Takei K, De Camilli P (1995) rbSec1A and B colocalize with syntaxin 1 and SNAP-25 throughout the axon, but are not in a stable complex with syntaxin. J Cell Biol 129: 105-120. [DOI] [PMC free article] [PubMed] [Google Scholar]
- Gray DB, Brusés JL, Pilar GR (1992) Developmental switch in the pharmacology of Ca2+ channels coupled to acetylcholine release. Neuron 8: 715-724. [DOI] [PubMed] [Google Scholar]
- Hata Y, Slaughter CA, Sudhof TC (1993) Synaptic vesicle fusion complex contains unc-18 homologue bound to syntaxin. Nature (Lond) 366: 347-351. [DOI] [PubMed] [Google Scholar]
- Hata Y, Südhof TC (1995) A novel ubiquitous form of Munc-18 interacts with multiple syntaxins. Use of the yeast two-hybrid system to study interactions between proteins involved in membrane traffic. J Biol Chem 270: 13022-13028. [DOI] [PubMed] [Google Scholar]
- Hille B (1994) Modulation of ion channels by G-protein coupled receptors. Trends Neurosci 17: 531-535. [DOI] [PubMed] [Google Scholar]
- Ikeda SR, Dunlap K (1999) Voltage-dependent modulation of N-type calcium channels: role of G protein subunits. Adv Second Messenger Phosphoprotein Res 1999: 131-151. [DOI] [PubMed] [Google Scholar]
- Jarvis SE, Zamponi GW (2001a) Distinct molecular determinants govern syntaxin 1A-mediated inactivation and G-protein inhibition of N-type calcium channels. J Neurosci 21: 2939-2948. [DOI] [PMC free article] [PubMed] [Google Scholar]
- Jarvis SE, Zamponi GW (2001b) Interactions between presynaptic Ca2+ channels, cytoplasmic messengers and proteins of the synaptic vesicle release complex. Trends Pharmacol Sci 22: 519-525. [DOI] [PubMed] [Google Scholar]
- Kee Y, Lin RC, Hsu S-C, Scheller RH (1995) Distinct domains of syntaxin are required for synaptic vesicle fusion complex formation and dissociation. Neuron 14: 991-998. [DOI] [PubMed] [Google Scholar]
- Lu Q, Dunlap K (1999) Cloning and functional expression of novel N-type Ca(2+) channel variants. J Biol Chem 274: 34566-34575. [DOI] [PubMed] [Google Scholar]
- Lu Q, AtKisson MS, Jarvis SE, Feng ZP, Zamponi GW, Dunlap K (2001) Syntaxin 1A supports voltage-dependent inhibition of alpha1B Ca2+ channels by Gβγ in chick sensory neurons. J Neurosci 21: 2949-2957. [DOI] [PMC free article] [PubMed] [Google Scholar]
- McEnery MW, Snowman AM, Snyder SH (1994) The association of endogenous Go alpha with the purified omega-conotoxin GVIA receptor. J Biol Chem 269: 5-8. [PubMed] [Google Scholar]
- McEnery MW, Haase H, Vance CL, Dubel SJ, Morano I, Copeland TD, Choi Y (1997) Beta1B subunit of voltage-dependent Ca2+ channels is predominant isoform expressed in human neuroblastoma cell line IMR32. FEBS Lett 420: 74-78. [DOI] [PubMed] [Google Scholar]
- Mirotznik RR, Zheng X, Stanley EF (2000) G-Protein types involved in calcium channel inhibition at a presynaptic nerve terminal. J Neurosci 20: 7614-7621. [DOI] [PMC free article] [PubMed] [Google Scholar]
- Misura KM, Scheller RH, Weis WI (2000) Three-dimensional structure of the neuronal-Sec1-syntaxin 1a complex. Nature (Lond) 404: 355-362. [DOI] [PubMed] [Google Scholar]
- Morris TJ, Stanley EF (2003) A simple method for immunocytochemical staining with multiple rabbit polyclonal antibodies. J Neurosci Methods 127: 149-155. [DOI] [PubMed] [Google Scholar]
- Pevsner J, Hsu S-C, Scheller RH (1994) n-Sec1: A neural-specific syntaxin-binding protein. Proc Natl Acad Sci USA 91: 1445-1449. [DOI] [PMC free article] [PubMed] [Google Scholar]
- Raciborska DA, Trimble WS, Charlton MP (1998) Presynaptic protein interactions in vivo: evidence from botulinum A, C, D, and E action at frog neuromuscular junction. Eur J Neurosci 10: 2617-2628. [DOI] [PubMed] [Google Scholar]
- Saisu H, Ibaraki K, Yamaguchi T, Sekine Y, Abe T (1991) Monoclonal antibodies immunoprecipitating omega-conotoxin-sensitive calcium channel molecules recognize two novel proteins localized in the nervous system. Biochem Biophys Res Commun 181: 59-66. [DOI] [PubMed] [Google Scholar]
- Schmid R, Seydl K, Baumgartner W, Groschner K, Romanin C (1995) Trypsin increases availability and open probability of cardiac L-type Ca2+ channels without affecting inactivation induced by Ca2+. Biophys J 69: 1847-1857. [DOI] [PMC free article] [PubMed] [Google Scholar]
- Seagar M, Takahashi M (1998) Interactions between presynaptic calcium channels and proteins implicated in synaptic vesicle trafficking and exocytosis. J Bioenerg Biomembr 30: 347-356. [DOI] [PubMed] [Google Scholar]
- Sheng Z-H, Rettig J, Takahashi M, Catterall WA (1994) Identification of a syntaxin-binding site on N-type calcium channels. Neuron 13: 1303-1313. [DOI] [PubMed] [Google Scholar]
- Stanley EF (1991) Single calcium channels on a cholinergic presynaptic nerve terminal. Neuron 7: 585-591. [DOI] [PubMed] [Google Scholar]
- Stanley EF (2003) Syntaxin I modulation of presynaptic calcium channel inactivation revealed by botulinum toxin C1. Eur J Neurosci 17: 1303-1305. [DOI] [PubMed] [Google Scholar]
- Stanley EF, Atrakchi AH (1990) Calcium currents recorded from a vertebrate presynaptic nerve terminal are resistant to the dihydropyridine nifedipine. Proc Natl Acad Sci USA 87: 9683-9687. [DOI] [PMC free article] [PubMed] [Google Scholar]
- Stanley EF, Goping G (1991) Characterization of a calcium current in a vertebrate cholinergic presynaptic nerve terminal. J Neurosci 11: 985-993. [DOI] [PMC free article] [PubMed] [Google Scholar]
- Stanley EF, Mirotznik RR (1997) Cleavage of syntaxin prevents G-protein regulation of presynaptic calcium channels. Nature (Lond) 385: 340-343. [DOI] [PubMed] [Google Scholar]
- Stanley EF, Reese TS, Wang GZ (2003) Molecular scaffold reorganization at the transmitter release site with vesicle exocytosis or botulinum toxin C1. Eur J Neurosci 18: 2403-2407. [DOI] [PubMed] [Google Scholar]
- Sun XP, Stanley EF (1996) An ATP-activated, ligand gated ion channel on a cholinergic presynaptic nerve terminal. Proc Natl Acad Sci USA 93: 1859-1863. [DOI] [PMC free article] [PubMed] [Google Scholar]
- Takahashi T, Kajikawa Y, Tsujimoto T (1998) G-Protein-coupled modulation of presynaptic calcium currents and transmitter release by a GABAB receptor. J Neurosci 18: 3138-3146. [DOI] [PMC free article] [PubMed] [Google Scholar]
- Vance CL, Begg CM, Lee WL, Dubel SJ, Copeland TD, Sonnichsen FD, McEnery MW (1999) N-type calcium channel/syntaxin/SNAP-25 complex probed by antibodies to II-III intracellular loop of the alpha1B subunit. Neuroscience 90: 665-676. [DOI] [PubMed] [Google Scholar]
- White MG, Crumling MA, Meriney SD (1997) Developmental changes in calcium current pharmacology and somatostatin inhibition in chick para-sympathetic neurons. J Neurosci 17: 6302-6313. [DOI] [PMC free article] [PubMed] [Google Scholar]
- Wiser O, Bennett MK, Atlas D (1996) Functional interaction of syntaxin and SNAP-25 with voltage sensitive L- and N-type Ca2+ channels. EMBO J 15: 4100-4110. [PMC free article] [PubMed] [Google Scholar]
- Yawo H, Chuhma N (1993) Preferential inhibition of omega-conotoxin-sensitive presynaptic Ca2+ channels by adenosine autoreceptors. Nature (Lond) 365: 256-258. [DOI] [PubMed] [Google Scholar]
- Yoshida A, Oho C, Omori A, Kuwahara R, Ito T, Takahashi M (1992) HPC-1 is associated with synaptotagmin and omega-conotoxin receptor. J Biol Chem 267: 24925-24928. [PubMed] [Google Scholar]