The Sleep Slow Oscillation as a Traveling Wave (original) (raw)
Abstract
During much of sleep, virtually all cortical neurons undergo a slow oscillation (<1 Hz) in membrane potential, cycling from a hyperpolarized state of silence to a depolarized state of intense firing. This slow oscillation is the fundamental cellular phenomenon that organizes other sleep rhythms such as spindles and slow waves. Using high-density electroencephalogram recordings in humans, we show here that each cycle of the slow oscillation is a traveling wave. Each wave originates at a definite site and travels over the scalp at an estimated speed of 1.2-7.0 m/sec. Waves originate more frequently in prefrontal-orbitofrontal regions and propagate in an anteroposterior direction. Their rate of occurrence increases progressively reaching almost once per second as sleep deepens. The pattern of origin and propagation of sleep slow oscillations is reproducible across nights and subjects and provides a blueprint of cortical excitability and connectivity. The orderly propagation of correlated activity along connected pathways may play a role in spike timing-dependent synaptic plasticity during sleep.
Keywords: sleep, slow oscillation, human, EEG, cortex, spontaneous activity
Introduction
While asleep, animals lie immobile and partially disconnected from the environment, but the brain remains intensely active. During rapid eye movement (REM) sleep, this spontaneous activity appears in the electroencephalogram (EEG) as periods of low-voltage fast activity similar to wakefulness. During non-REM (NREM) sleep, which constitutes the vast majority of sleep, neural activity is reflected in the EEG as a succession of K-complexes, sleep spindles, and slow waves (Steriade, 2000). Intracellular recordings in animals have revealed that the fundamental cellular phenomenon underlying neural activity in NREM sleep is a slow oscillation (<1 Hz) of the membrane potential of cortical neurons (Steriade et al., 1993a). The slow oscillation comprises a hyperpolarization phase or down state, during which virtually all cortical neurons are deeply hyperpolarized and remain silent for a few hundred milliseconds. The down state is followed by a depolarization phase or up state that also lasts for several hundred milliseconds. During the up state, the membrane potential surges back to firing threshold, the entire thalamocortical system is seized by intense synaptic activity, and neurons fire at rates that are even higher than in quiet wakefulness (Steriade et al., 2001). The slow oscillation is initiated, maintained, and terminated through the interplay of intrinsic currents and network interactions, as shown by studies in vivo (Timofeev et al., 2000), in vitro (Sanchez-Vives and McCormick, 2000), and in computo (Bazhenov et al., 2002; Compte at al, 2003). It can be generated and sustained by the cerebral cortex alone (Steriade et al., 1993b; Timofeev and Steriade, 1996; Timofeev et al., 2000; Shu et al., 2003) and is disrupted by disconnection of intracortical pathways (Amzica and Steriade, 1995b).
The slow oscillation of NREM sleep thus represents a spontaneous event during which cortical neurons are alternately silent and active for a fraction of a second. Although this striking change in neuronal activity and excitability involves most of the cortex and repeats hundreds of times during a sleep episode, little is known about the spatial and temporal development of the slow oscillation. Specifically, is each slow oscillation a near-synchronous event, or does it spread through the cortex? If so, where does it originate, how does it propagate, and at what speed? To address these questions, we used a 256-channel EEG system, co-registered to individual magnetic resonance images (MRIs), to explore the spatiotemporal dynamics of the slow oscillation in sleeping humans. We found that each slow oscillation is a traveling wave that periodically sweeps the cerebral cortex with a definite site of origin and pattern of propagation. Moreover, we found that the spatial distribution, density of origins, main direction, and speed of propagation of the slow oscillation are highly reproducible within and across subjects. These findings indicate that the slow oscillation can be used to investigate changes in neuronal excitability and connectivity and suggest that it may play a role in time-dependent synaptic plasticity during sleep.
Materials and Methods
Subjects and recordings. High-density EEG recordings were performed in eight subjects (right-handed males, age 20-25 years) during the first sleep episode of the night. All participants gave written informed consent, and the experiment was approved by the University of Wisconsin Human Subjects Committee. A special EEG net made of 256 carbon electrodes was connected to a multichannel amplifier (Electrical Geodesics, Eugene, OR). A positioning system (Nexstim, Helsinki, Finland) was used to digitize the localization of all electrodes and co-register them to each subject's MRI (Fig. 1 A). Subjects were placed in a shielded, soundproof room and allowed to sleep at their customary bedtime. The same subjects underwent a second night of recording 1 week later. All signals were high-pass filtered (0.1 Hz) and digitized at 500 Hz. After rejection of noisy channels and exclusion of the channels located on the neck, 178-186 EEG signals per subject were retained. All signals were low-pass filtered at 4 Hz and re-referenced to the average of the signals recorded from the two earlobes. This montage was used for all steps of the analysis except for the calculation of voltage maps, for which the average reference was also used. Sleep stages were scored according to Rechtschaffen and Kales (1968) on the EEG referenced to the mastoid.
Figure 1.
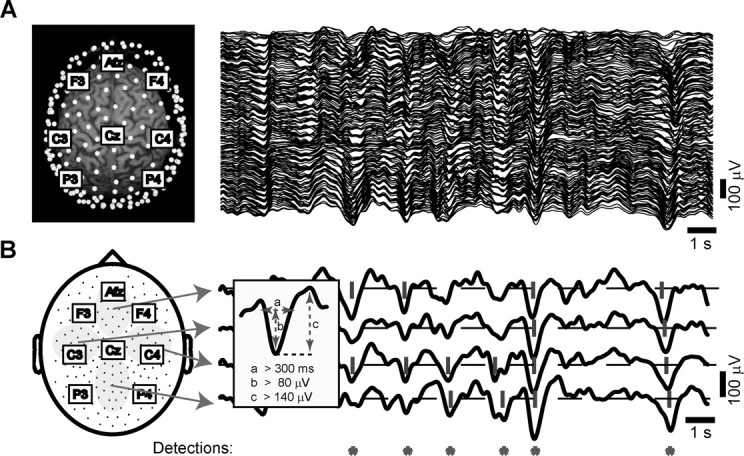
Automatic detection of slow oscillations on the multichannel EEG. A, In the left panel, the location of all electrodes (white dots) is displayed with respect to a subject's 3D MRI reconstruction. The labels indicate some of the equivalent electrodes in the 10-20 system. The right panel shows the signals recorded from all channels during an epoch of NREM sleep (stage 4). In this and all other figures, scalp positivity is upward. B, The scheme on the left depicts the location of all electrodes on a 2D representation of the scalp surface. We averaged the signals recorded from the electrodes included in the four gray areas to obtain the four local averages displayed on the right. We then applied the detection criteria (described in the inset) to each local average. If the criteria were met by any of the four local averages, the automatic detection algorithm stored the occurrence of a slow oscillation (red asterisk).
Detection algorithm. For the automatic detection of the slow oscillation, we designed an algorithm able to capture both widespread and local slow oscillation cycles. To scan the whole scalp in a computationally convenient manner, the detection algorithm was applied to potentials locally averaged over four large and nonoverlapping areas of the scalp (Fig. 1 B). The criteria for the detection of the slow oscillation were applied independently to each local average (bandpass, 0.1-4 Hz) and were as follows (Fig. 1 B, inset): (1) a negative zero crossing and a subsequent positive zero crossing separated by 0.3-1.0 sec, (2) a negative peak between the two zero crossings with voltage less than -80 μV, and (3) a negative-to-positive peak-to-peak amplitude >140 μV. Criteria 1 and 2 were similar to those used in Molle et al. (2002). This procedure allowed us to detect both global and local slow oscillation cycles with variable distribution on the scalp. The automatic detection procedure was validated, and its parameters were tuned through independent visual scoring of the multichannel EEG. The same criteria were used for all subjects and resulted in a reproducible and specific detection of both sporadic K-complexes and high-amplitude slow waves that recurred during sleep stages 3 and 4. For every slow oscillation identified on the local averages, we analyzed the waveform recorded at each channel around the time of detection (±800 msec). For each individual electrode signal that passed the detection criteria listed above, we recalculated the timing of the negative peak and of the negative and positive zero crossings, as well as the negative-to-positive peak amplitude.
Spatiotemporal analysis of single cycles. The negative peak was chosen as the reference point to study the spatiotemporal dynamics of the slow oscillation because it is sharp and easily recognizable, and its timing does not depend on the EEG baseline. Moreover, in contrast to the positive phase of the slow oscillation, the negative peak is not crowned by oscillations in the spindle frequency range (Molle et al., 2002). For each cycle, the delay of the negative peak was studied topographically. The delay values measured at the location of each electrode were transposed into Cartesian coordinates space to obtain a delay map. To avoid any interpolation of the measured data, we used a low-resolution grid (100 × 100). The delay map condensed the information relative to the spatial distribution and the timing of a slow oscillation on the scalp. The minimum value of the delay map, corresponding to the coordinates of the first electrode that recorded the negative peak, was defined as the origin of the cycle.
To evaluate the continuity of the gradient of delays that surrounded the origin, we calculated a set of streamlines. Each streamline is tangential to the instantaneous velocity direction and progresses in the two-dimensional (2D) vector field of delays until the gradient is broken. For each cycle, up to four locations on the data grid immediately around the origin were selected automatically as starting points of the streamlines. Specifically, for each quarter of circumference around the origin, the algorithm selected the point that gave rise to the longest streamline, resulting in zero to four streamlines.
The speed of wave propagation was systematically measured from the data collected by a row of 20 electrodes placed along the anteroposterior axis by calculating the linear correlation between scalp location in millimeters and the delay at each electrode. For the cycles displaying a significant correlation (p < 0.01), speed was measured as the slope of the linear regression.
The data were synthesized into four types of summary topographic displays: the detection density map, the average delay map, the streamline map, and the origin density map. The detection density map displays topographically, on a 2D representation of the scalp, the probability of detection of the slow oscillation at each electrode. The average delay map is the average of the delay maps of all cycles and represents the prevalent direction of propagation of slow oscillation during a night. The streamline map offers high data compression by displaying the behavior of all individual cycles of the slow oscillation superimposed on a single scalp map. In the streamline map, each electrode is represented by a dot. The dot size is proportional to the probability of the electrode being the origin of a slow oscillation cycle. The pattern of propagation of each slow oscillation is described by the streamlines starting from the electrode of origin. Dots and streamlines are color coded according to the position of the correspondent electrode on the scalp. The origin density map is obtained by interpolating the probability of each electrode to be the origin of the slow oscillation. This map highlights the scalp foci where a high density of origins is present and allows for direct comparison within and among subjects. To evaluate the reproducibility within subjects of the origin density maps, each interpolated map was treated as vector with 186 components (equal to the number of electrodes) and was normalized by its mean value across the 186 derivations. All possible pairs of maps were compared within and between subjects by calculating the Manhattan distance between them (sum of absolute difference at all electrodes). The entire analysis, from raw data to scalp maps, was implemented to run automatically in Matlab (MathWorks, Natick, MA).
MRI localization of electrode projections. Because the 2D representation of the scalp map is difficult to interpret with relation to three-dimensional (3D) brain anatomy, we digitized the position of each electrode with an infrared localization system. Electrode position was then co-registered with the 3D reconstruction of the individual MRI. We identified the cortical site underlying each electrode of interest by projecting on the brain surface a line normal to the scalp and passing through the electrode location. The accuracy of this method was validated by comparison with the 3D probabilistic anatomical craniocerebral projections of the 10-20 system (Okamoto et al., 2004).
Results
We performed high-density EEG recordings (256 channels) in eight subjects (males, age 20-25 years) during the early part of sleep (session duration, 1.0-1.5 hr). During this interval, six of eight subjects were able to reach the deepest stages of NREM sleep [stages 3 and 4 (Rechtschaffen and Kales, 1968)]. Average group values for these six subjects, expressed in percentage of recording time, were (mean ± SD) as follows: wakefulness, 10.7 ± 4.8; stages 1-2, 49.0 ± 10.9; stages 3-4, 37.6 ± 12.4; REM sleep, 2.7 ± 2.3.
The rate of occurrence of slow oscillations increases progressively as sleep deepens
Over the entire recording session, the automatic detection algorithm identified several hundred cycles of the slow oscillation (mean ± SD = 320 ± 86; range, 249-468). When the time series of slow oscillation detections were compared with the progression of sleep stages, a clear correlation was evident: no detections occurred during wakefulness and REM sleep, sporadic detections occurred during sleep stages 1-2, corresponding to K-complexes, and increasing rates of detection occurred during sleep stage 3-4 (Fig. 2_A_). The average number of detections per minute was as follows: wakefulness, 0; stage 1, 1.5 ± 0.6; stage 2, 4.9 ± 1.2; stage 3, 12.6 ± 5.5; stage 4, 21 ± 7.8; REM, 0 (Fig. 2_B_). In all subjects, the main interdetection interval during sleep stages 3 and 4 was 1.25 ± 0.13 sec, corresponding to a frequency of ∼0.8 Hz (Fig. 2_C_) (values for individual subjects were 1.5, 1.2, 1.1, 1.2, 1.3, and 1.2 sec).
Figure 2.

The frequency of occurrence of slow oscillations increases progressively as sleep deepens. A, The time of occurrence of the slow oscillation during the first hour of sleep in one subject is superimposed on the hypnogram. Note the increased occurrence of slow oscillations as sleep deepens (W, wakefulness; 1-4, stages of NREM sleep). B plots, for all subjects, the mean (±SD) number of slow oscillations per minute as a function of the sleep stage. Note that the rate of detection increases from stage 1 to stage 4. C reports the distribution of interdetection intervals measured during NREM sleep stages 3 and 4. The distribution peaks at 1.25 sec, indicating that the main frequency of slow oscillation occurrence during deep sleep was ∼0.8 Hz.
Each slow oscillation affects a variable subset of EEG channels
For each cycle we recorded the number and location of the channels where the slow oscillation was detected. Individual cycles of the slow oscillation affected a variable number of channels ranging from 5 to 164, with most cycles affecting 30-50 channels (Fig. 3_A_). As exemplified in Figure 3_B_, we observed slow oscillations with a global distribution as well as more local events restricted to frontal or parietal regions. The average probability of detecting a slow oscillation during the entire recording session is shown for every channel in the topographic scalp map of Figure 3_C_.
Figure 3.

Each slow oscillation affects a variable subset of channels. A shows the distribution of the number of channels affected by the slow oscillation cycles occurring during 1 hr of sleep in one subject. Most of the cycles affected ∼50 electrodes. The red arrows point to the number of channels affected by the three slow oscillation cycles depicted in B, where the location of the affected electrodes (red dots) is shown with respect to the individual 3D MRI. Note that each wave affected a subset of channels that varies in both number and location. C, The detection density map illustrates the probability of detecting the slow oscillation. Almost 70% of the slow oscillations were detected at the fronto-central region, whereas parietal and occipital electrodes detected few or no slow oscillations. In D, the scalp positions of the 10-20 system electrodes depicted on the flattened 2D map of C are projected on the 3D MRI of the same subject. The yellow area in the leftmost figurine includes the electrodes with the highest probability of detecting a slow oscillation. The cortical projections of these electrodes correspond to areas 6, 8, and 9. Temporal and occipital cortices have a low probability (<10%) of detection.
To map EEG scalp locations onto anatomical locations, we used an infrared digitization system and projected the position of relevant electrodes on the cortical surface reconstructed from each subject's MRI (Fig. 3_D_). On average, the electrodes with the highest probability of detecting a slow oscillation were concentrated in a scalp region anterior to Cz (central midline electrode) and posterior to Afz (anteriofrontal midline electrode); these electrodes projected onto cortical areas 8 and 9. Channels overlying temporal and occipital cortex had the lowest probability of detecting a slow oscillation. Specifically, the probability of detection was <10% for electrodes overlying cortical areas 22, 41-42, and 17-19.
Each cycle of the slow oscillation propagates as a traveling wave
The time of occurrence of the negative peak of the slow oscillation was calculated at every affected electrode. Within a single cycle of the slow oscillation, the timing of the negative peak varied across different electrodes. In Figure 4_A_, the signals recorded from all the electrodes detecting a cycle of the slow oscillation were sorted according to the timing of the negative peak, revealing a continuous shift. In this case, the maximum delay calculated between the negative peak of the top trace to the negative peak of the bottom trace was 120 msec. Across all cycles and subjects, the maximum delay ranged between 40 and 360 msec, and its variation was positively correlated with the number of electrodes affected by the slow oscillation (r = 0.75; p < 0.05). The average of the maximum delay was consistent across subjects, with a grand mean of 115 ± 9.9 msec.
Figure 4.
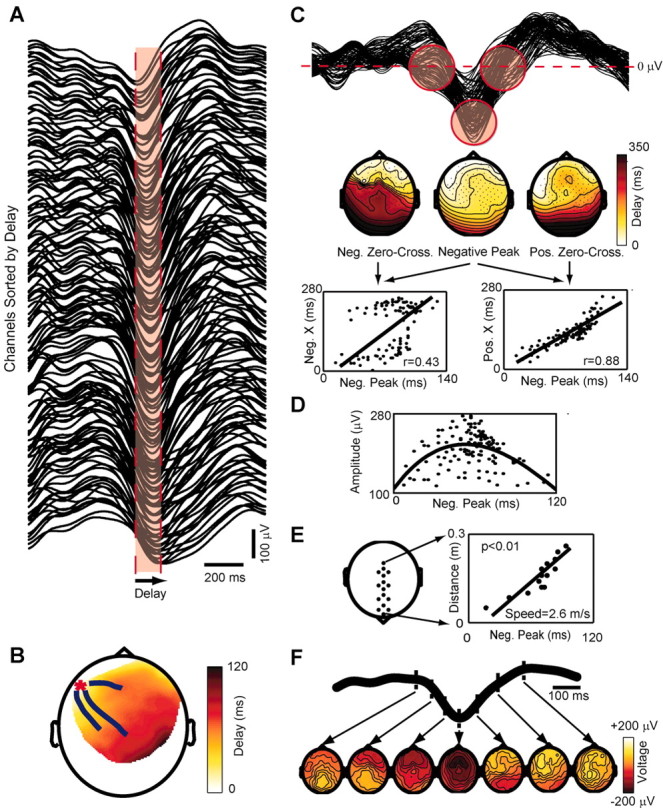
Each cycle of the slow oscillation propagates as a traveling wave. A shows the signals recorded from the channels affected by a single slow oscillation cycle ranked from top to bottom according to the delay of the negative peak. Note that the slow oscillation is not precisely synchronous in all channels and that a continuous distribution of time lags can be measured. The width of the red area represents the maximum delay (120 msec) from the negative peak at the top trace to the negative peak at the bottom trace. B depicts the spatial distribution of the delays on a delay map. A red asterisk marks the location of the channel with delay = 0 (the origin). The blue lines starting around the origin represent the streamlines calculated on the vector field of delays. The slow oscillation originates locally and propagates orderly to the rest of the scalp as a traveling wave. In C the same signals of A are superimposed; the red circles highlight the negative zero crossings, the negative peaks, and the positive zero crossings on the slow oscillation waveforms recorded from all electrodes. The maps below show the topographic distribution of the delays of these three reference points. The dots represent the channels affected by the slow oscillation, and the lines are iso-delay contours. Note that the spatial organization of the delays of the negative peak differs from that of the preceding negative zero crossings but is similar to that of the ensuing positive zero crossings. This observation is confirmed by the linear regressions performed between the delays of the negative peak (Neg. Peak) and those of the negative (Neg. X) and positive (Pos. X) zero crossings. In D, the peak-to-peak amplitude of the positive wave is plotted against the delay of the preceding negative peak. A parabolic function fits the points, indicating that the wave starts small and then waxes and wanes. E, The speed of wave propagation is measured from a row of electrodes placed on the anteroposterior axis (left). The slope of the linear correlation between the distance on the scalp and the measured delay gives the speed (right). F shows sequential voltage (average-reference) scalp maps calculated during different phases of the same cycle analyzed in the previous panels. The time of each map is indicated on the average of the slow oscillation signals recorded from all channels.
To illustrate the spatial distribution of the delays of the negative peak for a single cycle of the slow oscillation, we constructed delay maps as in Figure 4_B_. Here, a red asterisk marks the minimum delay value of the map, corresponding to the origin of the cycle. From the origin, a gradient of increasing delays progresses from left frontal areas to right parietal areas. Because of the continuity of the gradient of latencies on the scalp, the main directions of propagation for a single cycle of the slow oscillation could be represented by means of one to four streamlines superimposed on the delay map. A continuous gradient of latencies was evident in ∼80% of the cycles detected by the algorithm, regardless of the sleep stage in which they occurred. Hence, the vast majority of the slow oscillation cycles could be characterized by an origin and a continuous pathway of propagation, as is the case for a traveling wave.
For every electrode affected by the wave, we also calculated the timing of the zero crossings before and after the negative peak. Figure 4_C_ shows, from left to right, the delay map of the negative zero crossings, of the negative peaks, and of the positive zero crossings of the same slow oscillation cycle. The delay map of the negative peaks was clearly more similar to the delay map of the positive zero crossings than to the map of the negative zero crossings. This observation was substantiated by the linear regressions displayed in the panels below, in which for the same cycle of the slow oscillation the delay of the negative peaks at all channels was plotted against the delay of the negative and positive zero crossings. Clearly, the onset of the negative potential poorly predicted the time of the ensuing negative peak, whereas the latter reliably predicted the onset of the following positive wave. The correlation coefficient was higher between the negative peak and the positive zero crossing in most cycles (p < 0.05) and in all subjects. Thus the negative peak was strongly linked to the rise of the ensuing positive wave.
The relationship between the delay of the negative peak and the amplitude of the following positive wave (negative-to-positive peak) is illustrated in Figure 4_D_. Early latencies corresponded to small wave amplitudes; the amplitude of the wave increased at intermediate latencies, reaching maximal values at around 60 msec, and decreased again at longer latencies. In the vast majority of the cycles (83 ± 9%), the relationship between the delay of the negative peak and the amplitude of the following positive wave was described by a parabolic function suggesting that, while traveling, the slow oscillation waxed and waned.
To determine the speed of propagation of the slow oscillation on the scalp, we selected a row of 20 electrodes located along the midline [from Fpz (frontal pole midline electrode) to Oz (occipital pole midline electrode)] and performed a linear regression between scalp positions (starting at Fpz = 0 mm) and delays. As shown in Figure 4 E, the wave appeared to propagate at constant velocity, here corresponding to 2.6 m/sec. The linear correlation was significant (p < 0.01) for ∼55% of the cycles in all subjects. The speed of propagation ranged between 1.2 and 7 m/sec but was mostly between 2 and 3 m/sec, with an average across all cycles and subjects of 2.7 ± 0.2 m/sec. The slope of the regression line indicated that cycles traveling in the anteroposterior direction were more frequent than those traveling in the opposite direction. Waves traveling in the posteroanterior direction were significantly faster than those traveling in the anteroposterior direction (2.9 ± 0.2 vs 2.6 ± 0.2 m/sec; p < 0.05).
Finally, Figure 4_F_ shows the evolution of the voltage (average reference) calculated on the scalp during the same slow oscillation cycle. During the rising phase of the slow oscillation, a patch of scalp positivity emerged from a widespread negativity and moved from the left frontal region to right parietal regions.
Each slow oscillation has a definite site of origin and direction of propagation, which vary from one cycle to the next
Subsequent cycles of the slow oscillation had different origins and various patterns of propagation. Figure 5_A_ shows the delay maps and streamlines for five consecutive waves. Both the location of the origin and the direction of the gradient varied from one cycle to the next. Figure 5_B_ demonstrates that the origin of successive waves could jump between distant locations on the scalp. In Figure 5_C_ the origins and streamlines of the five cycles were superimposed to construct a streamline map.
Figure 5.

Each slow oscillation has a definite site of origin and direction of propagation that varies from one cycle to the next. A represents the signals recorded from all electrodes during five consecutive cycles of the slow oscillation and their corresponding delay maps. Each wave has a different origin and spreads over the scalp with a distinct pattern of propagation. B depicts the location of the origins of the five cycles shown in A. Note that the origin of subsequent slow oscillations jumps from one site to another. In C, all information about the five cycles is condensed in a single map (streamline map). Each cycle is represented by a dot (the origin) with attached streamlines (the directions of propagation). Dots and streamlines are color coded according to the position of the corresponding electrode on the scalp. The colors are mapped (hue and saturation) considering the circular surface of the scalp as a color wheel.
Slow oscillations originate more frequently in anterior regions and propagate in an anteroposterior direction
A streamline map condensing the spatiotemporal dynamics of the slow oscillation during the first 1 hr of sleep in one subject is shown in Figure 6_A_. The dots represent the EEG channels where at least one origin is detected, with the size of the dot proportional to the number of cycles that originate from each channel. The streamlines, describing the propagation of all individual cycles, are color coded according to the location of the associated channel of origin. As can be seen in this example, the slow oscillation could originate from almost any area of the scalp and propagate in every direction, although certain origins and directions of propagation occurred more frequently than others. In this subject, the origin density map highlights clusters of anterior electrodes having a higher probability of originating slow oscillations (Fig. 6_B_). Moreover, the average delay map depicted in Figure 6_C_ reveals a prevalent fronto-occipital direction of propagation. The electrodes included in the clusters with higher origin density were localized with respect to the individual MRI (Fig. 6_D_); in this subject, the electrodes with the highest probability of originating a slow oscillation were located on the scalp overlying the transition between dorsolateral and orbitofrontal cortex.
Figure 6.

Slow oscillations originate more frequently in anterior regions and propagate in an anteroposterior direction. A displays the streamline map from the first hour of sleep in one subject (slow oscillation cycles affecting <20 channels are excluded). The size of each dot is proportional to the number of cycles originating from each electrode. Note that virtually any pattern of origin and propagation is possible, although anterior electrodes tend to start more slow oscillations, and streamlines traveling in the anteroposterior direction are more numerous. In B, the probability of each electrode being the origin of a slow oscillation is interpolated to obtain an origin density map. Foci with a higher origin density are detected in anterior regions of the scalp. The average delay map shown in C reflects the prevalent anteroposterior direction of propagation of the slow oscillation. D reveals that the electrodes with the highest probability of being the origin are located in a scalp region overlying the transition between dorsolateral and orbitofrontal cortex.
The general pattern of origin and propagation of sleep slow oscillations is reproducible across nights and across subjects
In each subject, we performed a second EEG recording session 1 week later. Sleep architecture was similar for both sessions. During the second session, the slow oscillation detection algorithm identified a mean of 294 ± 87.1 (mean ± SD) cycles per subject, similar to the first night (320 ± 86). Figure 7_A_ shows the streamline maps obtained from the same subject during the two sessions: both the distribution of the origins and the pattern of the streamlines were similar across nights. A quantitative analysis examining inter-map Manhattan distances confirmed that within-individual distances were always smaller than between-individual distances.
Figure 7.
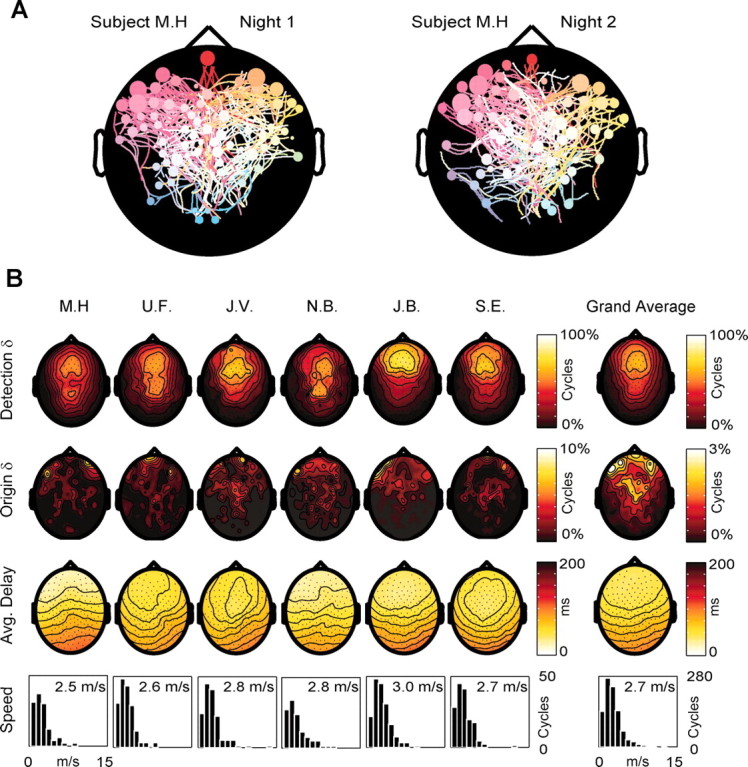
The general pattern of origin and propagation of sleep slow oscillations is reproducible across nights and across subjects. In A, the origins and patterns of propagation of the slow oscillation cycles recorded from the same subject during two different nights are represented by two streamline maps. Note the similarity of the two maps in terms of both origin density (higher at left frontal electrodes) and pattern of propagation. B summarizes the results obtained from all six subjects during one night. The first row contains the detection density maps showing the probability of each electrode detecting the slow oscillation. In all subjects, the highest density was over the frontal lobe. In two subjects (U.F. and N.B.), a secondary high-density spot was detected on more posterior scalp regions. The grand average of the detection densities is shown on the left. The second row contains the origin density maps. Note that in all subjects the density of origins is higher in frontal regions. As shown in the grand average on the left, the clusters of electrodes with the highest origin density are located on the most anterior scalp regions, overlying the orbitofrontal cortex. The third row contains the average delay maps. In all subjects the prevalent direction of propagation is anteroposterior. Note that, on the average, channels located at homotopic scalp sites tend to have a similar delay. The fourth row illustrates the distribution of the propagation speeds and the average speed calculated for all the cycles traveling on the anteroposterior axis in each subject. Note that the average speed of the slow oscillation is similar in all subjects (∼2.7 m/sec).
Figure 7_B_ summarizes the results obtained from all subjects. The first row shows the detection density maps, which represent the probability of detecting a slow oscillation at each electrode. In all cases the highest probabilities were at central and frontal electrodes, and the lowest over temporal and occipital areas. This topographic pattern is evident in the grand average (right). The second row displays the origin density maps. All subjects showed a net preponderance of anterior origins: >50% (51.8 ± 2.9) of the cycles originated from a region of the scalp anterior to a line passing through electrodes F3 and F4, approximately overlying the boundary between premotor and prefrontal cortices. Clusters of high origin density were concentrated at scalp regions corresponding to the transition between dorsolateral prefrontal and orbitofrontal cortex, with secondary clusters in correspondence with left premotor areas. Even within these clusters, no individual electrode exceeded a 10% probability of being the origin of the slow oscillation (maximum origin probability ranged between 6.2 and 9%). The average delay maps (third row) show that the main direction of propagation of slow oscillation was anteroposterior in all subjects. The histograms in the fourth row represent the distribution of propagation speeds for the cycles traveling along the anteroposterior axis. All distributions displayed a peak at ∼2-3 m/sec, and across all subjects, the average speed varied within a narrow range, 2.5-3.0 m/sec, with a grand mean of 2.7 ± 0.2 m/sec.
Discussion
We have shown here that sleep slow oscillations are traveling waves that sweep the human cerebral cortex up to once per second. Each slow oscillation has a definite site of origin and direction of propagation, which vary from one cycle to the next. Slow oscillations originate more frequently at anterior cortical regions and propagate in an anteroposterior direction. The general pattern of origin and propagation of sleep slow oscillations is reproducible across nights and across subjects.
The slow oscillation as a unitary phenomenon of NREM sleep
By applying an automatic detection algorithm to the multichannel EEG, we found that slow oscillations could occur during any stage of NREM sleep (Fig. 2_A_). Specifically, the same detection criteria were consistently matched both by sporadic K-complexes during stage 2 and by recurrent slow waves at <1 Hz during stages 3 and 4. Moreover, the spatiotemporal dynamics of the waves (continuous gradient of delays, propagation speed) were the same regardless of sleep stage. On the other hand, the rate of detection of the slow oscillation increased linearly from stage 1 to stage 4. Thus, K-complexes and slow waves at <1 Hz appear to reflect a unitary phenomenonthat occurs at rates increasing with the progression of sleep stages and thereby with the depth of sleep (Rechtschaffen et al., 1966). This conclusion is in line with results of animal studies showing that K-complexes and slow waves at <1 Hz mirror the same intracellular events, namely hyperpolarization-depolarization sequences in cortical neurons (Amzica and Steriade, 1997, 1998). In our subjects, the mean interdetection interval during stages 3 and 4 was 1.25 sec (Fig. 2_C_), corresponding to the main frequency (0.8 Hz) of slow oscillations in cats (Steriade et al., 1993a) and humans (Acherman and Borbely, 1997).
The slow oscillation as a traveling wave
By using high-density EEG recordings, we found that each cycle of the slow oscillation affected a different subset of contiguous channels and gave rise to a systematic spatial distribution of delays. As shown in Figures 4_B_ and 5_A_, a slow oscillation originated at a definite cortical site and spread over the scalp surface within a few hundred milliseconds. Overall, the maximum propagation delay for each slow oscillation ranged from 40 to 360 msec and was positively correlated to the size of the scalp area affected.
Previously, intracellular recordings in the anesthetized cat had shown a relative lack of synchronization of the slow oscillation over the cortex (Amzica and Steriade, 1995a). Cross-correlations revealed short time lags between closely located cells (12 ± 11.2 msec) and longer time lags between cells located in distant areas (124 ± 86.8 msec). By showing that each slow oscillation gives rise to a continuous gradient of time lags on the human scalp, our results demonstrate that this relative lack of synchrony is not caused by a random jitter but by the orderly propagation of a wave of activity. Slices of ferret neocortex maintained in vitro also generate an oscillation at <1 Hz, similar to the slow oscillation recorded in vivo (Sanchez-Vives and McCormick, 2000). When explored with a horizontal array of electrodes, this oscillation appeared as a wave front of activity that propagated along the slice.
Several considerations suggest that the negative peak of the slow oscillation in the ear-referenced human sleep EEG is likely to reflect the transition to the depolarizing phase or up state of the intracellularly defined slow oscillation. First, DC recordings in humans show that the negative peak of the slow oscillation specifically triggers and shortly anticipates the rise of sleep spindles (Molle et al., 2002), which occur during the up state (Contreras and Steriade, 1996). Second, evoked potential studies in humans show that thalamocortical responsiveness is maximal exactly at the negative peak of the slow oscillation (Massimini et al., 2003), as would be expected if the negative peak corresponded to the transition to depolarization (Timofeev at al., 1996). Most importantly, the present work shows that the timing of the negative peak of the slow oscillation is well correlated with the timing of the positive zero crossing, and much less so with the negative zero crossing (Fig. 4_C_), indicating that the negative peak is linked to the beginning of a positive wave. As shown by Steriade et al. (1994), the emergence of scalp positivity corresponds to the depolarized phase of the slow oscillation. Thus, the wave front sweeping through the scalp appears to be a wave of depolarization associated with the resumption of neuronal firing.
At every cycle, the slow oscillation displayed a definite site of origin, from which it rapidly spread to neighboring regions. What determines the site of ignition of each cycle is not known, although it is plausible that waves of depolarization may start at foci of increased excitability or greater synaptic strength. Work in vitro suggests that the up state may be initiated by spontaneously firing neurons in layer 5 (Sanchez-Vives and McCormick, 2000; Compte et al., 2003). In anesthetized animals, the up state may be initiated by spontaneous neurotransmitter release at a few synaptic sites (Timofeev et al., 2000). Whatever the mechanism, each slow oscillation started small, grew progressively larger, and eventually faded, as indicated by the parabolic relationship between the delay of the negative peak and the amplitude of the following positive wave. This sequence of events suggests that an initial, small depolarizing event progressively recruits large populations of neurons as it sweeps through the cortex.
The propagation of the slow oscillation is probably mediated by corticocortical connections, as suggested by the fact that the slow oscillation survives thalamectomy (Steriade at al., 1993b) and is disrupted by disconnection of intracortical pathways by surgical and pharmacological means (Amzica and Steriade, 1995b). The delay maps representing the spread of the slow oscillation were generally smooth, suggesting a gradual propagation in the cortical tissue, possibly related to the higher density of short-range connections in the cortex (Fisken et al., 1973; Ts'o et al., 1986). The role of tissue filtering in producing the observed delays can be reasonably excluded because cortical matter behaves in a resistive manner at frequencies up to 2 kHz (Nicholson, 1965). The small delay differences observed between correspondent contralateral sites (Fig. 7_B_, average delay maps) are consistent with the high density of homotopic transcallosal fibers (Jacobson and Trojanowsky, 1975). In our recordings, local discontinuities in horizontal propagation (Chervin et al., 1988) were probably masked by volume conduction. Global discontinuities, which were occasionally observed, may reflect preferential propagation via long-range corticocortical connections or reticulothalamic synchronization (Sohal and Huguenard, 1998).
The speed of wave propagation on the scalp, measured along the midline, was between 1.2 and 7 m/sec. These values may represent a slight overestimate because of obliquely propagating waves and volume conduction effects. Nevertheless, these values are within the range of previous measurements of wave propagation velocity on the human scalp (Petsche, 1962; Nunez, 1994; Hughes et al., 1995) and may result from the entrainment of adjacent cortical regions already primed to flip into the up state (Shu et al., 2003). Within small patches of cortex, where only pure neighbor-to-neighbor synaptic propagation can be observed, wave speed is considerably lower (10-100 mm/sec) (Sanchez-Vives and McCormick, 2000; Compte at al., 2003; Petersen et al., 2003).
Conclusion and functional implications
The data reported here show that during NREM sleep spontaneous waves of depolarization and hyperpolarization sweep the cerebral cortex almost once per second. It is tempting to draw a parallel between the K-complex-slow oscillation in the sleeping brain and the P-QRS-T wave complex in the beating heart. In both cases, pacemakers, conduction pathways, and conduction velocities can be identified and measured. Thus, characterizing the origin, direction, and speed of propagation of the slow oscillation may provide useful information about the general state of the cerebral cortex (excitability, connectivity, and local network activity). As shown here, the novel EEG parameters estimated through this analysis (origin density, direction, and speed of propagation) are highly reproducible within and across subjects. To the extent that such parameters are sensitive to pathologic changes of cortical circuits, maps of slow oscillations may prove useful as a functional probe in clinical neurology and psychiatry.
In addition to providing a tool for testing cortical excitability and connectivity, slow oscillations, as traveling waves of neural activity, may have functional relevance. Our analysis indicates that, in normal subjects, the sites of origin of slow oscillation cycles are not distributed uniformly over the cortical surface but are more concentrated in certain regions and absent in others. In all subjects, the highest density of origins was located over the transition between dorsolateral and orbitofrontal cortex. Interestingly, early studies showed that electrical stimulation of orbitofrontal cortex causes an outbreak of EEG slow waves and induces behavioral sleep (Sterman and Clemente, 1962; Lineberry and Siegel, 1971). Moreover, this brain area appears to have a stronger need for sleep. For example, cerebral blood flow values during NREM sleep are particularly low in this region (Braun et al., 1997; Maquet et al., 1997). Also, EEG studies indicate that the increase in slow wave activity after sleep deprivation is highest in anterior prefrontal regions (Finelli et al., 2001). Finally, total sleep deprivation induces signs and symptoms similar to those observed after orbitofrontal lesions (Horne, 1993). Altogether, these data point to a possible relationship between sleep need and the likelihood of initiating slow oscillations and suggest that traveling waves may serve a physiological function. For example, it is well established that traveling waves occurring in the immature retina can direct the synaptic development of visual thalamus and cortex long before the onset of vision (Meister et al., 1991). Similarly, the orderly propagation of correlated activity along connected pathways during sleep may play a role in spike timing-dependent synaptic plasticity (Abbot and Nelson, 2000; Ermentrout and Kleinfeld, 2001) and lead to synaptic consolidation (Sejnowsky and Destexhe, 2000; Steriade and Timofeev, 2003) or downscaling (Tononi and Cirelli, 2003).
Footnotes
M.M. is supported by the National Sleep Foundation (Pickwick Fellowship). We thank Liana K. Prescott and Larry Greischar for their help with this analysis. We also thank Andy Alexander for providing us with the 3T MR images and Chiara Cirelli and Ruth Benca for their critical comments.
Correspondence should be addressed to Dr. Giulio Tononi, Department of Psychiatry, University of Wisconsin-Madison, 6001 Research Park Boulevard, Madison, WI 53719. E-mail: gtononi@wisc.edu.
Copyright © 2004 Society for Neuroscience 0270-6474/04/246862-09$15.00/0
References
- Abbot LS, Nelson SB (2000) Synaptic plasticity: taming the beast. Nat Neurosci 3: 1178-1183. [DOI] [PubMed] [Google Scholar]
- Achermann P, Borbely AA (1997) Low-frequency (<1 Hz) oscillations in the human sleep electroencephalogram. Neuroscience 81: 213-222. [DOI] [PubMed] [Google Scholar]
- Amzica F, Steriade M (1995a) Short- and long-range neuronal synchronization of the slow (<1 Hz) cortical oscillation. J Neurophysiol 73: 20-38. [DOI] [PubMed] [Google Scholar]
- Amzica F, Steriade M (1995b) Disconnection of intracortical synaptic linkages disrupts synchronization of a slow oscillation. J Neurosci 15: 4658-4677. [DOI] [PMC free article] [PubMed] [Google Scholar]
- Amzica F, Steriade M (1997) The K-complex: its slow (<1-Hz) rhythmicity and relation to delta waves. Neurology 49: 952-959. [DOI] [PubMed] [Google Scholar]
- Amzica F, Steriade M (1998) Cellular substrates and laminar profile of sleep K-complex. Neuroscience 82: 671-686. [DOI] [PubMed] [Google Scholar]
- Bazhenov M, Timofeev I, Steriade M, Sejnowski TJ (2002) Model of thalamocortical slow-wave sleep oscillations and transitions to activated states. J Neurosci 22: 8691-8704. [DOI] [PMC free article] [PubMed] [Google Scholar]
- Braun AR, Balkin TJ, Wesenten NJ, Carson RE, Varga M, Baldwin P, Selbie S, Belenky G, Herscovitch P (1997) Regional cerebral blood flow throughout the sleep-wake cycle. An H2(15)O PET study. Brain 120: 1173-1197. [DOI] [PubMed] [Google Scholar]
- Chervin RD, Pierce PA, Connors BW (1988) Periodicity and directionality in the propagation of epileptiform discharges across neocortex. J Neurophysiol 60: 1695-1713. [DOI] [PubMed] [Google Scholar]
- Compte A, Sanchez-Vives MV, McCormick DA, Wang XJ (2003) Cellular and network mechanisms of slow oscillatory activity (<1 Hz) and wave propagations in a cortical network model. J Neurophysiol 89: 2707-2725. [DOI] [PubMed] [Google Scholar]
- Contreras D, Steriade M (1996) Spindle oscillation in cats: the role of corticothalamic feedback in a thalamically generated rhythm. J Physiol (Lond) 490: 159-179. [DOI] [PMC free article] [PubMed] [Google Scholar]
- Ermentrout GB, Kleinfeld D (2001) Traveling electrical waves in cortex: insight from phase dynamics and speculation on a computational role. Neuron 29: 33-44. [DOI] [PubMed] [Google Scholar]
- Finelli LA, Baumann H, Borbely AA, Achermann P (2000) Dual electroencephalogram markers of human sleep homeostasis: correlation between theta activity in waking and slow-wave activity in sleep. Neuroscience 101: 523-529. [DOI] [PubMed] [Google Scholar]
- Fisken RA, Garey LJ, Powell TP (1973) Patterns of degeneration after intrinsic lesions of the visual cortex (area 17) of the monkey. Brain Res 53: 208-213. [DOI] [PubMed] [Google Scholar]
- Horne JA (1993) Human sleep, sleep loss and behaviour. Implications for the prefrontal cortex and psychiatric disorder. Br J Psychiatry 162: 413-419. [DOI] [PubMed] [Google Scholar]
- Hughes JR (1995) The phenomenon of traveling waves: a review. Clin Electroencephalogr 26: 1-6. [DOI] [PubMed] [Google Scholar]
- Jacobson S, Trojanowski JQ (1975) The appearance of dendrites of callosal and corticothalamic neurons in somatosensory cortex of immature rats demonstrated by horseradish peroxidase. Adv Neurol 12: 319-333. [PubMed] [Google Scholar]
- Lineberry CG, Siegel J (1971) EEG synchronization, behavioral inhibition, and mesencephalic unit effects produced by stimulation of orbital cortex, basal forebrain and caudate nucleus. Brain Res 34: 143-161. [DOI] [PubMed] [Google Scholar]
- Maquet P, Degueldre C, Delfiore G, Aerts J, Peters JM, Luxen A, Franck G (1997) Functional neuroanatomy of human slow wave sleep. J Neurosci 17: 2807-2812. [DOI] [PMC free article] [PubMed] [Google Scholar]
- Massimini M, Rosanova M, Mariotti M (2003) EEG slow (approximately 1 Hz) waves are associated with nonstationarity of thalamo-cortical sensory processing in the sleeping human. J Neurophysiol 89: 1205-1213. [DOI] [PubMed] [Google Scholar]
- Meister M, Wong RO, Baylor DA, Shatz CJ (1991) Synchronous bursts of action potentials in ganglion cells of the developing mammalian retina. Science 252: 939-943. [DOI] [PubMed] [Google Scholar]
- Molle M, Marshall L, Gais S, Born J (2002) Grouping of spindle activity during slow oscillations in human non-rapid eye movement sleep. J Neurosci 22: 10941-10947. [DOI] [PMC free article] [PubMed] [Google Scholar]
- Nicholson PW (1965) Specific impedence of cerebral white matter. Exp Neurol 13: 386-401. [DOI] [PubMed] [Google Scholar]
- Nunez P, Silberstein RB, Cadusch PJ, Wijesinghe R, Westdorp AF, Srinivasan R (1994) A theoretical and experimental study of high resolution EEG based on surface laplacians and cortical imaging. Electroencephalogr Clin Neurophysiol 90: 40-57. [DOI] [PubMed] [Google Scholar]
- Okamoto M, Dan H, Sakamoto K, Takeo K, Shimizu K, Kohno S, Oda I, Isobe S, Suzuki T, Kohyama K, Dan I (2004) Three-dimensional probabilistic anatomical cranio-cerebral correlation via the international 10-20 system oriented for transcranial functional brain mapping. NeuroImage 21: 99-111. [DOI] [PubMed] [Google Scholar]
- Petersen CCH, Hahn TTG, Metha M, Grinvald A, Sakmann B (2003) Interaction of sensory responses with spontaneous depolarizations in layer 2/3 barrel cortex. Proc Natl Acad Sci USA 100: 13638-13643. [DOI] [PMC free article] [PubMed] [Google Scholar]
- Petsche H (1962) Pathophysiology and clinical aspects of petit mal. Toposcopic studies on the phenomenology of the spike wave pattern. Wien Z Nervenheilkd Grenzgeb 19: 345-442. [PubMed] [Google Scholar]
- Retchtschafflen A, Kales A (1968) A manual of standardized terminology, techniques and scoring system for sleep stages of human subjects. Washington, DC: National Institutes of Health.
- Rechtschaffen A, Hauri P, Zeitlin M (1966) Auditory awakening thresholds in REM and NREM sleep stages. Percept Mot Skills 22: 927-942. [DOI] [PubMed] [Google Scholar]
- Sanchez-Vives MV, McCormick DA (2000) Cellular and network mechanisms of rhythmic recurrent activity in neocortex. Nat Neurosci 3: 1027-1034. [DOI] [PubMed] [Google Scholar]
- Sejnowski TJ, Destexhe A (2000) Why do we sleep? Brain Res 886: 208-223. [DOI] [PubMed] [Google Scholar]
- Shu Y, Hasenstaub A, McCormic DA (2003) Turning on and off recurrent balanced cortical activity. Nature 423: 288-293. [DOI] [PubMed] [Google Scholar]
- Simon NR, Manshanden I, Lopes da Silva FH (2000) A MEG study of sleep. Brain Res 860: 64-76. [DOI] [PubMed] [Google Scholar]
- Sohal VS, Huguenard JR (1998) Long-range connections synchronize rather than spread intrathalamic oscillations: computational modeling and in vitro electrophysiology. J Neurophysiol 80: 1736-1751. [DOI] [PubMed] [Google Scholar]
- Steriade M (2000) Corticothalamic resonance, states of vigilance and mentation. Neuroscience 101: 243-276. [DOI] [PubMed] [Google Scholar]
- Steriade M, Timofeev I (2003) Neuronal plasticity in thalamocortical networks during sleep and waking oscillations. Neuron 37: 563-576. [DOI] [PubMed] [Google Scholar]
- Steriade M, Nunez A, Amzica F (1993a) A novel slow (<1 Hz) oscillation of neocortical neurons in vivo: depolarizing and hyperpolarizing components. J Neurosci 13: 3252-3265. [DOI] [PMC free article] [PubMed] [Google Scholar]
- Steriade M, Contreras D, Curro Dossi R, Nunez A (1993b) The slow (<1 Hz) oscillation in reticular thalamic and thalamocortical neurons: scenario of sleep rhythm generation in interacting thalamic and neocortical networks. J Neurosci 13: 3284-3299. [DOI] [PMC free article] [PubMed] [Google Scholar]
- Steriade M, Contreras D, Amzica F (1994) Synchronized sleep oscillations and their paroxysmal developments. Trends Neurosci 17: 199-208. [DOI] [PubMed] [Google Scholar]
- Steriade M, Timofeev I, Grenier F (2001) Natural waking and sleep states: a view from inside neocortical neurons. J Neurophysiol 85: 1969-1985. [DOI] [PubMed] [Google Scholar]
- Sterman MB, Clemente CD (1962) Forebrain inhibitory mechanisms: sleep patterns induced by basal forebrain stimulation in the behaving cat. Exp Neurol 6: 103-117. [DOI] [PubMed] [Google Scholar]
- Timofeev I, Steriade M (1996) Low-frequency rhythms in the thalamus of intact-cortex and decorticated cats. J Neurophysiol 76: 4152-4168. [DOI] [PubMed] [Google Scholar]
- Timofeev I, Contreras D, Steriade M (1996) Synaptic responsiveness of cortical and thalamic neurones during various phases of slow sleep oscillation in cat. J Physiol (Lond) 494: 265-278. [DOI] [PMC free article] [PubMed] [Google Scholar]
- Timofeev I, Grenier F, Bazhenov M, Sejnowski TJ, Steriade M (2000) Originofslow cortical oscillations in deafferented cortical slabs. Cereb Cortex 10: 1185-1199. [DOI] [PubMed] [Google Scholar]
- Tononi G, Cirelli C (2003) Sleep and synaptic homeostasis: a hypothesis. Brain Res Bull 62: 143-150. [DOI] [PubMed] [Google Scholar]
- Ts'o DY, Gilbert CD, Wiesel TN (1986) Relationships between horizontal interactions and functional architecture in cat striate cortex as revealed by cross-correlation analysis. J Neurosci 6: 1160-1170. [DOI] [PMC free article] [PubMed] [Google Scholar]