Inhibition of Dendritic Spine Morphogenesis and Synaptic Transmission by Activity-Inducible Protein Homer1a (original) (raw)
Abstract
The postsynaptic density (PSD) proteins Shank and Homer cooperate to induce the maturation and enlargement of dendritic spines (Sala et al., 2001). Homer1a is an activity-inducible short-splice variant of Homer that lacks dimerization capacity. Here, we show that Homer1a reduces the density and size of dendritic spines in cultured hippocampal neurons in correlation with an inhibition of Shank targeting to synapses. Expression of Homer1a also decreases the size of PSD-95 clusters, the number of NMDA receptor clusters, and the level of surface AMPA receptors, implying a negative effect on the growth of synapses. In parallel with the morphological effects on synapses, Homer1a-expressing neurons show diminished AMPA and NMDA receptor postsynaptic currents. All of these outcomes required the integrity of the Ena/VASP Homology 1 domain of Homer1a that mediates binding to the PPXXF motif in Shank and other binding partners. Overexpression of the C-terminal region of Shank containing the Homer binding site causes effects similar to those of Homer1a. These data indicate that an association between Shank and the constitutively expressed long-splice variants of Homer (e.g., Homer1b/c) is important for maintaining dendritic-spine structure and synaptic function. Because Homer1a expression is induced by synaptic activity, our results suggest that this splice variant of Homer operates in a negative feedback loop to regulate the structure and function of synapses in an activity-dependent manner.
Keywords: dendritic spine, Shank, AMPA receptor, NMDA receptor, postsynaptic density, synaptic plasticity
Introduction
The postsynaptic density (PSD) consists of a network of interacting proteins that anchors and links glutamate receptors (GluRs) and other postsynaptic membrane proteins to cytoplasmic cytoskeletal elements and signaling pathways (Kennedy, 2000; Scannevin and Huganir, 2000; Sheng and Pak, 2000; Sheng and Sala, 2001; Tomita et al., 2001). The Shank and Homer families of proteins are core components of the PSD that interact directly with each other. Shank proteins [also called ProSAP (proline-rich synapse-associated protein), somatostatin receptor interactive protein (SSTRIP), cortBP (cortactin-binding protein), Synamon, and Spank] have a domain organization consisting of ankyrin repeats near the N terminal, followed by Src homology 3 domain, PSD-95/Dlg/ZO-1 homology (PDZ) domain, proline-rich region, and a Sterile Alpha Motif domain at the C terminus (Du et al., 1998; Boeckers et al., 1999; Lim et al., 1999; Naisbitt et al., 1999; Tu et al., 1999; Yao et al., 1999; Zitzer et al., 1999; Sheng and Kim, 2000). Shank is associated with the NMDA receptor (NMDAR)—PSD-95 complex by binding to the guanylate kinase-associated protein (GKAP), and with type-I metabotropic GluRs (mGluRs) via interaction with Homer (Naisbitt et al., 1999; Tu et al., 1999).
Homer proteins are encoded by three genes (Homer 1–3) and typically consist of an N-terminal EVH1 domain followed by a coiled-coil domain that mediates dimerization with other Homer proteins. The Ena/VASP Homology 1 (EVH1) domain of Homer1 binds to a PPXXF motif present in Shank, type-I mGluRs, and inositol-1,4,5-trisphosphate (IP3) receptors (Brakeman et al., 1997; Tu et al., 1998, 1999). Through their ability to self-associate, Homer isoforms containing the coiled-coil domain (termed “CC-Homer”) have the potential to physically and functionally link together the mGluR, IP3 receptor, and NMDA receptor complexes (Xiao et al., 2000; Fagni et al., 2002).
Homer1a is a short-splice variant of Homer1 that contains the EVH1 domain but lacks the coiled-coil domain; it might function as a natural dominant negative, because it cannot dimerize. Consistent with this idea, Homer1a overexpression attenuates mGluR-evoked intracellular calcium release, probably by interfering with Homer-mediated coupling between type-I mGluRs and IP3 receptors (Tu et al., 1998). Homer1a expression is induced at the mRNA level by synaptic activity (Brakeman et al., 1997; Sato et al., 2001; Thomas, 2002), but the functional significance of Homer1a with respect to neuronal plasticity is unclear.
We showed previously that long isoforms of Homer1 that contain the coiled-coil domain (specifically Homer1b) cooperate with Shank to induce morphological growth and maturation of spines and synapses. The ability of Shank to induce spine enlargement is enhanced by coexpression of Homer1b, depends on the ability of Shank to bind Homer1b, and correlates with the accumulation of both Shank and Homer1b in spines (Sala et al., 2001). We now report that the short-splice form of Homer1a regulates spine morphology in opposite direction to Homer1b. Homer1a reduces spine size and density and inhibits Shank-mediated spine enlargement in correlation with impaired targeting of Shank to synapses. In addition, Homer1a inhibits growth of synapses and synaptic transmission. We propose that Homer1a interferes with the interaction of Shank and constitutively expressed CC-Homer proteins, thereby leading to structural and functional reorganization of dendritic spines and synapses.
Materials and Methods
Neuron culture and COS-7 cells. Hippocampal neuron cultures were prepared from embryonic day 18 (E18) to E19 rat hippocampi. Medium-density neurons (150–200 cells/mm 2) were prepared as described previously (Brewer et al., 1993) with minor modifications. Neurons were transfected using calcium phosphate precipitation; transfection efficiency was ∼1%. COS-7 cells were transfected and processed for immunoblotting as described previously by Hsueh et al. (1997).
Recombinant DNA. Full-length hemagglutinin (HA)-tagged Shank1B (Sh1B) cDNA (Sala et al., 2001) was used as template for the Shank constructs that were used. N-terminal green fluorescent protein (GFP)-tagged versions of Shank1B and Shank1B1–1440 were made by replacing the HA tag with a _Hin_dIII–_Asc_I insert coding for enhanced GFP (EGFP). HA—Shank1B1440–1849 was prepared by PCR amplification of an _Asc_I—_Sal_I fragment coding the 1440–1849 region of Shank1B (Lim et al., 1999) and then subcloned in-frame into a GW1-cytomegalovirus expression vector (British Biotechnology, Oxford, UK) with a built-in N-terminal HA tag (N-HA-GW1 vector). Myc-tagged Homer1b, Homer1a, and Homer1aW24A were prepared as described previously (Tu et al., 1998; Xiao et al., 1998). GFP—Homer1b and —Homer1a were constructed by inserting the Homer1a or Homer1b coding sequence in GW1 with a built-in N-terminal GFP tag (N-GFP-GW1 vector). All of the constructs were verified by sequencing and by expression of proteins of the expected molecular weight in COS-7 cells.
Immunostaining and antibodies. For staining of intracellular proteins, neurons were fixed in 4% paraformaldehyde and 4% sucrose at room temperature, or in 100% methanol at -20°C for 10 min. Primary and secondary antibodies were applied in GDB buffer (30 mm phosphate buffer, pH 7.4, containing 0.2% gelatin, 0.5% Triton X-100, and 0.8 m NaCl). For surface staining of GluR2, neurons were incubated with the antibody at 37°C in a CO2 incubator for 10 min, washed extensively in PBS, and fixed in 4% paraformaldehyde and 4% sucrose at room temperature for 10 min. Secondary antibodies were applied in GDB as described above. The following antibodies/probes were used (source in parentheses): rat and mouse monoclonal anti-HA antibodies (Hoffmann-La Roche, Basel, Switzerland); mouse monoclonal anti-Myc epitope (Santa Cruz Biotechnology, Santa Cruz, CA); Shank antibodies Shank 56/e (Naisbitt et al., 1999); GKAP rabbit N1546 (Kim et al., 1997); PSD-95 mouse monoclonal K28/43.1 (gift from J. Trimmer, State University of New York, Stony Brook, NY); Shank guinea pig no. 1123, Homer rabbit 1133 [gifts from E. Kim (Korean Advanced Institute of Science and Technology, Taejon, Korea)]; synaptophysin mouse monoclonal (Sigma, St. Louis, MO); GluR2 N-terminal rabbit (Chemicon, Temecula, CA); NR1 mouse monoclonal (PharMingen, San Diego, CA); FITC-, Cy3-, and Cy5-conjugated secondary antibodies (Jackson ImmunoResearch, West Grove, PA); Texas Red-conjugated phalloidin (Molecular Probes, Eugene, OR). Fluorescence images were acquired using a Bio-Rad (Hercules, CA) MRC1024 confocal microscope.
Image acquisition and quantification. Confocal images were obtained using a Zeiss (Oberkochen, Germany) 63× objective or a Nikon (Melville, NY) 60× objective with sequential-acquisition setting at a resolution of 1280 × 1024 pixels. Each image was a _z_-series projection taken at 0.5–1 μm depth intervals. Transfected neurons were chosen randomly for quantification from 5 to 10 coverslips from three to six independent experiments for each construct. The number of neurons used for quantification is indicated in the figure legends. Morphometric measurements were performed using MetaMorph image analysis software (Universal Imaging Corporation, West Chester, PA). For dendritic-spine measurements, the maximum length and head width of each spine present on the dendrites was manually traced and automatically measured by computer and logged into Excel (Microsoft, Redmond, WA). The ratio of average immunofluorescence intensity between the spine head and the dendritic shaft was measured on manually selected spine head and dendritic-shaft areas. Cluster area and number were measured by thresholding the cluster area in randomly selected dendrites and automatically counted and measured by computer. Fluorescence intensity of the staining of endogenous proteins on the dendritic shaft and cell body was measured as mean intensity of manually selected areas on transfected and untransfected neurons. The ratio was obtained by comparing values in transfected cells with those in untransfected cells on the same image.
Electrophysiological recording. Organotypic hippocampal slice cultures were prepared from postnatal 8-d-old rats as described previously (Stoppini et al., 1991; Shi et al., 1999) and transfected at 4–6 d in vitro using a biolistic gene gun (Bio-Rad) (Lo et al., 1994) with 1.6 μm gold particles (12.5 mg per ∼60 bullets) coated with cDNAs: Myc—Homer1a with pEGFP-C1 (90:10 μg) or pEGFP-F (Clontech, Cambridge, UK) (60:40 μg), HA—Homer1a-W24A with pEGFP-C1 (90:10 μg) or pEGFP-F (60:40 μg), and pEGFP-C1 alone (10 μg). pEGFP-F-containing bullets were used for two-photon laser-scanning microscopic imaging. Bullets coated with two cDNAs coexpressed both proteins in 100% (98 of 98) of transfected cells when DsRed2 and GFP were cotransfected in pilot experiments. Furthermore, in approximately one-fifth of the experiments, we confirmed the coexpression in cotransfected cells by immunostaining with anti-Myc antibody against Myc—Homer1a after the recording.
Electrophysiological recordings and two-photon laser-scanning imaging were performed 40–52 hr after biolistic transfection. The recording chamber was perfused with artificial CSF (24–26°C) containing (in mm): 119 NaCl, 2.5 KCl, 4 CaCl2, 4 MgCl2, 26 NaHCO3, 1 NaH2PO4, 11 glucose, 0.15 picrotoxin (Sigma), and 0–0.01 2-chloroadenosine (ICN Biochemicals, Costa Mesa, CA), gassed with 5% CO2–95% O2, at pH 7.4. 2,3-Dioxo-6-nitro-1,2,3,4-tetrahydrobenzo[f]quinoxaline-7-sulfonamide disodium salt (NBQX) (0.01 mm; Tocris, Bristol, UK) was added in the bath solution during experiments in which NMDAR currents were recorded. For recording of Sr2+-induced asynchronous synaptic current, CaCl2 was substituted with 4 mm SrCl2. Patch recording pipettes (2–4 MΩ) were filled with internal solutions containing (in mm): 115 cesium methanesulfonate, 20 CsCl, 10 HEPES, 2. 5 MgCl2, 4 ATP disodium salt, 0.4 GTP trisodium salt, 10 sodium phosphocreatine, and 0.6 EGTA, at pH 7.25. For electrophysiological recording, the slice cultures were mounted on an upright microscope (BX51WI; Olympus Optical, Tokyo, Japan), and hippocampal CA1 pyramidal neurons were identified visually with an infrared (IR) differential interference contrast video microscope attached with an IR-CCD camera (Olympus Optical). Whole-cell recordings were made simultaneously from a pair of CA1 pyramidal neurons, one transfected and one untransfected, using two Axopatch-1D amplifiers (Axon Instruments, Foster City, CA). Postsynaptic responses were evoked by two bipolar electrodes with single voltage pulse (200 μsec, up to 10 V) at 0.2 Hz with stimulating electrodes placed in the stratum radiatum ∼200 μm from recorded cells. Stimulus level was set to produce a synaptic response of ∼50 pA. Synaptic AMPA receptor (AMPAR)-mediated responses at -60 mV and NMDAR-mediated responses at +40 mV were averaged over 50 trials. Series resistances typically ranged from 6 to 12 MΩ, and cell pairs that had >20% difference in series resistance were discarded. Asynchronous synaptic events were picked up from events that occurred between 150 and 500 msec after the stimulation and were analyzed with Mini Analysis software (Synaptosoft). The events >5 pA were analyzed. All of the experiments including data collection and analysis were performed blind to the DNA constructs used. All of the results are reported as mean ± SEM, and statistical significance was set at p < 0.05. Statistical significance was tested using Mann—Whitney test for the data in Figures 10 and 11_C_ and Kormogorov—Smirnov test for Figure 11 B. Two-photon laser-scanning microscope imaging was performed as described previously (Shi et al., 1999), using a custom-built microscope.
Figure 10.

Homer1a reduces synaptic AMPA and NMDA receptor responses. A, B, Images and synaptic response from neurons expressing Myc—Homer1a (A) or Myc—Homer1aW24A (B). Aa, Ba, Two-photon laser-scanning microscope images of apical secondary dendritic region of hippocampal CA1 pyramidal neuron coexpressing Myc—Homer1a or Myc—Homer1aW24A with GFP-F. Scale bars, 10 μm. Homer1a-overexpressed neurons have fewer spines than Homer1aW24A-overexpressed neurons. Ab—e, Bb—e, AMPAR EPSCs were evoked at -60 mV under voltage clamp. In the presence of NBQX, outward NMDAR EPSCs were measured at +40 mV. Ab, Bb, Averaged EPSCs recorded simultaneously from pairs of transfected cells and a neighboring untransfected cells are shown. The stimulus artifacts are truncated. Calibration, 20 pA, 20 msec. Ac, d, Bc, d, For each pair of cells, the amplitude of AMPAR EPSCs (Ac, Bc) or NMDAR EPSCs (Ad, Bd) from transfected cell is plotted against the amplitude of response in the control cell (open symbols). Averages of all of the values are shown in filled circles. Ae, Be, The ratio of AMPAR EPSC and NMDAR EPSC. Open circles connected with bars represent individual pairs of cells, and filled circles are averaged data. Homer1a: AMPAR, n = 19/10 (number of pathways/number of cells pairs); NMDAR, n = 11/6; AMPA/NMDA ratio, n = 11/6. HA—Homer1aW24A: AMPAR, n = 11/6; NMDAR, n = 11/6; ratio, n = 11/6. C, PPF of synaptic responses was induced by delivering afferent stimulation twice at an interstimulus interval of 50 msec. Calibration, 50 pA, 50 msec. D, Summary of PPF. The PPF ratios were calculated by dividing the average amplitude of the second EPSCs by that of the first EPSCs. There were no significant differences between the control and Homer1a or Homer1aW24A-expressing neurons. Homer1a, n = 11/6; Homer1aW24A, n = 11/6. Cntl, Control; H1a, Homer1a.
Figure 11.

Decreased quantal size of AMPAR-mediated EPSC in pyramidal cells expressing Homer1a. EPSCs were evoked in a solution containing Sr 2+ instead of Ca 2+. A, Left, Examples of asynchronous events that follow larger synchronous events. Arrow indicates the time for the stimulation, and the bar shows the section of trace that was used to detect quantal EPSCs (150 —500 msec after the stimulation). Calibration, 20 pA, 50 msec. Right, The average traces of asynchronous synaptic current recorded from control cell and Homer1a-expressing cell. Dotted line indicates peak height of control trace. The traces scaled to match the amplitude and aligned at the onset of response are shown at the bottom. Note that the time course of events is the same. Calibration, 2pA, 1 msec. B, Cumulative plot of amplitude of asynchronous synaptic current assembled from transfected and untransfected neuronal pairs (total of 1000 events pooled from 5 pairs of neurons, each contributing 200 events). The Homer1a-expressing cells showed a reduction in the amplitude of the events. C, Homer1a overexpression tends to reduce the frequency of quantal events. Data are expressed as the average number of quantal events observed during sampling period (150 —500 msec after the stimulation; see A). n = 10/5 (number of pathways/number of cell pairs). Cntl, Control; H1a, Homer1a. Open circles, Individual cells; closed circles, average.
Results
Homer1a reduces number and size of dendritic spines
Hippocampal neurons in dissociated culture were cotransfected at 12 d in vitro (DIV12) with Homer1a or Homer1b (epitope tagged with Myc) plus GFP (to outline the morphology of the transfected neurons). Four to 5 d after transfection (DIV16 —DIV17), neurons were fixed, and spine density and dimensions (length of spine and width of spine head) were measured using the GFP channel (Sala et al., 2001). It should be stressed that these light-microscopic measurements do not give the precise absolute size of spines but provide reasonable estimates of relative changes in spine dimensions.
Neurons transfected with Homer1a, the activity-inducible short-splice variant, showed a reduced size and number of dendritic spines compared with control neurons transfected with GFP alone (Fig. 1_A,B,D_). Cumulative frequency plots showed a modest but statistically significant shift to the left (lower values) for spine width and length in Homer1a transfected neurons (Fig. 1_E,F_, Table 1). In contrast, as previously shown (Sala et al., 2001), spine length, width, and number were unchanged in neurons overexpressing Homer1b, the constitutively expressed CC-Homer splice variant (Fig. 1_A,C—F_, Table 1).
Figure 1.

Homer1a reduces spine number and size. A—C, Hippocampal neurons were transfected at DIV12 with GFP alone (control), or with GFP plus Myc—Homer1a (H1a) or Myc—Homer1b (H1b), as indicated at the right, and stained for GFP and Myc at DIV16 —DIV17. A1, B1, C1, Examples in the GFP channel of dendrites from transfected neurons. A2,B2,C2, Myc staining. Scale bar, 5 μm. D, Number of spines per 10 μm of dendrite length in neurons transfected with the indicated constructs. Histograms show mean ± SEM; *p < 0.01. _E, F_, Cumulative frequency plots of spine head width (_E_) and length (_F_). More than eight transfected neurons, corresponding to >7000 μm in dendrite length, were measured for each condition.
Table 1.
Effect of Homer on size and number of spines
| Transfected with | Width ± SEM of spine (μm) | Length ± SEM of spine (μm) | Number of spines per 10 μm of dendrite ± SEM |
|---|---|---|---|
| GFP alone | 0.75 ± 0.08 | 1.23 ± 0.09 | 4.2 ± 0.5 |
| GFP + Shank1B | 1.17 ± 0.10* | 1.39 ± 0.16* | 4.5 ± 0.9 |
| GFP + Shank1B + Homer1b | 1.33 ± 0.07*# | 1.72 ± 0.23*# | 3.9 ± 0.8 |
| GFP + Shank1B + Homer1a | 0.72 ± 0.07 | 1.09 ± 0.14& | 4.2 ± 0.5 |
| GFP + Shank1B + Homer1aW24A | 1.19 ± 0.09* | 1.37 ± 0.11* | 4.0 ± 0.4 |
| GFP + Homer1b | 0.68 ± 0.11 | 1.11 ± 0.14 | 4.6 ± 0.4 |
| GFP + Homer1a | 0.54 ± 0.09* | 0.95 ± 0.09* | 1.9 ± 0.4* |
| GFP + Homer1aW24A | 0.70 ± 0.13 | 1.21 ± 0.10 | 4.3 ± 0.5 |
| GFP + Shank1B1440-1849 | 0.56 ± 0.05* | 1.01 ± 0.06* | 1.4 ± 0.2* |
We previously showed that coexpression of Homer1b can enhance the ability of Shank (Shank1B) to increase spine length and width, and that this effect depends on the ability of Shank1B to bind to Homer1b (Sala et al., 2001). What is the action of Homer1a in conjunction with Shank1B? Neurons cotransfected with Shank1B and Homer1a showed no significant difference in spine width from that of control (Fig. 2_A,C,G—I_, Table 1) and a small but significant reduction in spine length. Thus, unlike Homer1B, not only did Homer1a fail to enhance the spine enlargement induced by Shank1B, but it actually abolished the effect of Shank1B on spine growth.
Figure 2.

Homer1a inhibits Shank-mediated spine enlargement. A—F, Hippocampal neurons were transfected at DIV12 with GFP alone (control), or with GFP plus HA—Shank1B (Sh1B), Myc—Homer1a (H1a), Myc—Homer1aW24A (H1aW24A), or HA—Shank1B1440—1849 [Sh1B (1440–1849)], as indicated to the right, and stained for GFP, HA, and Myc at DIV16 —DIV17. Shown are examples in the GFP channel of dendrites from transfected neurons. Scale bar, 5 μm. G, Number of spines per 10 μm of dendrite length in neurons transfected with the indicated constructs. Histograms show mean ± SEM; *p < 0.01. _H, I_, Cumulative frequency plots of spine head width (_H_) and length (_I_). More than eight transfected neurons, corresponding to >7000 μm of dendrite length, were measured for each condition.
We then tested whether the inhibitory effect of Homer1a on Shank-mediated spine enlargement depends on its EVH1 domain, which mediates Homer binding to Shank. Neurons cotransfected with Shank1B and Homer1aW24A [a mutant of Homer1a with a substitution in the binding pocket of the EVH1 domain that abolishes binding to the PPXXF motif (Beneken et al., 2000)] showed enlarged spines similar to neurons overexpressing Shank1B alone (Fig. 2_D,G—I_, Table 1). These data suggest that Homer1a might act by competing with endogenous CC-Homer proteins for binding to Shank1B, thereby inhibiting the effect of Shank on spine morphology. Consistent with this notion, and in contrast to Homer1a, the Homer1aW24A mutant had no effect on spine number or size when overexpressed alone (Fig. 2_E,G—I_, Table 1). Thus, the dominant-negative effect of Homer1a depends on the EVH1 domain that binds to PPXXF motifs.
We also tested an alternative construct that should interfere with endogenous Homer—Shank interaction. Overexpression of a region derived from Shank1B (corresponding to residues 1440–1849 and containing the PPXXF motif responsible for Homer binding) reduced spine number, width, and length to a similar extent as did overexpression of Homer1a (Fig. 2_F—I_, Table 1). Together, these data indicate that spine number and dimensions are influenced by the level of Homer1a, and that the interaction between Shank and constitutively expressed CC-Homer isoforms (such as Homer1b/c) is required to maintain the number and dimension of spines in hippocampal neurons.
Homer1a inhibits Shank localization in synapse
To investigate the mechanism underlying the inhibitory effect of Homer1a on spine morphogenesis, we examined the localization of endogenous Shank in neurons transfected with Homer1a or Homer1b. Untransfected neurons or those transfected with vector alone showed the typical punctate synaptic staining for Shank (Fig. 3_Aa_), with a density of 8.2 ± 1.7 (mean ± SEM) Shank clusters per 10 μm of dendrite length (C). Overexpression of Homer1a drastically reduced the number of clusters of endogenous Shank to 1.4 ± 0.3 (p < 0.01, compared with vector-transfected neurons) (Fig. 3_Ab,C_), whereas Homer1b had no effect (8.9 ± 2.3; p = 0.17) (Ac,C). The density of Shank clusters in neurons overexpressing the Homer1aW24A mutant was not significantly different from that of untransfected or vector-transfected cells (7.5 ± 1.9; p = 0.08) (Fig. 3_Ad,C_), indicating that the ability of Homer1a to bind to the PPXXF motif is required for inhibition of Shank clustering. Using immunofluorescence intensity to quantify Homer1a protein, we found an inverse correlation between Homer1a expression level and the density of Shank clusters in individual transfected neurons (data not shown). We also estimated that elevation of Homer1a protein level in individual neurons to a molar ratio of Homer1a: Homer1b/c of ∼1 correlated with a reduction of Shank cluster density to approximately one-third of that in untransfected neurons (data not shown).
Figure 3.
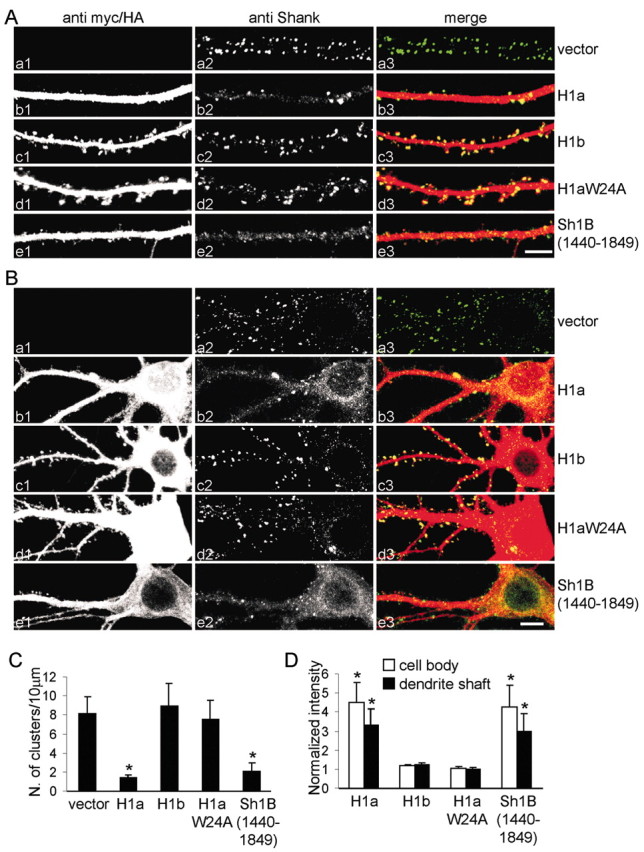
Homer1a inhibits synaptic clustering of Shank. A, B, Neurons were transfected at DIV12 with different constructs, as indicated at the right, and stained at DIV16 —DIV17 for Myc or HA (left; Aa1—e1, Ba1—e1) to label transfected proteins, and for endogenous Shank (middle; Aa2—e2, Ba2—e2). Individual channels are shown in grayscale for better resolution and more quantitative representation of staining intensity; color merge is shown at right (Aa3—e3, Ba3—e3). C, Density of clusters of Shank per 10 μm of dendrite length (mean ± SEM) in neurons transfected with the indicated constructs. D, Quantification of shaft and cell body staining intensity of endogenous Shank in neurons transfected with the indicated constructs (mean ± SEM; >6 neurons and >7000 μm of dendrite length for each condition). *p < 0.01. Scale bars: Ae3 (for A), Be3 (for B), 5 μm. H1a, Homer1a; H1b, Homer 1b; H1aW24A, Homer1aW24A.
Overexpression of the interfering construct Shank1B1440–1849 also reduced the number of endogenous Shank clusters (2.0 ± 0.9; p < 0.01, compared with vector-transfected neurons) (Fig. 3_Ae,C_). These data suggest that binding between Shank and endogenous CC-Homer proteins is required for Shank localization or Shank stabilization in synapses. Homer1a, being monovalent with respect to EVH1 domain and Shank binding, likely disrupts the endogenous CC-Homer—Shank interaction, leading to loss of Shank from synapses.
We noted that, whereas Homer1a overexpression reduced synaptic clusters of Shank, it enhanced the staining intensity of endogenous Shank in the cell body (4.5 ± 1.1-fold increase; mean ± SEM) and in the dendritic shaft (3.3 ± 0.8-fold increase) as did Shank1B1440–1849 (4.2 ± 1.2 in the cell body and 2.9 ± 0.9 in dendritic shaft) (Fig. 3_Ba,b,e_; quantified in D). Neither Homer1b nor Homer1aW24A changed the distribution of endogenous Shank (Fig. 3_Ba,c,d,D_). These data suggest that Shank accumulation in the PSD depends on its interaction with Homer, and that Shank is redistributed to the cytoplasm of dendritic shaft and cell body when its binding to CC-Homer is inhibited by Homer1a.
We confirmed the effect of Homer1a on the synaptic localization of Shank by monitoring the distribution of exogenous GFP-tagged Shank. When expressed alone or with an empty vector, GFP—Shank1B was highly enriched in the heads of dendritic spines (Fig. 5_A_); only a faint GFP signal was present in the cell body and dendritic shaft. However, when Homer1a was cotransfected with GFP—Shank1B, the GFP fluorescence decreased in intensity at synapses and increased in dendritic shafts and cell body (Figs. 4 A, 5_B_). A similar effect was seen with Shank1B1440–1849 (Fig. 5_E_). We quantified the intensity of the GFP signal over the dendritic shaft and in the synaptic area, expressing the two as a ratio (Fig. 5_L_). Homer1a reduced the spine/shaft ratio for GFP—Shank1B to 4.6 ± 0.5 (from 8.6 ± 1.6 for vector-transfected cells; p < 0.001). Cotransfection with Homer1b gave the opposite result: the synaptic accumulation of GFP—Shank1B increased (Figs. 4 B, 5_C_), and the spine/shaft ratio was raised to 14.9 ± 2.6 (p < 0.01) (Fig. 5_L_). GFP—Shank1B distribution was not affected by overexpressing Homer1aW24A, which cannot bind to Shank (spine/shaft ratio, 8.9 ± 1.2) (Figs. 4_C_, 5 D, L). Similarly to Homer1a, Shank1B1440–1849 also reduced the GFP—Shank1B spine/shaft ratio (4.9 ± 0.4; p < 0.01).
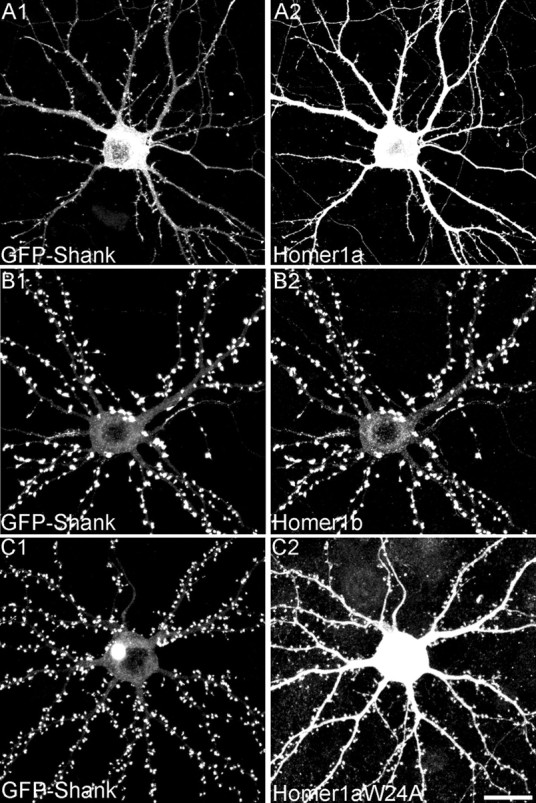
Figure 5.

Synaptic accumulation of GFP—Shank1B depends on interaction between Homer and Shank. A—E, Neurons were cotransfected with GFP—Shank1B plus empty vector (A), Homer1a (B), Homer1b (C), Homer1aW24A (D), or Shank1B1440—1849 (E). F—H, Neurons were cotransfected with GFP—Shank1–1440 plus empty vector (F), Homer1a (G), or Homer1b (H). I—K, Neurons were cotransfected with GFP—Homer1b plus empty vector (I), Homer1a (J), or Homer1aW24A (K). A—K show images of dendrites from transfected neurons in the GFP channel. L, Synaptic targeting of GFP—Shank1B, GFP—Shank1B1–1440, and GFP—Homer1b in neurons transfected with the indicated constructs, quantified by the ratio of staining intensity in spine/shaft (>10 neurons examined for each construct, corresponding to at least 6000 μm of dendrite length and 1800 synapses). Error bars indicate SEM. *p < 0.01. Scale bar, 10 μm.
Figure 4.
Effect of Homer1a and Homer1b on synaptic targeting of GFP—Shank1B. Hippocampal neurons were cotransfected at DIV12 with GFP-tagged Shank1B plus Homer1a (A1,2) or Homer1b (B1,2) or Homer1aW24A (C1,2), and double-labeled at DIV16 for Homer (A2,B2,C2) and for GFP—Shank (A1, B1, C1). Scale bar, 20 μm.
We previously showed that Shank targeting to synapses requires the PDZ domain of Shank (Sala et al., 2001). Indeed the construct GFP—Shank1–1440, containing the PDZ domain but lacking the C-terminal Homer binding site, was still enriched in synapses, but to a lesser degree than Shank1B, with relatively intense GFP signal remaining in the dendritic shaft and in the cell body (spine/shaft ratio, 6.0 ± 0.9; compared with 8.6 ± 1.6 for Shank1B) (Fig. 5_F_ and data not shown). Not surprisingly, the subcellular distribution of GFP—Shank11–1440, which cannot bind Homer, was unaffected by cotransfection of Homer1a or Homer1b (Fig. 5_F–H,L_). Thus, binding to CC-Homer appears to be important for strong enrichment of Shank1B in spines.
We also wanted to examine the effect of Homer1a overexpression on the synaptic localization of CC-Homer proteins like Homer1b. Because our Homer antibodies cannot distinguish between transfected Homer1a and endogenous Homer1b, we studied the effect of transfected Myc-tagged Homer1a on the distribution of cotransfected GFP-tagged Homer1b. As reported previously (Okabe et al., 2001), GFP—Homer1b accumulated in spines when expressed alone (spine/shaft ratio, 7.2 ± 1.5) (Fig. 5_I,L_). However, on cotransfection of Myc—Homer1a, the distribution of GFP—Homer1b shifted toward the dendrite shaft (spine/shaft ratio, 1.1 ± 0.4) (Fig. 5_J,L_). The spine targeting of GFP—Homer1b was unaffected by overexpressing Homer1aW24A (spine/shaft ratio, 6.9 ± 1.4) (Fig. 5_K,L_). Thus, Homer1a overexpression causes the dispersal of CC-Homer, as well as Shank, from postsynaptic sites, probably by interfering with the EVH1-mediated interaction between Homer and Shank.
The effects of Homer1a on synaptic proteins
Because Homer1a reduced the density of spines and the synaptic clustering of Shank, we examined whether Homer1a also affects the localization of other synaptic proteins. The density of PSD-95 puncta was not affected by the overexpression of either Homer1b or Homer1a (Fig. 6_D_). However, the size of PSD-95 clusters was noticeably smaller in neurons overexpressing Homer1a (∼30% reduction in mean area compared with neurons transfected with empty vector), but unchanged by Homer1b (Fig. 6_A—E_). The frequency distribution analysis of PSD-95 cluster area reveals that Homer1a increases the number of clusters with an area <0.6 μm2 (Fig. 6_F_). These data suggest that the size of the PSD is diminished by Homer1a.
Figure 6.

Effect of Homer1a and Homer1b on synaptic clustering of PSD-95. A—C, Neurons were transfected with empty vector (A), Myc—Homer1a (B), or Myc—Homer1b (C), as indicated. Each row of images (A1—3, etc.) shows double-labeling for Myc (red) and PSD-95 (green), and merge in color. Individual channels are shown in grayscale for better resolution and more quantitative representation of staining intensity. Scale bar, 5 μm. D—F, Histograms show number (D), area (E), and frequency distribution of area (F) of PSD-95 clusters in neurons transfected as indicated. *p < 0.01. More than six neurons and >2000 synapses were examined for each construct.
We also examined the effect of Homer1a or Homer1b on the distribution of GFP—PSD-95 in cotransfected neurons. When cotransfected with Homer1b, GFP—PSD-95 was highly localized to synapses and typically concentrated at the tips of dendritic spines, similar to vector-transfected neurons (Fig. 7_A,B_). In neurons overexpressing Homer1a, however, GFP—PSD-95 clusters were smaller, and most of them were localized close to the dendritic shaft (Fig. 7_C_), consistent with the loss of spines in these neurons. In neurons cotransfected with GFP—PSD-95 and Shank1B, which showed greatly enlarged dendritic spines, the GFP—PSD-95 fluorescence was often split in two or three clusters within individual spines (Fig. 7_D_).
Figure 7.

Effect of Homer1a, Homer1b, and Shank on distribution of GFP—PSD-95. Neurons were transfected with GFP—PSD-95 alone (A) or cotransfected with GFP—PSD-95 plus Myc—Homer1b (B), Myc—Homer1a (C), or HA—Shank1B (D). Left panels show GFP—PSD-95 (GFP channel, green; A1, B1, C1, D1); middle panels show staining for endogenous Shank (A2), Myc (B2, C2), and HA (D2); right panels show merge in color (A3, B3, C3, D3). Scale bar, 2.5 μm.
GKAP is a PSD protein that links PSD-95 and Shank (Naisbitt et al., 1999). As with PSD-95, the pattern of endogenous GKAP staining was modified by Homer1a overexpression. GKAP clusters were smaller in Homer1a-transfected neurons (0.57 ± 0.12 μm2; mean ± SEM) compared with Homer1b-transfected neurons (0.89 ± 0.22 μm2) (Fig. 8_A,B_)or untransfected neurons (0.87 ± 0.19 μm2) (data not shown).
Figure 8.

Effect of Homer1a and Homer1b on clustering of other synaptic proteins. Neurons were transfected at DIV12 with Homer1a (A, C, E), Homer1b (B, D, F), or Shank1B1440–1849 (H), and stained at DIV16 —DIV17 for the transfected proteins (green) and for endogenous GKAP (A, B), F-actin (C, D), synaptophysin (E, F), or Homer (G, H) (red); merge is shown in color in right panels. Scale bar, 5 μm.
Homer1b overexpression did not change the staining intensity or number of clusters of F-actin or synaptophysin compared with untransfected or vector-transfected neurons (Fig. 8_C,E_ and data not shown). However, in Homer1a transfected neurons, although staining intensity was not significantly altered, the clusters of F-actin and synaptophysin were generally close to the dendritic shaft instead of being slightly displaced from the shaft as is typical for normal spine localization (Fig. 8_C,E_). Moreover, F-actin clusters were often elongated instead of the usual round shape.
We finally studied the distribution of endogenous Homer in neurons transfected with Shank1B1440–1849. As expected, synaptic clustering of endogenous Homer was greatly reduced when the binding between endogenous Shank and Homer was inhibited by Shank1B1440–1849 (Fig. 8_G,H_). These findings are consistent with the effects of Homer1a on the distribution of GFP—Homer1b (Fig. 5_I,K_).
There is a correlation between spine size and the level of PSD-95 and synaptic AMPARs (El-Husseini et al., 2000, 2002; Matsuzaki et al., 2001). We found that, in GFP—Homer1a-transfected neurons, GluR2 surface staining was reduced (Fig. 9_B_), compared with GFP—Homer1b- or vector-transfected neurons (A,C). Moreover, GFP—Homer1a overexpression reduced the number of surface AMPA clusters to 3.3 ± 0.2 per 10 μm of dendrite, compared with vector-transfected (7.5 ± 1.4) or GFP—Homer1b-transfected neurons (6.9 ± 1.3). The number of clusters of NMDA receptors (as detected with an antibody against the NR1 subunit) was also reduced in neurons overexpressing Homer1a (7.3 ± 1.0 per 10 μm of dendrite) compared with vector-transfected (9.7 ± 1.2) or Homer1b-transfected neurons (9.1 ± 1.5). In addition, Homer1a decreased the size of NR1 clusters [0.63 ± 0.15 μm2; compare with 0.98 ± 0.21 μm2 (vector transfected) and 0.97 ± 0.25 μm2 (Homer1b transfected)] (Fig. 9_D—F,H_).
Figure 9.

Effect of Homer1a and Homer1b on AMPA receptorsand NMDA receptors. Neurons were transfected with empty vector (A, D), GFP—Homer1a (B), Myc—Homer1a (E), GFP—Homer1b (C), or Myc—Homer1b (F) and double labeled for transfected proteins (green) and surface GluR2 (A—C) or total NR1 (D—F). Scale bar, 5 μm. G, Number of surface GluR2 clusters per 10 μm of dendrite length in neurons transfected as in A—C. H, Number of NR1 clusters per 10 μm of dendrite length in neurons transfected as in D—F. *p < 0.01; more than six neurons and >2000 synapses were measured for each construct. Error bars indicate SEM.
Together, these data show that Homer1a has a negative effect on the number and size of spines and on the size of the PSD, which could be explained by the impaired accumulation of Shank and other PSD proteins at the synapse.
Expression of Homer1a reduces synaptic transmission
What are the electrophysiological consequences of Homer1a overexpression? We recorded excitatory synaptic responses from CA1 pyramidal neurons in organotypic culture of hippocampal slice, transfected with Homer1a by the biolistic method. These cells also exhibited morphologically similar change (Fig. 10_A,B_) as seen in dissociated culture. Pairs of adjacent transfected and untransfected neurons were simultaneously recorded (the transfected cell identified by fluorescence of cotransfected EGFP) (Hayashi et al., 2000). Consistent with the reduced surface expression of AMPA and NMDA receptors detected immunocytochemically, the amplitude of both AMPA and NMDA receptor-mediated EPSCs were depressed in Homer1a-transfected neurons (Fig. 10 A). The ratio of AMPAR and NMDAR currents was unchanged, implying that both components were equally affected. In contrast, neurons transfected with Homer1aW24A showed no significant differences in AMPAR- and NMDAR-mediated EPSCs or AMPA/NMDA ratio (Fig. 10_B_). Thus, Homer1a not only disrupts the morphology of dendritic spines but also reduces the strength of synaptic transmission through a mechanism requiring EVH1 domain-mediated protein interaction.
Paired-pulse facilitation (PPF) of AMPA receptor-mediated EPSCs (induced at an interstimulus interval of 50 msec) (Regehr and Stevens, 2001) was not significantly different between untransfected cells and cells transfected with Homer1a or Homer1aW24A (Fig. 10_C,D_), suggesting that the presynaptic release probability is not affected by Homer1a overexpression. In other control experiments, GFP transfection alone had no effect on AMPA receptor currents [untransfected, 46.4 ± 6.1 pA; GFP, 45.6 ± 7.3 pA; p = 0.720; n = 16/9 (number of pathways/number of cells)], NMDAR-mediated current (control, 97.7 ± 9.8 pA; GFP, 73.7 ± 12.2 pA; p = 0.358; n = 11/6), or PPF (control, 1.79 ± 0.04; GFP, 1.69 ± 0.06; p = 0.148; n = 15/8). These data, in conjunction with morphological data, support the idea that Homer1a reduces glutamate receptors at synapses. To further confirm this, we compared the quantal events of synaptic response in Homer1a-expressing and control neurons. To compare quantal events of similar origin and postsynaptic location in neighboring transfected and untransfected neurons, synaptic responses were recorded in the presence of Sr2+ instead of Ca2+. Such substitution results in a desynchronization of transmitter release among activated release sites, thereby leading to the occurrence of quantal events within a few hundred milliseconds of afferent stimulation (Fig. 11_A_) (Goda and Stevens, 1994; Poncer et al., 2002). In such pairs, the quantal size was significantly reduced (Fig. 11_B_), consistent with the reduction of synaptic AMPA receptor number. The frequency of events showed a slight reduction, but this did not reach statistical significance (1Fig. 11_C_). Considering the fact that there are no changes in PPF (Fig. 10_D_), this is likely to reflect the reduction of amplitude of the AMPAR-mediated quantal event below the detection threshold as well.
Discussion
A central question in neuroscience is how dendritic spines and synapses can be structurally and functionally modified to support experience-dependent changes in neuronal connectivity. In this study, we showed that overexpression of Homer1a reduces dendritic spine number and size in hippocampal neurons. Associated with this morphological effect, Homer1a induces the redistribution of endogenous Shank protein from synapses to dendritic shaft and cell body, and the shrinkage of PSDs as measured by PSD-95 and GKAP staining. Functionally, Homer1a inhibits postsynaptic AMPA and NMDA receptor currents, in correlation with reduced surface levels of these receptors. Together, these data suggest an inhibitory role for the inducible Homer1a protein in the activity-dependent regulation of synapse structure and function.
Mechanism of Homer1a action
How does Homer1a affect dendritic-spine morphogenesis? Because it lacks the coiled-coil domain that mediates multimerization, Homer1a likely functions as a naturally occurring dominant-negative form of Homer (Xiao et al., 2000). Homer1a can compete with constitutively expressed CC-Homer proteins (such as Homer1b/c) that have the capacity to link together EVH1 domain-binding partners such as Shank, mGluRs, and IP3 receptors. In transgenic mice, Homer1a overexpression impairs mGluR-evoked intracellular calcium release, presumably by disrupting the mGluR—Homer1b/c—IP3R complex (Tu et al., 1998; Xiao et al., 1998). We propose that the interaction between Shank and multimeric CC-Homer proteins is required to stabilize Shank—Homer complexes at postsynaptic sites. Indeed strong accumulation of Shank in synapses depends on its ability to bind to Homer (this study) as well as GKAP (Naisbitt et al., 1999). Disruption of Shank—CC-Homer interactions by Homer1a leads to instability and loss of Shank from the PSD. Because Shank is a major scaffold protein of the PSD, and important for spine morphogenesis and synapse maturation (Sheng and Kim, 2000; Sala et al., 2001; Ehlers, 2002), the loss of Shank from the PSD could primarily explain the negative effects of Homer1a on the morphology and function of synapses.
The above model can explain why overexpression of Homer1b, by providing multimerized EVH1 domains for binding to Shank, would enhance the spine-promoting effects of Shank overexpression (Sala et al., 2001), and why Shank needs a Homer-binding site to accumulate strongly in spines (this study) and to promote spine morphogenesis (Sala et al., 2001). Our interpretation is also supported by the fact that overexpression of Sh1B1440–1849, which contains the Homer binding site, has similar inhibitory effects on spine morphogenesis as Homer1a, whereas the Homer1aW24A mutant is ineffective in this regard.
Our results do not exclude other mechanisms by which Homer1a could impair spine morphogenesis. Homer1a might affect intracellular calcium responses to activation of mGluRs or other postsynaptic receptors by interfering with coupling to the IP3 receptor; and calcium release from intracellular stores has been implicated in the regulation of spine morphology (Harris, 1999; Korkotian and Segal, 1999). Homer1a has also been shown to stimulate mGluR1/5 activity (Ango et al., 2001), which might influence dendritic spine morphology (Vanderklish and Edelman, 2002). Finally, we cannot exclude the possibility that the effect of Homer1a on spine morphogenesis is secondary to the reduction of surface AMPA receptors, the activity of which is required to maintain dendritic-spine numbers (McKinney et al., 1999). Whatever the precise mechanism, our findings demonstrate that inducible Homer1a acts in opposition of (and presumably in competition with) the constitutively expressed CC-Homer proteins in the regulation of dendritic spines.
Homer1a regulation of synapse structure and function
Homer1a not only reduces dendritic-spine dimensions and number, but also alters the molecular content of the postsynaptic specialization, as evidenced by reduced synaptic staining for PSD-95, GKAP, NR1, and surface GluR2. The decreased level of these proteins suggests that a shrinkage of the postsynaptic membrane accompanies the reduction of spine size. This interpretation fits well with the reduction in both AMPA and NMDA currents measured electrophysiologically. A positive correlation has been shown previously between PSD-95 cluster size and postsynaptic AMPA currents (Schnell et al., 2002). Our data extend this correlation to include GKAP and Shank, two scaffold proteins that are physically linked to PSD-95. The similar effect of Homer1a on several PSD proteins (Shank, GKAP, and PSD-95) suggests that the molecular composition of the PSD is regulated in an integrated manner, perhaps coordinated by key scaffold proteins and their specific protein interactions. Interestingly, changes in PSD-95 level per se have been shown previously to correlate with changes of AMPA receptor levels, but not of NMDA receptors (El-Husseini et al., 2000, 2002; Schnell et al., 2002). The inhibitory effect of Homer1a on NMDA receptor clustering and synaptic responses therefore implies an action of Homer1a that is independent of its effects on PSD-95.
Homer1a mRNA and protein expression is increased by synaptic activity, and is associated in vivo with neural plasticity, seizure, visual stimulation, cocaine administration, BDNF administration, and exploration of novel environments (Brakeman et al., 1997; Kato et al., 1997; Park et al., 1997; Sato et al., 2001; Potschka et al., 2002; Vazdarjanova et al., 2002). In our hippocampal cultures, Homer1a protein expression is also induced by 18 hr after stimulation with NMDA and kainic acid (data not shown). Because Homer1a has profound effects on synapse morphology and function, we hypothesize that its induction by activity could contribute to the mechanisms of synaptic plasticity in the brain. However, the exact physiological significance of inducible Homer1a remains unclear.
Because Homer1a is induced at the mRNA level and presumably translated primarily in the cell body (Xiao et al., 1998), it lacks an obvious mechanism for targeted effects on a specific subset of synapses. Our neuron culture experiments also suggest that Homer1a has a widespread inhibitory effect on spines and synapses throughout the neuron. We speculate, therefore, that Homer1a induction plays a role in the homeostatic mechanisms that maintain the global-activity level of neurons within a normal range (Turrigiano and Nelson, 2000). In such a negative-feedback model, activation of a subset of synapses in a neuron leads to induction of Homer1a protein, which then acts to inhibit synapses generally and reset overall activity in the neuron to a normal level.
Footnotes
C.S. is supported by the Giovanni Armenise-Harvard Foundation Career Development Program and MIUR (40%). K.F. is a recipient of the Special Postdoctoral Researchers Fellowship from RIKEN. Y.H. is in part supported by Ellison Medical Foundation. M.S. is Investigator of the Howard Hughes Medical Institute. We thank Dr. Kenichi Okamoto for his help in imaging.
Correspondence should be addressed to Dr. Morgan Sheng, The Picower Center for Learning and Memory and Howard Hughes Medical Institute, Massachusetts Institute of Technology, 77 Massachusetts Avenue (E18-215), Cambridge, MA 02139. E-mail: msheng@mit.edu.
K. Yamamoto's present address: Department of Neurology, Graduate School of Medicine, Kyoto University, 54 Shogoin-Kawaharacho, Sakyoku, Kyoto 606-8507, Japan.
Copyright © 2003 Society for Neuroscience 0270-6474/03/236327-11$15.00/0
References
- Ango F, Prezeau L, Muller T, Tu JC, Xiao B, Worley PF, Pin JP, Bockaert J, Fagni L ( 2001) Agonist-independent activation of metabotropic glutamate receptors by the intracellular protein Homer. Nature 411: 962–965. [DOI] [PubMed] [Google Scholar]
- Beneken J, Tu JC, Xiao B, Nuriya M, Yuan JP, Worley PF, Leahy DJ ( 2000) Structure of the Homer EVH1 domain-peptide complex reveals a new twist in polyproline recognition. Neuron 26: 143–154. [DOI] [PubMed] [Google Scholar]
- Boeckers TM, Kreutz MR, Winter C, Zuschratter W, Smalla KH, Sanmarti-Vila L, Wex H, Langnaese K, Bockmann J, Garner CC, Gundelfinger ED ( 1999) Proline-rich synapse-associated protein-1/cortactin binding protein 1 (ProSAP1/CortBP1) is a PDZ-domain protein highly enriched in the postsynaptic density. J Neurosci 19: 6506–6518. [DOI] [PMC free article] [PubMed] [Google Scholar]
- Brakeman PR, Lanahan AA, O'Brien R, Roche K, Barnes CA, Huganir RL, Worley PF ( 1997) Homer: a protein that selectively binds metabotropic glutamate receptors. Nature 386: 284–288. [DOI] [PubMed] [Google Scholar]
- Brewer GJ, Torricelli JR, Evege EK, Price PJ ( 1993) Optimized survival of hippocampal neurons in B27-supplemented Neurobasal, a new serum-free medium combination. J Neurosci Res 35: 567–576. [DOI] [PubMed] [Google Scholar]
- Du Y, Weed SA, Xiong W-C, Marshall TD, Parsons JT ( 1998) Identification of a novel cortactin SH3 domain-binding protein and its localization to growth cones of cultured neurons. Mol Cell Biol 18: 5838–5851. [DOI] [PMC free article] [PubMed] [Google Scholar]
- Ehlers MD ( 2002) Molecular morphogens for dendritic spines. Trends Neurosci 25: 64–67. [DOI] [PubMed] [Google Scholar]
- El-Husseini AE, Schnell E, Chetkovich DM, Nicoll RA, Bredt DS ( 2000) PSD-95 involvement in maturation of excitatory synapses. Science 290: 1364–1368. [PubMed] [Google Scholar]
- El-Husseini AE, Schnell E, Dakoji S, Sweeney N, Zhou Q, Prange O, Gauthier-Campbell C, Aguilera-Moreno A, Nicoll RA, Bredt DS ( 2002) Synaptic strength regulated by palmitate cycling on PSD-95. Cell 108: 849–863. [DOI] [PubMed] [Google Scholar]
- Fagni L, Worley PF, Ango F ( 2002) Homer as both a scaffold and transduction molecule. Sci STKE 2002: RE8. [DOI] [PubMed] [Google Scholar]
- Goda Y, Stevens CF ( 1994) Two components of transmitter release at a central synapse. Proc Natl Acad Sci USA 91: 12942–12946. [DOI] [PMC free article] [PubMed] [Google Scholar]
- Harris KM ( 1999) Calcium from internal stores modifies dendritic spine shape. Proc Natl Acad Sci USA 96: 12213–12215. [DOI] [PMC free article] [PubMed] [Google Scholar]
- Hayashi Y, Shi SH, Esteban JA, Piccini A, Poncer JC, Malinow R ( 2000) Driving AMPA receptors into synapses by LTP and CaMKII: requirement for GluR1 and PDZ domain interaction. Science 287: 2262–2267. [DOI] [PubMed] [Google Scholar]
- Hsueh Y-P, Kim E, Sheng M ( 1997) Disulfide-linked head-to-head multimerization in the mechanism of ion channel clustering by PSD-95. Neuron 18: 803–814. [DOI] [PubMed] [Google Scholar]
- Kato A, Ozawa F, Saitoh Y, Hirai K, Inokuchi K ( 1997) vesl, a gene encoding VASP/Ena family related protein, is upregulated during seizure, long-term potentiation and synaptogenesis. FEBS Lett 412: 183–189. [DOI] [PubMed] [Google Scholar]
- Kennedy MB ( 2000) Signal-processing machines at the postsynaptic density. Science 290: 750–754. [DOI] [PubMed] [Google Scholar]
- Kim E, Naisbitt S, Hsueh Y-P, Rao A, Rothschild A, Craig AM, Sheng M ( 1997) GKAP, a novel synaptic protein that interacts with the guanylate kinase-like domain of the PSD-95/SAP90 family of channel clustering molecules. J Cell Biol 136: 669–678. [DOI] [PMC free article] [PubMed] [Google Scholar]
- Korkotian E, Segal M ( 1999) Release of calcium from stores alters the morphology of dendritic spines in cultured hippocampal neurons. Proc Natl Acad Sci USA 96: 12068–12072. [DOI] [PMC free article] [PubMed] [Google Scholar]
- Lim S, Naisbitt S, Yoon J, Hwang JI, Suh PG, Sheng M, Kim E ( 1999) Characterization of the Shank family of synaptic proteins. Multiple genes, alternative splicing, and differential expression in brain and development. J Biol Chem 274: 29510–29518. [DOI] [PubMed] [Google Scholar]
- Lo DC, McAllister AK, Katz LC ( 1994) Neuronal transfection in brain slices using particle-mediated gene transfer. Neuron 13: 1263–1268. [DOI] [PubMed] [Google Scholar]
- Matsuzaki M, Ellis-Davies GC, Nemoto T, Miyashita Y, Iino M, Kasai H ( 2001) Dendritic spine geometry is critical for AMPA receptor expression in hippocampal CA1 pyramidal neurons. Nat Neurosci 4: 1086–1092. [DOI] [PMC free article] [PubMed] [Google Scholar]
- McKinney RA, Capogna M, Durr R, Gahwiler BH, Thompson SM ( 1999) Miniature synaptic events maintain dendritic spines via AMPA receptor activation. Nat Neurosci 2: 44–49. [DOI] [PubMed] [Google Scholar]
- Naisbitt S, Kim E, Tu JC, Xiao B, Sala C, Valtschanoff J, Weinberg RJ, Worley PF, Sheng M ( 1999) Shank, a novel family of postsynaptic density proteins that binds to the NMDA receptor/PSD-95/GKAP complex and cortactin. Neuron 23: 569–582. [DOI] [PubMed] [Google Scholar]
- Okabe S, Urushido T, Konno D, Okado H, Sobue K ( 2001) Rapid redistribution of the postsynaptic density protein PSD-Zip45 (Homer 1c) and its differential regulation by NMDA receptors and calcium channels. J Neurosci 21: 9561–9571. [DOI] [PMC free article] [PubMed] [Google Scholar]
- Park H T, Kang E K, Bae K W ( 1997) Lightregulates Home rmRNA expression in the rat suprachiasmatic nucleus. Brain Res Mol Brain Res 52: 318–322. [DOI] [PubMed] [Google Scholar]
- Poncer JC, Esteban JA, Malinow R ( 2002) Multiple mechanisms for the potentiation of AMPA receptor-mediated transmission by α-Ca 2+/calmodulin-dependent protein kinase II. J Neurosci 22: 4406–4411. [DOI] [PMC free article] [PubMed] [Google Scholar]
- Potschka H, Krupp E, Ebert U, Gumbel C, Leichtlein C, Lorch B, Pickert A, Kramps S, Young K, Grune U, Keller A, Welschof M, Vogt G, Xiao B, Worley PF, Loscher W, Hiemisch H ( 2002) Kindling-induced overexpression of Homer 1A and its functional implications for epileptogenesis. Eur J Neurosci 16: 2157–2165. [DOI] [PubMed] [Google Scholar]
- Regehr WG, Stevens CF ( 2001) Physiology of synaptic transmission and short-term plasticity. Baltimore: Johns Hopkins UP.
- Sala C, Piech V, Wilson NR, Passafaro M, Liu G, Sheng M ( 2001) Regulation of dendritic spine morphology and synaptic function by Shank and Homer. Neuron 31: 115–130. [DOI] [PubMed] [Google Scholar]
- Sato M, Suzuki K, Nakanishi S ( 2001) NMDA receptor stimulation and brain-derived neurotrophic factor upregulate Homer 1a mRNA via the mitogen-activated protein kinase cascade in cultured cerebellar granule cells. J Neurosci 21: 3797–3805. [DOI] [PMC free article] [PubMed] [Google Scholar]
- Scannevin RH, Huganir RL ( 2000) Postsynaptic organization and regulation of excitatory synapses. Nat Rev Neurosci 1: 133–141. [DOI] [PubMed] [Google Scholar]
- Schnell E, Sizemore M, Karimzadegan S, Chen L, Bredt DS, Nicoll RA ( 2002) Direct interactions between PSD-95 and stargazin control synaptic AMPA receptor number. Proc Natl Acad Sci USA 99: 13902–13907. [DOI] [PMC free article] [PubMed] [Google Scholar]
- Sheng M, Kim E ( 2000) The Shank family of scaffold proteins. J Cell Sci 113: 1851–1856. [DOI] [PubMed] [Google Scholar]
- Sheng M, Pak DTS ( 2000) Ligand-gated ion channel interactions with cytoskeletal and signaling proteins. Annu Rev Physiol 62: 755–778. [DOI] [PubMed] [Google Scholar]
- Sheng M, Sala C ( 2001) PDZ domains and the organization of supramolecular complexes. Annu Rev Neurosci 24: 1–29. [DOI] [PubMed] [Google Scholar]
- Shi SH, Hayashi Y, Petralia RS, Zaman SH, Wenthold RJ, Svoboda K, Malinow R ( 1999) Rapid spine delivery and redistribution of AMPA receptors after synaptic NMDA receptor activation. Science 284: 1811–1816. [DOI] [PubMed] [Google Scholar]
- Stoppini L, Buchs PA, Muller D ( 1991) A simple method for organotypic cultures of nervous tissue. J Neurosci Methods 37: 173–182. [DOI] [PubMed] [Google Scholar]
- Thomas U ( 2002) Modulation of synaptic signalling complexes by Homer proteins. J Neurochem 81: 407–413. [DOI] [PubMed] [Google Scholar]
- Tomita S, Nicoll RA, Bredt DS ( 2001) PDZ protein interactions regulating glutamate receptor function and plasticity. J Cell Biol 153: F19–F24. [DOI] [PMC free article] [PubMed] [Google Scholar]
- Tu JC, Xiao B, Yuan JP, Lanahan AA, Leoffert K, Li M, Linden DJ, Worley PF ( 1998) Homer binds a novel proline-rich motif and links group 1 metabotropic glutamate receptors with IP3 receptors. Neuron 21: 717–726. [DOI] [PubMed] [Google Scholar]
- Tu JC, Xiao B, Naisbitt S, Yuan JP, Petralia RS, Brakeman P, Doan A, Aakalu VK, Lanahan AA, Sheng M, Worley PF ( 1999) Coupling of mGluR/Homer and PSD-95 complexes by the Shank family of postsynaptic density proteins. Neuron 23: 583–592. [DOI] [PubMed] [Google Scholar]
- Turrigiano GG, Nelson SB ( 2000) Hebb and homeostasis in neuronal plasticity. Curr Opin Neurobiol 10: 358–364. [DOI] [PubMed] [Google Scholar]
- Vanderklish PW, Edelman GM ( 2002) Dendritic spines elongate after stimulation of group 1 metabotropic glutamate receptors in cultured hippocampal neurons. Proc Natl Acad Sci USA 99: 1639–1644. [DOI] [PMC free article] [PubMed] [Google Scholar]
- Vazdarjanova A, McNaughton BL, Barnes CA, Worley PF, Guzowski JF ( 2002) Experience-dependent coincident expression of the effector immediate-early genes Arc and Homer 1a in hippocampal and neocortical neuronal networks. J Neurosci 22: 10067–10071. [DOI] [PMC free article] [PubMed] [Google Scholar]
- Xiao B, Tu JC, Petralia RS, Yuan JP, Doan A, Breder CD, Ruggiero A, Lanahan AA, Wenthold RJ, Worley PF ( 1998) Homer regulates the association of group 1 metabotropic glutamate receptors with multivalent complexes of Homer-related, synaptic proteins. Neuron 21: 707–716. [DOI] [PubMed] [Google Scholar]
- Xiao B, Tu JC, Worley PF ( 2000) Homer: a link between neural activity and glutamate receptor function. Curr Opin Neurobiol 10: 370–374. [DOI] [PubMed] [Google Scholar]
- Yao I, Hata Y, Hirao K, Deguchi M, Ide N, Takeuchi M, Takai Y ( 1999) Synamon, a novel neuronal protein interacting with synapse-associated protein 90/postsynaptic density-95-associated protein. J Biol Chem 274: 27463–27466. [DOI] [PubMed] [Google Scholar]
- Zitzer H, Honck HH, Bachner D, Richter D, Kreienkamp HJ ( 1999) Somatostatin receptor interacting protein defines a novel family of multidomain proteins present in human and rodent brain. J Biol Chem 274: 32997–33001. [DOI] [PubMed] [Google Scholar]