Aberrant Chloride Transport Contributes to Anoxic/Ischemic White Matter Injury (original) (raw)
Abstract
Rundown of ionic gradients is a central feature of white matter anoxic injury; however, little is known about the contribution of anions such as Cl−. We used the in vitro rat optic nerve to study the role of aberrant Cl− transport in anoxia/ischemia. After 30 min of anoxia (NaN3, 2 mm), axonal membrane potential (_V_m) decreased to 42 ± 11% of control and to 73 ± 11% in the presence of tetrodotoxin (TTX) (1 μm). TTX + 4,4′-diisothiocyanatostilbene-2,2′ disulfonic acid disodium salt (500 μm), a broad spectrum anion transport blocker, abolished anoxic depolarization (95 ± 8%). Inhibition of the K-Cl cotransporter (KCC) (furosemide 100 μm) together with TTX was also more effective than TTX alone (84 ± 14%). The compound action potential (CAP) area recovered to 26 ± 6% of control after 1 hr anoxia. KCC blockade (10 μm furosemide) improved outcome (40 ± 4%), and TTX (100 nm) was even more effective (74 ± 12%). In contrast, the Cl− channel blocker niflumic acid (50 μm) worsened injury (6 ± 1%). Coapplication of TTX (100 nm) + furosemide (10 μm) was more effective than either agent alone (91 ± 9%). Furosemide was also very effective at normalizing the shape of the CAPs. The KCC3a isoform was localized to astrocytes. KCC3 and weaker KCC3a was detected in myelin of larger axons. KCC2 was seen in oligodendrocytes and within axon cylinders. Cl− gradients contribute to resting optic nerve membrane potential, and transporter and channel-mediated Cl− fluxes during anoxia contribute to injury, possibly because of cellular volume changes and disruption of axo-glial integrity, leading to propagation failure and distortion of fiber conduction velocities.
Keywords: anoxia, ischemia, axon, chloride, K-Cl cotransporter, KCC
Introduction
Anoxia/ischemia induces cellular ionic deregulation caused by failure of regulatory mechanisms such as ATPases and coupled ion exchangers. As shown previously in CNS white matter, with the fall in energy substrates, axonal Na+ overload occurs that in turn initiates Ca2+ accumulation in large part through reverse operation of the Na+/Ca2+exchanger (Stys et al., 1992). In anoxic CNS axons, Na+ overload is essentially balanced by an equivalent efflux of K+ from the axoplasm (LoPachin and Stys, 1995; Stys and LoPachin, 1998), thus maintaining an electroneutral exchange of ions. One might therefore expect that restraining Na+ influx into axoplasm during anoxia (e.g., by applying tetrodotoxin (TTX) or replacing bath Na+ with an impermeant cation) would secondarily reduce K+ loss. Unexpectedly, axoplasmic K+ depletion is not restrained in anoxic optic nerve axons even when Na+overload is blocked by TTX (Stys and LoPachin, 1998). Instead, K+ loss is balanced by efflux of Cl− and likely other organic anions (Stys and LoPachin, 1998). Anion transporters including Na-K-2Cl (NKCC) cotransporter, Na+-coupled Cl−/HCO3−exchange, and the KCl-cotransporter (KCC) play an important role in intracellular Cl− regulation in central neurons (Kaila, 1994). Given its cotransport of K+ and Cl−, KCC would be a plausible candidate for mediating the observed parallel efflux of these ions during anoxia under conditions when Na+ overload is restrained (as may occur during attempts at neuroprotection with Na+ channel blockers or glutamate receptor antagonists). The emergence of K+-Cl−co-efflux under such conditions may have important implications for cellular integrity, because osmotically obligated water loss may have deleterious effects on cellular volume and therefore mechanical integrity, and in addition, this loss of water may in turn paradoxically concentrate remaining ions (such as Na+) to toxic levels (see Discussion).
There are currently four known isoforms of the KCC (Gillen et al., 1996; Payne et al., 1996; Mount et al., 1999), which are part of the larger family of cation-coupled cotransporter proteins that also includes the Na-K-2Cl cotransporter. Identified in 1996 by Payne and colleagues, the neuronal isoform (KCC2) appears to mainly extrude Cl− out of the cell under physiological conditions (Payne et al., 1996). KCC3 has been shown to have a robust expression in the brain (Mount et al., 1999) with a cellular localization to white matter tracts (Pearson et al., 2000, 2001). On the basis of the fact that during anoxia and Na+-channel inhibition there is persistent decay in membrane potential (Leppanen and Stys, 1997), probably as a result of K+ efflux that proceeds in conjunction with Cl− exit (Stys et al., 1997), we hypothesized that blockade of Cl− loss during anoxia/Na+-channel inhibition will impede K+ efflux and protect white matter against anoxia better than Na+-channel blockers alone. We confirmed that combined inhibition of Na+ influx and K+ + Cl−efflux via the KCC reduced anoxic depolarization and improved compound action potential (CAP) recovery to a greater extent than Na+ channel inhibitors alone. Moreover, quantitative evaluation of the CAP wave-shape revealed that combined treatment also greatly improved not only CAP area but also the shape, suggesting a preservation of the underlying tissue architecture (e.g., maintenance of axo-glial relationships or myelin integrity that would preserve conduction velocities of constituent fibers). We therefore suggest that, at least for white matter, combined Na+ channel inhibition and reduction of secondary K+ and Cl− efflux represents an improved neuroprotective strategy.
Materials and Methods
Electrophysiology. Compound resting membrane potential was recorded from optic nerves in vitro dissected free from adult Long–Evans rats. One nerve was recorded immediately using a grease gap chamber at 37°C as described previously (Leppanen and Stys, 1997), whereas the second was stored in oxygenated artificial CSF (ACSF) containing (in mm): 126 NaCl, 3 KCl, 26 NaHCO3, 2 MgSO4, 1.25 NaH2PO4, 2 CaCl2, and 10 glucose, pH 7.45) at room temperature for later study. No consistent differences were noted between nerves recorded immediately and those held for later study. Raw baseline gap potentials (_V_g) varied from nerve to nerve (typical range −45 to −50 mV) because of differences in the short circuit factor (Stämpfli, 1954). Therefore for display purposes all potentials were normalized (denoted_V_m) to the true resting potential of CNS myelinated axons of −80 mV (Stys et al., 1997). Quantitative comparisons over time were performed using ratios of recorded potentials; therefore, this normalization had no effect on such calculations. For technical reasons, we were unable to obtain reproducible responses in the grease gap chamber using N2/CO2 as a means of inducing anoxia, even with the use of oxygen scavengers (data not shown). This was likely because of the configuration of the chamber, which prevented adequate isolation allowing some ambient O2 to access the nerves, resulting in excessively variable recordings. Instead we elected to induce anoxia chemically (Leppanen and Stys, 1997) with either CN−or N3−, which gave similar results.
Propagated compound action potentials were recorded using suction electrodes as described previously (Stys et al., 1991). Briefly, nerves were placed in an interface perfusion chamber, perfused with ACSF (2 ml/min, 37°C), and gassed with either 95% O2or 95% N2, balance CO2. Supramaximal constant voltage stimuli were delivered and responses were recorded using a pair of glass suction electrodes. Anoxia was achieved by switching to N2/CO2, and ischemia was simulated by exposure to anoxia with equimolar replacement of glucose by sucrose [oxygen–glucose deprivation (OGD)].
Pharmacology. TTX (Alomone Labs) was prepared as a stock solution in distilled water. 4,4′-Diisothiocyanatostilbene-2,2′ disulfonic acid disodium salt (DIDS), furosemide, bumetanide, and niflumic acid were purchased from Sigma (St. Louis, MO). DIDS was added directly to the desired volume of ACSF solution to make up the required concentration. Furosemide was first dissolved in DMSO. Both bumetanide and niflumic acid were dissolved in ethanol. NaCN was acquired from BDH (Toronto, Ontario, Canada). NaN3 was purchased from Fisher Scientific. All other salts were purchased from Sigma.
All errors are reported as SDs, and statistical significance was assessed using a Student's t test. All experimental protocols were approved by the institutional animal care committee.
Immunohistochemistry. Deeply anesthetized Long–Evans rats (200–300 gm) were perfused transcardially with 0.9% saline followed by 2% paraformaldehyde containing 20 mml-lysine, 2.5 mm sodium periodate, and 2.5% potassium dichromate. The optic nerves were postfixed for 2 hr and immersed in 0.1 m PBS for 24 hr. The protocol was as follows: wash three times for 10 min each in Tris buffer containing 1.5% NaCl and 0.3% Triton X-100 (TBS-T) and incubate for 30 min at 4°C in methanol; wash three times for 10 min each in TBS-T; block with 10% normal goat serum in TBS-T for 1 hr at room temperature; and incubate overnight with primary antibody diluted in TBS-T containing 2% normal goat serum. All KCC primary antibodies (Chemicon, Temecula, CA) were diluted at a concentration of 5 μg/ml and 16 μg/ml for neurofilament 160 (NF160; Sigma, Oakville, Ontario, Canada). The next day, the optic nerves were washed three times for 10 min each in TBS-T. Goat anti-rabbit Cy2 (1:200) and goat anti-mouse Texas Red (1:100; Jackson ImmunoResearch, West Grove, PA) were used for secondaries. Sections were imaged on a Bio-Rad 1024 or Nikon C1 confocal with 60× oil immersion objective.
Results
_V_g recordings in ACSF typically stabilized 90 min after insertion into the grease gap chamber. Raw control resting potentials ranged from −45 to −50 mV. No consistent differences were noted between the first and second nerves studied sequentially. To compare responses over time and between different treatments, ratios of _V_g values were calculated at different time points (typically 30 and 60 min) with respect to potentials at time 0 (defined as a stable potential baseline before any experimental treatment).
Effects of Cl− transport inhibition on membrane potential (_V_m) during anoxia
We elected to induce anoxia chemically, using 2 mmeither NaCN or NaN3, inhibitors of complex IV of the respiratory chain (Kauppinen and Nicholls, 1986; Tadic, 1992). Figure 1A shows a typical response to chemical anoxia induced by CN−. Resting membrane potential depolarized within minutes, decaying to 44 ± 14 and to 34 ± 13% of control after 30 and 60 min. N3− produced very similar results (40 ± 6 and 30 ± 5% of control potential remaining after 30 and 60 min). Results from both treatments were therefore combined in subsequent analyses (Table1). Chemical ischemia was induced by combining NaN3 (2 mm) and iodoacetic acid-Na+ salt (IAA) (1 mm), an irreversible blocker of the glycolytic enzyme glyceraldehyde-3-phosphate dehydrogenase (Sabri and Ochs, 1971)._V_m decayed to values comparable with those observed with chemical anoxia alone (41 ± 5 and 31 ± 6% at 30 and 60 min, respectively) (n = 10) (Fig.1B).
Fig. 1.
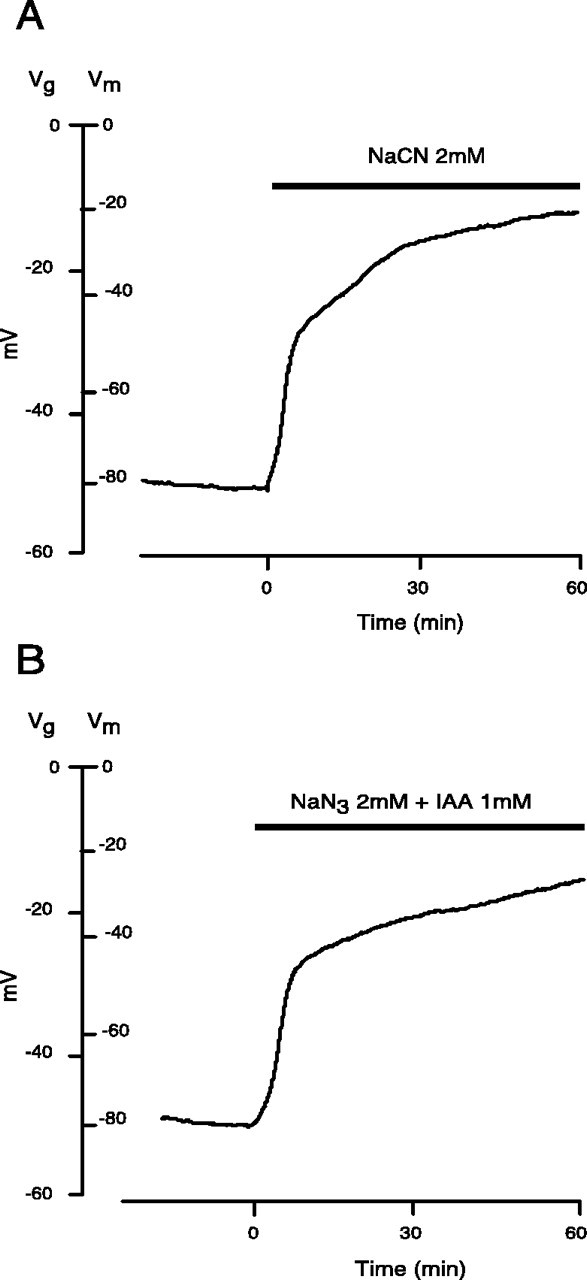
Effect of chemical anoxia and ischemia on the membrane potential of rat optic nerve. _V_grepresents recorded gap potential and _V_mrepresents membrane potential. Time 0 in this and all subsequent figures denotes application of insult. A, NaCN (2 mm) caused a rapid loss of membrane potential decaying to ∼42 ± 11 and 32 ± 10% of control at 30 and 60 min, respectively, of chemical anoxia. B, Chemical ischemia, 2 mm NaN3 + 1 mm IAA, caused a decay of 41 ± 5 and 31 ± 6% after 30 and 60 min of perfusion.
Table 1.
Summary of different pharmacological manipulations and their effects on membrane potential of rat optic nerve expressed as means ± SD
| Treatment | 30 min (%_V_m) | 60 min (%_V_m) | n |
|---|---|---|---|
| Chemical ischemia (OGD) | 41 ± 5 | 31 ± 6 | 10 |
| Chemical anoxia | 42 ± 11 | 32 ± 10 | 14 |
| DIDS 500 μm | 43 ± 8 | 40 ± 9 | 2 |
| Furosemide 10 μm | 57 ± 8 | 46 ± 10 | 2 |
| TTX 1 μm | 73 ± 11 | 63 ± 18 | 12 |
| TTX 1 μm + DIDS 500 μm | 95 ± 8 | 89 ± 6 | 13 |
| TTX 1 μm + furosemide 100 μm | 84 ± 14 | 79 ± 16 | 20 |
| 0Na | 77 ± 9 | 73 ± 10 | 3 |
| 0Na/DIDS | 92 ± 3 | 84 ± 5 | 5 |
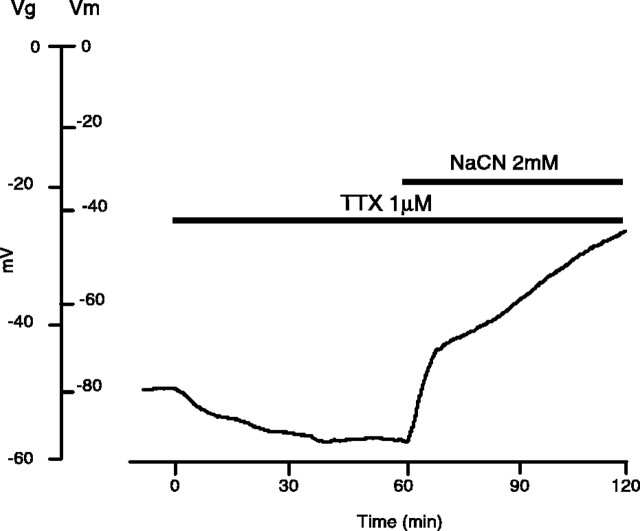
Previous reports have demonstrated the effectiveness of Na+ channel inhibition as a neuroprotective strategy in anoxic white matter (Stys et al.,1992; Fern et al., 1993; Leppanen and Stys, 1997). The effects of TTX (1 μm) on optic nerve resting membrane potential during anoxia or ischemia are illustrated in Figure2 and quantitatively in Figure 4. Application of TTX under normoxic conditions caused a hyperpolarization as observed previously (Stys et al., 1993; Leppanen and Stys, 1997). Depolarization was less pronounced in anoxic nerves exposed to TTX (73 ± 11% of control _V_mremaining after 30 min in TTX + anoxia vs 42 ± 11% with anoxia alone, p < 0.01; 63 ± 18% after 60 min,p < 0.001; n = 12). Replacement of Na+ with an impermeant cation during chemical anoxia resulted in a blunted depolarization to 77 ± 9% of control membrane potential at 30 min (p < 0.01 vs chemical anoxia) and to 73 ± 10% after 60 min (p < 0.01; n = 3) (see Fig. 4). Because neither of the above manipulations completely prevented anoxic depolarization, other non-Na+-dependent pathways promoting loss of resting membrane potential in anoxic axons may exist.
Fig. 2.
Effect of Na+-channel inhibition on the membrane potential of rat optic nerve. TTX (1 μm) preapplied for 1 hr before chemical anoxia caused a brief hyperpolarization of _V_m, thus indicating the presence of a Na+ conductance at rest. During chemical anoxia, 1 μm TTX blunted the rapid phase of the characteristic depolarization (73 ± 11% of control_V_m remaining after 30 min in TTX + anoxia vs 42 ± 11% with anoxia alone, p < 0.005; 63 ± 18% after 60 min, p < 0.001;n = 12), suggesting that Na+influx through TTX-sensitive channels constitutes one of the primary events in producing the anoxic depolarization.
Fig. 4.
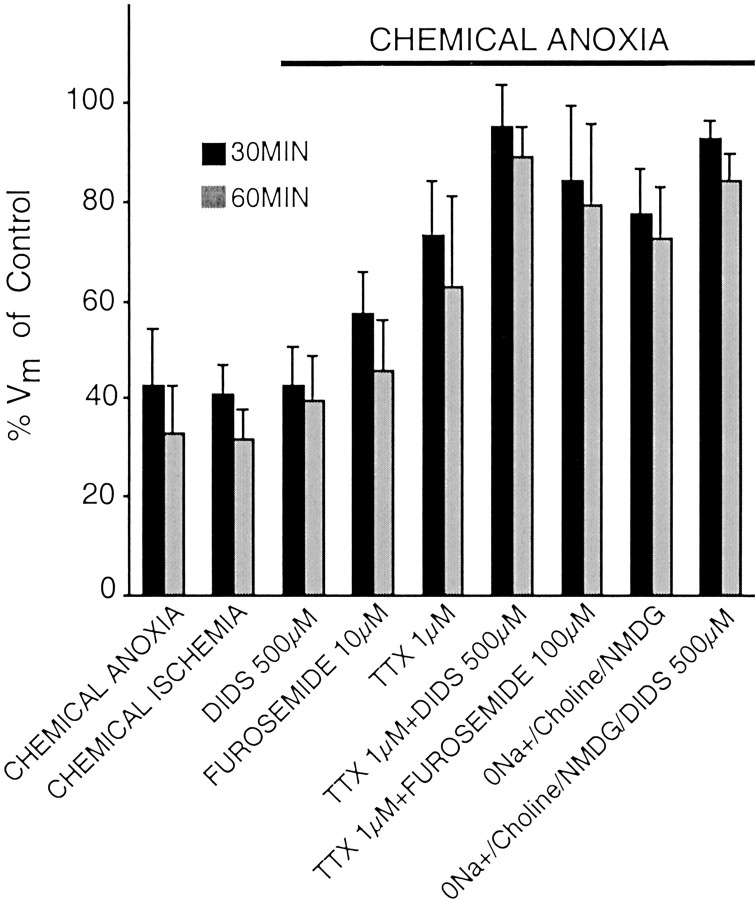
Summary of different pharmacological manipulations and their effects on _V_m of rat optic nerve. Both chemical anoxia and ischemia caused comparable decay profiles. Anion transport blockers, 500 μm DIDS and 10 μm furosemide, when used alone during chemical anoxia were ineffective in maintaining _V_m at pre-anoxic levels. Na+-channel blockade, 1 μm ttx, was more effective in preserving_V_m to a large extent during chemical anoxia. Nevertheless, there existed a residual portion of the depolarization, which was Na+ independent as seen from inhibition of either Na+ channels or Na+replacement. Co-blockade of Na+ channel (1 μm TTX) and anion transport (500 μm DIDS) or Na+ replacement (NMDG) in combination with 500 μm DIDS produced a robust maintenance of_V_m. Furosemide (100 μm), KCC blocker, coapplied with 1 μm TTX, improved_V_m maintenance as compared with TTX alone. However, the levels were not as comparable as those of DIDS, presumably because there are other pathways involved in mediating residual_V_m depolarization during TTX/chemical anoxia perfusion.
The role of anion transporters on resting membrane potential during anoxia was studied using DIDS, a broad-spectrum anion transport blocker that acts on the K+-Cl−cotransporter (Russell, 2000), volume-sensitive Cl− channels (Estevez et al., 1999), Cl−-HCO3−exchange (Clark et al., 1998; Sakai and Tosaka, 1999), and hyperpolarization-activated Cl− channels (Clark et al., 1998). In contrast, DIDS has no reported effect on Na+-K+-2Cl−or Na+-Cl−cotransporters (Russell, 2000). DIDS (500 μm) alone did not alter the anoxic depolarization (43 ± 8%, _p_= 0.99 vs chemical anoxia at 30 min; 40 ± 9% at 60 min,p = 0.45; n = 2) (see Fig. 4).
Previous results indicate that Na+ channel inhibition promotes efflux of Cl− in parallel with K+ from anoxic optic axons (Stys and LoPachin, 1998); thus concomitant blockade of Na+-influx and Cl−-efflux pathways would be expected to spare K+-efflux and further reduce anoxic depolarization. Application of TTX (1 μm) together with 500 μm DIDS (Figs.3A,4) reduced the amount of depolarization to a greater degree than TTX alone (95 ± 8 vs 73 ± 10% in TTX alone at 30 min, p < 0.001; 89 ± 6 vs 63 ± 18% at 60 min, p < 0.001;n = 13) (Fig. 3A). DMSO (0.2% v/v used for DIDS stock solutions) had no effect on the anoxia-induced membrane potential changes (data not shown). Zero Na+/choline/NMDG reduced anoxic depolarization to a similar extent as did TTX, and addition of DIDS (500 μm) to the zero-Na+ perfusate was even more effective (Fig. 4) (_V_m maintained at 92 ± 3% of control after 30 min in zero-Na+DIDS vs 77 ± 9% in zero-Na+alone).
Fig. 3.
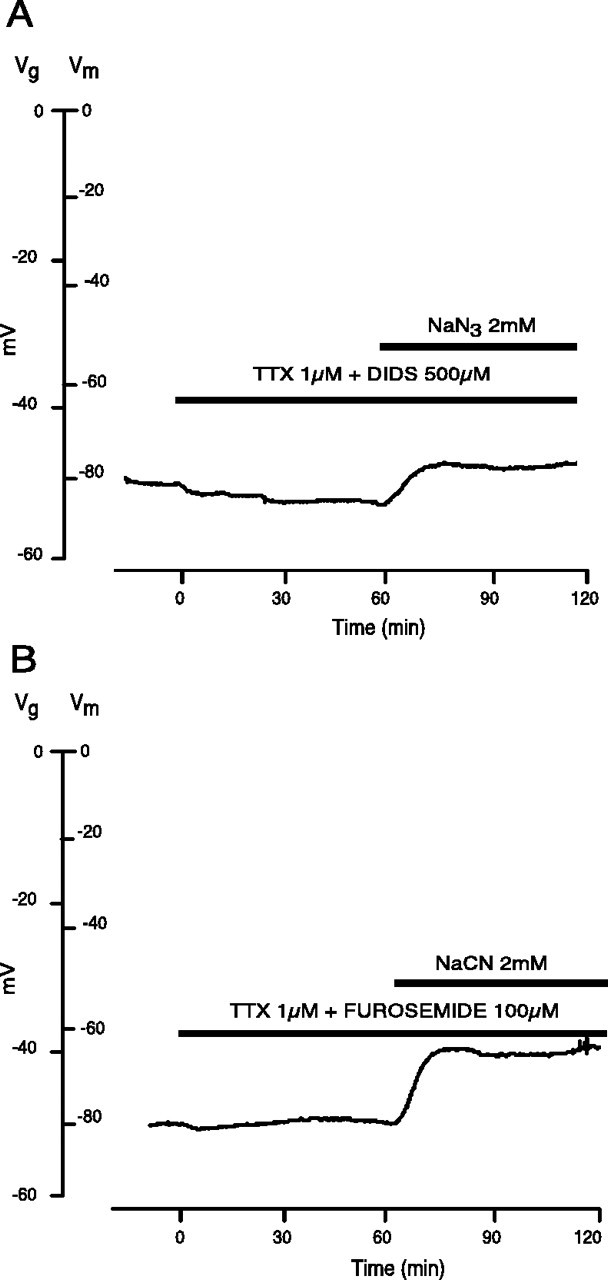
Effect of anion transport and Na+-channel co-blockade on the membrane potential of rat optic nerve during chemical anoxia. A, DIDS (500 μm), a broad-spectrum anion transport blocker, applied during normoxic conditions, had no effect on 1 μm TTX hyperpolarization. During chemical anoxia, the combined treatment allowed for maximum maintenance of _V_m(95 ± 8 vs 73 ± 10% in TTX alone at 30 min,p < 0.001; 89 ± 6 vs 63 ± 18% at 60 min, p < 0.001; n = 13), suggesting an anion component for the depolarization. B, Furosemide (100 μm), a relatively specific blocker for KCC, produced a blunting of the residual depolarization seen with TTX + CN− (84 ± 14% _V_mremaining after 30 min in TTX + furosemide vs 73 ± 10% in TTX alone at 30 min, p < 0.05; 79 ± 16 vs 63 ± 18%, p < 0.05; n = 20). This suggests that the DIDS effect is mediated primarily, but not exclusively, via KCC.
Of the many anion transporters inhibited by DIDS, one potential route that could mediate both Cl− and K+ flux is the KCC. More selective inhibition of this transporter with furosemide (100 μm), a relatively specific blocker of KCC at this concentration (for review, see Cabantchik and Greger, 1992; Payne, 1997) reduced anoxic depolarization more than TTX alone (Figs. 3B, 4) (84 ± 14% _V_m remaining after 30 min in TTX + furosemide vs 73 ± 10% in TTX alone at 30 min,p < 0.01; 79 ± 16 vs 63 ± 18% at 60 min,p < 0.05; n = 20). However, the fact that DIDS reduced anoxic depolarization more than furosemide suggests that additional Cl− transport pathways were operating in parallel (TTX + DIDS vs TTX + furosemide;p < 0.05 at both 30 and 60 min).
Effects of Cl− transport inhibition on the propagated compound action potential
Figure 5A shows a typical control CAP recorded from optic nerve under normoxic conditions and 3 hr in normoxia after 1 hr of anoxic insult. The area of the CAP recovered to 24 ± 12% (n = 46) of control after 1 hr anoxia/reoxygenation, in agreement with previous reports (Stys et al., 1992). In vitro ischemia (1 hr of OGD) (Figs.5B, 9) allowed mean CAP area recovery of only 8 ± 3% of control after 3 hr of reperfusion (n = 9).
Fig. 5.
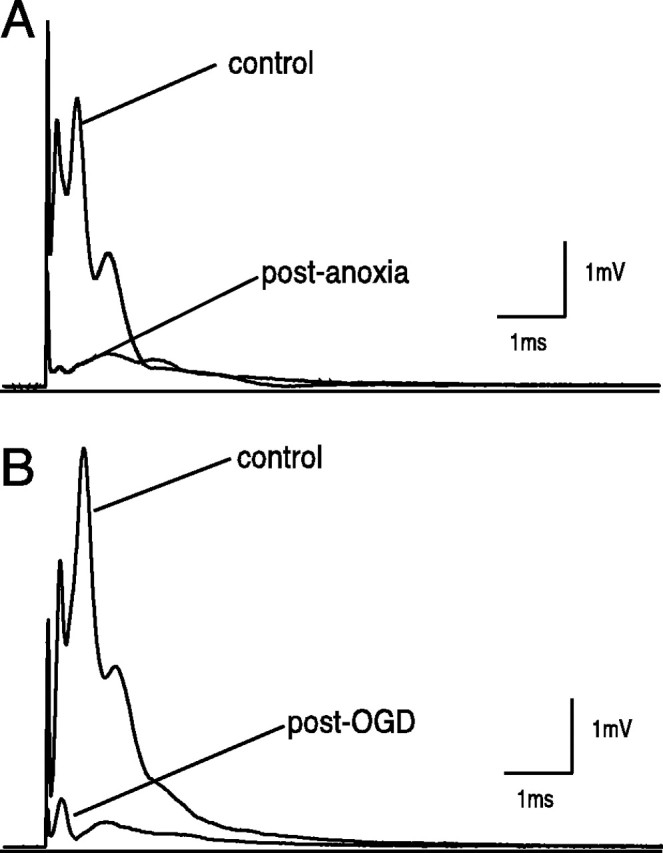
Effects of anoxia versus oxygen/glucose deprivation (OGD) on the compound action potential of the rat optic nerve. A, Recovery of the CAP area after 60 min anoxic insult in normal ACSF was 26 ± 6% of control at 3 hr after reoxygenation. B, With the stronger insult of 60 min OGD, the recovery was only 8 ± 4% of control, also at 3 hr after reoxygenation.
Fig. 9.
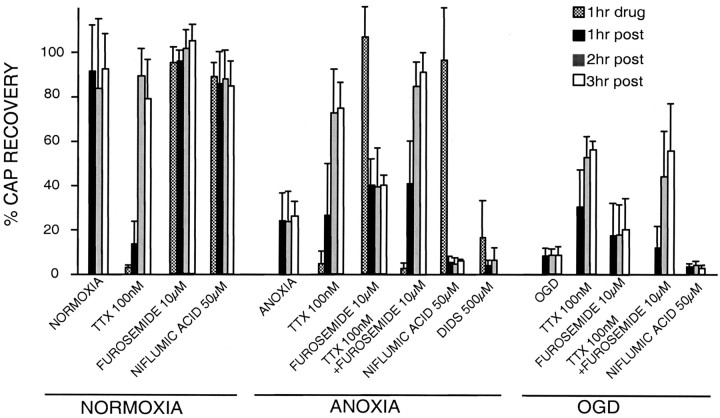
Quantitative effects of different pharmacological manipulations on CAP. Normoxia, TTX (100 nm) caused a reversible depression of CAP. Neither furosemide (10 μm)nor NFA (50 μm) had any effect on CAP during normoxia. Anoxia, A marked improvement of CAP was seen with TTX (100 nm) perfusion with a maximum recovery of 74 ± 12% at 3 hr after anoxia. KCC blockade allowed for 40 ± 4% recovery versus 26 ± 6% with anoxia (p < 0.01). This reflects the aberrant activity of the transporter during anoxia. DIDS (500 μm), on the other hand, because of its unspecific effect, caused depression of the CAP during normoxic application (16 ± 17%). After 2 hr of reoxygenation, the CAP recovered partially to only 6 ± 5%, which is far below the value observed with anoxia alone at this time point (23 ± 13%; p < 0.001; _n_= 8). The combination of Na+ channel and KCC blockade was the most effective manipulation in producing maximal recovery of CAP after anoxia (91 ± 9 vs 74 ± 12% TTX alone; p < 0.001; n = 11). On the other hand, Ca2+-activated Cl−-channel blockade caused a deterioration of the CAP with a recovery of 5 ± 2, 5 ± 2, and 6.0 ± 0.9% at 1, 2, and 3 hr after anoxia (p < 0.01;n = 6; at 3 hr reoxygenation vs anoxia alone). OGD, Under this paradigm, only 8 ± 3% of control CAP area was rescued when measured at 3 hr after OGD normoxic perfusion (n = 9). As with anoxia, a robust recovery was seen with Na+-channel blockade with TTX (100 nm) (56 ± 4 vs 8 ± 3% 3 hr reoxygenation;p < 0.01; n = 3). Similarly, KCC inhibition by furosemide (10 μm) recovered 20 ± 14% of control CAP area measured at 3 hr after OGD (p < 0.05; n = 9).
Previous reports have shown that axoplasmic Na+ overload, a primary event in the injury cascade, occurs mainly through TTX-sensitive channels during anoxia/ischemia and trauma (for review, see Stys, 1998). Nerves subjected to 1 hr of anoxia in the presence of TTX 100 nm(Fig. 6A) recovered to 74 ± 12% of control CAP area versus 26 ± 6% without TTX after 3 hr of reoxygenation and wash in TTX-free ACSF (p < 0.001; n = 12) (Figs.6A, 9). This prolonged wash period was necessary to maximize removal of the blocker, which was still incomplete (control CAPs recovered to only 80% after a similar exposure to TTX/wash period without anoxia). As expected with the more severe ischemic insult (1 hr of OGD) (Figs. 5B, 9), mean CAP area recovered to only 8 ± 3% of control. Nevertheless TTX (100 nm) partially rescued the nerves from ischemia as well (Figs. 6B, 9), allowing 56 ± 4% CAP area recovery after 3 hr of reperfusion/wash (p < 0.01; n = 3).
Fig. 6.
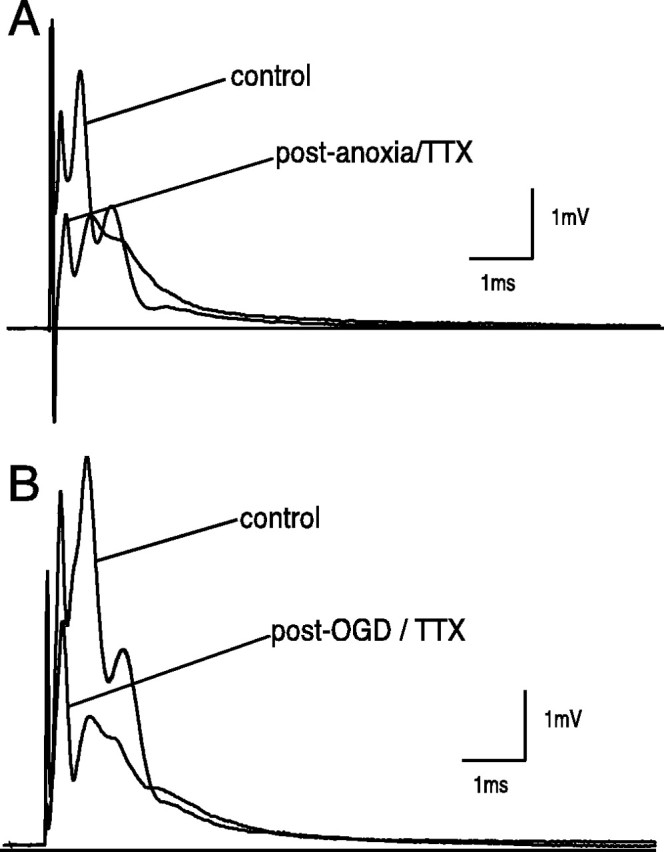
Effect of Na+-channel blockers on CAP recovery during either anoxia or OGD. A, TTX (100 nm) significantly improved recovery. A 1 hr pre-anoxic application abolished CAP. TTX was then continued for 30 min after anoxic insult of 60 min. CAP area recovered to 75 ± 12% (p < 0.001; n = 12) of control at the 3 hr post-anoxia mark. B, A 30 min pre-OGD application was continued for another 30 min after a 60 min OGD insult. CAP area recovered significantly to 56 ± 4% in comparison with OGD alone (8 ± 3%; p < 0.001; n = 3).
Anion transport blockade using 500 μm DIDS caused an irreversible depression of the CAP to 16 ± 17% after 1 hr normoxic perfusion (Figs. 7A,9). At 2 hr after anoxia, the CAP recovered to only 6 ± 5% (p < 0.001 vs anoxia; n = 8). Hence we could not assess the effect of DIDS on CAP (in contrast to_V_m). The effect of KCC inhibition on CAP recovery was assessed during normoxic, anoxic, and ischemic conditions. Furosemide (10 μm), a relatively specific KCC inhibitor at these concentrations (Alvarez-Leefmans, 1990; Jarolimek et al., 1999), had no effect on the control CAP (see Fig. 9). However, this blocker partially prevented anoxic (mean CAP area recovery 40 ± 4 vs 26 ± 6% without furosemide;p < 0.01; n = 8) (Figs. 7B,9) and ischemic (20 ± 14 vs 8 ± 3%; p < 0.05; n = 9) injury as measured by CAP area.
Fig. 7.
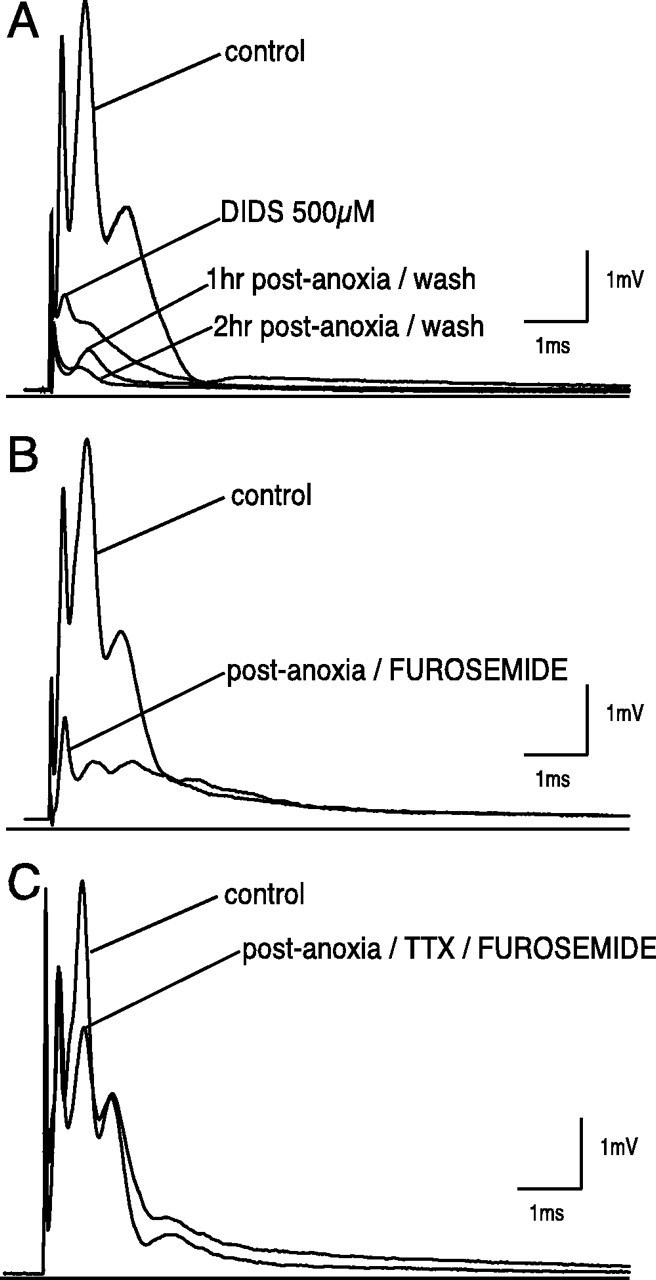
Effect of anion transport blockade on compound action potential during in vitro anoxia.A, DIDS (500 μm) applied for 1 hr during normoxic conditions and continued up to 30 min after anoxia caused a severe depression of CAP after a 1 hr normoxic drug application. Furthermore, CAP recovered to 6 ± 5% compared with 24 ± 13% at 2 hr after anoxia (p < 0.001 vs anoxia; n = 8). Such an effect is presumably caused by the interaction of DIDS with Na+ channel (Liu et al., 1998). B, Furosemide (10 μm) applied for 1 hr and also continued up to 30 min after anoxia had no effect on normoxic CAP but improved CAP area recovery to 40 ± 4% (p < 0.01 vs anoxia; _n_= 8). C, Effect of combined Na+-channel and K-Cl cotransport blockade on the compound action potential of the rat optic nerve during anoxia. TTX (100 nm) and furosemide (10 μm) was more protective than either agent alone (TTX + furosemide 91 ± 8% vs 74 ± 12% TTX alone; p < 0.001;n = 11).
The axoplasmic anoxia-induced Cl− loss observed only in the presence of Na+channel inhibition (Stys and LoPachin, 1998) suggests that a combination of Na+ channel and KCC blockade may be more protective than either agent alone. Mean CAP area recovery was significantly improved after anoxia after the addition of furosemide to TTX (Figs. 7C, 9), compared with TTX alone (91 ± 9 vs 74 ± 12% TTX alone; p < 0.001;_n_ = 11). Moreover, furosemide substantially normalized the shapes of the post-anoxic CAPs (see next section). However, this drug combination was not more effective in OGD, producing a recovery of only 50 ± 19% (vs 56 ± 4% in TTX alone; _n_= 14; _p_ > 0.05) (see Fig. 9).
Axoplasmic Ca2+ is known to increase during anoxia (Stys and LoPachin, 1998); thus it was of interest to study potential Ca2+-sensitive anion transporters such as the Ca2+-activated Cl− channel during anoxia/ischemia. Inhibition of Ca2+-activated Cl− channels with 50 μmniflumic acid (Scott et al., 1988; Currie et al., 1995), during 1 hr normoxic perfusion, caused a minor insignificant depression of the CAP. Niflumic acid unexpectedly worsened post-anoxic CAP recovery (6 ± 1 vs 26 ± 6% in ACSF alone; p < 0.001;n = 6) (Figs.8A,9), in contrast to KCC inhibition, which improved outcome (see above). Similarly, during in vitro ischemia, CAP recovery was also worse with niflumic acid treatment (3 ± 1 vs 8 ± 3% in ACSF alone;p < 0.01; n = 3) (Figs.8B, 9).
Fig. 8.
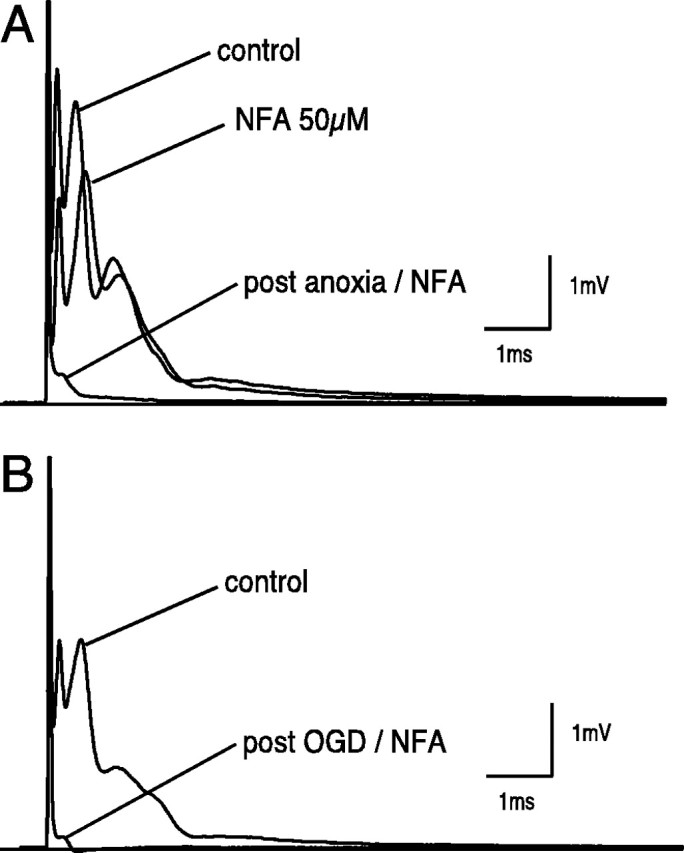
Evaluation of Ca2+-activated Cl− channel during in vitro anoxia and ischemia. A, Niflumic acid (NFA; 50 μm) caused a minor but statistically insignificant depression of normoxic CAP when perfused for 1 hr. NFA (50 μm) worsened CAP recovery compared with anoxia alone (6.0 ± 0.7 vs 26 ± 6% at 3 hr after anoxia;p < 0.01; n = 6).B, Similarly, with OGD, the recovery worsened to 3 ± 1 vs 8 ± 3% at 3 hr (p < 0.05;n = 3). These results suggest that niflumic acid-sensitive Cl− channels (e.g., Ca2+-activated or volume-regulated Cl− channels) may play a protective role during anoxic/ischemic conditions.
Compound action potential wave-shape recovery
Combined treatment with furosemide + TTX not only improved CAP area recovery after anoxia, but also appeared to significantly improve the shape of the response, which in part reflects the preservation of normal conduction velocities of the constituent fibers. To quantify these observations we devised a measure of the shape of the CAP compared with the control wave-shape before injury, independent of CAP magnitude. This “wave-shape fidelity index” was calculated by first normalizing the areas between the control CAP before injury and response after treatment, by scaling the smaller waveform so that areas are equal. Next a point-by-point squared difference was calculated between the two CAPs, and these squared differences averaged to yield a single numerical index. In mathematical terms:
where F is the “wave-shape fidelity index,”_w_0 and_w_1 are control and post-treatment CAP waveforms, respectively, _A_0 and_A_1 are control and post-treatment CAP areas, and n is the number of points in each waveform.
An index of zero denotes a post-treatment wave-shape that is identical to control, regardless of its size. An increasing index indicates a wave-shape that differs more and more from control (again independent of magnitude). Selected normalized waveforms are shown in Figure10A–D, and indices for various treatments are summarized in Fig 10E. Of the various treatments tested, combined application of TTX and furosemide was the most successful in restoring CAP shape after anoxic exposure; indeed, wave-shapes were not statistically different between this treatment group and time-matched normoxic controls, indicating that not only did this combination of drugs allow recovery of CAP area, but the configuration of the CAP was restored to near normal. This is in contrast to TTX alone, which was very effective at protecting CAP area but resulted in distorted wave-shapes reflected by a higher wave-shape fidelity index.
Fig. 10.
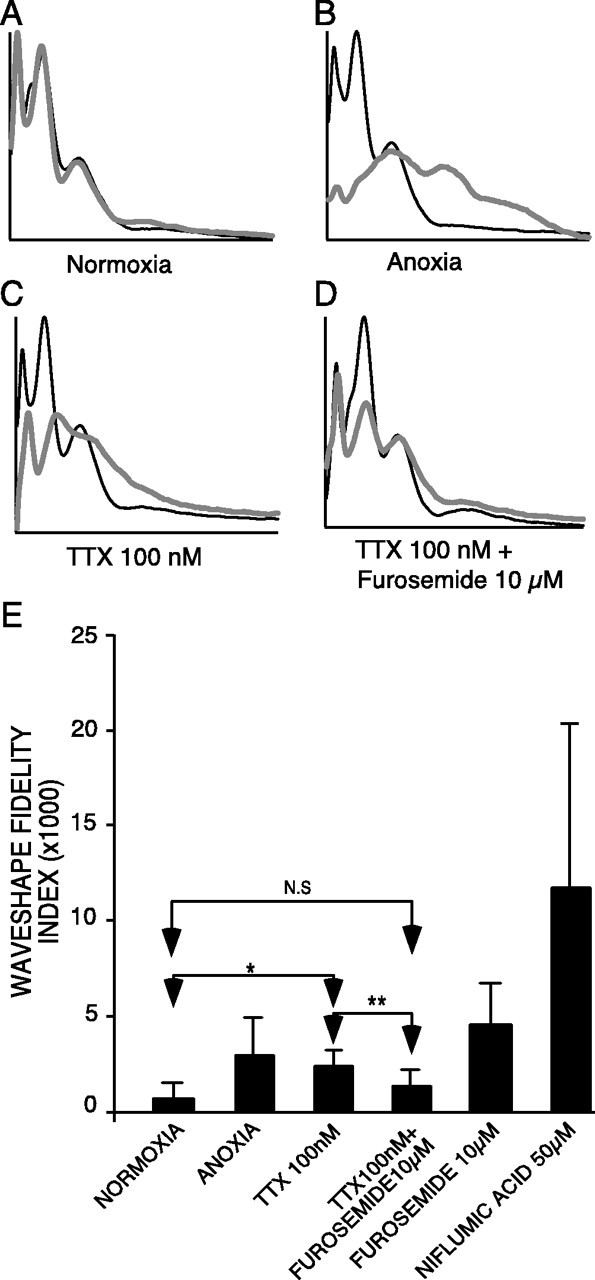
Panels A–D, Representative tracings (normalized with respect to CAP area) of normoxic, untreated anoxic, post-anoxic/washed nerves treated with TTX (100 nm) and TTX + furosemide (10 μm), respectively. Black and gray curves denote control and post-anoxic recordings, respectively. As expected with normoxia, there is very little change in the wave-shape over time; however, with anoxia/reoxygenation, the wave-shape becomes very distorted. TTX results in a significant recovery of CAP area, but the wave-shapes (particularly latencies of the slower peaks) remained significantly distorted. With addition of the KCC blocker furosemide, the wave-shape is improved further, and the fidelity index is not different from time-matched normoxic controls (p = 0.20). The peak latencies of the pre-anoxic and post-anoxic waves are similar, indicating a return of not only the number of fibers able to conduct, but also normalization of the conduction velocities of constituent fibers. E, Summary of wave-shape fidelity indices. The lowest index was obtained with time-matched normoxic controls indicating little change in wave-shape with control incubation. Although TTX provided a robust recovery of CAP area, the wave-shape remained noticeably distorted (prolonged peak 2 latency, absence of peak 3), reflected by an index approaching that for anoxic nerves alone (without TTX). In contrast, furosemide not only improved CAP area recovery but substantially improved wave-shapes as well, reducing the mean index to a value not different from normoxic controls. Niflumic acid worsened CAP area recovery and wave-shape distortion. *p < 0.05; **p < 0.01.
Immunolocalization of KCC
Figure 11 shows representative confocal microscopic images of rat optic nerve immunostained for different KCC isoforms. The red channel outlines axons stained with neurofilament, and green shows KCC stained with isoform-specific antibodies. Strong KCC3a signal was found on optic nerve astrocytes and their processes (Fig. 11A,B). Weaker KCC3a signal was found in the myelin of many larger axons (Fig.11A, inset).
Fig. 11.
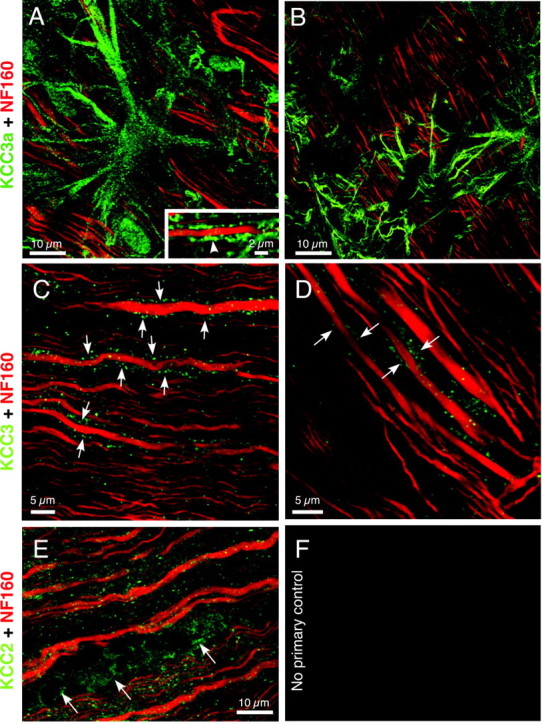
Laser scanning confocal micrographs showing immunohistochemical localization of different KCC isoforms (green) in rat optic nerve (axons stained with NF160 in red). A,B, There was strong KCC3a signal in astrocytes, and occasional signal in the myelin of larger axons (inset, arrowhead).C, D, Less intense but reproducible, often punctate, KCC3 signal was observed in the myelin sheath of larger axons. Because all axons are myelinated in mature optic nerve, fluorescence immediately adjacent to axon cylinders as seen here is consistently localized to the sheath rather than glial processes.E, KCC2 was clearly present in cell bodies of oligodendrocytes (arrows) and also diffusely in the optic nerve, including signal within axon cylinders (appearing as a more orange hue because of colocalization with red NF160 signal; compare with a more pure red neurofilament signal in the other panels). F, Controls with 1° antisera omitted were clean.
There was more modest but reproducible, often punctate, KCC3 signal in the myelin sheaths of larger axons (Fig. 11C,D). KCC2 appeared more widespread, with signal in cell bodies of oligodendrocytes, and also within axon cylinders (hence the orange hue in Fig. 11E, representing colocalization of green KCC2 fluorescence and red NF160). KCC1 staining was very weak, diffusely localized, and not consistently stronger than controls, so no conclusions about its presence or localization could be drawn (data not shown).
Discussion
In adult mammalian neurons, the Cl−gradient is influenced by a number of systems, including the KCC and NKCC cotransporters (for review, see Alvarez-Leefmans, 1990). KCC2, the neuronal isoform, appears to mainly extrude Cl− out of the cell (Payne et al., 1996). By lowering the internal [Cl−] during development, there is a switch in the GABA response from depolarizing to hyperpolarizing (Rivera et al., 1999). In immature rat optic nerve axons, a significant proportion of resting conductance depends on Cl− (Connors and Ransom, 1984). Indeed, three types of Cl− channels were found on myelinated peripheral Xenopus sciatic nerve axons by single channel recordings (Wu and Shrager, 1994), although direct evidence of such channels in CNS axons is lacking. Stys et al. (1997) showed that Cl− is not passively distributed but instead has a concentration significantly above its predicted passive level of 7 mm; resting axoplasmic [Cl−]iis in the range of 40–50 mm, indicating active accumulation into fibers, likely mediated at least in part by Na-K-2Cl cotransport that favors a predicted resting [Cl−]i of 55 mm (Stys et al., 1997) (Fig.12). Using immunohistochemistry,Alvarez-Leefmans et al. (2001) confirmed the presence of Na-K-2Cl cotransporter on the membranes of both axons and Schwann cells in peripheral nerves. Using in situ hybridization, others have demonstrated Na-K-2Cl cotransporter mRNA in both gray and white matter areas in rat CNS, indicating that this Cl− regulator appears widely distributed in the mammalian nervous system (Kanaka et al., 2001). In central axons, [Cl−] appears to be determined by a coordinated interplay of accumulating (e.g., Na-K-2Cl cotransport) systems passive and coupled efflux, mediated in part by channels and other Cl− regulatory pathways such as the KCC.
Fig. 12.
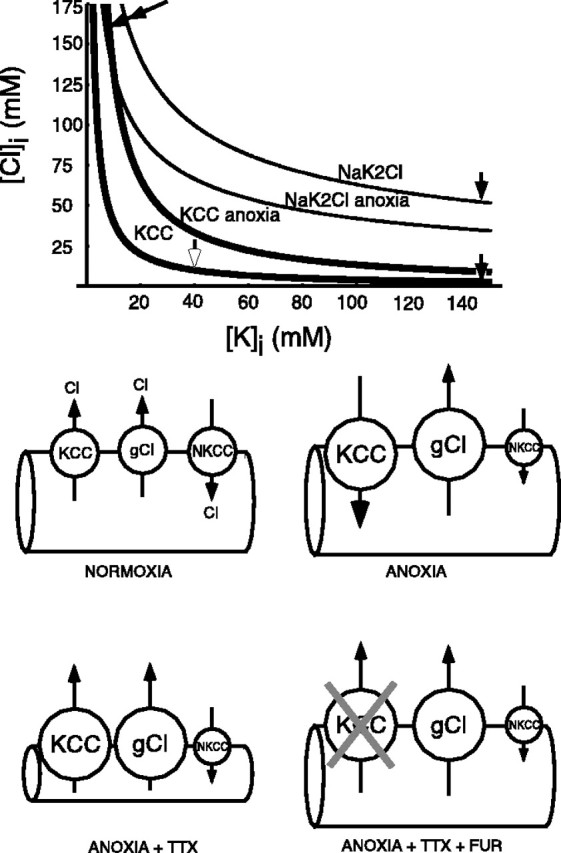
Graph shows calculated theoretical Cl−equilibrium concentrations that would be achieved by the KCC and Na-K-2Cl cotransport (NKCC) as a function of axoplasmic [K+] under various conditions. In normal axons, the high transmembrane K+ gradient favors a low [Cl−]i maintained by KCC and ∼55 mm Cl− by NKCC (solid arrows). During anoxia, with collapse of the K+ gradient, both KCC and NKCC will attempt to import Cl− to very high concentrations (double solid arrow). Anoxia in the presence of TTX sees residual K+i concentrated back up to ∼55 mm because of water loss, thereby maintaining the KCC in a Cl− efflux mode (open arrow). Bottom panels illustrate hypothetical Cl− fluxes in anoxic optic nerve axons under various conditions. i, In normal axons, an equilibrium between Cl− efflux (KCC and various Cl− channels) and influx (NKCC) maintains [Cl−] above what would be expected from passive distribution. ii, The collapse of the K+ gradient during anoxia will drive the KCC to accumulate Cl−, which is mostly compensated for by activation of Cl− channels; blocking these with niflumic acid worsens outcome (see Results). Na+ and K+ exchange across the axolemma in an electroneutral manner through various channels. The drop in ATP levels may reduce NKCC activity. iii, Blocking Na+ influx into anoxic axons with TTX prevents Na+ from entering; instead, electroneutrality is maintained by Cl− egress, through KCC [the loss of water concentrates axoplasmic Na+ such that KCC remains biased in the Cl−-efflux direction (open arrow, graph)] and Cl− channels (Cl−is also concentrated such that _E_Cl remains much more positive than the resting membrane potential favoring Cl− loss), resulting in shrinkage and mechanical disruption. iv, Addition of furosemide to block KCC reduces Cl− loss and tissue damage, possibly by helping preserve volume and mechanical integrity. Anoxic depolarization is also reduced, perhaps by decreasing K+ loss because of the lower capacity for electroneutral co-efflux of Cl− anions.
Previous studies on white matter anoxia, ischemia, and trauma established the importance of axonal Na+influx as a major event in the injury cascade (for review, see Stys, 1998). Our results agree with others whose general finding was that blockade of TTX-sensitive Na+ channels during injury was protective as assessed by electrophysiological, biochemical, and structural methods (Fern et al., 1993; Agrawal and Fehlings, 1996; Imaizumi et al., 1997; Leppanen and Stys, 1997; Teng and Wrathall, 1997; Jiang and Stys, 2000). The normal adult optic nerve CAP configuration arises from an ordered segregation of fiber conduction velocities, in turn dependent on fiber diameters and myelination in the maturing animal (Foster et al., 1982). One might expect the partially protective effects of TTX to be manifested in elements that possess substantial densities of Na+ channels, i.e., axons rather than glia or the myelin sheath. Ultrastructural examination of anoxic optic nerve suggests that glial damage may be attributable more to volume disruption rather than cytoskeletal dissolution as occurs in the axon cylinder (Waxman et al., 1994). This implies that volume changes in glial elements, potentially including the myelin sheath, may play an important role in causing serious alterations in fiber conduction velocities, which would adversely affect information coding in white matter tracts or result in complete propagation failure in fibers with more severely disrupted axo-glial architecture. Our immunolocalization data suggest that the KCC may contribute to such Cl−-dependent volume alterations under pathological conditions in both axons and glia and the myelin sheath (Fig. 11). Because Cl− has been shown to participate in various regulatory volume processes (for review, seeO'Neill, 1999), modulation of such pathways during injury might reduce such deleterious volume changes, helping to preserve normal conduction velocity distributions. In our study, the ability of furosemide to normalize CAP wave-shape after anoxia and ischemia is consistent with the idea that KCC mediates pathological Cl− flux; the resultant osmotic and water shifts are likely responsible for mechanical perturbation of subcellular architecture and disturbances of action potential propagation. We attempted to determine whether other Cl− transporters contributed to this process by applying DIDS, a broad-spectrum anion transport blocker. Unfortunately this compound caused a severe and irreversible depression of CAP amplitude, possibly because of its blocking effect on voltage-gated Na+ channels (Liu et al., 1998), so we were unable to assess any putative protective effect on CAP recovery. However, the incremental sparing of anoxic depolarization observed with DIDS compared with furosemide (both in the presence of TTX) (Fig. 4) suggests that additional anion transporters may play a role.
Under pathophysiological conditions such as anoxia/ischemia, [Cl−]i often increases in gray matter (Jiang et al., 1992; Taylor et al., 1999). Moreover, CA1 pyramidal cells subjected to hypoxia displayed a delayed hypoxic depolarization in the presence of Cl− transport inhibitors (Muller, 2000). Figure 12 summarizes theoretical calculations of equilibrium Cl− concentrations under normal and anoxic conditions on the basis of data from optic nerve (Stys et al., 1997). Under normal conditions (Fig. 12, single solid arrowheads), KCC attempts to maintain [Cl−]i at low levels, well below 10 mm, whereas Na-K-2Cl cotransport will accumulate Cl− toward an equilibrium concentration of ≈55 mm. Actual resting axonal [Cl−] lies between these two values, reflecting a balance between these two opposing Cl− transport systems. During anoxia, with a significant reduction of [K+]i (LoPachin and Stys, 1995; Stys and LoPachin, 1998) and a parallel rise in [K+]o (Ransom et al., 1992), both transporters will be biased toward strong Cl− accumulation (Fig. 12, double arrow) and likely cause significant cellular volume deregulation. Surprisingly, in contrast to gray matter, there is little change in axonal or glial [Cl−]i in anoxic white matter (LoPachin and Stys, 1995; Stys and LoPachin, 1998). One Cl− efflux mechanism that may have compensated for such expected Cl−accumulation is the opening of a Cl−channel, such as Cl−Ca (for review, see Scott et al., 1995; Frings et al., 2000). Calculations (LoPachin and Stys, 1995) reveal that axonal _V_mremains more negative than _E_Cl, even at the end of a 60 min anoxic insult (Fig. 1) (axonal_V_m ≈ −44 mV vs_E_Cl ≈ −30 mV). Glial_V_m is also estimated to be more negative than _E_Cl. This indicates that Cl− flux through an uncoupled transporter such as a channel would be continuously directed outward. For this reason, Cl−Ca would be well poised to serve as a compensatory system because a rise in free [Ca2+] will almost always be a feature of a pathological state such as anoxia/ischemia. Consistent with this hypothesis was the finding of Duchen (1990) who showed an enhancement of Cl−Ca current during anoxia in DRG neurons. This would also explain the deleterious effects of Cl−Cachannel inhibition by niflumic acid, which likely hindered the ability of the optic nerve to compensate for an abnormal influx of Cl− through coupled transporters, as assessed by CAP area recovery (Figs. 8, 9) and wave-shape (Fig. 10). Other types of Cl− channels blocked by niflumic acid such as volume-regulated channels (Leaney et al., 1997) could also participate in this mechanism.
Stys and LoPachin (1998) suggested that KCl cotransport may act as a parallel pathway for K+ and Cl− loss during anoxia during concomitant Na+ channel blockade. Under these conditions, axonal volume was noted to decrease markedly (Waxman et al., 1994) along with water content (LoPachin and Stys, 1995; Stys and LoPachin, 1998). With the major Na+ influx route blocked by TTX, it is likely that ionic rundown may switch from Na+-K+exchange to a parallel efflux of K+ and Cl− (and likely other anions); both modes will maintain electroneutrality, but in contrast, the latter will drag water out of the cytosol, causing cell shrinkage and possibly mechanical damage (Waxman et al., 1994). Because the water loss will substantially concentrate remaining intracellular ions (axoplasmic [K+] estimated at ∼55 mmat the end of 60 min of anoxia in TTX-treated optic nerves vs ∼15 mm in untreated anoxic nerves), despite a loss of 90% of total axoplasmic K+ under both conditions (LoPachin and Stys, 1995; Stys and LoPachin, 1998), the KCC will remain biased in the Cl− efflux mode (Fig. 12, open arrowhead) and would be positioned to remove K+ and Cl−from the cytoplasm. Indeed, whereas the Na-K-2Cl cotransporter would attempt to accumulate Cl− back into cells under such conditions, its activity will be reduced by a fall in ATP levels (Russell, 2000), whereas an ATP decrease will activate KCC (Ortiz-Carranza et al., 1996); therefore under anoxic conditions the transport rate of the Na-K-2Cl cotransporter may be greatly diminished, unmasking the KCC- and Cl−channel-mediated Cl− extrusion, precisely what is observed with direct axonal [Cl−] measurements (Stys and LoPachin, 1998). This scenario might explain why blocking KCC with furosemide was protective during anoxia: with concomitant Na+ channel blockade, KCC inhibition reduced the excessive Cl− export while decreasing abnormal Cl− influx under conditions in which Na+ channels were not blocked. Therefore, excessive Cl−movements in either direction may have deleterious effects on volume regulation resulting in mechanical injury. These findings may have implications for the design of neuroprotective strategies, whereby concomitant inhibition of Na+ channels and KCC could result in better outcome than with blockade of either pathway alone.
Footnotes
This work was supported in part by National Institute of Neurological Disorders and Stroke Grant R01 NS40087-01. S.A.M. is supported by a studentship from the Ontario Neurotrauma Foundation. P.K.S. is supported by a Career Investigator Award from the Heart and Stroke Foundation of Ontario.
Correspondence should be addressed to Dr. Peter K. Stys, Ottawa Health Research Institute, Division of Neuroscience, 725 Parkdale Avenue, Ottawa, Ontario, Canada K1Y 4K9. E-mail:pstys@ohri.ca.
References
- 1.Agrawal SK, Fehlings MF. Mechanisms of secondary injury to spinal cord axons in vitro: role of Na+, Na+-K+-ATPase, the Na+-H+ exchanger, and the Na+-Ca2+ exchanger. J Neurosci. 1996;16:545–552. doi: 10.1523/JNEUROSCI.16-02-00545.1996. [DOI] [PMC free article] [PubMed] [Google Scholar]
- 2.Alvarez-Leefmans FJ. Intracellular Cl− regulation and synaptic inhibition in vertebrate and invertebrate neurons. In: Alvarez-Leefmans FJ, Russell JM, editors. Chloride channels and carriers in nerve, muscle and glia. Plenum; New York: 1990. pp. 109–158. [Google Scholar]
- 3.Alvarez-Leefmans FJ, Leon-Olea M, Mendoza-Sotelo J, Alvarez FJ, Anton B, Garduno R. Immunolocalization of the Na-K-Cl cotransporter in peripheral nervous tissue of vertebrates. Neuroscience. 2001;104:569–582. doi: 10.1016/s0306-4522(01)00091-4. [DOI] [PubMed] [Google Scholar]
- 4.Cabantchik ZI, Greger R. Chemical probes for anion transporters of mammalian cell membranes. Am J Physiol. 1992;262:C803–827. doi: 10.1152/ajpcell.1992.262.4.C803. [DOI] [PubMed] [Google Scholar]
- 5.Clark S, Jordt SE, Jentsch TJ, Mathie A. Characterization of the hyperpolarization-activated chloride current in dissociated rat sympathetic neurons. J Physiol (Lond) 1998;506:665–678. doi: 10.1111/j.1469-7793.1998.665bv.x. [DOI] [PMC free article] [PubMed] [Google Scholar]
- 6.Connors BW, Ransom BR. Chloride conductance and extracellular potassium concentration interact to modify the excitability of rat optic nerve fibers. J Physiol (Lond) 1984;355:619–633. doi: 10.1113/jphysiol.1984.sp015442. [DOI] [PMC free article] [PubMed] [Google Scholar]
- 7.Currie KP, Wootton JF, Scott RH. Activation of Ca2+-dependent Cl− currents in cultured rat sensory neurons by flash photolysis of DM-nitrophen. J Physiol (Lond) 1995;482:291–307. doi: 10.1113/jphysiol.1995.sp020518. [DOI] [PMC free article] [PubMed] [Google Scholar]
- 8.Duchen MR. Effects of metabolic inhibition on the membrane properties of isolated mouse primary sensory neurones. J Physiol (Lond) 1990;424:387–409. doi: 10.1113/jphysiol.1990.sp018073. [DOI] [PMC free article] [PubMed] [Google Scholar]
- 9.Estevez AY, O'Regan MH, Song D, Phillis JW. Effects of anion channel blockers on hyposmotically induced amino acid release from the in vivo rat cerebral cortex. Neurochem Res. 1999;24:447–452. doi: 10.1023/a:1020902104056. [DOI] [PubMed] [Google Scholar]
- 10.Fern R, Ransom BR, Stys PK, Waxman SG. Pharmacological protection of CNS white matter during anoxia: actions of phenytoin, carbamazepine and diazepam. J Pharmacol Exp Ther. 1993;266:1549–1555. [PubMed] [Google Scholar]
- 11.Foster RE, Connors BW, Waxman SG. Rat optic nerve: electrophysiological, pharmacological and anatomical studies during development. Brain Res. 1982;3:371–386. doi: 10.1016/0165-3806(82)90005-0. [DOI] [PubMed] [Google Scholar]
- 12.Frings S, Reuter D, Kleene SJ. Neuronal Ca2+-activated Cl− channels-homing in on an elusive channel species. Prog Neurobiol. 2000;60:247–289. doi: 10.1016/s0301-0082(99)00027-1. [DOI] [PubMed] [Google Scholar]
- 13.Gillen CM, Brill S, Payne JA, Forbush B. Molecular cloning and functional expression of the K-Cl cotransporter from rabbit, rat, and human: a new member of the cation-chloride cotransporter family. J Biol Chem. 1996;271:16237–16244. doi: 10.1074/jbc.271.27.16237. [DOI] [PubMed] [Google Scholar]
- 14.Imaizumi T, Kocsis JD, Waxman SG. Anoxic injury in the rat spinal cord: pharmacological evidence for multiple steps in Ca2+-dependent injury of the dorsal columns. J Neurotrauma. 1997;14:299–311. doi: 10.1089/neu.1997.14.299. [DOI] [PubMed] [Google Scholar]
- 15.Jarolimek W, Lewen A, Misgeld U. A furosemide-sensitive K+-Cl− cotransporter counteracts intracellular Cl− accumulation and depletion in cultured rat midbrain neurons. J Neurosci. 1999;19:4695–4704. doi: 10.1523/JNEUROSCI.19-12-04695.1999. [DOI] [PMC free article] [PubMed] [Google Scholar]
- 16.Jiang C, Agulian S, Haddad GG. Cl− and Na+ homeostasis during anoxia in rat hypoglossal neurons: intracellular and extracellular in vitro studies. J Physiol (Lond) 1992;448:697–708. doi: 10.1113/jphysiol.1992.sp019065. [DOI] [PMC free article] [PubMed] [Google Scholar]
- 17.Jiang Q, Stys PK. Calpain inhibitors confer biochemical, but not electrophysiological, protection against anoxia in rat optic nerves. J Neurochem. 2000;74:2101–2107. doi: 10.1046/j.1471-4159.2000.0742101.x. [DOI] [PubMed] [Google Scholar]
- 18.Kaila K. Ionic basis of GABAA receptor channel function in nervous system. Prog Neurobiol. 1994;42:489–537. doi: 10.1016/0301-0082(94)90049-3. [DOI] [PubMed] [Google Scholar]
- 19.Kanaka C, Ohno K, Okabe A, Kuriyama K, Itoh T, Fukuda A, Sato K. The differential expression patterns of messenger RNAs encoding K-Cl cotransporter (KCC1, 2) and Na-K-2Cl cotransporter (NKCC1) in the rat nervous system. Neuroscience. 2001;104:933–946. doi: 10.1016/s0306-4522(01)00149-x. [DOI] [PubMed] [Google Scholar]
- 20.Kauppinen RA, Nicholls DG. Failure to maintain glycolysis in anoxic nerve terminals. J Neurochem. 1986;47:1864–1869. doi: 10.1111/j.1471-4159.1986.tb13100.x. [DOI] [PubMed] [Google Scholar]
- 21.Leaney JL, Marsh SJ, Brown DA. A swelling-activated chloride current in rat sympathetic neurones. J Physiol (Lond) 1997;501:555–564. doi: 10.1111/j.1469-7793.1997.555bm.x. [DOI] [PMC free article] [PubMed] [Google Scholar]
- 22.Leppanen L, Stys PK. Ion transport and membrane potential in CNS myelinated axons. II. Effects of metabolic inhibition. J Neurophysiol. 1997;78:2095–2107. doi: 10.1152/jn.1997.78.4.2095. [DOI] [PubMed] [Google Scholar]
- 23.Liu J, Lai ZF, Wang XD, Tokutomi N, Nishi K. Inhibition of sodium current by chloride channel blocker 4, 4′-diisothiocyanatostilbene-2, 2′-disulfonic acid (DIDS) in guinea pig cardiac ventricular cells. J Cardiovasc Pharmacol. 1998;31:558–567. doi: 10.1097/00005344-199804000-00014. [DOI] [PubMed] [Google Scholar]
- 24.LoPachin RM, Jr, Stys PK. Elemental composition and water content of rat optic nerve myelinated axons and glial cells: effects of in vitro anoxia and reoxygenation. J Neurosci. 1995;15:6735–6746. doi: 10.1523/JNEUROSCI.15-10-06735.1995. [DOI] [PMC free article] [PubMed] [Google Scholar]
- 25.Mount DB, Mercado A, Song L, Xu J, George AL, Jr, Delpire E, Gamba G. Cloning and characterization of KCC3 and KCC4, new members of the cation-chloride cotransporter gene family. J Biol Chem. 1999;274:16355–16362. doi: 10.1074/jbc.274.23.16355. [DOI] [PubMed] [Google Scholar]
- 26.Muller M. Effects of chloride transport inhibition and chloride substitution on neuron function and on hypoxic spreading-depression-like depolarization in rat hippocampal slices. Neuroscience. 2000;97:33–45. doi: 10.1016/s0306-4522(00)00025-7. [DOI] [PubMed] [Google Scholar]
- 27.O'Neill WC. Physiological significance of volume-regulatory transporters. Am J Physiol. 1999;276:C995–C1011. doi: 10.1152/ajpcell.1999.276.5.C995. [DOI] [PubMed] [Google Scholar]
- 28.Ortiz-Carranza O, Adragna NC, Lauf PK. Modulation of K-Cl cotransport in volume-clamped low-K sheep erythrocytes by pH, magnesium and ATP. Am J Physiol. 1996;271:C1049–1058. doi: 10.1152/ajpcell.1996.271.4.C1049. [DOI] [PubMed] [Google Scholar]
- 29.Payne JA. Functional characterization of the neuronal-specific K-Cl cotransporter: implications for [K+]o regulation. Am J Physiol. 1997;273:C1516–C1525. doi: 10.1152/ajpcell.1997.273.5.C1516. [DOI] [PubMed] [Google Scholar]
- 30.Payne JA, Stevensen TJ, Donaldson LF. Molecular characterization of a putative K-Cl cotransporter in rat brain. A neuronal-specific isoform. J Biol Chem. 1996;271:16245–16252. doi: 10.1074/jbc.271.27.16245. [DOI] [PubMed] [Google Scholar]
- 31.Pearson MM, Lu J, Mount DB, Delpire E. Expression of KCl cotransporter (KCC3) in the central nervous system: concurrence with myelination. FASEB J. 2000;14:A351. [Google Scholar]
- 32.Pearson MM, Lu J, Mount DB, Delpire E. Localization of the KCl cotransporter KCC3 in the central and peripheral nervous systems: expression in the choroids plexus, large neurons and white matter tracts. Neuroscience. 2001;103:481–491. doi: 10.1016/s0306-4522(00)00567-4. [DOI] [PubMed] [Google Scholar]
- 33.Ransom BR, Walz W, Davis PK, Carlini WG. Anoxia-induced changes in extracellular K+ and pH in mammalian central white matter. J Cereb Blood Flow Metab. 1992;12:593–602. doi: 10.1038/jcbfm.1992.83. [DOI] [PubMed] [Google Scholar]
- 34.Rivera C, Voipio J, Payne JA, Ruusuvuori E, Lahtinen H, Lamsa K, Pirvola U, Saarma M, Kaila K. The K-Cl co-transporter KCC2 renders GABA hyperpolarizing during neuronal maturation. Nature. 1999;397:251–255. doi: 10.1038/16697. [DOI] [PubMed] [Google Scholar]
- 35.Russell JM. Sodium-potassium-chloride cotransport. Physiol Rev. 2000;80:211–276. doi: 10.1152/physrev.2000.80.1.211. [DOI] [PubMed] [Google Scholar]
- 36.Sabri MI, Ochs S. Inhibition of glyceraldehyde-3-phosphate dehydrogenase in mammalian nerve iodoacetic acid. J Neurochem. 1971;18:1509–1514. doi: 10.1111/j.1471-4159.1971.tb00013.x. [DOI] [PubMed] [Google Scholar]
- 37.Sakai S, Tosaka T. Analysis of hyposmolarity-induced taurine efflux pathways in the bullfrog sympathetic ganglia. Neurochem Int. 1999;34:203–212. doi: 10.1016/s0197-0186(99)00004-2. [DOI] [PubMed] [Google Scholar]
- 38.Scott RH, Mcguirk SM, Dolphin AC. Modulation of divalent cation-activated chloride ion currents. Br J Pharmacol. 1988;94:653–662. doi: 10.1111/j.1476-5381.1988.tb11572.x. [DOI] [PMC free article] [PubMed] [Google Scholar]
- 39.Scott RH, Sutton KG, Griffin A, Stapleton SR, Currie KP. Aspects of calcium-activated chloride currents: a neuronal perspective. Pharmacol Ther. 1995;66:535–565. doi: 10.1016/0163-7258(95)00018-c. [DOI] [PubMed] [Google Scholar]
- 40.Stämpfli R. A new method for measuring membrane potentials with external electrodes. Experientia. 1954;10:508–509. doi: 10.1007/BF02166189. [DOI] [PubMed] [Google Scholar]
- 41.Stys PK. Anoxic and ischemic injury of myelinated axons in CNS white matter: from mechanistic concepts to therapeutics. J Cereb Blood Flow Metab. 1998;18:2–25. doi: 10.1097/00004647-199801000-00002. [DOI] [PubMed] [Google Scholar]
- 42.Stys PK, LoPachin RM. Mechanisms of calcium and sodium fluxes in anoxic myelinated central nervous system axons. Neuroscience. 1998;82:21–32. doi: 10.1016/s0306-4522(97)00230-3. [DOI] [PubMed] [Google Scholar]
- 43.Stys PK, Ransom BR, Waxman SG. Compound action potential of nerve recorded by suction electrode: a theoretical and experimental analysis. Brain Res. 1991;546:18–32. doi: 10.1016/0006-8993(91)91154-s. [DOI] [PubMed] [Google Scholar]
- 44.Stys PK, Waxman SG, Ransom BR. Ionic mechanisms of anoxic injury in mammalian CNS white matter: role of Na+-channels and Na+-Ca2+ exchanger. J Neurosci. 1992;12:430–439. doi: 10.1523/JNEUROSCI.12-02-00430.1992. [DOI] [PMC free article] [PubMed] [Google Scholar]
- 45.Stys PK, Sontheimer H, Ransom BR, Waxman SG. Noninactivating, tetrodotoxin-sensitive Na+ conductance in rat optic nerve axons. Proc Natl Acad Sci USA. 1993;90:6976–6980. doi: 10.1073/pnas.90.15.6976. [DOI] [PMC free article] [PubMed] [Google Scholar]
- 46.Stys PK, Lehning E, Saubermann AJ, LoPachin RM., Jr Intracellular concentrations of major ions in rat myelinated axons and glia: calculations on the basis of electron probe x-ray microanalyses. J Neurochem. 1997;68:1920–1928. doi: 10.1046/j.1471-4159.1997.68051920.x. [DOI] [PubMed] [Google Scholar]
- 47.Tadic V. The in vivo effects of cyanide and its antidotes on rat brain cytochrome oxidase activity. Toxicology. 1992;76:59–67. doi: 10.1016/0300-483x(92)90018-a. [DOI] [PubMed] [Google Scholar]
- 48.Taylor CP, Weber ML, Gaughan CL, Lehning EJ, LoPachin RM. Oxygen/glucose deprivation in hippocampal slices: altered intraneuronal elemental composition predicts structural and functional damage. J Neurosci. 1999;19:619–629. doi: 10.1523/JNEUROSCI.19-02-00619.1999. [DOI] [PMC free article] [PubMed] [Google Scholar]
- 49.Teng YD, Wrathall JR. Local blockade of sodium channels by tetrodotoxin ameliorates tissue loss and long-term functional deficits resulting from experimental spinal cord injury. J Neurosci. 1997;17:4359–4366. doi: 10.1523/JNEUROSCI.17-11-04359.1997. [DOI] [PMC free article] [PubMed] [Google Scholar]
- 50.Waxman SG, Black JA, Ransom BR, Stys PK. Anoxic injury of rat optic nerve: ultrastructural evidence for coupling between Na+ influx and Ca2+-mediated injury in myelinated CNS axons. Brain Res. 1994;644:197–204. doi: 10.1016/0006-8993(94)91680-2. [DOI] [PubMed] [Google Scholar]
- 51.Wu JV, Shrager P. Resolving three types of chloride channels in demyelinated Xenopus axons. J Neurosci Res. 1994;38:613–620. doi: 10.1002/jnr.490380603. [DOI] [PubMed] [Google Scholar]
