Synaptic Vesicle Depletion Correlates with Attenuated Synaptic Responses to Prolonged Repetitive Stimulation in Mice Lacking α-Synuclein (original) (raw)
Abstract
Although the mutation of α-synuclein, a protein associated with presynaptic vesicles, is implicated in the etiology and pathogenesis of Parkinson's disease, the biological function of the normal protein is unknown. Mice that lack α-synuclein have been generated by homologous recombination in embryonic stem cells. Electron microscopic examination of hippocampal synapses revealed a striking selective deficiency of undocked vesicles without affecting docked vesicles. Field recording of CA1 synapses in hippocampal slices from the mutant mice demonstrated normal basal synaptic transmission, paired-pulse facilitation, and response to a brief train of high-frequency stimulation (100 Hz, 40 pulses) that exhausts only docked vesicles. In contrast, the α-synuclein knock-out mice exhibited significant impairments in synaptic response to a prolonged train of repetitive stimulation (12.5 Hz, 300 pulses) capable of depleting docked as well as reserve pool vesicles. Moreover, the replenishment of the docked vesicles by reserve pool vesicles after depletion was slower in the mutant synapses. Thus, α-synuclein may be required for the genesis and/or maintenance of a subset of presynaptic vesicles, those in the “reserve” or “resting” pools. These results reveal, for the first time, the normal function of endogenous α-synuclein in regulating synaptic vesicle mobilization at nerve terminals.
Keywords: α-synuclein, genetically engineered mice, docked synaptic vesicles, reserve pool, readily releasable pool, hippocampus, amphetamine sensitivity
α-Synuclein is an abundant presynaptic protein that was first implicated in Parkinson's disease (PD) when mutations were discovered in autosomal dominant PD families (Polymeropoulos et al., 1997; Kruger et al., 1998). Interest in α-synuclein accelerated when it was found to be a major component of Lewy bodies, the intracellular aggregates found in all PD (Spillantini et al., 1997), as well as in inclusion bodies in other neurological disorders, now referred to as “synucleinopathies” (Spillantini et al., 1997; Mezey et al., 1998).
The normal function of α-synuclein is unknown. Although it is a disordered random coil in solution, α-synuclein takes on an α-helical structure on exposure to acidic phospholipid vesicles (Davidson et al., 1998). The protein associates with fatty acids and lipids in vitro (Sharon et al., 2001), with presynaptic vesicle membranes in vivo (Clayton and George, 1999) and with the dopamine (DA) transporter (Lee et al., 2001). In a recently published study of the phenotype of mice carrying a knock-out of the_Snca_ gene (Abeliovich et al., 2000), brain development and neuronal architecture, including the synapse, appeared normal and synaptic vesicle pools were reportedly normal, whereas some functional abnormalities in the dopaminergic system were found. In striatal brain slices, DA release and reuptake after either single pulses or a short train of 10 pulses at 20 Hz was not altered in the knock-out mice. However, the mutant mice did demonstrate a more rapid recovery of dopamine release after the second pulse in a paired stimulus depression (PSD) paradigm. Whole animal behavioral studies were consistent with this observation in that Snca knock-out mice showed blunting of the increase in locomotor activity induced by amphetamines compared with what is seen with wild-type mice. The authors suggested that α-synuclein may normally act to regulate the readily releasable pool of DA-containing vesicles negatively.
Murphy et al. (2000) performed an ultrastructural study of synaptic vesicles in fetal rat hippocampal cultures in which α-synuclein expression was reduced by 50% using antisense oligonucleotides. There was a striking reduction in the number of vesicles in the vesicle cluster, but not in the docked pool of vesicles (nomenclature afterSüdhof, 2000). The levels of two synaptic vesicle proteins, synaptophysin and synapsin I, were also reduced, whereas a third, synaptobrevin, showed no reduction.
We generated mice deficient in α-synuclein by partially deleting the_Snca_ gene in embryonal stem cells. Electron microscopy of hippocampal sections and cultured hippocampal neurons showed a marked decrease in the pool of undocked synaptic vesicles in mice homozygous for the mutation. Consistent with the ultrastructural change, electrophysiological analysis revealed that synaptic responses to brief high-frequency stimuli, sufficient to exhaust docked synaptic vesicles, were similar in mutant and wild-type mice. In contrast, synaptic responses to prolonged, lower-frequency stimulation that would be expected to deplete reserve vesicle pools were significantly impaired in the mutant compared with the wild-type mice. These results support the hypothesis that α-synuclein is required for the genesis, localization, and/or maintenance of at least some subset of vesicles that make up the reserve or resting pools of presynaptic vesicles.
MATERIALS AND METHODS
Generation of Snca knock-out mice. A mouse genomic bacterial artificial chromosome library constructed from strain 129/SvEvTac was screened for Snca using a mouse α-synuclein cDNA sequence from the 3′ end. Gene structure was determined by restriction analysis, Southern blotting, and sequencing (Touchman et al., 2001). A targeting vector was constructed to replace exons 4 and 5 with the aminoglycoside phosphotransferase gene (Neo) conferring neomycin resistance, transcribed in the opposite orientation to Snca (see Fig. 1a). Embryonic stem (ES) cell colonies resistant to the aminoglycoside G418 were screened by Southern blotting to identify correctly targeted cell clones, two of which were then used for blastocyst injections to establish two lines of mice. Because both mouse lines exhibited normal development and were indistinguishable in their phenotype, all additional experiments used mice derived from one of the ES cell clones maintained on an inbred 129/SvEvTac background. Genomic DNA was isolated from tail biopsies by standard methods (Miller et al., 1988). Routine genotyping was performed by PCR, using primers for Neo (Neo1: GATTGCACGCAGGTTCTCCG; Neo 2: CCAACGCTATGTCCTGATAG) and the deleted region of Snca (wild-type forward, GGGTATTGAATGGCTGCATCAGAG; wild-type reverse, CACCAGCCTATCCAGGTTGAGTTC).
Fig. 1.
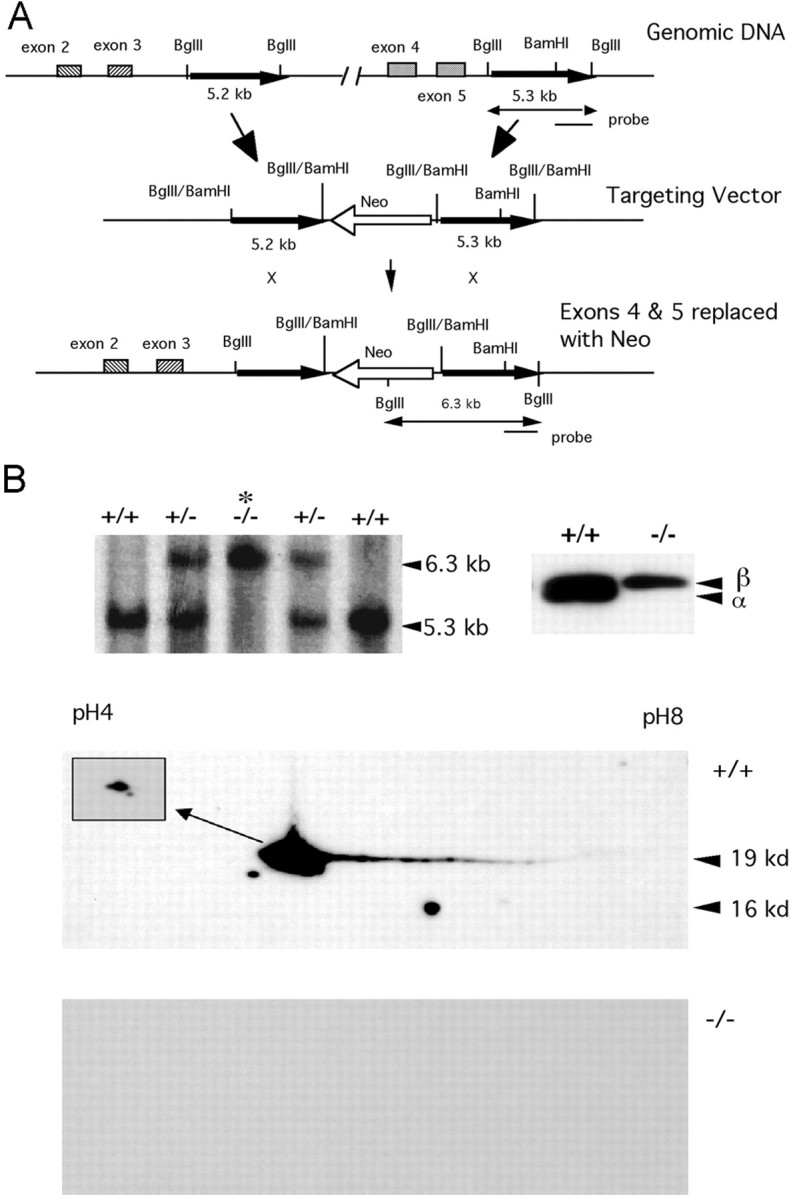
Generation of α-synuclein null mice.A, A targeting vector was constructed to replace_Snca_ exons 4 and 5 with Neo. B, Proper targeting was assessed by Southern blotting of genomic DNAs digested with Bgl_II. b, Top left,Genomic Southern blot hybridization of Bgl_II-digested genomic DNAs from a heterozygote intercross. All possible genotypes are seen. c, Top right, Western blot of brain homogenates from Snca +/+ and_Snca−/− mice, using a polyclonal antibody that recognizes both α- and β-synuclein. A doublet in the_Snca+/+ lane shows both α- and β-synuclein, whereas homozygous_Snca−/− mice lack α-synuclein.Bottom, Western blot of total brain protein separated by two-dimensional PAGE and probed using a monoclonal antibody specific for α-synuclein. The top panel, from a wild-type (Snca+/+) mouse, demonstrates a number of isoforms of α-synuclein that differ slightly in isoelectric focus pI and molecular weight. All isoforms are missing in the_Snca−/− mouse, indicating that the deletion allele eliminates expression of all protein isoforms of α-synuclein.
Western blot analysis. The presence of α-synuclein was assayed by Western blotting using a polyclonal antibody against the 12 C-terminal-most amino acids (Mezey et al., 1998). This antibody recognizes both α- and β-synuclein, which were resolved by SDS-PAGE using 15% acrylamide gels. Mouse brains were homogenized in 50 mm Tris-HCl, pH 7.5, 150 mmNaCl, 0.1% SDS, 1.0% Nonidet P-40, 1 μg/ml aprotinin, 2 μg/ml leupeptin, and 100 μg/ml PMSF, centrifuged to remove particulates, and total protein was determined by the Bio-Rad (Hercules, CA) Protein Assay. SDS-PAGE used 30 μg of protein.
Two-dimensional electrophoresis was performed according to the method of O'Farrell (1975) by Kendrick Labs Inc. (Madison, WI), using 2% pH 4–8 ampholines for isoelectric focusing and 10% PAGE. Two hundred micrograms of total brain protein from normal and mutant mice were separated and transferred to polyvinylidene difluoride membrane; Western analysis (Harlow and Lane, 1988) was performed using an α-synuclein-specific antibody (Transduction Laboratories, Lexington, KY). Detection was with horseradish peroxidase (HRP)–labeled secondary antibodies and development by enhanced chemiluminescence (Amersham Biosciences, Chicago, IL).
Synaptosomes were prepared by methods published previously (Marquez-Sterling et al., 1997). For Western blot analysis, an equal amount (10 μg) of synaptosomal protein or 30 μg of a postnuclear supernatant (600 × g, 6 min) from cultured hippocampal neurons were loaded per lane from _Snca+/+_and _Snca_−/− mice. Antibodies against synapsin I, synaptophysin, synaptotagmin, rab3a, and amphiphysin were from Stressgen (Victoria, BC, Canada), antibody against vesicle-associated membrane protein-2 (VAMP-2) and synaptosomal-associated protein-25 (SNAP-25) were from Santa Cruz Biotechnology (Santa Cruz, CA), antibody against flotillin was from Transduction Laboratories, and antibody against SV2 was from the American Type Culture Collection (Manassas, VA). For quantitative Western blotting, we determined the linear range of film exposed by chemiluminescence by generating a standard curve using recombinant α-synuclein purified according to the methods of Jakes et al. (1994). Dilutions of α-synuclein were separated by SDS-PAGE and immunoblotted with the antisynuclein antibody 202 (Zymed, San Francisco, CA). Band intensities were digitized and quantified by densitometry and ImageQuant software (Molecular Dynamics, Sunnyvale, CA). Brains from two Snca+/+ (control) mice were pooled and used as a source of purified synaptosomes; a similar synaptosomal preparation was made from two_Snca_−/− mice. Aliquots (10, 7.5, and 5 μg) from each of the two synaptosomal preparations were separated by SDS-PAGE and immunoblotted with antibodies to the synaptic markers synaptotagmin, VAMP2, amphiphysin, SNAP25, SV2, and Synapsin I (see above). Band intensities within the linear range of the film were normalized to the signal obtained in the same lane with an anti-actin antibody to control for protein load and interlane variability. The ratio of the normalized intensity of a band in_Snca_−/− mice to the normalized intensity for Snca+/+ mice was calculated using 6–12 determinations per genotype for each synaptic protein.
Electron microscopy. Two pregnant females from_Snca+/+_ ×Snca+/+ matings and two pregnant females from Snca−/− ×Snca−/− matings were killed at 17.5 d post coitum, and the hippocampal tissues from a single litter were dissected and pooled. Hippocampal neurons from each of the four pooled samples were cultured for at least 14 d and monitored for neurite outgrowth and synaptic connections; they were then fixed with modified Karnovsky's solution (Electron Microscopy Sciences, Fort Washington, PA) consisting of 2% paraformaldehyde, 2.5% glutaraldehyde, and 0.1 m sodium phosphate, pH 7.4, as described previously (Murphy et al., 2000). Brain sections were obtained from two 2-month-old _Snca−/−_and two 2-month-old Snca+/+ mice after anesthesia and perfusion via cardiac puncture with modified Karnovsky's solution before dissection of the hippocampus. Vesicles were counted on three grids from each of the different samples as described previously (Schikorski and Stevens, 1997; Pozzo-Miller et al., 1999); vesicles touching the synaptic membrane or within the diameter of the presynaptic membrane of one vesicle were considered to be “docked” vesicles. Only synapses with a well defined postsynaptic density were chosen for analysis. Photographic negatives of electron microscopic images were scanned and analyzed with automatic contrast enhancement provided by the software package NIH Image (Scion, Frederick, MD).
Electrophysiological recording. Transverse hippocampal slices (400 μm) were prepared from α-synuclein_Snca+/+_ and_Snca−/−_ mice (4–5 weeks old). The slices were maintained in an interface chamber for both recovery (2 hr) and recording; they were exposed to an artificial atmosphere of 95% O2 and 5% CO2, as described previously (Pozzo-Miller et al., 1999). Perfusion medium [artificial CSF (ACSF), 34°C] contained (in mm): 124 NaCl, 3.0 KCl, 2.5 CaCl2, 1.5 MgCl2, 26 NaHCO3, 1.25 KH2PO4, 10 glucose, and 2 ascorbic acid, pH 7.4. Extracellular calcium concentrations ([Ca2+]o) in ACSF were changed to 0.5 or 5.0 mm, respectively, in experiments using low- or high-[Ca2+]o. The perfusion rate was 15 ml/hr. Field EPSPs were evoked in CA1 stratum radiatum by stimulating Schaffer collaterals with twisted bipolar nichrome electrodes and recorded with ACSF-filled glass pipettes (<5 MΩ) using an Axoclamp-2B amplifier (Axon Instruments, Foster City, CA). Test stimuli consisted of monophasic 200 μsec pulses of constant current delivered by stimulus isolation units. Basal synaptic transmission was monitored by alternating, low-frequency stimulation (every 30 sec) of two separate pathways via two stimulating electrodes (S1 and S2) positioned on both sides of the recording electrode. Only slices exhibiting EPSPs of 2–3 mV in amplitude without superimposed population spikes were used. The stimulus intensity was adjusted to evoke EPSPs of ∼1.3 mV.
Input–output curves were obtained by plotting the fiber volley against the slopes of EPSPs. Paired-pulse facilitation (PPF) at different interstimulus intervals (ISI; 10–100 msec) was measured by the ratio of the second EPSP to the first EPSP slope. Two stimulus protocols were used to study different pools of synaptic vesicles: high-frequency stimulation (HFS; 40 stimuli at 100 Hz) and prolonged repetitive stimulation (PRS; 300 stimuli at 12.5 or 14 Hz) in the presence or absence of the NMDA receptor antagonist,dl-2-amino-7-phosphonovalerate (dl-APV; 100 μm). At least 10 min stable baseline responses were obtained before these stimuli were delivered. EPSPs were digitized (10 kHz), filtered at 3 kHz (eight-pole Bessel filter; Warner Instrument Corp., Hamden, CT) using acquisition system pClamp6, stored on magnetic media, and analyzed off-line using analysis system Clampfit 8.0 (Axon Instruments) and Microsoft Excel visual basic programming (Microsoft Corp., Redmond, WA). In addition, double exponential equations were used to fit the EPSP slopes–stimulus number plots using IGOR Pro program (WaveMetrics Inc., Lake Oswego, OR). Changes in EPSPs over time were obtained by normalizing successive EPSP slopes to the first EPSP slope in the train responses to HFS or PRS. The recovery after synapse depression was analyzed quantitatively using a protocol developed by Stevens and Wesseling (1999), with a minor modification. Two HFS trains were delivered in hippocampal slices with different time lags (Δ_t_) between the two. EPSP slopes were plotted against the number of the stimulus in each HFS train, X1 and X2i). We measured only the decay phase of the plots during HFS by integrating areas under the EPSP slopes–stimulus number plots between the 5th and 40th responses (Pozzo-Miller et al., 1999). Because the HFS protocol used in this study did not depress the synaptic response completely, we measured the offset value (Y) right after the end of the first train (Δ_t_ = 0 sec) by another HFS train (100 Hz, 1 sec). The recovery at different intervals after synaptic depression (X2i) was corrected by subtracting the offset (Y) from our measurements of X1 and X2i. The recovery at any given time (i) = (X2i − Y)/(X1 −Y). Recovery time courses can be fitted by the weighted sum of two exponentials:
R(t)=f[1−exp(−t/τF)]+(1−f)[1−exp(−t/τS)]
where R(t) is the normalized recovery rate; f is the weighting of the fast recovering exponential; and τF and τS are the time constants for fast and slow recovery, respectively (Stevens and Wesseling, 1999).
Behavioral analysis. Behavioral tests were performed at the Department of Molecular and Human Genetics at Baylor College of Medicine using a battery of commonly used tests (Kimber et al., 1999;Peier et al., 2000). The tests were done in a blinded manner on 13 mutant and wild-type male littermate pairs. The mice were on a pure 129/SvEvTac genetic background and were 6–10 months of age at the time of testing. The tests were performed essentially as described previously (Paylor et al., 1998) and included: (1) general neurological screen for severe sensory and motor abnormalities; (2) open-field test for exploratory activity and anxiety-related responses; (3) light–dark test for anxiety-related responses; (4) rotarod test for motor coordination and skill learning; (5) acoustic startle and prepulse inhibition of the acoustic startle response for sensorimotor gating; (6) habituation of the acoustic startle response for sensorimotor adaptation; (7) contextual and auditory-cued freezing to assess conditioned fear; (8) the hidden platform version of the Morris task for spatial learning; and (9) the hotplate test for analgesia responses. Data were analyzed using two- or three-way ANOVA.
An increase of locomotor activity in response to amphetamine was measured in a Benwick AM1051 (Cambridge, UK) activity chamber. Total activity counts (light beam breaks), as well as mobile, rearing, and static counts, were recorded every 10 min over 2 hours. At 30 min mice were injected intraperitoneally with 0.9% saline (5 ml/kg, body weight) to assess spontaneous locomotor activity or withd-amphetamine sulfate (4 mg/kg, body weight) (Sigma, St. Louis, MO) in the same volume 0.9% saline used to assess spontaneous locomotor activity. Amphetamine-induced hyperactivity was measured within 1–4 d of the spontaneous activity assay. Eleven male littermate pairs (Snca+/+ and_Snca−/−_) aged 4–7 months were tested.
RESULTS
α-Synuclein knock-out mice
Mice lacking α-synuclein were generated by replacing exons 4 and 5 with the neomycin resistance gene in ES cells genotypically 129/SvEvTac (shown schematically in Fig.1a). Successful site-specific recombination was assayed by Southern blot analysis; two properly targeted clones were used for blastocyst injections. Offspring of chimeras were bred to establish two lines of mice heterozygous for the deletion mutation (Snca−), and all possible genotypes were seen among the offspring of heterozygote intercrosses (Fig. 1b, top). Analysis of the transmission of the Snca− allele demonstrated that there was no fetal loss of Snca−/− mice. Transcripts of the Snca− deletion allele were undetectable by reverse transcriptase-PCR using primers designed to amplify portions of the gene outside those encoded by exons 4 and 5 (data not shown). Western blotting using a polyclonal antibody that recognizes both α- and β-synuclein showed the absence of α-synuclein in homozygous mutant mice (Fig. 1b, bottom left). β-synuclein protein does not appear to be upregulated in response to the lack of α-synuclein (Fig. 1c) (data not shown). Two-dimensional PAGE using an α-synuclein-specific antibody shows that all isoforms of the protein were missing in knock-out animals (Fig. 1d, bottom). No abnormalities were seen in gross pathological examination of_Snca−/−_ mice and life span was normal.
Synaptic ultrastructure
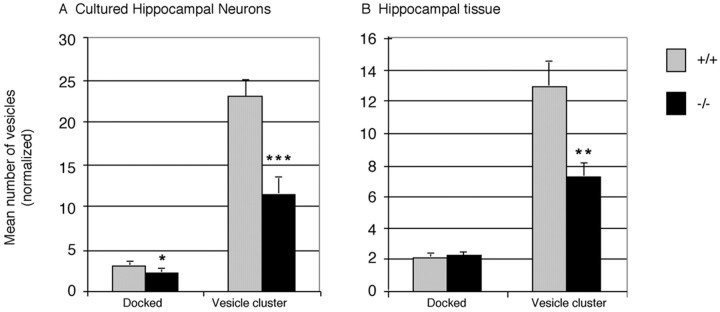
Hippocampal neurons from two litters of late stage_Snca+/+_ embryos and two litters of_Snca−/−_ embryos were cultured, and their synapses were examined by electron microscopy. The number of presynaptic vesicles appeared reduced in neurons cultured from mutant animals (Fig. 2A,B). Three grids were then evaluated blindly from each sample, and counts were taken of both docked and undocked (vesicle cluster) vesicles from 61 wild-type and 61 mutant synapses (Fig.3A). There was a 50% reduction in reserve and/or resting pool vesicles in the_Snca−/−_ compared with wild-type mice (p = 0.00025, two-tailed Student's _t_test). A 26% reduction in the number of docked vesicles was also seen in these cultures (p = 0.026; two-tailed Student's t test).
Fig. 2.
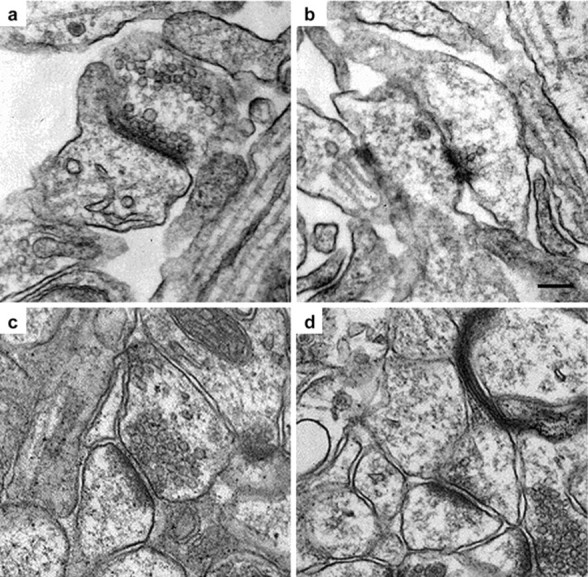
a, b, Cultured neurons from the hippocampus of 17.5 d post coitum fetal mice.a, Wild-type Snca +/+;b, knock-out Snca−/−_synapses. c, d, Hippocampal synapses in brain sections from 2-month-old Snca+/+ and_Snca−/− mice. Spinous synapses were photographed from primarily the CA1 region of hippocampus.c, Wild-type Snca+/+;d, knock-out _Snca−/−_synapses. The synapses measured were those in which a well defined postsynaptic density was observed. Scale bar, 100 nm.
Fig. 3.
Average number of vesicles in the docked (active zone) pool and in the vesicle cluster, located more than one vesicle diameter from the synapse. A, Average number of vesicles in synapses from Snca +/+ and_Snca−/−_ hippocampal neuronal cultures; n = 61 from each genotype.B, Average number of vesicles in synapses from_Snca+/+_ and_Snca−/−_ hippocampal brain samples;n = 131 from each genotype. Significance for differences in mean between _Snca+/+_and Snca−/−: *_p_= 0.026, **p = 0.00025, ***p = 0.00015, Student's two-sided t test,.
Hippocampal synapses from 2-month-old mutant and wild-type mice were also examined with a similar technique. Again, the number of presynaptic vesicles appeared reduced in neurons from mutant animals (Fig. 2C,D). Grids were evaluated in a blinded manner, and counts were taken of both docked and undocked (vesicle cluster) vesicles from 131 wild-type and 131 mutant synapses from two animals. There was a 44% reduction in reserve and/or resting pool vesicles in hippocampal tissue obtained from _Snca−/−_mice compared with wild-type (p = 0.00015; two-tailed Student's t test) (Fig. 3B). Docked vesicles showed no change in synapses examined directly in brain sections.
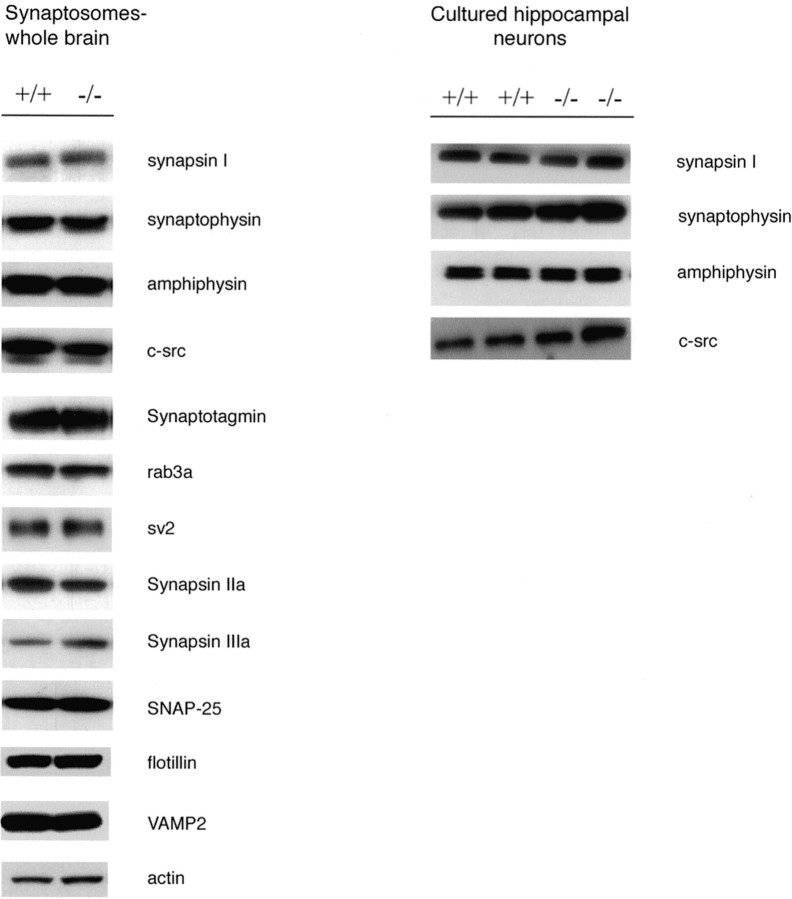
In contrast with the observations of Murphy et al. (2000), there were no changes in the levels seen on Western blotting of a battery of synaptic proteins in synaptosomal preparations from_Snca−/−_ mice compared with wild-type animals (Fig. 4). This lack of alteration in synaptic proteins was true in synaptosomal preparations from brain as well as total protein in postnuclear supernatants prepared from cultured hippocampal neurons.
Fig. 4.
Western blot analysis of synaptic proteins from wild-type (Snca +/+) and knock-out (Snca−/−) mouse brains for a battery of synaptic proteins. Ten micrograms of total protein from synaptosome fractions made from brain homogenates or 30 μg of total protein from a postnuclear supernatant from cultured hippocampal neurons were loaded in each well and probed with antibodies against each of the proteins indicated.
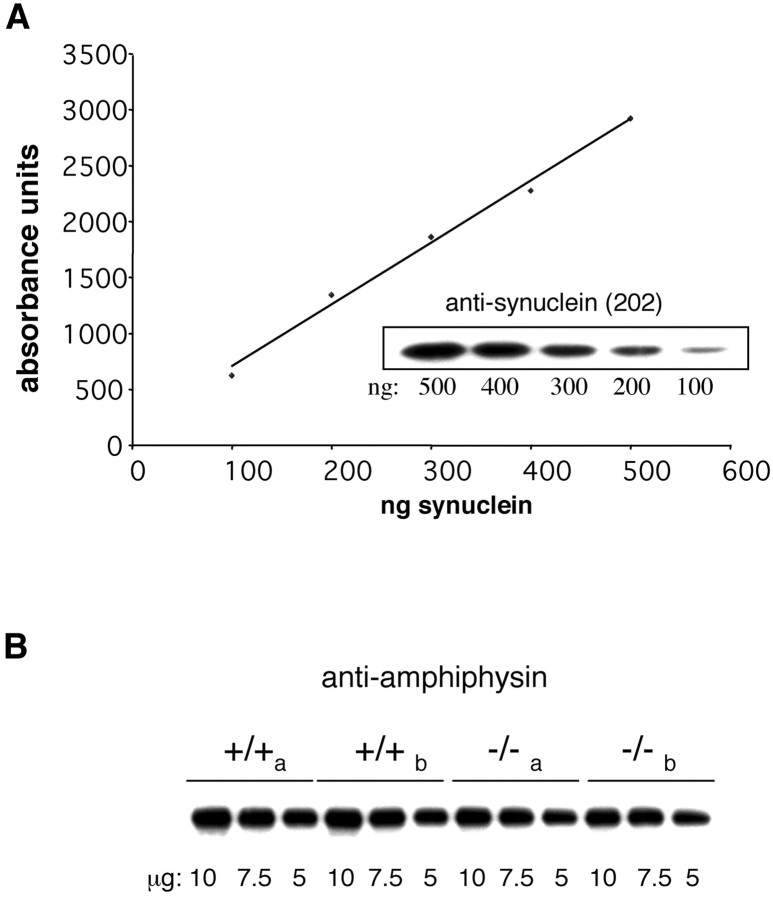
We also performed quantitative immunoblot analysis on samples from synaptosomes from Snca+/+ and_Snca−/−_ mice (Fig.5). First, we generated a standard curve of the intensity of bands seen on x-ray film, detected by chemiluminescence, to determine the linear range for absorbance units (Fig. 5A). We then determined the average ratio of absorbance units of Snca_−/− versus_Snca+/+ synaptosomes in 6–12 independent determinations for each of six different antibodies (Table1), making sure that the intensity of the bands was within the linear range for densitometry. A representative example is shown in Figure 5B. In no case did the ratio of band intensity for Snca_−/− versus_Snca+/+ approach the 50% reduction in vesicle numbers seen on electron microscopy, and it did not differ significantly from equal (ratio of 1.0) for five of the six proteins tested. Only SV2 showed a modest reduction.
Fig. 5.
Quantitative immunoblot analysis of synaptosomes from control and _Snca_−/− mice.A, Known amounts of recombinant α-synuclein (100–500 ng) were separated by SDS-PAGE and subjected to immunoblot analysis with the anti-synuclein antibody 202 (inset). Detection was with HRP-labeled secondary antibodies and development by enhanced chemiluminescence. A standard curve of band intensity versus the amount of protein generates a linear curve. B, A representative example of the immunoblot intensity data used to generate the ratios in Table 1. Dilutions of synaptosome fractions purified from two brains from independent (a, b)Snca+/+ mice and two independent (a, b) _Snca_−/− mice were analyzed on each blot to control for intergel variability and were immunoblotted with anti-amphiphysin antibody.
Table 1.
Relative levels of selected synaptic proteins in_Snca_−/− versus_Snca_+/+ synaptosomes
| Protein | Relative intensity of immunoblot band in Snca_−/− versus_Snca+/+ synaptosomes (± SEM) |
|---|---|
| Synaptotagmin | 1.17 ± 0.113 |
| VAMP2 | 1.09 ± 0.082 |
| Amphiphysin | 1.07 ± 0.031 |
| SNAP25 | 0.97 ± 0.022 |
| SV2 | 0.89 ± 0.014 |
| Synapsin I | 0.88 ± 0.057 |
Electrophysiology
To determine whether the changes in the synaptic vesicle numbers at the hippocampal synapses of _Snca−/−_mice truly lead to functional consequences in transmitter release, a number of relevant electrophysiological tests were performed. First, we compared the strengths of basal synaptic transmission between wild-type and mutant mice. Field EPSPs were evoked at the CA1 synapses by stimulating Schaffer collaterals with increasing stimulus strength at very low frequency (one per minute). The slope of EPSPs was plotted against fiber volley to establish input–output relationships. No difference was observed in the input–output curves in wild-type (Snca+/+) and mutant (Snca−/−) synapses (Fig.6A), suggesting that the deletion of Snca does not alter basal synaptic transmission.
Fig. 6.
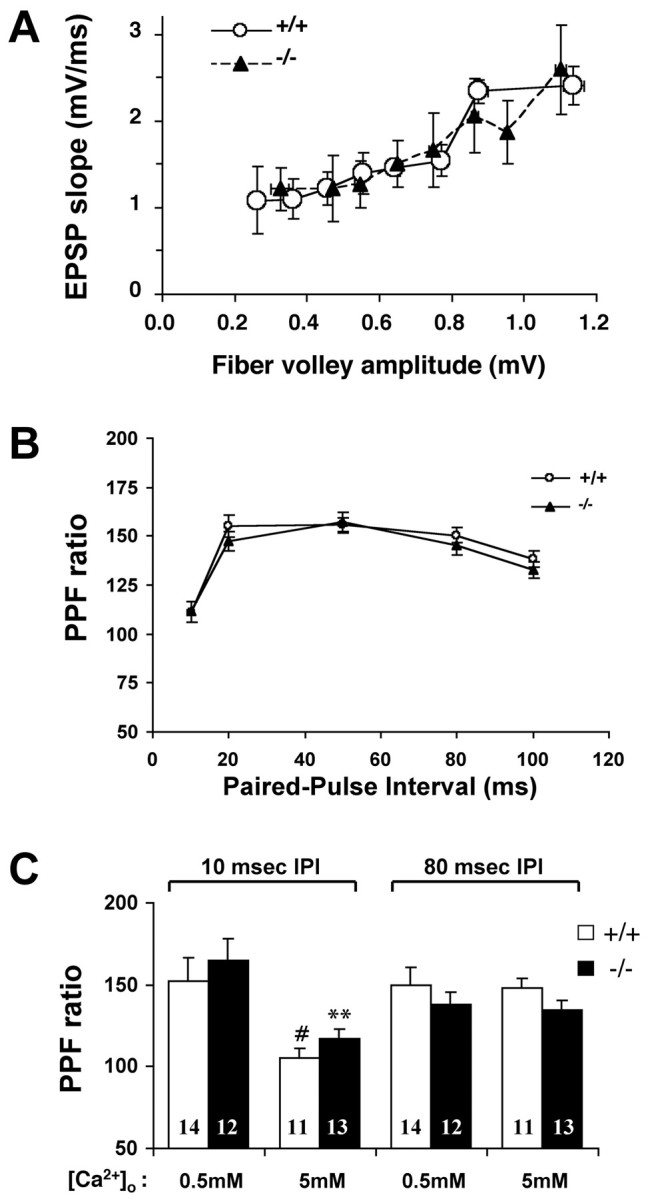
Normal basal synaptic transmission and PPF at hippocampal synapses in α-synuclein knock-out mice. Field EPSPs were recorded at CA1 synapses by stimulating the Schaffer collaterals. Data from multiple recordings of the same genotype were pooled and expressed as means ± SEM. A, Input–output curves for_Snca_ +/+ (n = 12 slices) and Snca−/−(n = 14 slices) mice. The mean slope of EPSPs is plotted against fiber volley amplitudes. Because fiber volley amplitudes are not fixed numbers, we also expressed fiber volley as mean ± SEM. B, Plot of PPFs in_Snca+/+_ (n = 36 slices) and Snca−/−(n = 32 slices) mice. The ratios of the second and first EPSP slopes were calculated, and mean values are plotted against different interpulse intervals (10–100 msec). C, Effect of [Ca2+]o PPF at different IPIs. PPFs at short (10 msec IPI) and long (80 msec IPI) were measured at 0.5 and 5 mm[Ca2+]o in both_Snca+/+_ and_Snca−/−_ synapses. The number associated with each column represents the number of slices used. Note that PPF ratios at IPIs of 10 msec, but not IPIs of 80 msec, are significantly different. #p < 0.05, **p < 0.001, Student's t test. No statistical differences are found in PPF ratios between_Snca+/+_ and_Snca−/−_ synapses in any conditions.
We then measured PPF, a form of short-term synaptic plasticity in which the response to the second of two consecutive stimuli with a given interpulse intreval (IPI) is higher than the first one (Katz and Miledi, 1968). PPF has been used by many investigators to infer the changes in the Pr (Zucker, 1989). Two approaches were taken to examine whether α-synuclein regulates Pr. First, we measured PPF using the ratios of the second and the first EPSP slopes at IPIs of 10, 20, 50, 80, and 100 msec. As shown in Figure 6B, PPF profiles exhibited a typical change at different IPIs: ∼1 at 10 msec, peaked at ∼50 msec, and low again thereafter. PPFs recorded from_Snca+/+_ and_Snca−/−_ slices were almost identical (Fig. 6B). Second, we compared PPF in_Snca+/+_ and_Snca−/−_ synapses at low and high [Ca2+]o. It is known that changing [Ca2+]o alters Pr. At a low [Ca2+]o, Pr is low and PPF should increase, whereas at a high [Ca2+]o, Pr is high and PPF is expected to decrease. We found that this was true for PPF at shorter IPIs. When the IPI was at 10 msec, the PPF was high when [Ca2+]o = 0.5 mm, but low when [Ca2+]o = 5 mm (Fig. 6C). However, little difference was found between PPFs at a longer IPI (80 msec) in low (0.5 mm) and high (5 mm) [Ca2+]o, suggesting that at longer intervals the PPF becomes less sensitive to changes in [Ca2+]o(Fig. 6C). Very similar observations were made byCastro-Alamancos and Connors (1997) using hippocampal and cortical slices. Importantly, we found that synapses in_Snca+/+_ and_Snca−/−_ mice exhibited very similar PPFs in both low and high [Ca2+]o (Fig.6C). Thus, with conditions known to alter Pr, the ratios of PPF in Snca−/− synapses went up and down the same way as in Snca+/+ synapses. Taken together, these results support the notion that the lack of α-synuclein may not affect Pr. However, caution must be taken in interpreting the PPF results because changes in PPF may not reflect solely changes in Pr (Wang and Kelly, 1997).
In the next series of experiments, we determined synaptic responses to repetitive stimulation. A brief HFS (100 Hz, 40 pulses) has been shown to deplete primarily the readily releasable pool (RRP) of transmitters, which correspond to the morphologically defined docked vesicles (Zucker, 1989; Dobrunz and Stevens, 1997; Larkman et al., 1997). This protocol is too fast to affect the reserve and/or resting pool of vesicles. The EPSP slopes during the entire HFS were recorded from CA1 synapses of Snca+/+ and_Snca−/−_ mice, normalized to the first EPSP slope, and were plotted against stimulus numbers. Figure7A shows the averaged responses to HFS. After an initial increase, the EPSP slopes exhibited a continuous decline over time, indicative of a gradual depletion of docked vesicles. However, statistical analysis indicates that the synapses from wild-type and Snca mutant mice have the same responses to HFS (p > 0.097, t test,Snca+/+, n = 10 slices per two animals; _Snca−/−, n_= 10 slices per two animals). The two plots are superimposable (Fig.7A). These results are consistent with the morphological observation that wild-type and α-synuclein mutant synapses have similar numbers of docked vesicles.
Fig. 7.
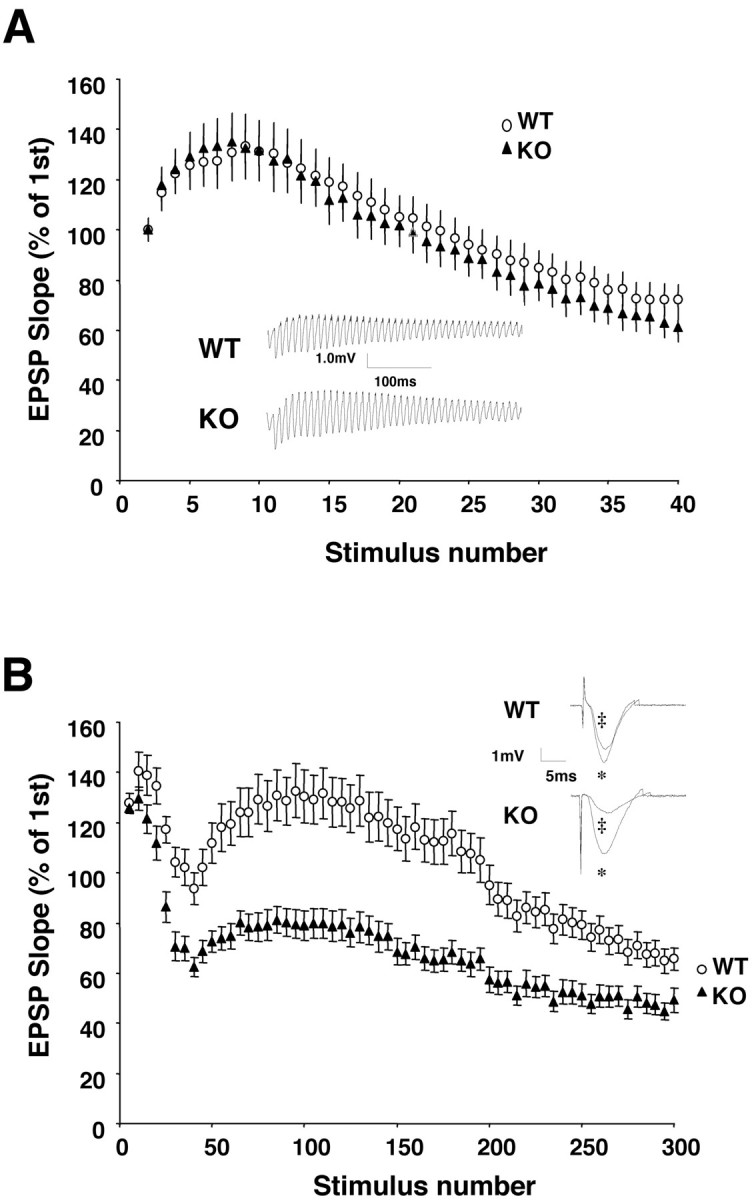
Role of α-synuclein in synaptic responses to repetitive stimulation. The slopes of field EPSPs during the entire recording were normalized to the first EPSP slope in each recording.A, Normal synaptic responses to a brief HFS (100 Hz, 40 pulses) at α-synuclein synapses. Representative recordings of entire EPSP traces from wild-type (WT) and knock-out (KO) hippocampus are shown in the inset.Stimulus artifacts were removed to clarify each EPSP waveform.B, Impaired responses to a PRS (300 stimuli at 12.5 Hz) in Snca −/− synapses. Time course of the effects of a stimulus train are shown. Representative single EPSPs at one-tenth (*) stimulus and one-hundredth (‡) stimulus are shown in the inset. Every five points of responses was averaged, and all EPSP slopes were normalized to the first EPSP slope.
Synaptic vesicles in the nerve terminals undergo a cycling process in which the depleted docked vesicles are replenished by the reserve pool vesicles and/or endocytosis, both of which occur at a slower rate than the rapid recycling that occurs with the RRP (Dobrunz and Stevens, 1997; Pyle et al., 2000; Richards et al., 2000). When a PRS at relatively lower frequency is applied, the depletion is usually faster than the replenishment, leading to a gradual decline of EPSP slopes, or synaptic depression (Geppert et al., 1994, 1997). Wild-type and mutant synaptic responses to a train of PRS (12.5 Hz, 300 pulses) were examined. Synaptic responses to PRS gradually decreased over time in both Snca+/+ and_Snca−/−_ slices (Fig. 7B). The decline of EPSP slopes consistently occurred in two phases in virtually all slices recorded: an initial fast phase of decline, which ended at ∼40th pulse, and a late slow phase that approaches a steady level at the end of the recordings (Fig. 7B). The 40th EPSP slope in_Snca−/−_ slices was much lower than that in Snca+/+ slices (Snca+/+, 93.7 ± 6.3%,n = 9 slices per two animals;Snca−/−, 66.5 ± 3.9%,n = 11 slices per two animals, t test,p < 0.001), suggesting a much faster rate of vesicle depletion in Snca−/− synapses. The rebound after the first phase may be attributable to an NMDA receptor-mediated potentiation, because inhibition of the NMDA component of EPSPs by dl-APV (100 μm) dramatically reduced the magnitude of rebound (Fig. 8). The second phase of depletion began at ∼100th pulse. A steady-state level of depletion was reached at ∼200th pulse in Snca−/−_slices, but the Snca+/+ slices exhibited a continuous depletion even toward the end of recording (Fig.7B). Taken together, these results suggest that a smaller reserve and/or resting pool of vesicles in_Snca−/− synapses could not efficiently replenish the RRP, leading to a faster depletion of vesicles during a PRS train.
Fig. 8.
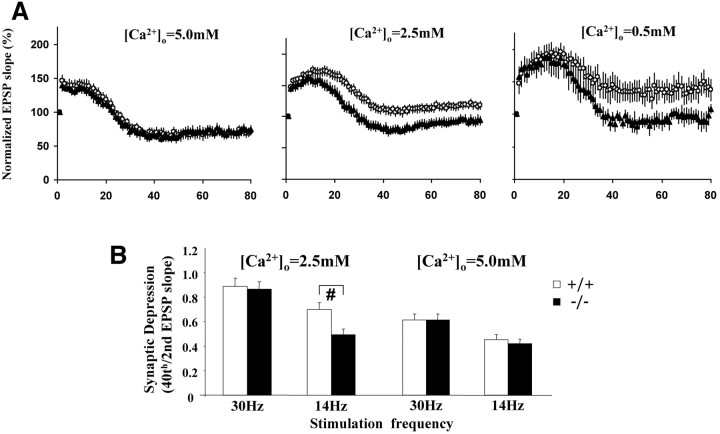
Relationship between α-synuclein and Ca2+ in synaptic responses to PRS. Synaptic depression was induced at CA1 synapses by PRS (14 Hz) in the presence of the NMDA antagonist dl-APV (100 μm). A, Effect of [Ca2+]o on synaptic depression. The slopes of field EPSPs during the entire recording were normalized to the first EPSP slope in each recording. The mean EPSP slopes are plotted against the number of stimuli (1st to 80th pulses) at low (0.5 mm), normal (2.5 mm), and high (5.0 mm) [Ca2+]o, in_Snca_ +/+ (n = 9, 22, and 9) and Snca−/−(n = 6, 17, and 9) synapses, respectively.B, Effect of stimulation frequency on synaptic depression. Synaptic depression was induced by PRS and was expressed as the ratio of the 40th and 2nd EPSP slopes. The same slices were used for both 14 and 30 Hz PRS experiments. White columns, Data obtained in normal (2.5 mm) [Ca2+]o in_Snca+/+_ (n = 13) and Snca−/− (n = 14) slices. Black columns, Data obtained in high (5 mm) [Ca2+]o in_Snca+/+_ (n = 14) and Snca−/− (n = 16) slices.
To better examine the role of α-synuclein in synaptic depression, we recorded synaptic responses to PRS in the presence ofdl-APV to eliminate the interference by NMDA-receptor-mediated postsynaptic changes. In normal [Ca2+]o (2.5 mm), the synaptic responses to PRS exhibited a continuous decline over time after a brief facilitation phase during the first 10 pulses, reaching a steady-state level at ∼50 pulses (Fig.8A, middle). Although the facilitation phase was quite similar, the decline of EPSP slopes over time was consistently faster in Snca−/− synapses compared with that in Snca+/+ synapses (Fig.8A, middle). When PRS is applied, the depleted docked vesicles are replenished by the reserve pool vesicle. Assuming that the replenishment is dependent on the concentration of vesicles (or the size of the reserve pool), the _Snca−/−_synapses with a smaller reserve pool may replenish the docked vesicles at a slower rate, leading to more pronounced synaptic depression.
Because Ca2+ is known to facilitate the mobilization of vesicles between the readily releasable and reserve and/or resting pools (Greengard et al., 1993; Ryan, 1999; Pyle et al., 2000), we tested the effects of changing [Ca2+]o on synaptic responses to PRS. In lower [Ca2+]o (0.5 mm), the differences between_Snca+/+_ and_Snca−/−_ synapses were greater (Fig.8A, right). In contrast, the synaptic responses to PRS in Snca+/+ and_Snca−/−_ synapses were almost identical when [Ca2+]o was increased to 5 mm (Fig. 8A, left). Thus, the deficits in synaptic response to PRS in_Snca−/−_ synapses were enhanced or diminished when [Ca2+]o was reduced or elevated, respectively. To further investigate the relationship between α-synuclein and Ca2+ in vesicle mobilization, we examined synaptic depression induced by a higher stimulation frequency (30 Hz). Similar to elevating [Ca2+]o, a PRS with a higher frequency results in an increase in intracellular Ca2+ concentration at the nerve terminals. At normal [Ca2+]o(2.5 mm), the synaptic depression induced by 30 Hz PRS no longer exhibited differences between_Snca+/+_ and_Snca−/−_ synapses (Fig. 8B, left). At higher [Ca2+]o (5 mm), synaptic depression was more pronounced, but there was still no difference between_Snca+/+_ and_Snca−/−_ synapses (Fig. 8B, right). For comparison, synaptic depression induced by 14 Hz PRS showed a significant impairment in a_Snca−/−_ synapse at normal but not at high [Ca2+]o (Fig.8B). These results raise the possibility that the electrophysiological phenotype of α-synuclein knock-out synapses may be partly attributable to a shift in the Ca2+ dependence of vesicle mobilization in addition to a reduction in the number of reserve pool vesicles.
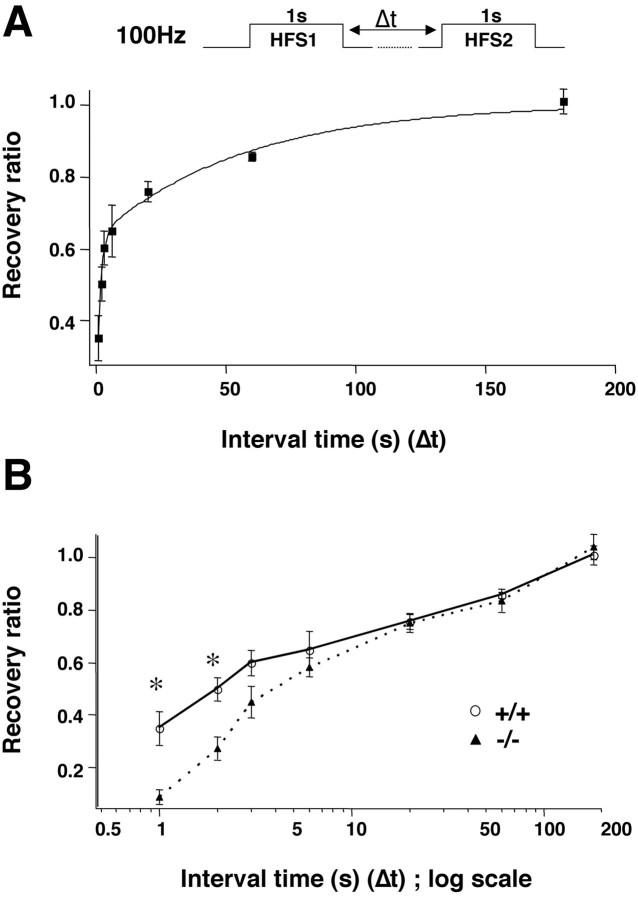
The replenishment of RRP was examined directly using a protocol developed by Stevens and Wesseling (1999). The depletion of RRP was first induced by a train of repetitive stimulation. The sum of amplitudes of EPSPs induced by a second train of repetitive stimulation applied at various intervals after the first one was used to measure the recovery (or replenishment) kinetics (Fig.9A, top). To avoid the potential interference of impaired responses to PRS seen in_Snca−/−_ synapses, we used a longer HFS (100 Hz, 100 pulses) at higher [Ca2+]o (5 mm) to deplete RRP and to test recovery. As reported previously, the HFS did not depress the synaptic response completely because the emptied RRP is continuously restocked with fresh vesicles (Stevens and Wesseling, 1999). To correct this offset, we first measured the sum of the second response when no time was allowed for recovery between the two HFSs (0 sec interval). This response was subtracted from all measurements (first and second at various intervals), which was then normalized by the corresponding corrected first response. The recovery time course was generated by plotting the normalized second responses against the intervals between the two HFSs, and assumed a two-component kinetics that could be fitted with a double exponential curve. Figure 9A, bottom, shows the averaged recovery time course for wild-type synapses. The time constant for the fast recovery (τF) was 1.3 sec, and that for slow recovery (τS) was 56.8 sec. In_Snca−/−_ synapses, the replenishment of depleted vesicles became slower (Fig. 9B). τF increased by almost 200% (3.7 sec), whereas τS did not change much (61.1 sec). Because the recovery time course reflects the ability of a synapse to mobilize vesicles from the reserve pool to the RRP, these results suggest that α-synuclein may regulate the refilling of RRP by controlling the size of the reserve/resting pool.
Fig. 9.
Role of α-synuclein in the recovery of synaptic responses after depression. A, Time course of recovery after synaptic depression in wild-type synapses. Top,Stimulation protocol to study recovery. Synaptic depression was induced by a train of HFS (100 Hz, 1 sec); recovery from depression was monitored with another HFS started after a time lag (Δ_t). The relative recovery of synaptic response after depression at any given time (i) is presented by the ratio of the sum of the second response (X2i −_Y) and the sum of the first response (X1 − Y), where_Y_ is the offset (see Materials and Methods). The ratios (means ± SE, from multiple slices) were plotted as a function of Δ_t_ (n = 3 animals). The curve was fitted by the equation given in Materials and Methods, with the time constants τF = 1.28 sec and τS = 56.8 sec, f = 0.627. B, Recovery curves for WT and KO synapses. To better present the differences in recovery between WT and KO synapses, the relative recovery was plotted against Δ_t_ in log scale. *Significant difference from the WT; nonparametric Mann–Whitney U test,p < 0.01, n = 8–10 for each point.
Behavior testing of Snca−/− mutant mice
The mutant mice have normal reflexes, and no evidence of severe sensory or motor abnormalities. Moreover, there were no significant differences (p > 0.05) detected in the overall total distance traveled in the open field, number of transitions in the light–dark test, performance on the rotarod test, prepulse inhibition, startle habituation, conditioned fear, spatial learning in the Morris test, or hotplate test. There were two significant differences in the open-field test: knock-out mice had significantly fewer rearing responses, and the mutant mice had a lower ratio of center to total distance, which is commonly interpreted as an anxiety-related response (p < 0.05). However, there were no statistically significant differences in the number of transitions in the light–dark exploration box (an independent test of anxiety). Additional experiments will be needed to determine if there is a possible anxiety phenotype by evaluating the mice in other measurements of anxiety such as the elevated plus maze.
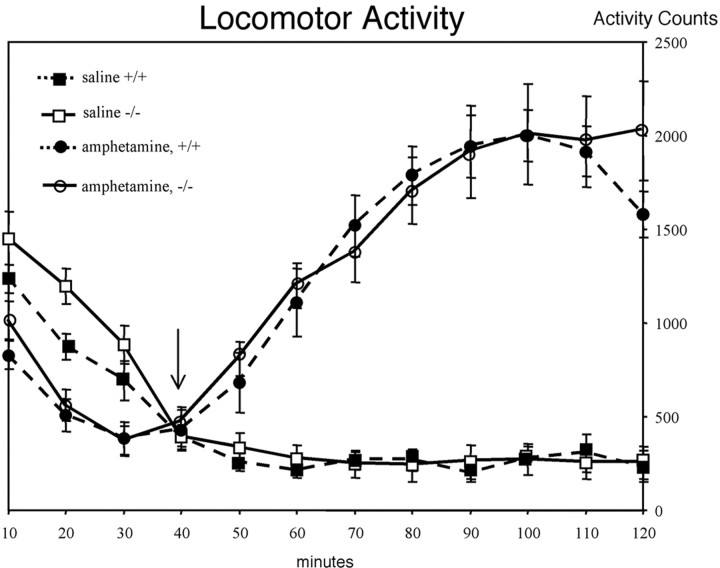
Eleven male littermate pairs (Snca+/+ and_Snca−/−_) on an inbred 129/Sv/EvTac background were tested for an increase in locomotor activity in response to d-amphetamine. No significant differences were found between the normal and mutant mice in the increase in total activity in response to amphetamine treatment (Fig.10). Rearing counts showed no amphetamine-induced activity in either genotype (data not shown).
Fig. 10.
Wild-type and Snca mutant mice show similar increases in locomotor activity in response to amphetamine. Injections of either saline or d-amphetamine were given at 30 min. Squares indicate spontaneous locomotor activity, circles indicate amphetamine-induced activity, open symbols represent the _Snca_mutant mice (n = 11), and closed symbols represent the wild-type mice (n = 11). The averages of total activity counts (light beam breaks) per 10 min interval are shown ± SEM. The mobile and static count time courses are similar, although reduced in magnitude to the total counts both with and without amphetamine.
DISCUSSION
The previous study of Abeliovich et al. (2000) and the results presented here are the only two studies performed to date describing the phenotypic consequences of a homozygous null mutation in the gene encoding α-synuclein. Both studies are consistent in the finding that normal mouse development, life span, and behavior are not affected by the lack of α-synuclein. Abeliovich et al. (2000) found that levels of DA in the striatum were reduced by ∼18% in the mutant compared with the wild-type animals. We found similar modest reductions in striatal levels of DA, but the wide variance in the measurements between different mice precluded drawing any conclusions about the significance of the reductions seen.
However, our study differs from that of Abeliovich et al. (2000) in two important ways. First, ultrastructural examination of synapses from_Snca−/−_ mice showed a reduction in the reserve–resting pool of synaptic vesicles in the hippocampus of mice lacking α-synuclein and in hippocampal neurons cultured from 17.5 d post coitum mutant mouse embryos. These results are consistent with results from a previous study in cultured rat hippocampal neurons in which lowering the amount of α-synuclein using antisense oligonucleotides resulted in a decrease in the number of resting–reserve synaptic vesicles (Murphy et al., 2000). Because this decrease in the vesicle cluster was of the same magnitude as seen in the knock-out mice, whereas the antisense DNA reduced but did not eliminate the expression of α-synuclein, there is likely to be a threshold level of the protein required for formation or maintenance of this subset of synaptic vesicles. Abeliovich et al. (2000) saw no such effect in striatal neurons in their mutant animals, and although this may reflect differences in striatum versus hippocampus, the phenotype may have been missed if not enough synapses were examined and the vesicle numbers were not evaluated statistically. It is also interesting to note that although immunogold labeling of synaptic vesicles with anti-α-synuclein antibody clearly labeled presynaptic vesicles, very few if any gold particles were present over the docked vesicles, and most were located over what would be defined ultrastructurally as the proximal vesicle cluster (Clayton and George, 1999).
Our study differs from that of Abeliovich et al. (2000) in another way in that we saw no differences between mutant and wild-type mice in amphetamine-induced locomotor activity. Amphetamine acts to raise synaptic cleft DA levels both by blocking the reuptake by the DA transporter and by draining synaptic vesicles of their contents. This difference in the two studies is difficult to interpret because the mice used are of different genetic backgrounds, which is known to affect the locomotor activity induced by amphetamine (Ralph et al., 2001). It would suggest that it is critical to consider genetic background effects when attempting to draw mechanistic conclusions from the phenotypic effects of genetics-altering synaptic proteins in engineered mice.
To explore the physiological consequences of ultrastructural changes seen in Snca−/− synapses, we performed a number of electrophysiological tests. Our rationale was that a 50% reduction in the number of undocked synaptic vesicles caused by_Snca_ mutation may not affect the basal synaptic transmission at low frequency (<1 Hz), but may hamper the ability of synapses to handle PRS (>10 Hz). Indeed, we found that the input–output curves recorded from Snca+/+ and_Snca−/−_ synapses were almost identical, whereas synaptic responses to PRS were severely impaired. A number of experiments suggest that the changes in the responses to PRS are not attributable to a modulation of the Pr by α-synuclein: (1) changes in Pr are usually accompanied by changes in PPF. We found that the wild-type and α-synuclein mutant synapses exhibit very similar PPFs over a wide range of IPIs. (2) A change in [Ca2+]o is known to alter Pr. If a lack of α-synuclein affects Pr, one would expect to see differences in PPF at certain [Ca2+]o. We found that in both low and high [Ca2+]o, PPFs measured in Snca+/+ and_Snca−/−_ synapses remained the same. (3) Our electron microscopic (EM) experiments indicate that the number of docked vesicles, which is believed to be the major determinant of Pr, changed very little if at all in α-synuclein mutant synapses. We also showed that synaptic responses to a brief train of HFS, which depletes primarily docked vesicles, were not affected by the α-synuclein mutation. Taken together, these findings are consistent with the idea that the regulation of Pr is not a major function of α-synuclein.
Recent studies suggest that synaptic vesicles in the nerve terminals may be divided into three interconnected pools: the RRP, the reserve pool, and the resting pool (Südhof, 2000). The RRP vesicles, which correspond to morphologically docked vesicles, are those immediately available for release (Schikorski and Stevens, 1997; Murthy and Stevens, 1999). A brief HFS induces the release of transmitter primarily from the RRP. During extensive stimulation such as PRS, the RRP is depleted, and additional vesicles are recruited from the reserve pool. The resting pool contributes very little to transmitter release under normal circumstances, but can undergo exocytosis on extensive stimulation. A number of experiments cited here suggest that α-synuclein is involved in the mobilization of reserve–resting pool vesicles to RRP. First, synaptic responses to PRS, but not HFS, were severely deficient in α-synuclein mutant mice. Second, the impairment in responses to PRS in the _Snca−/−_synapses was more pronounced in lower [Ca2+]o. The mobilization of vesicles from the reserve–resting pool to RRP is thought to be facilitated by an increase in intracellular calcium, possibly through Ca2+ influx and activation of Ca2+–calmodulin-dependent kinase (CaMKII). A major target of CaMKII is synapsin I, a vesicle-associated protein that serves to restrict vesicles to the cytoskeleton (Greengard et al., 1993). Phosphorylation of synapsin I by CaMKII results in the dissociation of vesicles from the cytoskeleton and, therefore, mobilization of vesicles from the reserve pool to the RRP. Third, the recovery of synaptic responses after the depletion of the RRP was slower at the Snca−/−_synapses. The time course of recovery is believed to reflect the kinetics of refilling, or the mobilization of vesicles from the reserve–resting pool into, the RRP (Stevens and Wesseling, 1999). One could imagine that the refilling process is dependent on the concentration of vesicles or the size of the reserve–resting pool. Therefore, a reduction in the reserve–resting pool should result in a slower course of recovery time. However, although our EM experiments demonstrated a substantial reduction in the number of undocked vesicles in the Snca−/− synapses, it is unclear whether the PRS used in this study is able to recruit the resting pool vesicles into the other two pools. Consequently, we do not know whether the impairment in responses to PRS resulted from the inability of the_Snca−/− synapses to supply sufficient vesicles to the RRP because of a smaller reserve pool, resting pool, or both.
Two pieces of evidence indicate that the modulation of synaptic depression by α-synuclein may depend on intracellular Ca2+ concentrations: (1) an increase in [Ca2+]o diminished whereas a decrease in [Ca2+]o enlarged the difference in synaptic responses to PRS seen in_Snca+/+_ and_Snca−/−_ synapses. (2) An increase in the stimulation frequency of PRS also abolished the deficits of the_Snca−/−_ synapses. It is unclear exactly how an increase in intracellular Ca2+concentration could compensate for the synaptic depression phenotype. A reduction in the size of the reserve pool in_Snca−/−_ synapses is one possible explanation. During PRS-induced synaptic depression, the depletion of RRP is usually faster than the replenishment by the reserve pool vesicles. Assuming that the replenishment is dependent on the size of the reserve pool, a synapse with a smaller reserve pool will replenish the docked vesicles at a slower rate, leading to more pronounced synaptic depression. It is important to note that the reserve pool vesicles, even in the Snca−/− synapses were never completely exhausted during PRS. An equilibrium between depletion and replenishment is reached after 50 or so pulses (Fig.8A). Ca2+ is another factor known to facilitate vesicle mobilization, possibly through the phosphorylation of synapsin I by CaMKII. At a lower [Ca2+]o (0.5 mm), the number of vesicles available for replenishment may depend mostly on the size of the reserve pool and, there, the biggest difference in synaptic depression between_Snca+/+_ and_Snca−/−_ synapses is observed. An increase in [Ca2+]o to 5 mm may remove some of the restrictions on vesicle mobilization. Although the reserve pool sizes differ considerably, the numbers of vesicles available for replenishment now become quite similar in Snca+/+ and_Snca−/−_ synapses, resulting in very similar responses to PRS. Another possible explanation is that α-synuclein may shift the Ca2+dependence of vesicle mobilization. In other words, the_Snca−/−_ synapses may require higher intracellular Ca2+ to mobilize the reserve vesicles at the same rate as the Snca+/+synapses. At molecular levels, α-synuclein may somehow provide a good basis for vesicle mobilization, and deletion of the gene may slow down the replenishment of releasable pool vesicles. This phenotype was particularly obvious when the rate of mobilization was low, such as at low [Ca2+]o. A test of this idea would be to increase the rate of vesicle mobilization by stimulating the CA1 synapses at higher frequencies (30 Hz and 100 Hz). Indeed, the differences between_Snca+/+ and_Snca−/− synapses were almost eliminated when the stimulation frequency was increased to 30 Hz.
A major target of CaMKII is synapsin I, a vesicle-associated protein that serves to restrict vesicles to cytoskeleton (Greengard et al., 1993). The phosphorylation of synapsin I by CaMKII results in the dissociation of vesicles from cytoskeleton and, therefore, the mobilization of vesicles from the reserve pool to the RRP. Deletion of synapsin genes or inhibition of synapsin function by antibodies or a peptide inhibitor elicits phenotypes very similar to those of_Snca_−/−: a severe impairment in synaptic responses to RRP and a drastic reduction in the number of undocked vesicles (Chin et al., 1995; Li et al., 1995; Pieribone et al., 1995; Rosahl et al., 1995; Takei et al., 1995; Hilfiker et al., 1998). Therefore, it is possible that α-synuclein restricts the mobilization of synaptic vesicles and contributes to the formation of reserve–resting pools in ways very similar to synapsin I. Like α-synuclein, synapsin I appears to be a peripheral, rather than a transmembrane, vesicle protein; it is a substrate for protein kinases; and it has been found to interact with a vast array of proteins_in vitro_ (DeCamilli et al., 2001). Like synapsin I, α-synuclein can be phosphorylated in vivo by CaMKII, although it is a better substrate for casein kinases (Okochi et al., 2000). However, a major difference between the phenotype seen with synapsin-deficient mice and α-synuclein-deficient mice is that α-synuclein-deficient mice show no decrease in any of the synaptic proteins we examined, many of which were shown to be decreased in synaptosomal preparations from mice deficient in the synapsins. If the resting and reserve pools actually consist of multiple subpools of vesicles, it is possible that a deficiency of α-synuclein affects a subpool different from that affected by synapsin deficiency. Alternatively, the lack of change in synaptic vesicle proteins present in synaptosomal preparations from α-synuclein-deficient mice might indicate that the reduction in the reserve and resting pools may be attributable to mislocalization of the vesicles rather than to a quantitative reduction. At this stage, the exact relationship between the functions of the synapsins and α-synuclein in the formation or maintenance of the different vesicle clusters defined anatomically, such as docked (or distal) vesicles and the more proximal vesicle cluster, and pools defined electrophysiologically, such as the readily releasable, recycling, or reserve pools, remains to be fully delineated. The α-synuclein knock-out mice should be helpful in studies aimed at understanding synaptic vesicle regulation and turnover and defining the relationship between various pools of synaptic vesicles defined previously by either functional or ultrastructural criteria.
*
D.E.C. and K.S. contributed equally to this work.
This work was supported by the Intramural Research Programs of the National Human Genome Research Institute, the National Institute of Child Health and Human Development, and the National Institute for Neurological Diseases and Stroke. We thank Dr. Suzana Gispert and Lisa Garrett, David Bernard, and Thanh-Truc Hunyh.
Correspondence should be addressed to Dr. Robert Nussbaum, Genetic Disease Research Branch, National Human Genome Research Institute, 49/4A72, 49 Convent Drive, MSC 4472, Bethesda, MD 20892-4472. E-mail:rlnuss@nhgri.nih.gov; or Dr. Bai Lu, Unit on Synapse Development and Plasticity, Laboratory of Cellular and Synaptic Neurophysiology, National Institute of Child Health and Human Development, 49/6A80, 49 Convent Drive, MSC 4448, Bethesda, MD 20892-4448. E-mail:lub@codon.nih.gov.
REFERENCES
- 1.Abeliovich A, Schmitz Y, Farinas I, Choi-Lundberg D, Ho WH, Castillo PE, Shinsky N, Verdugo JM, Armanini M, Ryan A, Hynes M, Phillips H, Sulzer D, Rosenthal A. Mice lacking α-synuclein display functional deficits in the nigrostriatal dopamine system. Neuron. 2000;25:239–252. doi: 10.1016/s0896-6273(00)80886-7. [DOI] [PubMed] [Google Scholar]
- 2.Castro-Alamancos MA, Connors BW. Distinct forms of short-term plasticity at excitatory synapses of hippocampus and neocortex. Proc Natl Acad Sci USA. 1997;94:4161–4166. doi: 10.1073/pnas.94.8.4161. [DOI] [PMC free article] [PubMed] [Google Scholar]
- 3.Chin LS, Li L, Ferreira A, Kosik KS, Greengard P. Impairment of axonal development and of synaptogenesis in hippocampal neurons of synapsin I-deficient mice. Proc Natl Acad Sci USA. 1995;92:9230–9234. doi: 10.1073/pnas.92.20.9230. [DOI] [PMC free article] [PubMed] [Google Scholar]
- 4.Clayton DF, George JM. Synucleins in synaptic plasticity and neurodegenerative disorders. J Neurosci Res. 1999;58:120–129. [PubMed] [Google Scholar]
- 5.Davidson WS, Jonas A, Clayton DF, George JM. Stabilization of α-synuclein secondary structure upon binding to synthetic membranes. J Biol Chem. 1998;273:9443–9449. doi: 10.1074/jbc.273.16.9443. [DOI] [PubMed] [Google Scholar]
- 6.DeCamilli P, Haucke V, Takei K, Mugnami E. The structure of synapses. In: Cowan WM, Stevens CF, editors. Synapses. Johns Hopkins UP; Baltimore: 2001. pp. 89–134. [Google Scholar]
- 7.Dobrunz LE, Stevens CF. Heterogeneity of release probability, facilitation, and depletion at central synapses. Neuron. 1997;18:995–1008. doi: 10.1016/s0896-6273(00)80338-4. [DOI] [PubMed] [Google Scholar]
- 8.Geppert M, Bolshakov VY, Siegelbaum SA, Takei K, De Camilli P, Hammer RE, Sudhof TC. The role of Rab3A in neurotransmitter release. Nature. 1994;369:493–497. doi: 10.1038/369493a0. [DOI] [PubMed] [Google Scholar]
- 9.Geppert M, Goda Y, Stevens CF, Sudhof TC. The small GTP-binding protein Rab3A regulates a late step in synaptic vesicle fusion. Nature. 1997;387:810–814. doi: 10.1038/42954. [DOI] [PubMed] [Google Scholar]
- 10.Greengard P, Valtorta F, Czernik AJ, Benfenati F. Synaptic vesicle phosphoproteins and regulation of synaptic function. Science. 1993;259:780–785. doi: 10.1126/science.8430330. [DOI] [PubMed] [Google Scholar]
- 11.Harlow E, Lane D. Antibodies, a laboratory manual. Cold Spring Harbor Laboratory; Cold Spring Harbor, NY: 1988. [Google Scholar]
- 12.Hilfiker S, Schweizer FE, Kao HT, Czernik AJ, Greengard P, Augustine GJ. Two sites of action for synapsin domain E in regulating neurotransmitter release. Nat Neurosci. 1998;1:29–35. doi: 10.1038/229. [DOI] [PubMed] [Google Scholar]
- 13.Jakes R, Spillantini MG, Goedert M. Identification of two distinct synucleins from human brain. FEBS Lett. 1994;345:27–32. doi: 10.1016/0014-5793(94)00395-5. [DOI] [PubMed] [Google Scholar]
- 14.Katz B, Miledi R. The role of calcium in neuromuscular facilitation. J Physiol (Lond) 1968;195:481–492. doi: 10.1113/jphysiol.1968.sp008469. [DOI] [PMC free article] [PubMed] [Google Scholar]
- 15.Kimber WL, Hsieh P, Hirotsune S, Yuva-Paylor L, Sutherland HF, Chen A, Ruiz-Lozano P, Hoogstraten-Miller SL, Chien KR, Paylor R, Scambler PJ, Wynshaw-Boris A. Deletion of 150 kb in the minimal DiGeorge/velocardiofacial syndrome critical region in mouse. Hum Mol Genet. 1999;8:2229–2237. doi: 10.1093/hmg/8.12.2229. [DOI] [PubMed] [Google Scholar]
- 16.Kruger R, Kuhn W, Muller T, Woitalla D, Graeber S, Kosel S, Przuntek H, Epplen JTS, L., Riess O. Ala30Pro mutation in the gene encoding α-synuclein in Parkinson's disease. Nat Genet. 1998;18:106–108. doi: 10.1038/ng0298-106. [DOI] [PubMed] [Google Scholar]
- 17.Larkman AU, Jack JJ, Stratford KJ. Quantal analysis of excitatory synapses in rat hippocampal CA1 in vitro during low-frequency depression. J Physiol (Lond) 1997;505:457–471. doi: 10.1111/j.1469-7793.1997.457bb.x. [DOI] [PMC free article] [PubMed] [Google Scholar]
- 18.Lee FJ, Liu F, Pristupa ZB, Niznik HB. Direct binding and functional coupling of alpha-synuclein to the dopamine transporters accelerate dopamine-induced apoptosis. FASEB J. 2001;15:916–926. doi: 10.1096/fj.00-0334com. [DOI] [PubMed] [Google Scholar]
- 19.Li L, Chin LS, Shupliakov O, Brodin L, Sihra TS, Hvalby O, Jensen V, Zheng D, McNamara JO, Greengard P, Andersen P. Impairment of synaptic vesicle clustering and of synaptic transmission, and increased seizure propensity, in synapsin I-deficient mice. Proc Natl Acad Sci USA. 1995;92:9235–9239. doi: 10.1073/pnas.92.20.9235. [DOI] [PMC free article] [PubMed] [Google Scholar]
- 20.Marquez-Sterling NR, Lo AC, Sisodia SS, Koo EH. Trafficking of cell-surface beta-amyloid precursor protein: evidence that a sorting intermediate participates in synaptic vesicle recycling. J Neurosci. 1997;17:140–151. doi: 10.1523/JNEUROSCI.17-01-00140.1997. [DOI] [PMC free article] [PubMed] [Google Scholar]
- 21.Mezey E, Dehejia AM, Harta G, Suchy SF, Nussbaum RL, Brownstein MJ, Polymeropoulos MH. α-Synuclein is present in Lewy bodies in sporadic Parkinson's disease. Mol Psychiatry. 1998;3:493–9. doi: 10.1038/sj.mp.4000446. [DOI] [PubMed] [Google Scholar]
- 22.Miller SA, Dykes DD, Polesky HF. A simple salting out procedure for extracting DNA from human nucleated cells. Nucleic Acids Res. 1988;16:1215. doi: 10.1093/nar/16.3.1215. [DOI] [PMC free article] [PubMed] [Google Scholar]
- 23.Murphy DD, Rueter SM, Trojanowski JQ, Lee VM. Synucleins are developmentally expressed, and alpha-synuclein regulates the size of the presynaptic vesicular pool in primary hippocampal neurons. J Neurosci. 2000;20:3214–3220. doi: 10.1523/JNEUROSCI.20-09-03214.2000. [DOI] [PMC free article] [PubMed] [Google Scholar]
- 24.Murthy VN, Stevens CF. Reversal of synaptic vesicle docking at central synapses. Nat Neurosci. 1999;2:503–507. doi: 10.1038/9149. [DOI] [PubMed] [Google Scholar]
- 25.O'Farrell PH. High resolution two-dimensional electrophoresis of proteins. J Biol Chem. 1975;250:4007–4021. [PMC free article] [PubMed] [Google Scholar]
- 26.Okochi M, Walter J, Koyama A, Nakajo S, Baba M, Iwatsubo T, Meijer L, Kahle PJ, Haass C. Constitutive phosphorylation of the Parkinson's disease associated α-synuclein. J Biol Chem. 2000;275:390–397. doi: 10.1074/jbc.275.1.390. [DOI] [PubMed] [Google Scholar]
- 27.Paylor R, Nguyen M, Crawley JN, Patrick J, Beaudet A, Orr-Urtreger A. Alpha7 nicotinic receptor subunits are not necessary for hippocampal-dependent learning or sensorimotor gating: a behavioral characterization of Acra7-deficient mice. Learn Mem. 1998;5:302–316. [PMC free article] [PubMed] [Google Scholar]
- 28.Peier AM, McIlwain KL, Kenneson A, Warren ST, Paylor R, Nelson DL. (Over)correction of FMR1 deficiency with YAC transgenics: behavioral and physical features. Hum Mol Genet. 2000;9:1145–1159. doi: 10.1093/hmg/9.8.1145. [DOI] [PubMed] [Google Scholar]
- 29.Pieribone VA, Shupliakov O, Brodin L, Hilfiker-Rothenfluh S, Czernik AJ, Greengard P. Distinct pools of synaptic vesicles in neurotransmitter release. Nature. 1995;375:493–497. doi: 10.1038/375493a0. [DOI] [PubMed] [Google Scholar]
- 30.Polymeropoulos MH, Lavedan C, Leroy E, Ide SE, Dehejia A, Dutra A, Pike B, Root H, Rubenstein J, Boyer R, Stenroos ES, Chandrasekharappa S, Athanassiadou A, Papapetropoulos T, Johnson WG, Lazzarini AM, Duvoisin RC, Di Iorio G, Golbe LI, Nussbaum RL. Mutation in the α-synuclein gene identified in families with Parkinson's disease. Science. 1997;276:2045–2047. doi: 10.1126/science.276.5321.2045. [DOI] [PubMed] [Google Scholar]
- 31.Pozzo-Miller LD, Gottschalk W, Zhang L, McDermott K, Du J, Gopalakrishnan R, Oho C, Sheng ZH, Lu B. Impairments in high-frequency transmission, synaptic vesicle docking, and synaptic protein distribution in the hippocampus of BDNF knockout mice. J Neurosci. 1999;19:4972–4983. doi: 10.1523/JNEUROSCI.19-12-04972.1999. [DOI] [PMC free article] [PubMed] [Google Scholar]
- 32.Pyle JL, Kavalali ET, Piedras-Renteria ES, Tsien RW. Rapid reuse of readily releasable pool vesicles at hippocampal synapses. Neuron. 2000;28:221–231. doi: 10.1016/s0896-6273(00)00098-2. [DOI] [PubMed] [Google Scholar]
- 33.Ralph RJ, Paulus MP, Geyer MA. Strain-specific effects of amphetamine on prepulse inhibition and patterns of locomotor behavior in mice. J Pharmacol Exp Ther. 2001;298:148–155. [PubMed] [Google Scholar]
- 34.Richards DA, Guatimosim C, Betz WJ. Two endocytic recycling routes selectively fill two vesicle pools in frog motor nerve terminals. Neuron. 2000;27:551–559. doi: 10.1016/s0896-6273(00)00065-9. [DOI] [PubMed] [Google Scholar]
- 35.Rosahl TW, Spillane D, Missler M, Herz J, Selig DK, Wolff JR, Hammer RE, Malenka RC, Sudhof TC. Essential functions of synapsins I and II in synaptic vesicle regulation. Nature. 1995;375:488–493. doi: 10.1038/375488a0. [DOI] [PubMed] [Google Scholar]
- 36.Ryan TA. Inhibitors of myosin light chain kinase block synaptic vesicle pool mobilization during action potential firing. J Neurosci. 1999;19:1317–1323. doi: 10.1523/JNEUROSCI.19-04-01317.1999. [DOI] [PMC free article] [PubMed] [Google Scholar]
- 37.Schikorski T, Stevens CF. Quantitative ultrastructural analysis of hippocampal excitatory synapses. J Neurosci. 1997;17:5858–5867. doi: 10.1523/JNEUROSCI.17-15-05858.1997. [DOI] [PMC free article] [PubMed] [Google Scholar]
- 38.Sharon R, Goldberg MS, Bar-Josef I, Betensky RA, Shen J, Selkoe DJ. α-Synuclein occurs in lipid-rich high molecular weight complexes, binds fatty acids, and shows homology to the fatty acid-binding proteins. Proc Natl Acad Sci USA. 2001;98:9110–9115. doi: 10.1073/pnas.171300598. [DOI] [PMC free article] [PubMed] [Google Scholar]
- 39.Spillantini MG, Schmidt ML, Lee VM, Trojanowski JQ, Jakes R, Goedert M. α-Synuclein in Lewy bodies. Nature. 1997;388:839–840. doi: 10.1038/42166. [DOI] [PubMed] [Google Scholar]
- 40.Stevens CF, Wesseling JF. Identification of a novel process limiting the rate of synaptic vesicle cycling at hippocampal synapses. Neuron. 1999;24:1017–1028. doi: 10.1016/s0896-6273(00)81047-8. [DOI] [PubMed] [Google Scholar]
- 41.Südhof TC. The synaptic vesicle cycle revisited. Neuron. 2000;28:317–320. doi: 10.1016/s0896-6273(00)00109-4. [DOI] [PubMed] [Google Scholar]
- 42.Takei Y, Harada A, Takeda S, Kobayashi K, Terada S, Noda T, Takahashi T, Hirokawa N. Synapsin I deficiency results in the structural change in the presynaptic terminals in the murine nervous system. J Cell Biol. 1995;131:1789–1800. doi: 10.1083/jcb.131.6.1789. [DOI] [PMC free article] [PubMed] [Google Scholar]
- 43.Touchman JW, Dehejia A, Chiba-Falek O, Cabin DE, Schwartz JR, Orrison BM, Polymeropoulos MH, Nussbaum RL. Human and mouse α-synuclein genes: comparative genomic sequence analysis and identification of a novel gene regulatory element. Genome Res. 2001;11:78–86. doi: 10.1101/gr.165801. [DOI] [PMC free article] [PubMed] [Google Scholar]
- 44.Wang JH, Kelly PT. Attenuation of paired-pulse facilitation associated with synaptic potentiation mediated by postsynaptic mechanisms. J Neurophysiol. 1997;78:2707–2716. doi: 10.1152/jn.1997.78.5.2707. [DOI] [PubMed] [Google Scholar]
- 45.Zucker RS. Short-term synaptic plasticity. Annu Rev Neurosci. 1989;12:13–31. doi: 10.1146/annurev.ne.12.030189.000305. [DOI] [PubMed] [Google Scholar]
