Experience-Dependent Plasticity of Mouse Visual Cortex in the Absence of the Neuronal Activity-Dependent Markeregr1/zif268 (original) (raw)
Abstract
Neuronal activity elicits a rapid increase in the expression of several immediate early genes (IEGs). To clarify a role for IEG response in activity-dependent development, we examined the contribution of the egr1/zif268 gene during visual cortical processing and plasticity in mice. We first analyzed the expression of egr1 mRNA in wild-type (WT) mice using Northern blot hybridization. In the visual cortex, expression of_egr1_ mRNA increased dramatically after eye opening, systemic injection of kainate, or 30 min of photostimulation after a brief (5 d) period of dark adaptation. Thus, the expression of_egr1_ is regulated by synaptic activity in the mouse visual cortex, as it is in other species (e.g., monkeys, cats, and rats).
To evaluate whether this transcription factor is directly involved in activity-dependent plasticity, mice lacking Egr1 were deprived of the use of one eye during the developmental critical period [postnatal day 24 (P24)–P34]. Extracellular in vivo single-unit recordings from the binocular zone of the visual cortex revealed that visual responses developed normally in egr1 knock-out (KO) mice. Moreover, a similarly significant shift of responsiveness in favor of the open eye was produced in both KO and WT mice by either brief (4 d) or long-term (>2 weeks) occlusion of one eye. There was no apparent compensation among egr2, egr3, or c-fos mRNA and protein expression in the visual cortex of egr1 KO mice.
Taken together, these results indicate that _egr1_is a useful marker of sensory input in mice but is not intrinsically necessary for the experience-dependent plasticity of the visual cortex. Our findings underscore a mechanistic distinction between sensory plasticity and long-lasting forms of synaptic potentiation in the hippocampus, for which egr1/zif268 was recently found to be essential.
Keywords: immediate early gene, transcription factor, monocular deprivation, ocular dominance, development, activity-dependent plasticity
In the mammalian visual cortex, synaptic modification induced by manipulation of the visual environment is prominent during a restricted critical period in early postnatal life (Hubel and Wiesel, 1970; Berardi et al., 2000). Brief suture of one eyelid at this time leads to a shift in the distribution of responsiveness in favor of the open eye in the visual cortex of young animals, such as kittens (Wiesel and Hubel, 1963) and rodents (Draeger, 1978; Fagiolini et al., 1994; Gordon and Stryker, 1996; Fagiolini and Hensch, 2000). Physiological changes quickly disconnect the deprived eye from neurons in the visual cortex (Trachtenberg et al., 2000), followed by a more gradual anatomical reorganization of geniculocortical afferents (Antonini and Stryker, 1993, Antonini et al., 1999). Rapid genomic responses to neuronal stimulation may play a crucial role in the transition from immediate functional synapse modification to long-term morphological stabilization.
Transcription factors of the immediate early gene (IEG) type are prime candidates to orchestrate changes in gene expression that may be required for long-lasting effects of synaptic plasticity accompanied by anatomical changes. Products of IEGs, such as c-Fos, cAMP response element-binding protein, and the early growth response (Egr) family, are thought to act as third messengers in the coupling of_trans_-synaptic stimuli to neuronal gene expression (Hughes and Dragunow, 1995; Herdegen and Leah, 1998). Among these, Zif268 (Christy et al., 1988), also termed Egr1 (Sukhatme et al., 1988), nerve growth factor-induced gene A (NGFT-A) (Milbrandt, 1987), Krox 24 (Lemaire et al., 1988), or ZENK (zif-268, egr-1, ngfi-a, krox24), is well known to be induced by pharmacological, electrical, and physiological stimuli in various brain regions (Beckmann and Wilce, 1997).
Particularly in the visual cortex, several pieces of evidence suggest that Egr1 may be a crucial candidate molecule for triggering activity-dependent modifications. First, zif268 mRNA expression in the rat visual cortex is markedly reduced by dark adaptation, intraocular injection of TTX, or systemic treatment with the NMDA receptor antagonist MK-801 (Worley et al., 1991). Second, monocular visual deprivation produces dramatic changes in_zif268_ mRNA and protein levels, revealing ocular dominance columns in the striate cortex of monkeys (Chaudhuri et al., 1997;Kaczmarek and Chaudhuri, 1997). Third, brief visual experience in cats reared in the dark (Rosen et al., 1992) and exposure to ambient laboratory light of cats or rats whose vision has adapted to the dark (Kaplan et al., 1996; Nedivi et al., 1996; Yamada et al., 1999) results in a rapid increase of zif268 mRNA and protein levels.
Recently, we identified an animal model with a disruption in ocular dominance plasticity (Hensch et al., 1998a). These mice lacked glutamic acid decarboxylase (GAD) 65 and had reduced GABA release, unbalanced GABA/glutamate ratios, and interestingly, an upregulated response of the transcription factor Egr1 on visual stimulation. However, there is no evidence that indicates a direct role for egr1 gene expression in synaptic modification of the visual cortex during development. Therefore, in this study we examined whether this transcription factor could be involved in the regulation of ocular dominance plasticity, using egr1 gene-targeted mice, given the absence of selective pharmacological inhibitors of IEGs.
MATERIALS AND METHODS
Mice. Mice carrying a targeted disruption of the_egr1_ gene [knock-out (KO) or wild-type (WT) mice] were used for Northern blot analysis (n = 89), extracellular single-unit recording (n = 32), and immunohistochemistry (n = 6). The egr1_gene-targeting vector contained a total of 10.5 kb of genomic DNA isolated from a 129SvEv strain library. The egr1 gene was disrupted by a polymerase II–neomycin cassette inserted into a_Pvu_II site that corresponds to nucleotide 817 in the sequence designated by Christy et al. (1988). The insertion of the cassette disrupted the egr1 coding sequence upstream of the zinc finger domain. Electroporation was performed on the_egr1 targeting vector into CC1.2 embryonic stem cells; clones that survived positive–negative selection were picked. Of 95 clones resistant to G418 and fialuridine, 9 contained a disrupted allele of the egr1 locus as detected by Southern blot analysis (B. G. Condie and M. R. Capecchi, unpublished observations). Mutant embryonic stem cell clones were injected into host embryos to derive chimeric mice, and several chimeras passed the mutation on to their offspring. The egr1 mouse strain was maintained as heterozygous animals on a 129SvEv–C57BL/6 hybrid genetic background. Homozygous females were infertile (Lee et al., 1996). Therefore, homozygous KO mice were produced by mating heterozygous breeding pairs that reproduced with normal Mendelian frequency and average litter sizes. Animals were maintained on a 12 hr light/dark (LD) cycle (except where noted for dark-adaptation experiments) and had access to food and water ad libitum.
RNA extraction. Mice were anesthetized with halothane and killed by cervical dislocation. The brains were removed and stored on ice, and a 4 mm width of occipital cortex from the caudal end of the corpus callosum to the occipital pole was rapidly dissected as visual cortex. In some experiments, the nonvisual frontal cortex and hippocampus were also removed. Total RNA was extracted by the acid guanidine isothiocyanate–phenol–chloroform method. Briefly, brain tissue was sonicated with 300 μl of solution D, which consisted of 4.5 m isothiocyanate and 0.1m 2-mercaptoethanol. Homogenates received, in order (in μl): 30 of 3 m sodium acetate, pH 4.2, 300 of water-saturated phenol, and 60 of chloroform/isoamyl alcohol (24:1). The mixture was incubated for 15 min on ice. After centrifugation at 8000 rpm at 4°C for 15 min, the aqueous phase (upper layer) was removed to a new tube containing 600 μl of isopropanol. The tube was placed at −20°C overnight and centrifuged at 10,000 rpm at 4°C for 20 min. The RNA pellet was dissolved in 30 μl of Tris–EDTA, pH 7.5.
Northern blot analysis. Northern blot analysis consisted of three parts: electrophoresis, electroblotting, and hybridization, according to a previous report (Mataga et al., 1996). First, denatured RNA (20 μg) in sampling buffer [50% formamide, 2.2m formaldehyde, and 1× 4-morpholinopropane sulfonic acid (MOPS) buffer, pH 7.0] was loaded onto a 1% agarose gel containing 0.44 m formaldehyde and run in 1× MOPS buffer at a constant voltage (110 V; 70 min). After electrophoresis, total RNA was transferred to a nylon membrane (Hybond N; Amersham Pharmacia Biotech, Little Chalfont, UK) by electroblotting (8 mV) in 1× Tris–acetate–EDTA buffer at room temperature overnight. After immobilization of RNA by UV irradiation, the filters were prehybridized overnight at room temperature in a buffer containing 50% formamide, 5× SSC, 50 mg/ml sheared and denatured salmon sperm DNA, and 5× Denhardt's solution. Complementary DNA probes (egr1, egr2, and egr3) were radiolabeled with [α-32P]d-CTP (NEG 513H10; New England Nuclear, Boston, MA) by the random priming method. Hybridization was performed in prehybridization buffer containing radiolabeled probes (1–2 × 10⁶ cpm/ml buffer) at 42°C. Filters were washed three times in 1× SSC and 0.1% SDS at room temperature for 5 min and in 0.2× SSC and 0.1% SDS at 62°C for 10–20 min. The filters were exposed to x-ray films at −80°C with intensifying screens (Fuji, Tokyo, Japan) for 1 day (egr1) or several days (egr2 or egr3). The autoradiographic signals corresponding to egr1, egr2, and _egr3_mRNA-specific hybridization were analyzed using NIH Image (version 1.6.7) and normalized by comparison with mRNA levels of a housekeeping gene, glyceraldehyde-3-phosphate dehydrogenase (G3PDH), except in Figure1B. Complementary DNA for mouse egr1 (zif268) (Christy et al., 1988) and rat egr3 (Yamagata et al., 1994) were kindly provided by Dr. D. Nathans (Howard Hughes Medical Institute, Johns Hopkins University School of Medicine, Baltimore, MD) and Dr. K. Yamagata (Tokyo Metropolitan Institute for Neuroscience, Tokyo, Japan), respectively.
Fig. 1.
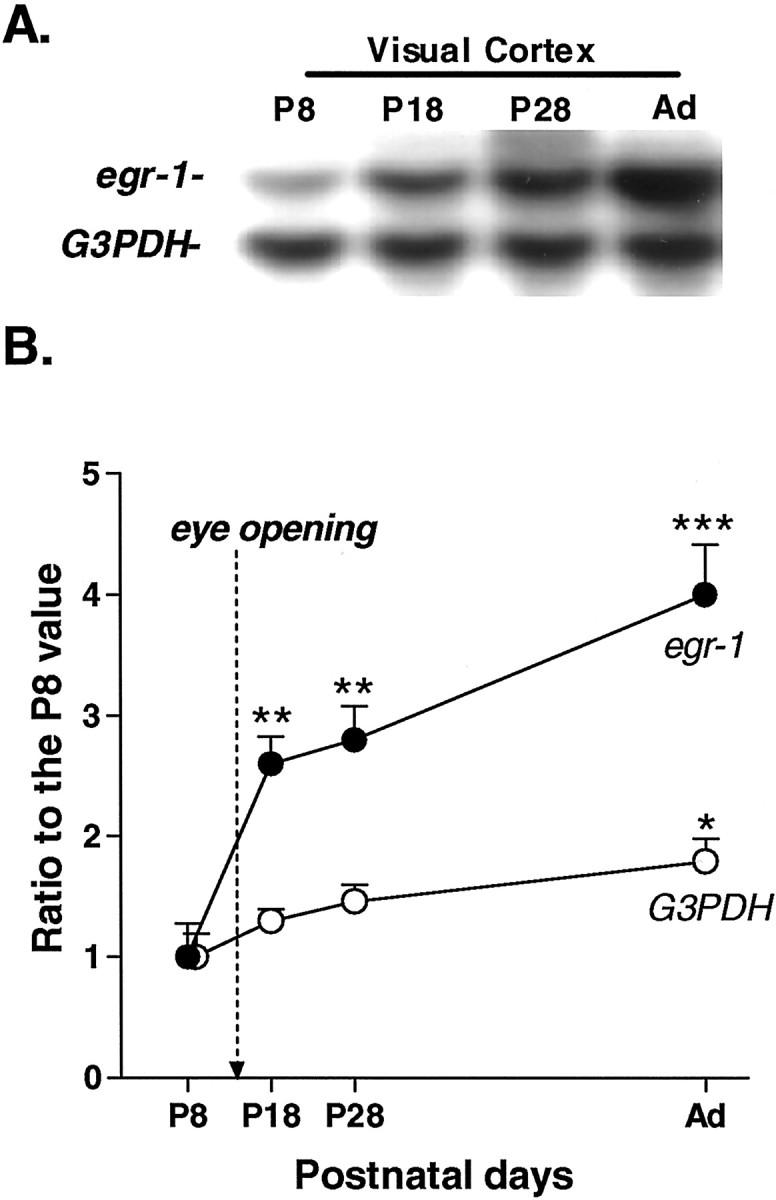
Normal expression of egr1 and_G3PDH_ mRNA in the visual cortex of WT mice.A, A typical Northern blot of egr1 and_G3PDH_ in the visual cortex at P8, P18, P28, and adulthood (Ad). B, Developmental profile of egr1 and G3PDH mRNA expression in the visual cortex of WT mice. Eye-opening occurs in mice at approximately P14. Mice were reared under a normal light/dark cycle and killed at approximately 4:00 P.M. Each point represents the mean ± SEM (n = 8). Arbitrary units for _egr1_were analyzed using NIH Image on a Macintosh computer. All values are expressed as ratios to egr1 or _G3PDH_intensity on P8 (*p < 0.05, **p < 0.01, ***p < 0.001 vs P8 by gene; Student's t test).
Drug administration. A potent, selective, and noncompetitive NMDA receptor antagonist, (+)MK-801 (Tocris Cookson Ltd., Bristol, UK), was dissolved in distilled water immediately before use and administered to WT mice (1 mg/kg, i.p.). The same volume of water was injected into control animals. Mice were anesthetized with halothane and killed by cervical dislocation 4 hr after a single MK-801 treatment. Kainic acid (KA) is a potent neuroexcitatory drug widely used in experimental studies of seizure activity (Sperk, 1994). Mice were killed under anesthesia 1 hr after intraperitoneal injection of KA (10 mg/kg in saline, pH 6).
Manipulation of visual input. Mice within the critical period for visual cortical plasticity [postnatal day 24 (P24)–P25] or adult mice (2–3 months of age) were placed under the following experimental conditions: (1) a standard 12 hr LD cycle, (2) 5 d of dark adaptation (DD) to determine the effect of reduced visual activity, and (3) exposure to photostimulation (PS) (0.5 Hz, 2 J flashes) for 30, 60, or 90 min. All experimental groups received food and water ad libitum, and all mice were killed at a similar time (in the evening) to avoid possible circadian effects. Dark-adapted animals were killed under red safety lights.
Extracellular recording of visual responses. In vivo recordings and analyses were performed according to previous reports (Gordon and Stryker, 1996; Hensch et al., 1998a,b). In brief, mice (P26–P36; weight, 10.6–22 g) were anesthetized with pentobarbital (50 mg/kg), and chlorprothixene (0.2 mg, i.m.; Sigma, St. Louis, MO), atropine (0.3 mg, s.c.), and dexamethasone (0.05 mg, s.c.) were administered. A bent glass capillary tube (outer diameter, 1.0 mm; inner diameter, 0.75 mm) was inserted caudally into the trachea just below the larynx. The animal was fixed to a stereotactic apparatus, and a plastic tube blowing 100% oxygen was placed in front of the opening of the trachea tube. Body temperature was kept at 37°C with the use of an animal blanket system (MK-900; Muromachi Kikai Co., Tokyo, Japan), and electrocardiography was performed and the heart rate was monitored throughout the experiment. The corneas were protected from drying with drops of 0.9% saline. For monocular deprivation (MD) experiments, one eyelid margin was trimmed and sutured shut under halothane anesthesia beginning at P17–P18 for long-term MD (>2 weeks) spanning the critical period, or just at its peak (P25–P27) for brief MD (4 d).
Using a tungsten microelectrode (3–5 MΩ; FHC Inc., Brunswick, ME), at least 20 visually active cells were recorded from the binocular zone in the primary visual cortex of each animal. In the case of MD mice, the electrode was inserted into the visual cortex contralateral to the deprived eye. The average distance between two successively recorded cells was ∼70 μm. Receptive-field properties of single units such as minimal response field, orientation preference, and direction selectivity were analyzed using a moving light slit on a screen placed 30 cm from the animal. Results are presented in the form of ocular dominance histograms according to the seven-group scheme of Wiesel and Hubel (1963). A contralateral bias index (CBI) was calculated as follows: CBI = [(_n_1 −_n_7) + (2/3)(_n_2 −_n_6) + (1/3)(_n_3 −_n_5) +N_]/2_N, where N equals the total number of cells and n_x equals number of cells with an ocular dominance score equal to_x.
Immunohistochemistry for Egr1, Egr2, and Egr3. Six mice (three WT mice and three KO mice) were deeply anesthetized with halothane and pentobarbital and then perfused transcardially with 0.9% saline and 4% paraformaldehyde. The brains were removed and immersed in buffered 30% sucrose solution overnight at 4°C. Using a freezing microtome, brain slices (50 μm) were cut for Nissl staining and immunohistochemistry for Egr1, Egr2, and Egr3. Free-floating sections were placed in 0.1% hydrogen peroxide solution for ∼2 hr. After washing, sections were incubated in 0.3% Triton X-100, 2.5% bovine serum albumin, 2% normal goat serum, and 10% block-ase (Dainippon Pharmaceutical Co. Ltd., Osaka, Japan) in 10 mm PBS overnight at 4°C. Sections were then placed in a solution containing rabbit polyclonal antisera selective for Egr1 (diluted 1:10,000; Santa Cruz Biotechnology, Santa Cruz, CA), Egr2 (diluted 1:5000), or Egr3 (diluted 1:5000) in PBS overnight at 4°C. Finally, sections were incubated with a biotinylated goat anti-rabbit IgG antibody (diluted 1:250; Vector Laboratories, Burlingame, CA) in PBS for 45 min and reacted with avidin–biotin complex (Vectastain Elite ABC kit; Vector Laboratories) followed by diaminobenzidine for chromogen formation.
RESULTS
Developmental time course of _egr1_mRNA expression
Sensory input plays a crucial role in the development and maintenance of plasticity in the mammalian visual cortex during early postnatal days, presumably via activity-dependent modulation of gene expression (Hughes and Dragunow, 1995; Kaczmarek and Chaudhuri, 1997). We first examined whether egr1 mRNA expression in the mouse visual cortex was associated with the onset of vision at eye opening (P14) with respect to a housekeeping gene, G3PDH, that is stably expressed in the visual cortex during development. The 1.2 kb_G3PDH_ transcript was found at high levels in the visual cortex from early postnatal days (P8) to adulthood. Its expression reached a maximum after eye opening (P18) and was maintained at that level during the following months. A significant difference in_G3PDH_ mRNA signal intensity was observed only between P8 and adulthood (p < 0.05). In contrast, expression of egr1 mRNA (∼3.2 kb) was barely detectable at P8 and then dramatically increased after eye opening (P18–P28) (Fig.1A,B). Expression of egr1 did not reach a peak value during the critical period (Fig. 1B,P28) but continued to increase, reaching its highest levels in adulthood (Fig. 1B, P28 vs_Ad_; p < 0.05).
Activity-dependent regulation of _egr1_mRNA expression
To determine whether egr1 mRNA expression was regulated by synaptic activity, drugs that pharmacologically block (MK-801) (Cole et al., 1989) or stimulate (KA) (Saffen et al., 1988) excitatory synaptic transmission through glutamate receptors were administered to WT mice during the critical period (P25–P28). In the cerebral cortex and hippocampus of WT mice, egr1 mRNA expression was markedly reduced (by 60%–70%) within 4 hr after systemic injection of MK-801 (1 mg/kg) (Fig. 2, _V_vs M). In contrast, expression of _egr1_mRNA was significantly increased by KA injection (10 mg/kg, i.p), becoming 10-fold higher within 1 hr in the hippocampus (Fig. 2,V vs K).
Fig. 2.

Regulated expression of egr1 mRNA by glutamate receptors in the hippocampus and visual and frontal cortex. Each bar indicates mean ± SEM (n = 7). M, Animals injected with MK-801 (1 mg/kg, i.p.) 4 hr before being killed; K, animals injected with kainic acid (10 mg/kg, i.p.) 1 hr before being killed; V, saline administered as vehicle solution. Quantitative autoradiographic signals corresponding to_egr1_ were normalized to G3PDH mRNA level (** p < 0.01, ***p < 0.001 vs vehicle by region; unpaired t test).
To ascertain a physiological role for the egr1 gene in the mouse visual cortex, we examined whether egr1 mRNA expression was regulated by natural sensory input (Worley et al., 1991;Rosen et al., 1992). Mice within the critical period physiologically (at P24–P25) were first reared under total darkness to reduce synaptic activity in the visual cortex. After 5 d of dark adaptation, the expression of egr1 in the visual cortex was found to be significantly reduced, to approximately half that of normally reared animals (Fig. 3A,DD vs LD; p < 0.05). Moreover, a threefold increase in egr1 mRNA was induced within 30 min of photostimulation (1 Hz, 20 J) after dark adaptation (Fig.3A, DD vs PS). After 30 min mRNA expression had reached a saturated level, as evidenced by the fact that photostimulation for 90 min induced almost the same amount of_egr1_ mRNA. In contrast, neither dark adaptation nor photostimulation for 30–90 min significantly altered _egr1_expression in the frontal cortex (Fig. 3B).
Fig. 3.

Effect of photostimulation on egr1_mRNA expression across the cerebral cortex of WT mice during the critical period. Top, Typical blots of_egr1 and G3PDH mRNA for the visual cortex (A) and frontal cortex (B).Bottom, Mean ± SEM (n = 3) of_egr1_ normalized to G3PDH values.LD, Mice reared under a normal light/dark cycle and killed during the light phase; DD, mice kept for 5 d in complete darkness (dark adaptation) and then killed under safety lights; PS, mice kept for 5 d in complete darkness and then killed after 30, 60, or 90 min of exposure to flash stimulation (1 Hz, 20 J) (*p < 0.05, **p < 0.01, ***p < 0.001 vs DD; unpaired t test).
The expression of egr1 mRNA or protein in the visual cortex is rapidly downregulated by sensory deprivation and reinduced by light exposure not only in young rats and kittens within their critical period but also in aplastic adult animals (Kaczmarek and Chaudhuri, 1997). Therefore, we confirmed that egr1 is regulated by visual input even in the visual cortex of adult mice. Normal levels of_egr1_ mRNA expression in adults were 1.5-fold higher than in young animals (Fig. 4, LD;p < 0.05). In contrast, there were no marked differences by age with regard to the steady-state level of_egr1_ expression after 5 d of dark adaptation or reinduction by 30 min of photostimulation (Fig. 4, A vs_B_).
Fig. 4.

Comparison of the photostimulation effect on_egr1_ mRNA expression between the visual cortices of young and adult WT mice. Young mice during the critical period (A) and adult mice (B) were reared under the following conditions: LD, Normal light/dark cycle and killed during the light phase; DD, 5 d in complete darkness (dark adaptation) and killed under safety lights;PS, 5 d under darkness and killed after 30 min of exposure to flash stimulation (1 Hz, 20 J) (*p < 0.05, **p < 0.01 vs DD; unpaired _t_test).
Effects of monocular deprivation during the critical period
In the rodent neocortex, visually active cells in the binocular zone respond to input from both eyes, representing the central 30–40° of the upper portion of each visual hemifield. Brief monocular occlusion during the sensitive period induces a clear shift in the ocular dominance of these neurons toward the open eye (Gordon and Stryker, 1996; Fagiolini and Hensch, 2000). Therefore, we examined how MD might affect a mouse visual cortex that lacks Egr1 (egr1 KO). Using single-unit recording, we confirmed that the binocular zone of egr1 KO and WT mice was localized similarly to that of C57BL/6 mice. Response quality to a moving light slit (retinotopy, response strength, habituation, receptive field size, and spontaneous activity) and ocular dominance distributions were normal when we recorded from nondeprived egr1 KO mouse visual cortex (Fig. 5, A vs_D_).
Fig. 5.

Effect of MD on ocular dominance in the visual cortex of WT and egr1 KO mice during the critical period. White bars, WT; Black bars,egr1 KO mice. The number of neurons per ocular dominance class is indicated at top of each bar.A, D, Distribution of ocular dominance scores recorded from the binocular zone of nondeprived animals (n = 3). B, E, Histogram contralateral to an eye deprived for 4 d starting from P25–P26 (STMD,n = 7 for B, n = 6 for E). C, F, Histograms after 2 weeks of MD beginning at P17–P18 (LTMD, n_= 7 for C, n = 6 for_F). The CBI for each cumulative histogram appears the top right corner of that histogram (see Materials and Methods).
Seven WT and six mutant mice underwent MD by short-term lid suture for 4 d beginning on P25 or P26 [short-term MD (STMD)]). We evaluated the change in ocular dominance distribution using a CBI, which takes values from 0 to 1 for complete ipsilateral or contralateral dominance, respectively. CBI values recorded contralateral to the deprived eye revealed significant and similar shifts toward the open, ipsilateral eye in both WT and egr1_KO mice (Fig. 5, WT, A vs B,p < 0.001; KO, D vs_E, p < 0.001; χ2 test). CBI values for individual animals are shown in Figure 6 (naive vs STMD; p < 0.001; t test). A significant reduction in CBI was also found in WT and egr1 KO mice after long-term MD (LTMD) for 2 weeks beginning on P17–P18, and did not differ significantly between genotypes (Fig. 5, WT,A vs C, p < 0.001;KO, D vs F, p < 0.001; χ2 test) (Fig. 6,naive vs LTMD; p < 0.001;t test). The magnitude of the effect of MD was similar between STMD and LTMD in the visual cortex of both WT and_egr1_ KO mice (Figs. 5 and 6).
Fig. 6.

Ocular dominance plasticity in the visual cortex of the WT and egr1 KO mouse. CBI values for individual animals were calculated as in Materials and Methods (Gordon and Stryker; 1996; Hensch et al., 1998a,b). Open symbols, WT; filled symbols, egr1 KO mice. The CBI values of both the STMD and LTMD groups were significantly lower than those of their respective nondeprived controls (p < 0.001 for all comparisons;t test).
Compensation in the egr1 knock-out mouse
Egr1 is a member of a family of IEGs encoding zinc-finger transcription factors. All members, including_egr2_ (krox 20), egr3(pilot), and egr4 (NGFI-C), recognize and regulate transcription through the egr DNA motif, GCG(G/C)GGGCG. Like egr1, the other egr_family genes are regulated by synaptic activity in the CNS (e.g., administration of the convulsants NMDA, kainate, or pentylenetetrazole induces egr1, egr2, and_egr3) (Yamagata et al., 1994; Beckmann et al., 1997). Therefore, we examined whether the Egr2 and/or Egr3 proteins were upregulated to take the place of Egr1 in the visual cortex of_egr1_ KO mice. Laminar localization of Egr1 protein in the visual cortex of mice was similar to that in cats and rats (Schlingensiepen et al., 1991; Kaplan et al., 1996; Yamada et al., 1999). High basal expression of Egr1 in WT visual cortex was found in neurons of all layers, except layers I and V (Fig.7C). In contrast, Egr2 and Egr3 immunoreactivities were much lower than that of Egr1 in WT visual cortex but exhibited a similar laminar profile (Fig.7C,E,G). Despite the complete absence of Egr1 in KO mice (Fig. 7D), there were no differences for either Egr2 (Fig.7, E vs F) or Egr3 (Fig. 7, _G_vs H) localization across genotypes.
Fig. 7.

Basal IEG protein expression in the binocular zone of the visual cortex in WT and egr1 KO mice, respectively. A, B, Nissl staining; C, D, Egr1 immunoreactivity; E, F, Egr2 immunoreactivity;G, H, Egr3 immunoreactivity in coronal sections. Scale bars: A, 1 mm; B–H, 500 μm.
Next, to compare the regulation of egr family members as well as c-fos gene expression by visual activity, animals were reared in a dark room for 5 d and then exposed to stroboscopic light stimulation for 30 min (Rosen et al., 1992; Mower, 1994). Normal expression of egr2, egr3, and_c-fos_ mRNAs was much weaker than that of egr1_mRNA, resembling their immunoreactivities (data not shown) (Kaczmarek and Chaudhuri, 1997). No significant differences were observed in egr2, egr3, or c-fos gene expression levels in the visual cortex between WT and KO mice reared in darkness for 5 d (Fig. 8,black bars). After 30 min of photostimulation following 5 d of dark adaptation, egr2, egr3, and_c-fos mRNA levels were increased to similar levels in the visual cortex of both WT and egr1 KO mice (Fig. 8,hatched bars). Thus, no apparent compensation in the localization, expression, or sensitivity of these other IEGs had occurred in the absence of Egr1.
Fig. 8.

Regulation of IEG mRNA expression in the visual cortex of WT and egr1 KO mice during the critical period. The effect of photostimulation on egr2(A), egr3(B), and c-fos(C) is compared between the visual cortex of WT and egr1 KO mice. DD, Mice (n = 3) reared for 5 d in complete darkness (dark adaptation) and killed under safety lights; PS, mice (n = 3) reared for 5 d under darkness and killed after 30 min of exposure to flash stimulation (1 Hz, 20 J) (*p < 0.05, **p < 0.01 vs DD value; unpaired t test).
DISCUSSION
We have examined whether an IEG, egr1/zif268, is regulated by synaptic activity in the mouse visual cortex and whether it plays a role in experience-dependent plasticity. We confirmed that expression of egr1 mRNA was dramatically increased with natural eye opening (P14), or throughout life by brief photostimulation after several days in darkness. Similar increases were also found after systemic injection of the convulsant agent KA. In contrast, basal levels of egr1 expression were reduced by a period of dark adaptation or pharmacological attenuation of excitatory synaptic transmission with an NMDA receptor antagonist. There was no apparent compensation by egr2, egr3, or _c-fos_genes in the egr1 KO mouse visual cortex in vivo. Nevertheless, we found robust visual responses that were significantly shifted toward the open eye in both WT and KO mice after MD during the critical period.
Development and activity-dependent regulation of_egr1_ in visual cortex
Normal expression of egr1 mRNA in the mammalian visual cortex, such as for cats (McCormack et al., 1992) or rats (Worley et al., 1991; Herms et al., 1994), is at a low level at birth and markedly increases after eye opening. Here, we confirmed a similar trend in the mouse visual cortex. However, detailed expression profiles differ among cats, rats, and mice as they continue to mature into adulthood. In the rodent visual cortex, there is no developmental peak of egr1_mRNA; it increases gradually until adulthood in the mouse visual cortex (Fig. 1) or reaches a plateau by P21 in the rat visual cortex (Worley et al., 1991; Kaczmarek and Chaudhuri, 1997). In contrast, the level of_egr1 in the cat visual cortex is much higher in younger animals (5–20 weeks) than in adults (McCormack et al., 1992). Susceptibility to MD peaks at approximately the fourth postnatal week in all three species (Hubel and Wiesel, 1970; Fagiolini et al., 1994;Berardi et al., 2000; Fagiolini and Hensch, 2000) and then declines markedly. Both the broader peak of egr1 expression in cats and the absence of any peak in rodents reflect a mismatch from the developmental critical period for sensory plasticity.
Molecular pathways involved in egr1 induction remain largely unknown (Hughes and Dragunow, 1995). It has been reported that glutamate receptor activation by agonists such as NMDA or KA affects IEG expression, including egr1, not only in the visual cortex but also in the hippocampus and striatum (Cole et al., 1989;Vaccarino et al., 1992; Beckmann et al., 1997). Our results are in agreement with those of previous studies. Glutamate is the putative neurotransmitter that propagates visual information from the lateral geniculate nucleus through the visual cortex (McCormick, 1992) and regulates egr1 expression in the mouse visual cortex (Fig.2). Consequently, natural stimuli, such as manipulations of the visual environment (Fig. 3), also dramatically affected egr1 mRNA expression in the mouse visual cortex, as described in other mammals (Worley et al., 1991; Rosen et al., 1992; Nedivi et al., 1996;Kaczmarek and Chaudhuri, 1997; Yamada et al., 1999). In particular, the profile of egr1 expression after photostimulation (30–90 min) was quite similar to previous observations in rats (Yamada et al., 1999).
Taken together, our findings indicate that egr1 is a useful marker for mapping physiological activity in the brain. Indeed, MD by enucleation, TTX injection, or eyelid suture dramatically reduces_egr1_ levels, revealing vertically oriented columns in the monkey visual cortex reflecting alternating right and left eye input (Chaudhuri and Cynader, 1993; Chaudhuri et al., 1995, 1997; Kaczmarek et al., 1999). Similar results have been obtained by studying retinal lesions in adult cats (Arckens et al., 2000) and enucleation in young rats (Hada et al., 1999). Interestingly, the egr1 response to photic stimuli is upregulated in GAD 65 KO mice, which have impaired ocular dominance plasticity (Hensch et al., 1998a). However, regulation of egr1 mRNA by visual input is not restricted to the critical period for plasticity in the rodent visual cortex (Fig. 4) (Worley et al., 1991; Yamagata et al., 1994; Kaczmarek and Chaudhuri, 1997). Total darkness for 1 week also yields a marked reduction in Egr1 immunoreactivity in the visual cortex of both 4-week-old and adult cats. However, brief light exposure after dark rearing induces a different laminar distribution of staining across ages (Kaplan et al., 1996). These findings led us to directly examine whether_egr1_ is involved in the regulation of ocular dominance plasticity or simply reflects neural activity.
Experience-dependent plasticity in visual cortex and other systems
Activity-regulated candidate molecules for synaptic plasticity have been identified in the hippocampus (Nedivi et al., 1993; Qian et al., 1993; Yamagata et al., 1994) and visual system (Prasad and Cynader, 1994; Corriveau et al., 1998; Nedivi, 1999; Prasad et al., 2000) using several molecular biological techniques, such as differential display. Among these, egr1, class I major histocompatibility complex (Corriveau et al., 1998), and_cpg15_ (Corriveau et al., 1999; Nedivi, 1999) are strongly correlated with activity-dependent modification in the visual cortex. Here, we established that the level of ocular dominance plasticity in_egr1_ KO mice was similar to that in WT mice, not only after brief, saturating MD but also with long-term MD that may induce morphological rearrangement (Antonini et al., 1999). These results indicate that Egr1 is not an essential molecule for ocular dominance plasticity in the mouse visual cortex.
Therefore, we wondered whether a usual role of Egr1 in ocular dominance plasticity might have been masked by redundant expression of other Egr family members, such as Egr2 or Egr3, or other IEGs, such as c-Fos, which may reflect the plasticity level in the cat visual cortex (Mower, 1994; Mower and Kaplan, 1999). Interestingly, Egr2 and Egr3 display DNA-binding specificities that are very similar to that seen with Egr1, and these proteins respond to pharmacological stimulators such as NMDA and KA just as Egr1 does (Beckmann and Wilce, 1997; Beckmann et al., 1997; O'Donovan et al., 1999). Furthermore, egr3 mRNA coexpresses with egr1 mRNA in subpopulations of neurons, and both mRNAs are reduced by MD (Yamagata et al., 1994). We found that in the visual cortex of egr1 KO mice (1) egr2,egr3, and c-fos mRNA expression of untreated animals was equal to that in WT mice; (2) the regulated expression of these genes by photostimulation was not significantly different from that in WT mice; and (3) laminar localization of the gene products, Egr2, and Egr3 was normal. Collectively, these results suggest that compensation among egr2, egr3, and_c-fos_ genes did not occur in egr1 KO mice.
Thus, not every gene that is responsive to activity is necessarily related to plasticity. A host of genes may be regulated by light in the visual cortex; some encode transcription factors, whereas others encode synaptic components and structural elements. We note the possibility that several transcription factors may be interchangeable with regard to participation even if they are not upregulated in the knock-out. There may also be something different about the regulation of transcription factors versus their downstream targets. Transcription factors could be “trigger sensitive,” and respond to any activity, whereas only a certain combination of factors or a second event may activate downstream “plasticity genes.” Alternatively, transcription may be in response to the eye being closed (Pham et al., 1999) rather than to an increase attributable to the activity of the open eye; this possibility could be tested with reverse suture or in animals with impaired ocular dominance plasticity (Hensch et al., 1998a,b).
Our egr1 KO mice exhibited no obvious developmental or behavioral defects, except for female infertility, as reported previously for a different line of NGFI-A KO mice (Lee et al., 1996). Several forms of plasticity associated with egr1_expression are also not impaired in the latter animals, including kindling development and associated mossy fiber sprouting (Zheng et al., 1998) as well as photic entrainment or phase shifting of the mouse circadian system (Kilduff et al., 1998). Importantly, however, a role for egr1 in hippocampal long-term potentiation (LTP) has received considerable support. The expression of IEGs after LTP induction is exemplified by an upregulation of zif268 in the dentate gyrus for several hours after tetanic stimulation (Cole et al., 1989; Abraham et al., 1991). The intriguing speculation that this time course underlies a conversion from short- to long-term forms of LTP was confirmed recently in yet another line of mice lacking_zif268 (Wei et al., 2000; Jones et al., 2001). This would seem to indicate that the transition from early to late phases of plasticity relies on different molecular mechanisms in the neocortex and hippocampus. Such a finding is consistent with several examples dissociating early LTP or long-term depression in the visual cortex from the effects of MD (Gordon et al., 1996; Hensch and Stryker, 1996;Kirkwood et al., 1997; Hensch et al., 1998a,b). Even within the hippocampus, changes in zif268 expression are not seen with LTP-inducing stimuli in either the CA1 region in vivo or in acute slices in vitro, revealing distinct subfield-specific programs of gene expression (French et al., 2001).
The findings described here demonstrate that egr1 is an excellent marker for synaptic activation by sensory input but may not be essential for experience-dependent plasticity in the neocortex. In monkeys, Zif268 accumulates in patches in the anterior temporal lobe during a particular visual stimulus–association learning paradigm but not for a simpler type of visual discrimination learning (Okuno and Miyashita, 1996). In the bird brain, ZENK expression reflects activation of the auditory pathway and is developmentally regulated in various song nuclei during the critical period for song acquisition (Jin and Clayton, 1997; Ribeiro and Mello, 2000). Both of these results suggest a specific role for Zif268 in activation of a gene cascade related to the formation of long-term memories; however, they may also reflect the attention demands of the behavioral task at hand. Indeed, repeated song presentation leads to a long-lasting decrement in the neuronal ZENK response in the songbird's caudomedial neostriatum, an auditory brain region analogous to portions of the mammalian auditory cortex (Mello et al., 1995). This may mirror a decrease in attention mediated by noradrenergic systems (Ribeiro and Mello, 2000). An intact noradrenaline network is necessary for basal expression of_zif268_ in the awake mammalian brain (Bhat and Baraban, 1992;Cirelli et al., 1996) but is not reflected in _zif268_regulation by visual stimulation (Yamada et al., 1999). Given the importance of modulatory systems for ocular dominance plasticity (Kasamatsu and Pettigrew, 1976), it will be of further interest to explore the role of Egr1 in the context of behavioral states and neocortical plasticity.
Footnotes
This work was supported by the Brain Science Institute, RIKEN, and by Grant-in-Aid for Scientific Research Project 11680814 from the Ministry of Education, Culture, Sports, Science, and Technology. We are grateful to Dr. K. Yamagata for kindly providing the cDNA probe to_egr3_ and for discussion of our work. Complementary DNA for egr1 was a generous gift from Dr. D. Nathans. We thank Dr. M. Silver for helpful discussions and Dr. M. R. Capecchi for support during the generation of the egr1 knock-out mouse.
Correspondence should be addressed to Takao K. Hensch, Laboratory for Neuronal Circuit Development, Brain Science Institute, RIKEN, 2-1 Hirosawa, Wako-shi, Saitama 351-0198 Japan. E-mail:hensch@postman.riken.go.jp.
REFERENCES
- 1.Abraham WC, Dragunow M, Tate WP. The role of immediate early genes in the stabilization of long-term potentiation. Mol Neurobiol. 1991;5:297–314. doi: 10.1007/BF02935553. [DOI] [PubMed] [Google Scholar]
- 2.Antonini A, Stryker MP. Rapid remodeling of axonal arbors in the visual cortex. Science. 1993;260:1819–1821. doi: 10.1126/science.8511592. [DOI] [PubMed] [Google Scholar]
- 3.Antonini A, Fagiolini M, Stryker MP. Anatomical correlates of functional plasticity in mouse visual cortex. J Neurosci. 1999;19:4388–4406. doi: 10.1523/JNEUROSCI.19-11-04388.1999. [DOI] [PMC free article] [PubMed] [Google Scholar]
- 4.Arckens L, Van Der Gucht E, Eysel UT, Orban GA, Vandesande F. Investigation of cortical reorganization in area 17 and nine extrastriate visual areas through the detection of changes in immediate early gene expression as induced by retinal lesions. J Comp Neurol. 2000;425:531–544. doi: 10.1002/1096-9861(20001002)425:4<531::aid-cne5>3.0.co;2-j. [DOI] [PubMed] [Google Scholar]
- 5.Beckmann AM, Wilce PA. Egr transcription factors in the nervous system. Neurochem Int. 1997;31:477–510. doi: 10.1016/s0197-0186(96)00136-2. [DOI] [PubMed] [Google Scholar]
- 6.Beckmann AM, Davidson MS, Goodenough S, Wilce PA. Differential expression of Egr1-like DNA-binding activities in the naive rat brain and after excitatory stimulation. J Neurochem. 1997;69:2227–2237. doi: 10.1046/j.1471-4159.1997.69062227.x. [DOI] [PubMed] [Google Scholar]
- 7.Berardi N, Pizzorusso T, Maffei L. Critical periods during sensory development. Curr Opin Neurobiol. 2000;10:138–145. doi: 10.1016/s0959-4388(99)00047-1. [DOI] [PubMed] [Google Scholar]
- 8.Bhat RV, Baraban JM. High basal expression of zif268 in cortex is dependent on intact noradrenergic system. Eur J Pharmacol. 1992;227:447–448. doi: 10.1016/0922-4106(92)90165-r. [DOI] [PubMed] [Google Scholar]
- 9.Chaudhuri A, Cynader MS. Activity-dependent expression of the transcription factor Zif268 reveals ocular dominance columns in monkey visual cortex. Brain Res. 1993;605:349–353. doi: 10.1016/0006-8993(93)91765-k. [DOI] [PubMed] [Google Scholar]
- 10.Chaudhuri A, Matsubara JA, Cynader MS. Neuronal activity in primate visual cortex assessed by immunostaining for the transcription factor Zif268. Vis Neurosci. 1995;12:35–50. doi: 10.1017/s095252380000729x. [DOI] [PubMed] [Google Scholar]
- 11.Chaudhuri A, Nissanov J, Larocque S, Rioux L. Dual activity maps in primate visual cortex produced by different temporal patterns of zif268 mRNA and protein expression. Proc Natl Acad Sci USA. 1997;94:2671–2675. doi: 10.1073/pnas.94.6.2671. [DOI] [PMC free article] [PubMed] [Google Scholar]
- 12.Christy BA, Lau LF, Nathans D. A gene activated in mouse 3T3 cells by serum growth factors encodes a protein with “zinc finger” sequences. Proc Natl Acad Sci USA. 1988;85:7857–7861. doi: 10.1073/pnas.85.21.7857. [DOI] [PMC free article] [PubMed] [Google Scholar]
- 13.Cirelli C, Pompeiano M, Tononi G. Neuronal gene expression in the waking state: a role for the locus coeruleus. Science. 1996;274:1211–1215. doi: 10.1126/science.274.5290.1211. [DOI] [PubMed] [Google Scholar]
- 14.Cole AJ, Saffen DW, Baraban JM, Worley PF. Rapid increase of an immediate early gene messenger RNA in hippocampal neurons by synaptic NMDA receptor activation. Nature. 1989;340:474–476. doi: 10.1038/340474a0. [DOI] [PubMed] [Google Scholar]
- 15.Corriveau RA, Huh GS, Shatz CJ. Regulation of class I MHC gene expression in the developing and mature CNS by neural activity. Neuron. 1998;21:505–520. doi: 10.1016/s0896-6273(00)80562-0. [DOI] [PubMed] [Google Scholar]
- 16.Corriveau RA, Shatz CJ, Nedivi E. Dynamic regulation of cpg15 during activity-dependent synaptic development in the mammalian visual system. J Neurosci. 1999;19:7999–8008. doi: 10.1523/JNEUROSCI.19-18-07999.1999. [DOI] [PMC free article] [PubMed] [Google Scholar]
- 17.Draeger UC. Observations on monocular deprivation in mice. J Neurophysiol. 1978;41:28–42. doi: 10.1152/jn.1978.41.1.28. [DOI] [PubMed] [Google Scholar]
- 18.Fagiolini M, Hensch TK. Inhibitory threshold for critical-period activation in primary visual cortex. Nature. 2000;404:183–186. doi: 10.1038/35004582. [DOI] [PubMed] [Google Scholar]
- 19.Fagiolini M, Pizzorusso T, Berardi N, Domenici L, Maffei L. Functional postnatal development of the rat primary visual cortex and the role of visual experience: dark rearing and monocular deprivation. Vision Res. 1994;34:709–720. doi: 10.1016/0042-6989(94)90210-0. [DOI] [PubMed] [Google Scholar]
- 20.French PJ, O'Connor V, Jones MW, Davis S, Errington ML, Voss K, Truchet B, Wotjak C, Stean T, Doyere V, Maroun M, Laroche S, Bliss TVP. Subfield-specific immediate early gene expression associated with hippocampal long-term potentiation in vivo. Eur J Neurosci. 2001;13:968–976. doi: 10.1046/j.0953-816x.2001.01467.x. [DOI] [PubMed] [Google Scholar]
- 21.Gordon JA, Stryker MP. Experience-dependent plasticity of binocular responses in the primary visual cortex of the mouse. J Neurosci. 1996;16:3274–3286. doi: 10.1523/JNEUROSCI.16-10-03274.1996. [DOI] [PMC free article] [PubMed] [Google Scholar]
- 22.Gordon JA, Cioffi D, Silva AJ, Stryker MP. Deficient plasticity in the primary visual cortex of α-calcium/calmodulin-dependent protein kinase II mutant mice. Neuron. 1996;17:491–499. doi: 10.1016/s0896-6273(00)80181-6. [DOI] [PubMed] [Google Scholar]
- 23.Hada Y, Yamada Y, Imamura K, Mataga N, Watanabe Y, Yamamoto M. Effects of monocular enucleation on parvalbumin in rat visual system during postnatal development. Invest Ophthalmol Vis Sci. 1999;40:2535–2545. [PubMed] [Google Scholar]
- 24.Hensch TK, Stryker MP. Ocular dominance plasticity under metabotropic glutamate receptor blockade. Science. 1996;272:554–557. doi: 10.1126/science.272.5261.554. [DOI] [PubMed] [Google Scholar]
- 25.Hensch TK, Fagiolini M, Mataga N, Stryker MP, Baekkeskov S, Kash SF. Local GABA circuit control of experience-dependent plasticity in developing visual cortex. Science. 1998a;282:1504–1508. doi: 10.1126/science.282.5393.1504. [DOI] [PMC free article] [PubMed] [Google Scholar]
- 26.Hensch TK, Gordon JA, Brandon EP, McKnight GS, Idzerda RL, Stryker MP. Comparison of plasticity in vivo and in vitro in the developing visual cortex of normal and protein kinase A RIβ-deficient mice. J Neurosci. 1998b;18:2108–2117. doi: 10.1523/JNEUROSCI.18-06-02108.1998. [DOI] [PMC free article] [PubMed] [Google Scholar]
- 27.Herdegen T, Leah JD. Inducible and constitutive transcription factors in the mammalian nervous system: control of gene expression by Jun, Fos and Krox, and CREB/ATF proteins. Brain Res Brain Res Rev. 1998;28:370–490. doi: 10.1016/s0165-0173(98)00018-6. [DOI] [PubMed] [Google Scholar]
- 28.Herms J, Zurmöhle U, Schlingensiepen R, Brysch W, Schlingensiepen K-H. Developmental expression of the transcription factor zif268 in rat brain. Neurosci Lett. 1994;165:171–174. doi: 10.1016/0304-3940(94)90737-4. [DOI] [PubMed] [Google Scholar]
- 29.Hubel DH, Wiesel TN. The period of susceptibility to the physiological effects of unilateral eye closure in kittens. J Physiol (Lond) 1970;206:419–436. doi: 10.1113/jphysiol.1970.sp009022. [DOI] [PMC free article] [PubMed] [Google Scholar]
- 30.Hughes P, Dragunow M. Induction of immediate early genes and the control of neurotransmitter-regulated gene expression within the nervous system. Pharmacol Rev. 1995;47:133–178. [PubMed] [Google Scholar]
- 31.Jin H, Clayton DF. Localized changes in immediate-early gene regulation during sensory and motor learning in zebra finches. Neuron. 1997;19:1049–1059. doi: 10.1016/s0896-6273(00)80396-7. [DOI] [PubMed] [Google Scholar]
- 32.Jones MW, Errington ML, French PJ, Fine A, Bliss TVP, Garel S, Charnay P, Bozon B, Laroche S, Davis S. A requirement for the immediate early gene Zif268 in the expression of late LTP and long-term memories. Nat Neurosci. 2001;4:289–296. doi: 10.1038/85138. [DOI] [PubMed] [Google Scholar]
- 33.Kaczmarek L, Chaudhuri A. Sensory regulation of immediate-early gene expression in mammalian visual cortex: implications for functional mapping and neural plasticity. Brain Res Brain Res Rev. 1997;23:237–256. doi: 10.1016/s0165-0173(97)00005-2. [DOI] [PubMed] [Google Scholar]
- 34.Kaczmarek L, Zangenehpour S, Chaudhuri A. Sensory regulation of immediate-early genes c-fos and zif268 in monkey visual cortex at birth and throughout the critical period. Cereb Cortex. 1999;9:179–187. doi: 10.1093/cercor/9.2.179. [DOI] [PubMed] [Google Scholar]
- 35.Kaplan IV, Guo Y, Mower GD. Immediate early gene expression in cat visual cortex during and after the critical period: differences between EGR-1 and Fos proteins. Brain Res Mol Brain Res. 1996;36:12–22. doi: 10.1016/0169-328x(95)00228-k. [DOI] [PubMed] [Google Scholar]
- 36.Kasamatsu T, Pettigrew JD. Depletion of brain catecholamines: failure of ocular dominance shift after monocular occlusion in kittens. Science. 1976;194:206–209. doi: 10.1126/science.959850. [DOI] [PubMed] [Google Scholar]
- 37.Kilduff T, Vugrinic C, Lee S, Milbrandt J, Mikkelsen J, O'Hara B, Heller H. Characterization of the circadian system of NGFI-A and NGFI-A/NGFI-B deficient mice. J Biol Rhythms. 1998;13:347–357. doi: 10.1177/074873098129000174. [DOI] [PubMed] [Google Scholar]
- 38.Kirkwood A, Silva A, Bear MF. Age-dependent decrease of synaptic plasticity in the neocortex of αCaMKII mutant mice. Proc Natl Acad Sci USA. 1997;94:3380–3383. doi: 10.1073/pnas.94.7.3380. [DOI] [PMC free article] [PubMed] [Google Scholar]
- 39.Lee S, Sadovsky Y, Swirnoff A, Polish J, Goda P, Gavrilina G, Milbrandt J. Luteinzing hormone deficiency and female infertility in mice lacking the transcription factor NGFI-A(Egr1). Science. 1996;273:1219–1221. doi: 10.1126/science.273.5279.1219. [DOI] [PubMed] [Google Scholar]
- 40.Lemaire P, Revelant O, Bravo R, Charnay P. Two genes encoding potential transcription factors with identical DNA-binding domains are activated by growth factors in cultured cells. Proc Natl Acad Sci USA. 1988;85:4691–4695. doi: 10.1073/pnas.85.13.4691. [DOI] [PMC free article] [PubMed] [Google Scholar]
- 41.Mataga N, Imamura K, Shiomitsu T, Yoshimura Y, Fukamauchi F, Watanabe Y. Enhancement of mRNA expression of tissue-type plasminogen activator by l-threo-3,4-dihydrophenylserine in association with ocular dominance plasticity. Neurosci Lett. 1996;218:149–152. doi: 10.1016/s0304-3940(96)13139-6. [DOI] [PubMed] [Google Scholar]
- 42.McCormack MA, Rosen KM, Villa-Komaroff L, Mower GD. Changes in immediate early gene expression during postnatal development of cat cortex and cerebellum. Brain Res Mol Brain Res. 1992;12:215–223. doi: 10.1016/0169-328x(92)90087-r. [DOI] [PubMed] [Google Scholar]
- 43.McCormick DA. Neurotransmitter actions in the thalamus and cerebral cortex and their role in neuromodulation of thalamo-cortical activity. Prog Neurobiol. 1992;39:337–388. doi: 10.1016/0301-0082(92)90012-4. [DOI] [PubMed] [Google Scholar]
- 44.Mello CV, Nottebohm F, Clayton D. Repeated exposure to one song leads to a rapid and persistent decline in an immediate early gene's response to that song in zebra finch telencephalon. J Neurosci. 1995;15:6919–6925. doi: 10.1523/JNEUROSCI.15-10-06919.1995. [DOI] [PMC free article] [PubMed] [Google Scholar]
- 45.Milbrandt J. A nerve growth factor-induced gene encodes a possible transcriptional regulatory factor. Science. 1987;238:797–799. doi: 10.1126/science.3672127. [DOI] [PubMed] [Google Scholar]
- 46.Mower GD. Differences in the induction of Fos protein in cat visual cortex during and after the critical period. Brain Res Mol Brain Res. 1994;21:47–54. doi: 10.1016/0169-328x(94)90376-x. [DOI] [PubMed] [Google Scholar]
- 47.Mower GD, Kaplan IV. Fos expression during the critical period in visual cortex: differences between normal and dark reared cats. Brain Res Mol Brain Res. 1999;64:264–269. doi: 10.1016/s0169-328x(98)00333-7. [DOI] [PubMed] [Google Scholar]
- 48.Nedivi E. Molecular analysis of developmental plasticity in neocortex. J Neurobiol. 1999;41:135–147. [PMC free article] [PubMed] [Google Scholar]
- 49.Nedivi E, Hevroni D, Naot D, Israeli D, Citri Y. Numerous candidate plasticity-related genes revealed by differential cDNA cloning. Nature. 1993;363:718–722. doi: 10.1038/363718a0. [DOI] [PubMed] [Google Scholar]
- 50.Nedivi E, Fieldust S, Theill LE, Hevroni D. A set of genes expressed in response to light in the adult cerebral cortex and regulated during development. Proc Natl Acad Sci USA. 1996;93:2048–2053. doi: 10.1073/pnas.93.5.2048. [DOI] [PMC free article] [PubMed] [Google Scholar]
- 51.O'Donovan KJ, Tourtellotte WG, Milbrandt J, Baraban JM. The EGR family of transcription-regulatory factors: progress at the interface of molecular and systems neuroscience. Trends Neurosci. 1999;22:167–173. doi: 10.1016/s0166-2236(98)01343-5. [DOI] [PubMed] [Google Scholar]
- 52.Okuno H, Miyashita Y. Expression of the transcription factor Zif268 in the temporal cortex of monkeys during visual paired associate learning. Eur J Neurosci. 1996;8:2118–2128. doi: 10.1111/j.1460-9568.1996.tb00733.x. [DOI] [PubMed] [Google Scholar]
- 53.Pham TA, Impey S, Storm DR, Stryker MP. CRE-mediated gene transcription in neocortical neuronal plasticity during the developmental critical period. Neuron. 1999;22:63–72. doi: 10.1016/s0896-6273(00)80679-0. [DOI] [PubMed] [Google Scholar]
- 54.Prasad SS, Cynader MS. Identification of cDNA clones expressed selectively during the critical period for visual cortex development by subtractive hybridization. Brain Res. 1994;639:73–84. doi: 10.1016/0006-8993(94)91766-3. [DOI] [PubMed] [Google Scholar]
- 55.Prasad SS, Kojic LZ, Lee SS, Chaudhuri A, Hetherington P, Cynader MS. Identification of differentially expressed genes in the visual structures of brain using high-density cDNA grids. Brain Res Mol Brain Res. 2000;82:11–24. doi: 10.1016/s0169-328x(00)00172-8. [DOI] [PubMed] [Google Scholar]
- 56.Qian Z, Gilbert ME, Colicos MA, Kandel ER, Kuhl D. Tissue-plasminogen activator is induced as an immediate-early gene during seizure, kindling and long-term potentiation. Nature. 1993;361:453–457. doi: 10.1038/361453a0. [DOI] [PubMed] [Google Scholar]
- 57.Ribeiro S, Mello CV. Gene expression and synaptic plasticity in the auditory forebrain of songbirds. Learn Mem. 2000;7:235–243. doi: 10.1101/lm.34400. [DOI] [PubMed] [Google Scholar]
- 58.Rosen KM, McCormack MA, Villa-Komaroff L, Mower GD. Brief visual experience induces immediate early gene expression in the cat visual cortex. Proc Natl Acad Sci USA. 1992;89:5437–5441. doi: 10.1073/pnas.89.12.5437. [DOI] [PMC free article] [PubMed] [Google Scholar]
- 59.Saffen DW, Cole AJ, Worley PF, Christy BA, Ryder K, Baraban JM. Convulsant-induced increase in transcription factor messenger RNAs in rat brain. Proc Natl Acad Sci USA. 1988;85:775–779. doi: 10.1073/pnas.85.20.7795. [DOI] [PMC free article] [PubMed] [Google Scholar]
- 60.Schlingensiepen K-H, Lüno K, Brysch W. High basal expression of the zif/268 immediate early gene in cortical layers IV and VI, in CA1 and in the corpus striatum: an in situ hybridization study. Neurosci Lett. 1991;122:67–70. doi: 10.1016/0304-3940(91)90195-y. [DOI] [PubMed] [Google Scholar]
- 61.Sperk G. Kainic acid seizures in the rat. Prog Neurobiol. 1994;42:1–32. doi: 10.1016/0301-0082(94)90019-1. [DOI] [PubMed] [Google Scholar]
- 62.Sukhatme VP, Cao X, Chang LC, Tsai-Morris C-H, Stamenkovich D, Ferreira PCP, Cohen DR, Edwards SA, Shows TB, Curran T, Le Beau MM, Adamson ED. A zinc finger-encoding gene coregulated with c-fos during growth and differentiation, and after cellular depolarization. Cell. 1988;53:37–43. doi: 10.1016/0092-8674(88)90485-0. [DOI] [PubMed] [Google Scholar]
- 63.Trachtenberg JT, Trepel C, Stryker MP. Rapid extragranular plasticity in the absence of thalamo-cortical plasticity in the developing primary visual cortex. Science. 2000;287:2029–2032. doi: 10.1126/science.287.5460.2029. [DOI] [PMC free article] [PubMed] [Google Scholar]
- 64.Vaccarino FM, Hayward MD, Nestler EJ, Duman RS, Tallman JF. Differential induction of immediate early genes by excitatory amino acid receptor types in primary cultures of cortical and striatal neurons. Brain Res Mol Brain Res. 1992;12:233–241. doi: 10.1016/0169-328x(92)90089-t. [DOI] [PubMed] [Google Scholar]
- 65.Wei F, Xu ZC, Qu Z, Milbrandt J, Zhuo M. Role of EGR1 in hippocampal synaptic enhancement induced by tetanic stimulation and amputation. J Cell Biol. 2000;149:1325–1333. doi: 10.1083/jcb.149.7.1325. [DOI] [PMC free article] [PubMed] [Google Scholar]
- 66.Wiesel TN, Hubel DH. Single-cell responses in striate cortex of kittens deprived of vision in one eye. J Neurophysiol. 1963;26:1003–1017. doi: 10.1152/jn.1963.26.6.1003. [DOI] [PubMed] [Google Scholar]
- 67.Worley PF, Christy BA, Nakabeppu Y, Bhat RV, Cole AJ, Baraban JM. Constitutive expression of zif268 in neocortex is regulated by synaptic activity. Proc Natl Acad Sci USA. 1991;88:5106–5110. doi: 10.1073/pnas.88.12.5106. [DOI] [PMC free article] [PubMed] [Google Scholar]
- 68.Yamada Y, Hada Y, Imamura K, Mataga N, Watanabe Y, Yamamoto M. Differential expression of immediate-early genes, c-fos and zif 268, in the visual cortex of young rats: effects of a noradrenergic neurotoxin on their expression. Neuroscience. 1999;92:473–484. doi: 10.1016/s0306-4522(99)00003-2. [DOI] [PubMed] [Google Scholar]
- 69.Yamagata K, Kaufmann WE, Lanahan A, Papapavlou M, Barnes CA, Andreasson KI, Worley PF. Egr3/pilot, a zinc finger transcription factor, is rapidly regulated by activity in brain neurons and colocalizes with egr1/zif268. Learn Mem. 1994;1:140–152. [PubMed] [Google Scholar]
- 70.Zheng D, Butler LS, McNamara JO. Kindling and associated mossy fibre sprouting are not affected in mice deficient of NGFI-A/NGFI-B genes. Neuroscience. 1998;83:251–258. doi: 10.1016/s0306-4522(97)00311-4. [DOI] [PubMed] [Google Scholar]