High-frequency Synchronization of Neuronal Activity in the Subthalamic Nucleus of Parkinsonian Patients with Limb Tremor (original) (raw)
Abstract
It has been hypothesized that in Parkinson's disease (PD) there is increased synchronization of neuronal firing in the basal ganglia. This study examines the discharge activity of 121 pairs of subthalamic nucleus (STN) neurons in nine PD patients undergoing functional stereotactic mapping. Four patients had a previous pallidotomy. A double microelectrode setup was used to simultaneously record from two neurons separated by distances as small as 250 μm. In the six patients who had limb tremor during the recording session (n = 76 pairs), the discharge pattern of 12 pairs of tremor cells (TCs) was found to be coherent at the frequency of the limb tremor. Both in-phase and out-of-phase relationships were observed between TCs. Interestingly, in these six patients, 63/129 single neurons displayed 15–30 Hz oscillations, whereas 36/76 pairs were coherent in this frequency range. Although the oscillatory frequencies were variable between patients, they were highly clustered within a patient. The phase difference between these pairs was found to be close to 0. High-frequency synchronization was observed during periods of limb tremor as well as during intermittent periods with no apparent limb tremor. In contrast, in the three patients without limb tremor during the recording session, only 1/84 neurons had high-frequency oscillatory activity, and no TCs or synchronous high-frequency oscillatory activity was observed (n = 45 pairs). These findings demonstrate that in PD patients with limb tremor, many STN neurons display high-frequency oscillations with a high degree of in-phase synchrony. The results suggest that high-frequency synchronized oscillatory activity may be associated with the pathology that gives rise to tremor in PD patients.
Keywords: Parkinson's disease, limb tremor, synchronization, tremor cells, subthalamic nucleus, basal ganglia
The role of the subthalamic nucleus (STN) in the pathogenesis of Parkinsonian symptoms has gained prominence since the demonstration of the anti-parkinsonian effect of injections of fiber-sparing neurotoxins into the STN of 1-methyl-4-phenyl-1,2,3,6-tetrahydropyridine (MPTP)-treated nonhuman primates (Bergman et al., 1990). Deep brain stimulation (DBS) (Limousin et al., 1995) or lesions (Gill and Heywood, 1997; Obeso et al., 1997) of the STN in Parkinson's disease (PD) patients have been shown to be an effective treatment for rigidity, akinesia, and especially tremor (Krack et al., 1998; Kumar et al., 1998). In PD patients, the reduction of tremor by STN DBS is comparable with the response obtained by thalamic stimulation for tremor (Krack et al., 1997). As in the thalamus (Lenz et al., 1988), groups of STN neurons display tremor-related spontaneous activity that is periodic at limb tremor frequency (Hutchison et al., 1998), and microstimulation in these regions has been shown to reduce resting tremor (Rodriguez et al., 1998).
In monkeys treated with MPTP, degeneration of the substantia nigra pars compacta and subsequent depletion of striatal dopamine is related to the emergence of periodic oscillatory neuronal activity in the STN (Bergman et al., 1994). It has been hypothesized that in PD, a loss of dopamine is characterized by a reduction in the independence between functionally segregated parallel circuits (Bergman et al., 1998a). The internal segment of the globus pallidus (GPi) is the major output nucleus of the basal ganglia and receives substantial excitatory input from the STN (Parent and Hazrati, 1995). After MPTP-induced parkinsonism in monkeys, synchronized oscillatory neuronal activity between pairs of neurons in the internal segment of the GPi (Nini et al., 1995) and the striatum (Raz et al., 1996) is observed. In these studies, all parkinsonian monkeys displayed signs of resting tremor and/or action tremor. The synchronization of neuron pairs with tremor-related activity has also been shown in the GPi of PD patients (Hurtado et al., 1999). However, it is unclear whether synchronized tremor activity in the basal ganglia contributes to tremor pathogenesis or is simply the result of tremor activity occurring elsewhere. For instance, the synchronization of tremor cells [(TCs) neurons with low-frequency oscillatory activity that is highly correlated with limb tremor] could be caused by common tremor-related afferent inputs to those cells.
To assess whether synchronous activity between neurons in the STN underlies differences in parkinsonian pathophysiology, this study examined the discharge activity of pairs of neurons in PD patients with and without limb tremor. We provide evidence that groups of STN neurons oscillate in phase at high frequencies in PD patients with limb tremor but are not found in those patients without limb tremor.
MATERIALS AND METHODS
Subjects. Nine patients underwent microelectrode-guided placement of bilateral deep brain stimulating electrodes for the treatment of the symptoms of PD. These patients had a mean age of 51 years (±2.4 SE, range 34–66 years) at the time of operation. The average duration of the disease was 12 years (±1.5 SE), and all patients had PD for at least 7 years. Individual patient characteristics are listed in Table 1. All patients were preoperatively assessed using the Unified Parkinson's Disease Rating Scale (UPDRS). In both the preoperative assessment and during surgery, patients were studied in the practically defined OFF state, 12–14 hr after the last oral dose of levodopa. The mean motor UPDRS score (motor subsection III) was 50 (±2 SE) (maximum possible score is 108). UPDRS OFF period tremor score (maximum value is 28) was calculated as the sum of UPDRS item 20 (resting tremor of right hand, left hand, right leg, left leg, face) and item 21 (action tremor of right hand, left hand). Using the following criteria, patients were divided into two groups. Those with any resting tremor of the limbs during the microelectrode recording session were assigned to a “tremor” group (n = 6). Patients without any discernable resting tremor of the limbs during the microelectrode recording session were assigned to a “non-tremor” group (n = 3). Four patients had previously undergone a unilateral pallidotomy (Table 1). In these patients, pallidotomy was indicated for disabling drug-induced dyskinesia. Two of these patients were in the tremor group, and two were in the non-tremor group. In both of the tremor group patients (patients A, F), pallidotomy led to a moderate decrease in contralateral limb tremor at 6 months after surgery. However, the tremor reduction was not maintained at the time of the STN recordings (33 and 28 months after pallidotomy). One of the two non-tremor group patients (patient I) did have mild facial tremor before and at 6 months after pallidotomy, but this tremor was not present at the time of the STN recordings. Because it is possible to induce or enhance Parkinsonian resting limb tremor by having patients perform a cognitive task that demands their attention, patients were periodically asked to perform mental arithmetic during some of the microelectrode recordings.
Table 1.
Patient characteristics
| Patient | Age1-a | Sex | Years with PD1-a | UPDRS motor score1-b | UPDRS tremor score1-b | Body side of sampled STN neurons | Body side of pallidotomy1-c | Limb tremor during the procedure? | Assigned group |
|---|---|---|---|---|---|---|---|---|---|
| A | 49 | F | 11 | 50 | 6 | Left | Left (33) | yes | Tremor |
| B | 57 | F | 17 | 42 | 10 | Right | yes | Tremor | |
| C | 66 | M | 13 | 53 | 14 | Right | yes | Tremor | |
| D | 50 | F | 7 | 57 | 14 | Right, left | yes | Tremor | |
| E | 55 | M | 18 | 45 | 19 | Right | yes | Tremor | |
| F | 53 | M | 7 | 54 | 13 | Right | Right (27) | yes | Tremor |
| G | 34 | F | 9 | 39 | 6 | Left | none | Non-tremor | |
| H | 50 | M | 10 | 54 | 1 | Right | Left (40) | none | Non-tremor |
| I | 49 | M | 17 | 55 | 1 | Right, left | Right (51) | none | Non-tremor |
Recording procedure and apparatus. The use of microelectrode recording to localize DBS electrode placement in the STN has been described previously (Hutchison et al., 1998). Briefly, single-unit microelectrode recordings and stimulation mapping allowed the identification of physiological landmarks and cell localization. Parasagittal trajectories at either 10.5 or 12 mm from the midline passed through the thalamic reticular nucleus and/or anterior thalamus, zona incerta, STN, and the substantia nigra pars reticulata (SNr). Single units were recorded using Parylene-coated tungsten microelectrodes with an exposed tip size of 15–25 μm. Microelectrode tips were plated with gold and platinum to reduce the impedance to ∼0.2 MΩ at 1 kHz. Signals were amplified and filtered using the Guideline System GS3000 (Axon Instruments, Foster City, CA). The two channels of neuronal data were recorded along with wrist flexor/extensor electromyographic (EMG) and accelerometer signals on analog videotape (VR-100 digital recorder, Instrutech Corp., Port Washington, NY) to be analyzed off-line. The simultaneous recording of neuron pairs was performed using a double electrode setup in which two microelectrodes were inserted either as a glued pair separated by a distance of 250–300 μm or independently, in which case the electrodes were separated by 600 μm and each electrode was driven by a separate microdrive. In most cases dual-electrode recordings were obtained only on one side (usually the first). Recorded neurons were included if they were well isolated and stable and were sampled for at least 20 sec or at least 1000 action potentials. An example of a well isolated neuron is displayed in Figure 1A. In this study, the average number of action potentials recorded per cell was 2830 (±130 SE) over an average sample time of 62 sec (±3 SE). Single-unit event times were discriminated off-line using two dual-window discriminators (DDIS-1, BAK Electronics, Mount Airy, MD) and storage oscilloscopes in spike-triggered mode or by template-matching spike-sorting software (Spike2, Cambridge Electronic Design, Cambridge, England).
Fig. 1.

The oscillatory behavior of single neurons in the STN of PD patients. A, Raw trace of a well isolated STN neuron. B, Spike trains were transformed from a series of events (sampled at 1000 Hz) to a continuous function by replacing each spike with a raised cosine with unit area under the curve and a width of 10 msec. This resulted in a smooth continuous function with a sampling rate of 1000 Hz that was used in subsequent FFT analysis.C_–_E, Examples of autocorrelograms (left column; dashed line is mean discharge rate) and frequency spectra (right column;numbers above peaks are the signal-to-noise ratio of the peak) for three types of oscillatory STN neurons. C, Cell with only a tremor frequency component (from patient D; see_G_). D, Cell with only a high-frequency oscillatory component (from patient B). E, Cell with both oscillatory components (from patient B, a raw trace of this cell is displayed in Fig. 1A). F, Distribution of firing rates of oscillatory and non-oscillatory STN neurons (10 Hz bins, data normalized by total cell number in each group). The mean spontaneous firing rate of cells with an oscillatory component (n = 64) was significantly higher than the firing rate of cells without any oscillatory components (n = 149) (p < 0.05).G, Box plot of frequencies of high-frequency oscillations (gray boxes, top) and of tremor frequency oscillations (open boxes,bottom) of patients in tremor group.Arrows indicate the mean limb tremor frequency during the stereotaxic procedure. Numbers above patient letter designations indicate total number of single STN neurons that were sampled in each patient. Numbers above_boxes_ show the number of single STN neurons in each group. In the box plot, the box indicates the 25th, 50th (median), and 75th percentiles, the error bars indicate the 10th and 90th percentiles, and the dots represent outliers.
Data analysis. Spontaneous ongoing discharge (tonic activity) analyzed in this study was collected with the patient at rest and without any passive joint manipulation or voluntary movements. The average neuronal firing rate (FR) and the median interspike interval were calculated for each cell. Statistical analysis of group values was performed using Student's t tests. In cases of non-normality, the Wilcoxon Signed Rank Test or Mann–Whitney Rank Sum Test was used. Statistical significance was assigned at_p_ < 0.05 (i.e., α = 0.05; two-tailed).
Autocorrelation analysis was used to detect and grade the rhythmic neuronal activity of single neurons. Cross-correlation analysis was used to detect coincident activity between pairs of neurons and detect and grade the rhythmic neuronal activity within these pairs. Correlation histograms of spike trains were plotted for delays of 1.0 sec (10 msec bin width) and 200 msec (2 msec bin width). Correlograms were used to index the strength of the periodic activity. The strength of the oscillation was graded according to standard examples given byKarmon and Bergman (1993) for oscillating cells in MPTP-treated monkeys, in which only cells with a strength of five or greater were considered for further analysis. All correlation histograms were quantified to the units of rate (spikes per second) (Abeles, 1982). Nonrandom discharge, such as oscillatory activity of individual neurons (autocorrelation) or between pairs of neurons (cross-correlation), was assessed by calculating confidence lines at ±2 SDs (∼95% confidence interval) of the 100–200 or 500–1000 msec time interval mean. Oscillatory modulation of ongoing discharge was initially detected by locating at least two successive peaks within the first 100 or 500 msec of the autocorrelation functions (constructed from 100 bins of 2 or 10 msec, respectively). Peaks were considered significant if they were found outside the area defined by the confidence lines. The frequency of oscillation was then determined by calculating the reciprocal of the peak-to-peak time of two successive peaks. Phase shifts were determined by calculating the time of the highest peak (typically the peak closest to zero time) divided by the oscillation period.
Spectral analysis was used to further characterize the frequency content of neurons with oscillatory activity. Spike trains were transformed from a series of events (sampled at 1000 Hz) to a continuous function representing the density of spikes in time (using conversion software from Spike2, Cambridge Electronic Design) (see Fig.1B legend for detail). The size of the transform used in the fast Fourier transform (FFT) analysis was 512 points, thereby yielding a frequency resolution of 1.95 Hz (i.e., waveform channel sampling rate divided by the FFT block size). Only cells that yielded at least 19 nonoverlapping power spectrum blocks were used to calculate spectra (i.e., 10 sec of data ≅ 19 blocks × 512/1000 sec/block). In this study, the average number of FFT blocks per sample time was 154 (±18 SE). Graphic displays of frequency versus time were constructed by calculating the frequency content within consecutive 10 sec windows and were scaled to the ratio of signal to noise. Spectral noise was taken as the average of all spectral estimates between 0 and 30 Hz.
The similarity in oscillatory frequency content of pairs of neurons was calculated using coherence techniques. Coherence is a function of frequency and is calculated from the cross-spectral density between the two waveforms normalized by the power spectral density of each waveform. Coherence values can range from 0 if the spike trains are not linearly related to a value of 1 if the spike trains have a perfectly linear relationship. Because coherence is a measure of linear similarity, the phase shift must be constant, and the amplitudes of the two waveforms must have a constant ratio to be completely coherent at a particular frequency over a given time range. A statistically significant coherence value between the discharge of two neurons was used to indicate the presence of oscillatory synchronization. A 99% confidence level was determined by calculating a coherence value given by Coherence = 1 − (1 − α)1/(L−1), where α = 0.99 and_L_ = number of windows used (Rosenberg et al., 1989). This value or greater was considered to indicate a significant probability (p < 0.01) of a linear relationship between two cells. Phase relations were also assessed for those pairs of neurons that had a significant coherence at some frequency_fi_ using Phase (f_i) = arctan(−_Q(_f_i)/L(_f_i)), where fi is the ith spectral estimate, Q is the real part, and L is the imaginary part of the cross-spectra between a pair of neurons (Glaser and Ruchkin, 1976). Graphic displays of coherence or phase versus time were constructed by calculating the coherence or phase within consecutive 10 sec windows.
RESULTS
Oscillatory activity of single neurons in the STN
A total of 213 single neurons (from 121 pairs) was recorded from the STN of the nine patients. Three types of rhythmic activities were identified over the range of the rhythmic frequencies investigated: (1) tremor cells (4% of total STN population, n = 8), which displayed rhythmic activity at tremor frequency concurrently with limb tremor (Fig. 1C), (2) cells with high (>10 Hz) frequency oscillations (20% of total STN population, n = 44) (Fig. 1D), and (3) cells with both tremor frequency and high-frequency oscillation components (6% of total STN population, n = 12) (Fig.1E). The median FR of all STN neurons was 45.7 Hz (25% = 34.7, 75% = 61.7). Cells with no oscillatory discharge had a median FR of 43.1 Hz (25% = 32.4, 75% = 61.1), whereas cells that displayed oscillatory activity had a median FR of 53.4 Hz (25% = 40.2, 75% = 64.4), which was significantly greater (p< 0.05, Mann–Whitney Rank Sum Test) (Fig. 1F). There was no significant difference in the FRs of TCs and cells with high-frequency oscillatory activity.
Almost all (63/64) of the neurons with tremor frequency activity (TCs) or high-frequency oscillations, or both, were found in the six patients of the tremor group (129 single neurons examined), including the two patients (A, F) with a pallidotomy (ipsilateral to the recordings). In the three patients of the non-tremor group, only 1/84 STN neurons was found to have a high-frequency oscillation. Figure1G shows box plots of the frequency distributions of the high-frequency oscillatory neurons in the tremor group (frequency calculated from autocorrelograms). Each of the six patients had high-frequency oscillations that were tightly centered about one frequency in the range from 15 to 25 Hz (Fig. 1G). In one patient, high-frequency oscillatory activity was recorded on both sides, and the frequency was similar on the two sides. Three of the patients in the tremor group had TCs; the distribution of TC frequencies is also shown in Figure 1G. For cells that had both a tremor frequency oscillation and a high-frequency oscillation (n = 12), the ratio of the mean high-frequency oscillatory component to the mean frequency of the tremor component was 4.0 (±0.1 SE).
Highly synchronous high-frequency oscillatory activity in the STN of tremor group patients
A total of 121 neuron pairs was recorded in the STN. Single short-latency peaks in the cross-correlogram that would indicate short-interval interactions between STN neurons were never observed. However, 44/76 pairs of neurons were found to have a significant cross-correlation at high frequencies (>10 Hz) in the tremor group. High-frequency oscillatory activity was more evident in cross-correlograms than in autocorrelograms of single neurons (55/129 single STN neurons with high-frequency oscillatory activity in the tremor group). The oscillation strength ratings were stronger for cross-correlation [7.4 (±0.1 SE)] than for auto-correlation [6.9 (±0.1 SE)] (two-tailed t test, p < 0.01). Figure 2_A_ shows the spontaneous ongoing discharge of two simultaneously recorded STN neurons, and Figure 2_B_ shows the corresponding correlograms and spectra for this pair. Although the spectral signal-to-noise ratio of the high-frequency oscillation of unit 2 is lower than for unit 1, there is a statistically significant coherence between the pair. Figure 2_C_ shows examples of cross-correlograms and coherence functions of neuron pairs with synchronous high-frequency oscillatory activity from four patients in the tremor group; these pairs all oscillated in phase but each patient had a unique oscillation frequency. Furthermore, 36/76 pairs of STN neurons were found to have a significant coherence at a high frequency [mean sample time for the pairs of neurons was 79.3 sec (±9.3 SE)]. Coherence analysis revealed that fast oscillatory cells were also in synchrony for long periods of time. For example, eight of these pairs were seen to be coherent and in phase for >2 min.
Fig. 2.

Synchronization of STN neurons with high-frequency oscillations. A, Traces 2 (Unit 1) and 3 (Unit 2) show the discharge activity of two simultaneously recorded neurons during wrist tremor (patient E). The top trace is the recording of rectified wrist extensor electromyographic activity (EMG). Note that the two neurons tend to fire in synchrony with each other. B, Corresponding correlograms (top row) and spectra (bottom row) of the traces shown in A(the total sample time used to construct these plots was 29 sec). In all correlograms, the lines indicate mean FR. In the cross-correlogram (right panel of top row), Unit 1 is used as the trigger. The_thick dashed line_ in the coherence function indicates the level of significant coherence, and number by the peak is the phase difference (right panel of_bottom row_; see Materials and Methods).C, Examples of cross-correlograms (left column; the dashed lines indicate mean ± 2 SD) and coherence functions (right column) of pairs of STN neurons with a high-frequency oscillatory component from four separate patients (A, D,B, F, respectively). D, Linear regression analysis of percentage of pairs of STN neurons with a high-frequency cross-correlation as a function of amount of total limb tremor (UPDRS: sum of action tremor and rest tremor) measured preoperatively. The triangles indicate those patients in whom tremor cells were also found. E, Linear regression analysis of the phase relationship between pairs of fast oscillatory STN neurons as a function of the distance between the microelectrodes (phase calculated from cross-correlograms).
Figure 2D is a plot of the proportion of the pairs that displayed high-frequency oscillatory cross-correlation in each patient to each patient's presurgical UPDRS tremor rating score. There was a roughly linear relationship between the amount of high-frequency synchronous activity and the patients' tremor (r_2 = 0.67, p< 0.01). Data obtained from those patients in whom tremor cells were encountered during the time of surgery are indicated by_triangles. Although all six of the tremor group patients had limb tremor during the procedure, the high-frequency rhythmic firing was also present during some episodes when these patients did not have any noticeable tremor. TCs were found in three of the six tremor group patients. The TCs that were encountered appeared to be localized to regions that also contained cells with a high-frequency oscillatory component (see Fig. 5). There were nine instances of recording a TC on one electrode and no discernible TC frequency component for the other neuron; three of these pairs showed significant high-frequency coherence. There were nine instances in which two TCs were recorded simultaneously, and the tremor oscillation in eight of these pairs was found to be coherent over the total amount of time sampled.
Fig. 5.

The central box shows a reconstruction of simultaneously recorded neuron pairs from two microelectrode tracks in a single patient (patient D). Pairs of neurons are denoted by their location along each track (track 1 × track 2). The meanings of the symbol shape and shading are indicated at the bottom. The strength of the high-frequency component is as follows: none = <6, weak = 6–7, strong = 8–10 (see Materials and Methods). This patient had a 4–5 Hz resting tremor in the hand and foot during these recordings. The first column of each pair of columns is the cross-correlogram, and the second column is the corresponding coherence function (resolution 1.95 Hz; dashed line indicates significance level) between each pair of neurons. The_numbers_ at top left of each pair of plots indicate the depth of the pair of neurons in tracks 1 and 2, respectively. The numbers in _parentheses_indicate sampling time in seconds. The numbers beside each significant peak in the coherence function indicate the phase difference in degrees.
Figure 2E demonstrates that the phase relationship between high-frequency oscillatory pairs (detected from the cross-correlograms) was not dependent on the distance between the recording sites. There were 61 pairs of STN neurons investigated that were separated by 250 μm and 60 STN pairs that were separated by distances of >600 μm. Figure 2E shows that fast-frequency pairs were synchronous and in phase (absolute phase difference) over distances up to 1.5 mm.
Temporal relationships between limb tremor and neural pair synchronization are plotted in detail in Figure3. Figure 3A displays individual power spectrums of two STN units (scaled to the signal-to-noise ratio; see Materials and Methods) and the coherence between them as a function of time during ongoing wrist tremor. Unit 1 was a STN TC with a high-frequency component, whereas unit 2 predominantly displayed high-frequency oscillatory activity. During a period of limb tremor (40–70 sec), both cells were coherent at tremor frequency and at 20 Hz. When wrist tremor was suppressed by an examiner holding the patient's wrist, the pair of units displayed an even stronger high-frequency synchronization (as indicated by the value of the coherence). In contrast to this type of modulation, high-frequency synchronization in several pairs was observed by inducing or enhancing resting tremor. Figure 3B shows the changes in coherence between two cells in which, after a rest period and some repetitive passive and voluntary movements [see accelerometer trace (Acc)], resting tremor was induced by asking the patient to mentally count backward. It can be seen that when no tremor was present, there was no coherence between the two cells, but during ankle tremor (∼3.3 Hz), there was a strong high-frequency oscillatory synchronization. Because of the limited time resolution, it is not possible to ascertain whether coherence precisely coincides with the limb tremor. However, at 83 sec, the ankle tremor was suppressed by having an examiner hold the patient's ankle for ∼5 sec and then releasing, thereby letting tremor reappear. At this point (preceding the high-frequency synchronization), the two cells were coherent at tremor frequency. Note also that these cells were not coherent during the passive arm movements but did show coherence at 26–28 Hz during voluntary ankle movements. There was one other example in a different patient in whom the high-frequency synchronization appeared during limb tremor (data not shown). The issue of whether high-frequency oscillatory synchronization occurred during activity other than tremor was not fully explored. There were some neuron pairs that had ongoing high-frequency oscillatory synchronization during repetitive voluntary limb movements such as pointing with one hand and tapping with the other hand. An example is shown in Figure4A where the pair displayed synchronization of their 24–28 Hz oscillation during passive repetitive elbow movements. Synchronization within this frequency range was absent during the voluntary pointing and tapping movements, but synchronization at ∼15 Hz remained or became even stronger. These data indicate that high-frequency synchronization between STN neurons is dynamic and depends on the state of limb tremor and/or passive and voluntary movements.
Fig. 3.
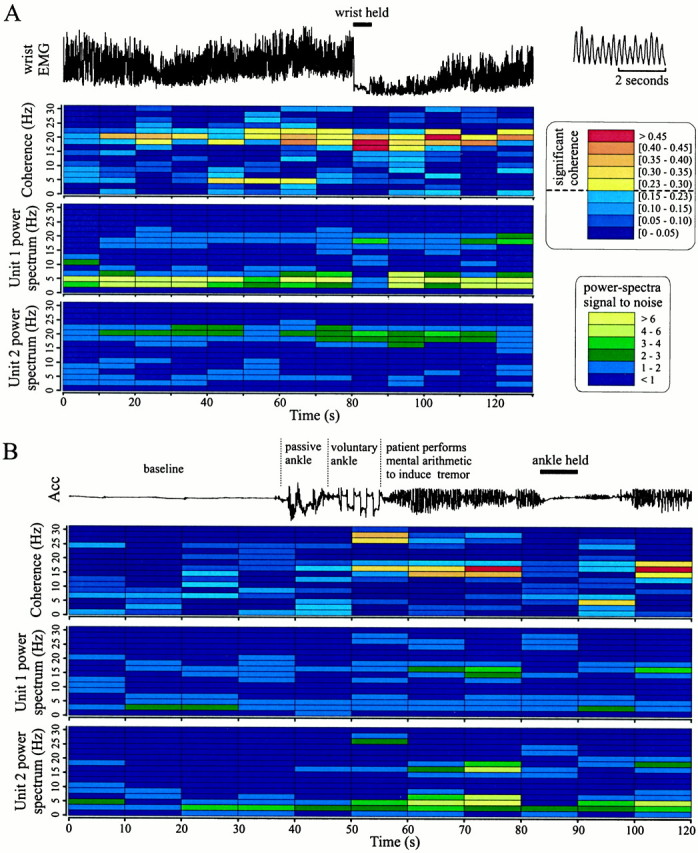
Examples of the dynamic relationship between high-frequency oscillatory synchronization and limb tremor.A, Two STN neurons recorded from patient D. The_bottom two panels_ show the power spectrums for each neuron, scaled to the ratio of signal to total noise (see Materials and Methods). The top panel shows the coherence between the two neurons. The top trace shows the electromyographic activity (EMG) from the patient's wrist flexors smoothed to give an estimate of the strength of the tremor (shown in detail at the top right of this figure for the 60–64 sec period). Each unit displays both frequency components. However, the power spectrum of Unit 1 shows that Unit 1 has a larger tremor component oscillation, whereas power spectrum of Unit 2 shows that Unit 2 has a larger high-frequency component oscillation. Note that high-frequency coherence between Units 1 and 2 becomes maximal when the wrist is held.B, Two STN neurons recorded from patient B. Power spectrums (bottom two panels) and coherence plot between two STN neurons during periods of ankle tremor, voluntary and passive ankle movements, and rest are shown. The two cells are synchronized at 15 Hz during resting limb tremor of ∼3.3 Hz. Because of the time resolution of the coherence plot, it is unclear whether this synchronization precedes or follows limb tremor. After the ankle is released, tremor amplitude increases, and the neuron pair resynchronizes at the same oscillation frequency. The top trace shows foot accelerometer (Acc) output. Coherence and autospectra plots were constructed by analyzing consecutive 10 sec sections of nonoverlapping data.
Fig. 4.
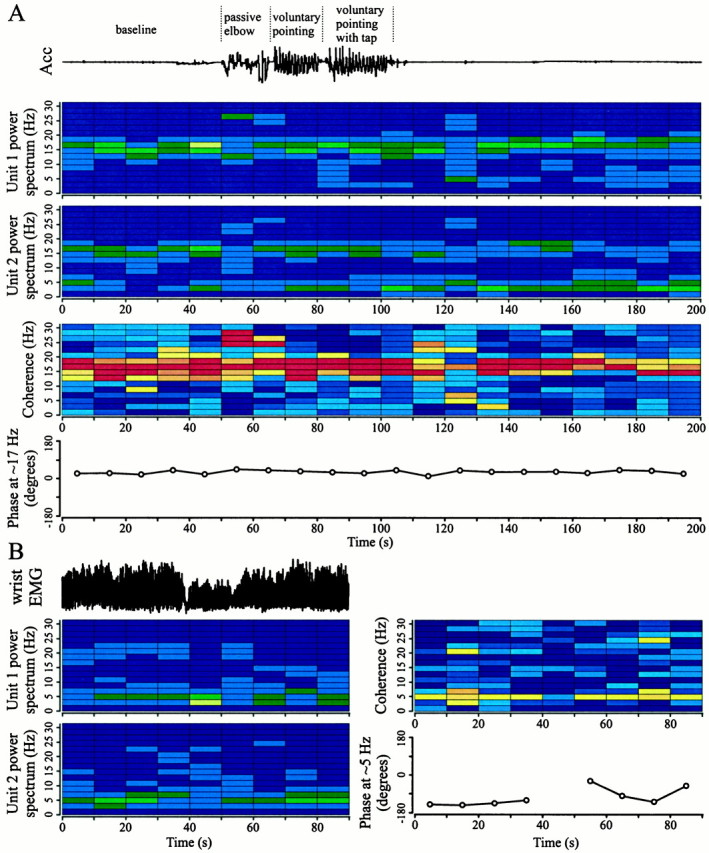
Changes in phase relationship between oscillatory STN neurons over time. A, Power spectrums, coherence, and phase (at ∼17 Hz; see Materials and Methods) between two STN neurons during a long sampling period containing passive and voluntary movements of elbow and arm (patient B). Note that the phase remains constant over the 3 min sampling period. Coherence during passive repetitive elbow movements was at ∼17 Hz and 24–28 Hz. Coherence during voluntary pointing and tapping with the opposite hand was limited to ∼17 Hz. The top trace shows hand accelerometer (Acc) output. Same legend as in Figure 3.B, Same plots as in A showing that the phase relationship between two STN TCs varies over time (patient D). The top left trace shows the smoothed EMG from the patient's wrist extensors. Phase at ∼5 Hz was calculated for time periods in which the pair of TCs displayed significantly coherent activity at this frequency.
Phase relationships of pairs of STN oscillatory neurons
Figure 4A also demonstrates that the pair of STN neurons with a high-frequency coherence had a stable phase relationship for a long period of time (>3 min). This is in contrast to pairs of STN TCs. An example of the phase variability of two TCs is shown in Figure 4B. These cells go from being in phase at 50–60 sec to nearly out of phase at 70–80 sec. It is conceivable that lower coherence values were obtained in the tremor activity frequency range versus the high-frequency activity range because of differences in phase variability between TC activity and high-frequency oscillatory activity (i.e., a high coherence value is related to a stable phase relationship; see Materials and Methods).
The tremor oscillations in pairs of tremor cells within the same patients were also observed to have variable phase relationships. Figure 5 shows the spatial distribution of oscillatory activity in a single patient in which two independent electrodes were used. During these recordings the patient had a robust 4–5 Hz resting tremor in both the contralateral hand and foot. The first STN cell was encountered at 3.2 mm, whereas the last STN cell (a TC) was found at −1.0 mm. The schematic illustrates the oscillatory behavior of single units and the distances between the pairs of neurons. As indicated by the cross-correlograms and the corresponding coherence function, some pairs of TCs were in phase (e.g., pair 0.6 × 1.1), whereas others were out of phase (e.g., pair 0.2 × 0.0). It can also be seen that the phase relationships between neighboring TCs could be out of phase even at distances as small as 200 μm between neurons (e.g., cells in track 2 at 0.9 and 1.1 mm vs cell at 0.6 mm in track 1). Furthermore, not all pairs of TCs studied in this patient were coherent (e.g., pair 1.3 × 1.7). Synchronization between neurons with high-frequency oscillations, in contrast to TC activity, was always close to 0. The mean phase difference between the high-frequency oscillatory pairs in the two microelectrode tracks was only 8.7° (±4.4 SE; maximum value is 31 degrees). Differences in coherence values between TCs and high-frequency oscillatory neurons observed in Figure 5 could also be attributable to differences in sampling time. That is, over a long sampling time (i.e., pair 1.3 × 1.7 was sampled for 130 sec), lower coherence values might be obtained for pairs of TCs with a variable phase relationship. Close inspection of Figure 5 also reveals that it was possible to detect oscillatory synchrony from the cross-correlograms even if there was no significant oscillation in the autocorrelogram of one of the pair of neurons (e.g., pair 1.6 × 1.8, and pair 0.6 × 0.9).
DISCUSSION
The existence of tremor-related activity in the STN in some of the PD patients in this study supports previous findings by our group and others (Hutchison et al., 1998; Krack et al., 1998; Rodriguez et al., 1998). This study provides the first demonstration of neurons with high-frequency oscillatory activity in the STN of PD patients and associates the synchronization of these neurons with TC activity and limb tremor. High-frequency oscillatory activity was better detected from cross-correlograms or coherence functions than from autocorrelograms or autospectra, suggesting that high-frequency oscillatory behavior of the STN reflects population synchronization rather than individual neuron behavior. Our study found that the median discharge rate of cells with no rhythmic discharge was lower (43 Hz) than that for neurons with rhythmic discharge (53 Hz). This differs from the findings of Rodriguez et al. (1998), who reported that the mean firing rate for TCs was 25 and 49 Hz for other neurons. However, data from the present study are consistent with findings from MPTP monkeys that indicate that there are differences in the spontaneous discharge rate of oscillatory versus non-oscillatory STN cells (Bergman et al., 1994). After MPTP treatment in African green monkeys, there was an increase in the overall spontaneous discharge of STN neurons from 19 to 26 Hz, whereas tremor-related neurons showed an even more prominent increase in FR to 35 Hz. In addition, the mean firing rates of oscillatory neurons was greater than the firing rates of other neurons in all three parkinsonian monkeys. Our observations support the hypothesis that the STN is hyperactive in PD patients, especially those patients with significant limb tremor.
The relationship between oscillatory neural activity and limb tremor has been explored in various monkey species in which limb tremor is differentially present after MPTP treatment. In a study by Bergman et al. (1998b), neuronal oscillations in the GPi were synchronized and more in phase in tremulous MPTP-treated vervet (African green) monkeys than in non-tremulous parkinsonian rhesus monkeys (i.e., MPTP-treated rhesus monkeys display short episodes of 10–16 Hz action tremor). Parkinsonian African green monkeys have a 3–5 Hz limb tremor that closely resembles that found in patients with PD. It has also been demonstrated that the induction of limb tremor in the MPTP African green monkey model brings about not only low-frequency tremor-related activity in the STN, but also high-frequency oscillations in the frequency range of 8–20 Hz (Bergman et al., 1994). The present study supports these observations and further demonstrates that TCs and cells with high-frequency oscillations in the STN of PD patients discharge in oscillatory synchrony. One caveat to this study is that the precise nature of the temporal relationship between limb tremor and high-frequency synchronization was not ascertained. In some pairs of STN neurons in the tremor group, the appearance of limb tremor coincided with high-frequency synchronization, whereas others displayed increases in oscillatory synchronization when limb tremor was suppressed (Fig. 3). However, there was a paucity of single neurons with oscillatory activity and no synchronous oscillations between pairs of STN neurons in the three patients that did not have significant limb tremor (45 neuron pairs examined). For the group of nine patients, the proportion of high-frequency synchronized neuron pairs encountered during the stereotaxic mapping was correlated to the preoperative UPDRS tremor score. Together these findings indicate that limb tremor and TC activity are associated with synchronized high-frequency oscillations. These results also imply that in those patients with rigidity or akinesia but little tremor, oscillatory synchronization is not an underlying factor. That is, different neuronal activity patterns at the level of the STN are present in PD patients expressing different clinical features. The present study also demonstrated that in each patient not all STN TCs were coherent with each other and therefore supports the hypothesis that there are independent “tremor-generating” circuits in the basal ganglia (Alberts et al., 1965; Hurtado et al., 1999; Raethjen et al., 2000). Pairs of TCs were found to be coherent and out of phase at distances as small as ∼250 μm, suggesting that each tremor-generating circuit could occupy a relatively small volume of the STN. Our finding of variability in phase differences over time between pairs of STN TCs is also consistent with the hypothesis that parkinsonian tremor is nonstationary (Bergman et al., 1998b; Hurtado et al., 1999).
The STN plays a central role in basal ganglia circuitry (Alexander and Crutcher, 1990). In this study, no neuron pairs were found that displayed a single short-latency peak in the cross-correlogram. This indicates that oscillatory synchronization is likely not caused by intranuclear interactions as a result of recurrent collaterals (Kita et al., 1983) or possible interneurons (Rafols and Fox, 1976), although the existence of interneurons in the STN remains unclear (Yelnik and Percheron, 1979; Van Der Kooy and Hattori, 1980; Ryan et al., 1992). The main difference between neural synchronization that occurred at the tremor frequency compared with high-frequency synchronization was that all high-frequency oscillatory activity was consistently in phase and independent of the distance between recording sites. Pairs of neurons with high-frequency oscillatory synchronization displayed constant phase differences over long sampling periods, whereas pairs of TCs did not. Also, the distribution of high-frequency oscillations was tightly centered about a frequency that was unique to each patient. These findings imply that the underlying mechanisms of the two types of oscillatory synchrony are different. It is likely that the in-phase high-frequency synchronization observed in the STN of PD patients is caused by synchronous activity occurring in other areas. Two likely candidates are the external segment of the globus pallidus (GPe) and the cerebral cortex, both of which send massive input to the STN (Carpenter et al., 1981; Canteras et al., 1990). These two areas are integral to corticostriatal–GPe–STN–GPi (“indirect” pathway) and cortico–STN–GPi–thalamic circuitry, respectively (Alexander and Crutcher, 1990).
The STN sends excitatory output to the GPe and also receives GABAergic input from the GPe, and thus the GPe may provide feedback inhibition to the STN (Rouzaire-Dubois et al., 1980). It has been shown that the GPe influences the firing rate and discharge pattern as well as the degree of correlated firing of adjacent STN neurons in the rat (Ryan et al., 1992). In a study by Plenz and Kital (1999), evidence from in vitro rat organotypic brain slices of the STN and the GPe suggests that together these nuclei form a central pacemaker capable of sustained synchronous in-phase and out-of-phase oscillations. However, synchronized oscillations between STN neurons occurred at frequencies that were significantly lower (<4 Hz) than those reported in this study, yet it was also demonstrated that a few GPe neurons have considerable control over synchronized activity in the STN. It is therefore possible that synchronization could occur in the GPe or the striatum. It has also been shown that tonically active neurons (cholinergic interneurons) in the striatum of monkeys display synchronized high-frequency oscillatory activity (∼15 Hz) after the depletion of dopamine attributable to MPTP treatment (Raz et al., 1996).
The STN receives a substantial excitatory glutamatergic input from the cortex (Afsharpour, 1985; Rouzaire-Dubois and Scarnati, 1985), and it has been shown that neighboring STN neurons share common cortical inputs (Ryan et al., 1992). Furthermore, the increase in the firing rates of the STN in 6-OHDA-treated rats is not solely dependent on GPe (Hassani et al., 1996), suggesting that direct corticosubthalamic connections could be involved in the pathology of the parkinsonian STN. The response of the STN to cortical stimulation can be shaped by the GPe (Ryan and Clark, 1991; Mouroux et al., 1995). The interaction between the STN and GPe is intimately related to cortical activity, and rhythmic oscillatory activity in STN–GPe may be driven by cortex (Magill et al., 2000). Direct cortico-STN input can also modulate the inhibitory influence of the direct striatonigral pathway on SNr neurons (Maurice et al., 1999). It is therefore possible that the source of the overt synchronization of high-frequency activity in the STN of PD patients with limb tremor is caused by disturbances in cortical synchrony. The involvement of the cortex in parkinsonian tremor has been well documented (Parker et al., 1992). Duffau et al. (1996)showed that during periods of limb tremor in PD patients, there were increases in the normalized regional cerebral blood flow in areas that were also modulated by voluntary repetitive arm movements. In patients with PD, cortical tremor-related network oscillations have been observed using magnetoencephalography (Volkmann et al., 1996) and electroencephalography (Alberts et al., 1969). Disturbances in cortical synchronization of parkinsonian patients at frequencies other than limb tremor frequencies have also been reported (Makela et al., 1993;Neufeld et al., 1994; Brown and Marsden, 1999). These disturbances are hypothesized to result from the inability of the parkinsonian basal ganglia to release cortical elements from low-frequency “idling” rhythms, such as α (∼10 Hz) and β (15–30 Hz), and allow for synchronization in the γ range (30–50 Hz) (Brown and Marsden, 1998).
In summary, we have demonstrated that highly synchronous in-phase oscillatory activity is present in the STN of PD patients with tremor-predominant symptoms. Synchronized high-frequency activity in the STN is likely involved in the pathophysiology of PD tremor and might in itself contribute to the expression of limb tremor.
Footnotes
This work was funded by National Institutes of Health and the Parkinson's Foundation of Canada. We thank Dr. H. Kwan and Dr. W. Mackay for their helpful suggestions and comments. We gratefully acknowledge Axon Instruments for providing some of the electrophysiological equipment used in this study.
Correspondence should be addressed to Jonathan O. Dostrovsky, Department of Physiology, Room 3305, Medical Sciences Building, 1 Kings College Circle, University of Toronto, Toronto, Ontario, Canada M5S 1A8. E-mail: j.dostrovsky@utoronto.ca.
REFERENCES
- 1.Abeles M. Quantification, smoothing, and confidence limits for single-units' histograms. J Neurosci Methods. 1982;5:317–325. doi: 10.1016/0165-0270(82)90002-4. [DOI] [PubMed] [Google Scholar]
- 2.Afsharpour S. Topographical projections of the cerebral cortex to the subthalamic nucleus. J Comp Neurol. 1985;236:14–28. doi: 10.1002/cne.902360103. [DOI] [PubMed] [Google Scholar]
- 3.Alberts WW, Libet B, Wright EW, Jr, Feinstein B. Physiological mechanisms of tremor and rigidity in parkinsonism. Confin Neurol. 1965;26:318–327. doi: 10.1159/000104047. [DOI] [PubMed] [Google Scholar]
- 4.Alberts WW, Wright EW, Jr, Feinstein B. Cortical potentials and Parkinsonian tremor. Nature. 1969;221:670–672. doi: 10.1038/221670a0. [DOI] [PubMed] [Google Scholar]
- 5.Alexander GE, Crutcher MD. Functional architecture of basal ganglia circuits: neural substrates of parallel processing. Trends Neurosci. 1990;13:266–271. doi: 10.1016/0166-2236(90)90107-l. [DOI] [PubMed] [Google Scholar]
- 6.Bergman H, Wichmann T, DeLong MR. Reversal of experimental parkinsonism by lesions of the subthalamic nucleus. Science. 1990;249:1436–1438. doi: 10.1126/science.2402638. [DOI] [PubMed] [Google Scholar]
- 7.Bergman H, Wichmann T, Karmon B, DeLong MR. The primate subthalamic nucleus. II. Neuronal activity in the MPTP model of parkinsonism. J Neurophysiol. 1994;72:507–520. doi: 10.1152/jn.1994.72.2.507. [DOI] [PubMed] [Google Scholar]
- 8.Bergman H, Feingold A, Nini A, Raz A, Slovin H, Abeles M, Vaadia E. Physiological aspects of information processing in the basal ganglia of normal and parkinsonian primates. Trends Neurosci. 1998a;21:32–38. doi: 10.1016/s0166-2236(97)01151-x. [DOI] [PubMed] [Google Scholar]
- 9.Bergman H, Raz A, Feingold A, Nini A, Nelken I, Hansel D, Ben Pazi H, Reches A. Physiology of MPTP tremor. Mov Disord. 1998b;13[Suppl 3]:29–34. doi: 10.1002/mds.870131305. [DOI] [PubMed] [Google Scholar]
- 10.Brown P, Marsden CD. What do the basal ganglia do? Lancet. 1998;351:1801–1804. doi: 10.1016/s0140-6736(97)11225-9. [DOI] [PubMed] [Google Scholar]
- 11.Brown P, Marsden CD. Bradykinesia and impairment of EEG desynchronization in Parkinson's disease. Mov Disord. 1999;14:423–429. doi: 10.1002/1531-8257(199905)14:3<423::aid-mds1006>3.0.co;2-v. [DOI] [PubMed] [Google Scholar]
- 12.Canteras NS, Shammah-Lagnado SJ, Silva BA, Ricardo JA. Afferent connections of the subthalamic nucleus: a combined retrograde and anterograde horseradish peroxidase study in the rat. Brain Res. 1990;513:43–59. doi: 10.1016/0006-8993(90)91087-w. [DOI] [PubMed] [Google Scholar]
- 13.Carpenter MB, Carleton SC, Keller JT, Conte P. Connections of the subthalamic nucleus in the monkey. Brain Res. 1981;224:1–29. doi: 10.1016/0006-8993(81)91113-6. [DOI] [PubMed] [Google Scholar]
- 14.Duffau H, Tzourio N, Caparros-Lefebvre D, Parker F, Mazoyer B. Tremor and voluntary repetitive movement in Parkinson's disease: comparison before and after L-dopa with positron emission tomography. Exp Brain Res. 1996;107:453–462. doi: 10.1007/BF00230425. [DOI] [PubMed] [Google Scholar]
- 15.Glaser EM, Ruchkin DS. Principals of neurobiological signal analysis. Academic; New York: 1976. [Google Scholar]
- 16.Gill SS, Heywood P. Bilateral dorsolateral subthalamotomy for advanced Parkinson's disease. Lancet. 1997;350:1224. doi: 10.1016/s0140-6736(05)63455-1. [DOI] [PubMed] [Google Scholar]
- 17.Hassani OK, Mouroux M, Feger J. Increased subthalamic neuronal activity after nigral dopaminergic lesion independent of disinhibition via the globus pallidus. Neuroscience. 1996;72:105–115. doi: 10.1016/0306-4522(95)00535-8. [DOI] [PubMed] [Google Scholar]
- 18.Hurtado JM, Gray CM, Tamas LB, Sigvardt KA. Dynamics of tremor-related oscillations in the human globus pallidus: a single case study. Proc Natl Acad Sci USA. 1999;96:1674–1679. doi: 10.1073/pnas.96.4.1674. [DOI] [PMC free article] [PubMed] [Google Scholar]
- 19.Hutchison WD, Allan RJ, Opitz H, Levy R, Dostrovsky JO, Lang AE, Lozano AM. Neurophysiological identification of the subthalamic nucleus in surgery for Parkinson's disease. Ann Neurol. 1998;44:622–628. doi: 10.1002/ana.410440407. [DOI] [PubMed] [Google Scholar]
- 20.Karmon B, Bergman H. Detection of neuronal periodic oscillations in the basal ganglia of normal and parkinsonian monkeys. Isr J Med Sci. 1993;29:570–579. [PubMed] [Google Scholar]
- 21.Kita H, Chang HT, Kitai ST. The morphology of intracellularly labeled rat subthalamic neurons: a light microscopic analysis. J Comp Neurol. 1983;215:245–257. doi: 10.1002/cne.902150302. [DOI] [PubMed] [Google Scholar]
- 22.Krack P, Pollak P, Limousin P, Benazzouz A, Benabid AL. Stimulation of subthalamic nucleus alleviates tremor in Parkinson's disease. Lancet. 1997;350:1675. doi: 10.1016/s0140-6736(97)24049-3. [DOI] [PubMed] [Google Scholar]
- 23.Krack P, Benazzouz A, Pollak P, Limousin P, Piallat B, Hoffmann D, Xie J, Benabid AL. Treatment of tremor in Parkinson's disease by subthalamic nucleus stimulation. Mov Disord. 1998;13:907–914. doi: 10.1002/mds.870130608. [DOI] [PubMed] [Google Scholar]
- 24.Kumar R, Lozano AM, Kim YJ, Hutchison WD, Sime E, Halket E, Lang AE. Double-blind evaluation of subthalamic nucleus deep brain stimulation in advanced Parkinson's disease. Neurology. 1998;51:850–855. doi: 10.1212/wnl.51.3.850. [DOI] [PubMed] [Google Scholar]
- 25.Lenz FA, Tasker RR, Kwan HC, Schnider S, Kwong R, Murayama Y, Dostrovsky JO, Murphy JT. Single unit analysis of the human ventral thalamic nuclear group: correlation of thalamic “tremor cells” with the 3–6 Hz component of parkinsonian tremor. J Neurosci. 1988;8:754–764. doi: 10.1523/JNEUROSCI.08-03-00754.1988. [DOI] [PMC free article] [PubMed] [Google Scholar]
- 26.Limousin P, Pollak P, Benazzouz A, Hoffmann D, Le Bas JF, Broussolle E, Perret JE, Benabid AL. Effect of parkinsonian signs and symptoms of bilateral subthalamic nucleus stimulation. Lancet. 1995;345:91–95. doi: 10.1016/s0140-6736(95)90062-4. [DOI] [PubMed] [Google Scholar]
- 27.Magill PJ, Bolam JP, Bevan MD. Relationship of activity in the subthalamic nucleus-globus pallidus network to cortical electroencephalogram. J Neurosci. 2000;20:820–833. doi: 10.1523/JNEUROSCI.20-02-00820.2000. [DOI] [PMC free article] [PubMed] [Google Scholar]
- 28.Makela JP, Hari P, Karhu J, Salmelin R, Teravainen H. Suppression of magnetic mu rhythm during parkinsonian tremor. Brain Res. 1993;617:189–193. doi: 10.1016/0006-8993(93)91085-7. [DOI] [PubMed] [Google Scholar]
- 29.Maurice N, Deniau JM, Glowinski J, Thierry AM. Relationships between the prefrontal cortex and the basal ganglia in the rat: physiology of the cortico-nigral circuits. J Neurosci. 1999;19:4674–4681. doi: 10.1523/JNEUROSCI.19-11-04674.1999. [DOI] [PMC free article] [PubMed] [Google Scholar]
- 30.Mouroux M, Hassani OK, Feger J. Electrophysiological study of the excitatory parafascicular projection to the subthalamic nucleus and evidence for ipsi- and contralateral controls. Neuroscience. 1995;67:399–407. doi: 10.1016/0306-4522(95)00032-e. [DOI] [PubMed] [Google Scholar]
- 31.Neufeld MY, Blumen S, Aitkin I, Parmet Y, Korczyn AD. EEG frequency analysis in demented and nondemented parkinsonian patients. Dementia. 1994;5:23–28. doi: 10.1159/000106690. [DOI] [PubMed] [Google Scholar]
- 32.Nini A, Feingold A, Slovin H, Bergman H. Neurons in the globus pallidus do not show correlated activity in the normal monkey, but phase-locked oscillations appear in the MPTP model of parkinsonism. J Neurophysiol. 1995;74:1800–1805. doi: 10.1152/jn.1995.74.4.1800. [DOI] [PubMed] [Google Scholar]
- 33.Obeso JA, Alvarez L, Macias R. Lesion of the subthalamic nucleus in Parkinson's disease. Neurology. 1997;48:A138. [Google Scholar]
- 34.Parent A, Hazrati LN. Functional anatomy of the basal ganglia. II. The place of subthalamic nucleus and external pallidum in basal ganglia circuitry. Brain Res Brain Res Rev. 1995;20:128–154. doi: 10.1016/0165-0173(94)00008-d. [DOI] [PubMed] [Google Scholar]
- 35.Parker F, Tzourio N, Blond S, Petit H, Mazoyer B. Evidence for a common network of brain structures involved in parkinsonian tremor and voluntary repetitive movement. Brain Res. 1992;584:11–17. doi: 10.1016/0006-8993(92)90872-7. [DOI] [PubMed] [Google Scholar]
- 36.Plenz D, Kital ST. A basal ganglia pacemaker formed by the subthalamic nucleus and external globus pallidus. Nature. 1999;400:677–682. doi: 10.1038/23281. [DOI] [PubMed] [Google Scholar]
- 37.Raethjen J, Lindemann M, Schmaljohann H, Wenzelburger R, Pfister G, Deuschl G. Multiple oscillators are causing parkinsonian and essential tremor. Mov Disord. 2000;15:84–94. doi: 10.1002/1531-8257(200001)15:1<84::aid-mds1014>3.0.co;2-k. [DOI] [PubMed] [Google Scholar]
- 38.Rafols JA, Fox CA. The neurons in the primate subthalamic nucleus: a Golgi and electron microscopic study. J Comp Neurol. 1976;168:75–111. doi: 10.1002/cne.901680105. [DOI] [PubMed] [Google Scholar]
- 39.Raz A, Feingold A, Zelanskaya V, Vaadia E, Bergman H. Neuronal synchronization of tonically active neurons in the striatum of normal and parkinsonian primates. J Neurophysiol. 1996;76:2083–2088. doi: 10.1152/jn.1996.76.3.2083. [DOI] [PubMed] [Google Scholar]
- 40.Rodriguez MC, Guridi OJ, Alvarez L, Mewes K, Macias R, Vitek J, DeLong MR, Obeso JA. The subthalamic nucleus and tremor in Parkinson's disease. Mov Disord. 1998;13[Suppl 3]:111–118. doi: 10.1002/mds.870131320. [DOI] [PubMed] [Google Scholar]
- 41.Rosenberg JR, Amjad AM, Breeze P, Brillinger DR, Halliday DM. The Fourier approach to the identification of functional coupling between neuronal spike trains. Prog Biophys Mol Biol. 1989;53:1–31. doi: 10.1016/0079-6107(89)90004-7. [DOI] [PubMed] [Google Scholar]
- 42.Rouzaire-Dubois B, Scarnati E. Bilateral corticosubthalamic nucleus projections: an electrophysiological study in rats with chronic cerebral lesions. Neuroscience. 1985;15:69–79. doi: 10.1016/0306-4522(85)90124-1. [DOI] [PubMed] [Google Scholar]
- 43.Rouzaire-Dubois B, Hammond C, Hamon B, Feger J. Pharmacological blockade of the globus pallidus-induced inhibitory response of subthalamic cells in the rat. Brain Res. 1980;200:321–329. doi: 10.1016/0006-8993(80)90923-3. [DOI] [PubMed] [Google Scholar]
- 44.Ryan LJ, Clark KB. The role of the subthalamic nucleus in the response of globus pallidus neurons to stimulation of the prelimbic and agranular frontal cortices in rats. Exp Brain Res. 1991;86:641–651. doi: 10.1007/BF00230538. [DOI] [PubMed] [Google Scholar]
- 45.Ryan LJ, Sanders DJ, Clark KB. Auto- and cross-correlation analysis of subthalamic nucleus neuronal activity in neostriatal- and globus pallidal-lesioned rats. Brain Res. 1992;583:253–261. doi: 10.1016/s0006-8993(10)80031-9. [DOI] [PubMed] [Google Scholar]
- 46.Van Der Kooy D, Hattori T. Single subthalamic nucleus neurons project to both the globus pallidus and substantia nigra in rat. J Comp Neurol. 1980;192:751–768. doi: 10.1002/cne.901920409. [DOI] [PubMed] [Google Scholar]
- 47.Volkmann J, Joliot M, Mogilner A, Ioannides AA, Lado F, Fazzini E, Ribary U, Llinas R. Central motor loop oscillations in parkinsonian resting tremor revealed by magnetoencephalography. Neurology. 1996;46:1359–1370. doi: 10.1212/wnl.46.5.1359. [DOI] [PubMed] [Google Scholar]
- 48.Yelnik J, Percheron G. Subthalamic neurons in primates: a quantitative and comparative analysis. Neuroscience. 1979;4:1717–1743. doi: 10.1016/0306-4522(79)90030-7. [DOI] [PubMed] [Google Scholar]