Total Number and Ratio of Excitatory and Inhibitory Synapses Converging onto Single Interneurons of Different Types in the CA1 Area of the Rat Hippocampus (original) (raw)
Abstract
The least known aspect of the functional architecture of hippocampal microcircuits is the quantitative distribution of synaptic inputs of identified cell classes. The complete dendritic trees of functionally distinct interneuron types containing parvalbumin (PV), calbindin D28k (CB), or calretinin (CR) were reconstructed at the light microscopic level to describe their geometry, total length, and laminar distribution. Serial electron microscopic reconstruction and postembedding GABA immunostaining was then used to determine the density of GABA-negative asymmetrical (excitatory) and GABA-positive symmetrical (inhibitory) synaptic inputs on their dendrites, somata, and axon initial segments. The total convergence and the distribution of excitatory and inhibitory inputs were then calculated using the light and electron microscopic data sets.
The three populations showed characteristic differences in dendritic morphology and in the density and distribution of afferent synapses. PV cells possessed the most extensive dendritic tree (4300 μm) and the thickest dendrites. CR cells had the smallest dendritic tree (2500 μm) and the thinnest shafts. The density of inputs as well as the total number of excitatory plus inhibitory synapses was several times higher on PV cells (on average, 16,294) than on CB (3839) or CR (2186) cells. The ratio of GABAergic inputs was significantly higher on CB (29.4%) and CR (20.71%) cells than on PV cells (6.4%). The density of inhibitory terminals was higher in the perisomatic region than on the distal dendrites.
These anatomical data are essential to understand the distinct behavior and role of these interneuron types during hippocampal activity patterns and represent fundamental information for modeling studies.
Keywords: inhibitory neurons, GABA, synaptic convergence, dendrite geometry, serial reconstruction, 3D, electron microscopy, database for modeling
The functional architecture of neuronal networks is defined by the building blocks and their connectivity. Cortical networks consist of two basic elements: excitatory principal cells and inhibitory interneurons. In the hippocampus, interneurons are important regulators of electrical activity patterns (Freund and Buzsaki, 1996). They control the output, the plasticity of inputs, and the excitability of principal cells (Miles et al., 1996), they are able to synchronize large cell populations at different frequencies (Buzsaki and Chrobak, 1995; Cobb et al., 1995), and, by being targets of subcortical pathways (Freund and Antal, 1988; Freund et al., 1990; Miettinen and Freund, 1992), they mediate motivational, emotional, and autonomic control of cortical activity patterns. The types, distribution, and connectivity of hippocampal interneurons have been described in detail. Parvalbumin-containing (PV) cells are basket and axo-axonic cells (Kosaka et al., 1987) which, by exerting strong perisomatic inhibition, control the generation of Na+ spikes and thus the output of cells (Miles et al., 1996). Calbindin D28K-containing (CB) cells, whose axonal arbor overlaps with Schaffer collateral terminals in the dendritic region (Gulyás and Freund, 1996) are involved in the control of dendritic Ca2+ spikes (Miles et al., 1996). Calretinin-containing (CR) cells form frequent dendrodendritic and axodendritic contacts with each other and selectively innervate other interneurons (Gulyás et al., 1996). Their connectivity makes them a good candidate for generating rhythmic synchronous activity patterns of local origin.
The distribution of postsynaptic targets of these and several other identified interneuron types (Buhl et al., 1994; Gulyás et al., 1996; Halasy et al., 1996) has been precisely characterized, allowing the calculation of their divergence. In contrast, there is no quantitative estimate available on the convergence and distribution of excitatory and inhibitory inputs from different sources onto functionally distinct interneuron classes. Because inputs such as the perforant path and nucleus reuniens thalami fibers (Wouterlood et al., 1990) in stratum lacunosum-moleculare, the Schaffer collaterals in strata radiatum and oriens, and the local pyramidal cell collaterals in stratum oriens (Amaral and Witter, 1989) terminate in specific layers in the CA1 area, the laminar distribution of the dendrites and their synaptic densities determine the set and relative weight of possible inputs.
In this paper we first describe the geometry of immunocytochemically visualized PV-, CB-, and CR-containing cells at the light microscopical level. Using serial reconstructions from electron microscopic sections immunostained for GABA we then estimated the absolute and relative densities of excitatory and inhibitory inputs arriving onto the somata, axon initial segments, and different dendrites of the three examined inhibitory cell populations in the CA1 region. This way the total number of converging excitatory and inhibitory afferents were calculated to reveal the relative contribution of different excitatory input pathways segregated to different layers, and the distribution of inhibitory afferents in different domains of the inhibitory cells were mapped.
MATERIALS AND METHODS
Immunocytochemistry
Perfusion and pretreatment. The study was conducted in accordance with the principles and procedures outlined in the National Institutes of Health Guide for Care and Use of Laboratory Animals. Male Wistar rats (Charles River Laboratories, Budapest, Hungary; 250 gm) were perfused under deep Equithesine anesthesia (chlornembutal 0.3 ml/100 gm), first with physiological saline (1 min) and then with 300 ml of one of the following fixatives: one containing 0.05% glutaraldehyde (TAAB Laboratories Equipment), 4% paraformaldehyde (TAAB), and 0.2% picric acid dissolved in 0.1m phosphate buffer (PB; pH 7.4) for the light microscopical measurements (group A; n = 10 rats), and another containing 2% glutaraldehyde, 3% paraformaldehyde, and 0.2% picric acid dissolved in PB for the electron microscopical measurements (group B; n = 10 rats). After fixation, the dorsal hippocampi were dissected together with the overlying neocortex and sectioned on a vibratome at 60 μm. To allow serial reconstruction of dendritic arbors, after immunostaining 10–11 consecutive sections were kept in order (group A). After extensive washes in PB, two sections from each vial were selected, marked, and the outlines and laminar boundaries of the hippocampi were drawn using a camera lucida and a 10× objective, to record the size of sections before immunostaining and embedding. The sections were then immersed in a mixture of 25% sucrose and 10% glycerol in 0.01 m PB and freeze-thawed in liquid nitrogen to increase the penetration of antisera used for immunostaining. After repeated washes, the sections of animals from group B were treated with 1% NaBH4 for 30 min to reduce free aldehyde groups and enhance immunostaining.
Pre-embedding immunostaining for PV, CB, and CR. The sections were incubated first in 5% bovine serum albumin (BSA; 45 min), then in rabbit anti-parvalbumin (1:5000; Baimbridge and Miller, 1982), anti-calretinin (1:3000; Rogers, 1989), or anti-calbindin D28k antiserum (R8701; 1:3000; Baimbridge and Miller, 1982) for 2 d. This was followed by incubation in biotinylated goat anti-rabbit IgG (1:100; Vector Laboratories, Burlingame, CA; 4 hr). Finally, the standard ABC kit (1:100; Vector Laboratories; 3 hr) was used. The sections were washed three times for 30 min between each serum. All the washing steps and the dilution of the antisera were performed in 50 mm Tris-buffered saline (TBS; pH 7.4). In group A, the peroxidase reaction was developed by nickel-intensified 3,3′-diaminobenzidine (DAB)–4HCl (Sigma, St. Louis, MO) as a chromogen. In group B, the peroxidase reaction was developed using DAB–4HCl (Sigma) as a chromogen and shorter development time to avoid the masking of the postsynaptic densities by DAB precipitate. After the final washes in PB, the sections were treated with 1% OsO4 for 1 hr, dehydrated in ethanol, and embedded in Durcupan (ACM; Fluka, Buchs, Switzerland). The sections that were drawn and marked at the beginning of the staining procedure were drawn again, and the shrinkage in the x,y plane was calculated.
Postembedding immunostaining for GABA. The immunostaining procedure (in material from group B) followed those described bySomogyi and Hodgson (1985), with small modifications, using a well-characterized antiserum against GABA (Hodgson et al., 1985). The steps were performed on droplets of Millipore-filtered solutions in humid Petri dishes, as follows: 2% periodic acid (H5IO6) for 10 min; wash by dipping in several changes of double-distilled water; 2% sodium metaperiodate (NaIO4) for 10 min; wash as before; three times for 2 min in TBS, pH 7.4; 30 min in 1% ovalbumin dissolved in TBS; three times for 10 min in TBS containing 1% normal goat serum (NGS); 1–2 hr in a rabbit anti-GABA antiserum (code number 9; diluted 1:1000 in NGS–TBS); two times for 10 min in TBS; 10 min in 0.05m Tris buffer, pH 7.4 containing 1% BSA and 0.5% Tween 20; goat anti-rabbit IgG-coated colloidal gold (12 nm; Jackson ImmunoResearch, West Grove, PA) for 2 hr (diluted 1:20 in the same buffer); wash two times for 5 min in double-distilled water; saturated uranyl acetate for 30 min; wash in four changes of double-distilled water; staining with lead citrate; and wash in distilled water. Profiles showing a density of colloidal gold particles at least 5× background level, in two or three adjacent sections were considered GABA-immunoreactive. Axon terminals forming asymmetrical synapses (presumed glutamatergic) were used to establish background density.
Controls. The specificity of the primary antisera has been tested extensively by the laboratories of origin (Baimbridge and Miller, 1982; Somogyi and Hodgson, 1985; Rogers, 1989). Controls of the methods in the present experiments included replacement of the primary antisera with normal serum (1:200). In these sections, no staining was visible apart from a faint background limited to the surface of the sections. Replacement of the GABA antiserum with normal rabbit serum in the postembedding immunogold reaction resulted in a loss of specific staining, i.e., no signs of colloidal gold accumulation could be detected over any profiles.
Light microscopical sampling
After immunostaining, the order of sections was determined, and several cells were selected for reconstruction (PV,n = 26; CB, n = 19; CR,n = 29) from the middle sections of the series. Although PV, CR, and CB cells show unique distributions and dendritic arborization patterns, there are variations in location and shape within groups. For the reconstructions, we selected cells showing the most characteristic properties of the given group (the selected cells will be described in the Results section). We used only material in which immunostaining was complete, i.e., we visualized the entire dendritic tree evenly, and thus the dendrites could be followed to their natural ends. Usually several neighboring cells were drawn from a section onto tracing paper using a camera lucida and a 50× oil immersion objective. Each section containing a portion of the dendritic tree was drawn onto a separate sheet of paper. Capillaries cut on the surfaces were also drawn to help matching dendritic segments when moving onto the adjacent section. When all dendrites had been reconstructed, dendrite portions were copied onto a single sheet. PV and CR cells were reconstructed from three to eight sections of 60 μm thickness. Because of the large horizontal extent of CB cells, more sections (up to 11) were needed for their reconstruction.
The dendritic tree of a cell consists of segments of distinct diameter and appearance. Therefore, after several selected cells were drawn, dendrite subclasses were defined on the basis of diameter and morphology for each cell type (Table 1). Thick (T), medium (M), and thin (t) segments were distinguished in each layer. Most cell types possessed beaded as well as smooth dendrites, but since the occurrence of beads depend both on the quality of fixation and cell type, we did not use this feature for classification. To give a single average diameter value for each subclass, camera lucida drawings (100× oil immersion objective) or electron micrographs (of dendrites running parallel with the surface of the section) were made, then the diameters of the dendrites were measured at evenly spaced intervals along the longitudinal axis of the dendrite (extremes of the dendritic ends were excluded) and averaged. This method is essentially equivalent to measuring the cross-section surface and dividing it by the length of the dendrite section to calculate average diameter. Measurements were made using the publicly available morphometry program NIH Image (http://rsb.info.nih.gov/nih-image/download.html) on a Macintosh Quadra computer. The values measured at the light and electron microscopic levels matched well (see Results).
Table 1.
Subclasses of dendrites distinguished in each layer for each cell type
| PV | CB | CR | |
|---|---|---|---|
| Str. oriens (ori) | T (2.0; 1.7–2.2) | M (0.6; 0.4–0.7) | T (1.3; 0.8–1.6) |
| M (1.3; 0.8–1.6) | t (0.25; 0.2–0.4) | M (0.5; 0.4–0.8) | |
| t (0.5; 0.4–0.8) | t (0.2; 0.2–0.4) | ||
| Str. pyramidale | M (1.5; 1.3–1.7) | T (1.4; 0.8–1.7) | M (0.8; 0.6–1.0) |
| M (0.7; 0.6–0.9) | |||
| t (0.5; 0.3–0.6) | |||
| Str. radiatum (rad) | T (2.5; 2.2–2.7) | T (1.6; 0.9–1.8) | T (1.2; 0.6–1.1) |
| M (2.0; 1.5–2.3) | M (0.75; 0.5–1.0) | M (0.6; 0.4–0.8) | |
| t (1.0; 0.8–1.5) | t (0.3; 0.3–0.5) | t (0.25; 0.2–0.4) | |
| Str. lac-mol. (lm) | M (1.0; 0.6–1.4) | t (0.25; 0.2–0.4) | t (0.4; 0.2–0.6) |
| t (0.5; 0.3–0.6) |
On the drawings, dendritic segments were labeled with color codes according to their subclass. A pseudo three-dimensional (3D) reconstruction program called ARBOR (developed by S. Pomaházy and modified by A. I. Gulyás; see Wolf et al., 1995) was then used to reconstruct the dendritic arbors. The two-dimensional (2D) projections of the dendritic trees were traced on a digitizing tablet, and the points where dendrites crossed section boundaries were also indicated. The program interpolated the missing z values with the help of the available x, y coordinates and the section border crossing points, carrying information on_z_ coordinates, assuming that dendrites cannot break at any point. The feasibility of this approach has been verified earlier (Wolf et al., 1995). We also tested the accuracy of the program on intracellularly filled mossy fibers already reconstructed using Neurolucida. The difference in the measured values was <3%. Because we noticed almost twofold variability in the dendritic length of individual cells, this small error is not significant. The program supplied data in spreadsheet format on several dendritic tree parameters. The values were further processed using Excel. We used the pseudoreconstruction algorithm because it does not require expensive hardware, it is much faster than other reconstruction programs, and its accuracy is not inferior.
To calculate the surface of the cell bodies, 20 somata were selected from each cell population and reembedded for serial sectioning. The cross sections of the somata were drawn from 13–26 semithin sections, 1 μm each. The perimeters were measured using NIH Image (see above). The somatic surfaces were then calculated for each cell using the perimeter values and the section thickness assuming that two subsequent cross sections form a truncated cone with upper and lower perimeters equal to the perimeter of the cross sections (which is reasonable for surfaces not containing extreme convexities or concavities).
Electron microscopical sampling
Three to five dendritic segments were reembedded from each dendritic subclasses into Durcupan blocks from each layer and from each interneuron group. For sampling we selected only dendrite segments that could be traced back to somata of those cell types that were analyzed at the light microscopic level. The embedded dendrites in the blocks were drawn using a camera lucida for length measurement. Long series of ultrathin sections (70–150 sections of 60 nm thickness) were cut on a Reichert Ultracut S ultramicrotome. We selected straight dendritic segments and thus, using the Pythagorean distance (and shrinkage correction) we could calculate the true length of the sampled segments (between 4 and 85 μm, 26 μm on average) by measuring the projected 2D length of the dendrites (from camera lucida drawings) and the depth spanned by the serial sections. The series containing known lengths of classified dendrites were immunostained against GABA and serially reconstructed. For the reconstruction, a Hitachi-7100 electron microscope was used. The positions of the synaptic contacts on the selected dendritic profiles were recorded for each section. The terminals forming synapses were numbered consecutively, and their GABA immunoreactivity (based on the density of gold particles on the adjacent sections) was determined (a total of 2665, 385, and 764 synapses for the three cell populations). In the case of PV and CR dendrites, the possible PV or CR immunoreactivity (respectively) of the presynaptic terminals was also recorded. To calculate the density values, the number of synapses on all sampled dendritic segments of a given subclass were added and divided by the sum of lengths of the same dendritic segments.
Ten to thirteen serial sections were cut from PV, CB, and CR-IR somata (n = 11, 6, and 10, respectively) to estimate the density of synapses per 100 μm2. The synapses were serially reconstructed and numbered. The surfaces of the somatic slices were calculated similarly to the soma surface calculation (see above).
The axon initial segments of three neurons were reembedded from each population, serially sectioned, and reconstructed similarly to the dendrites.
In the light microscopic analysis of the dendritic arborization patterns, the SE of the dendritic lengths has been specified. In case of the input density measurements of this paper, SEs are not given, because of the rather laborious nature of the sampling, the sample size for individual dendrite subclasses from each layer was small (three to five segments).
Correction for shrinkage
Shrinkage may arise at different steps of the histochemical procedure. We recorded the sizes of sections before the beginning of the immunocytochemical procedure. For the LM sampling, we had to calculate the x,y shrinkage caused by the immunostaining (by comparing section sizes before and after immunostaining) and corrected the calibration of the 3D reconstruction program with this value. In this phase, we did not need shrinkage correction in the _z_axis because we assumed that the mechanics of the vibratome on which the 60 μm sections were cut is accurate. Even if individual sections slightly vary in thickness this variance is averaged over the consecutive sections we used for reconstruction. Thus, for the 3D reconstruction program we gave the z value used for sectioning. Whatever the shrinkage is along the z axis during processing, because of the algorithm of the program, it would not effect the results.
In the EM analysis, correction for shrinkage had to be applied for both the x,y axes and the z axis. The x,y_correction was done similar to that at the LM level. For the_z correction, small pieces of resin-embedded sections were removed from the glass slides, then aligned perpendicular to the slide and embedded into a block. The width of the sections were then measured along the x axis (previous z became _x_this way) using a camera lucida and a micrometer-scaled slide. This method is superior to the method using the focusing micrometer scale of the microscope, because of the difference in refractory index of the air, oil, and the embedding material, accurate measurements cannot be done that way. The shrinkage found along the z axis was small: 0.5%. We did not measure the actual thickness of the ultrathin sections, because we assumed that even if the mechanics of the ultramicrotome is not totally accurate for neighboring sections, this error is, again, averaged over the long serial sections. Thus, for section thickness we used the values indicated by the ultramicrotome, corrected with the small shrinkage along the z axis.
RESULTS
For the sampling we had to solve two problems. First, the cell populations visualized by the three markers are not entirely homogeneous. Two subtypes can be distinguished in the case of CB (Toth and Freund, 1992; Gulyás and Freund, 1996) and CR (Gulyás et al., 1992) cells, and there is inhomogeneity in the case of PV cells as well. Because the reconstructions are rather laborious, we decided to select cells for reconstruction with the most typical morphologies. The variations and the sampled morphologies will be described below. The second problem arose from the fact that proximal dendrites are thicker, whereas distal, second, or third order dendrites are gradually thinner. Furthermore, different dendritic segments can be smooth or beaded to various degrees. The density of synapses might be different at these segments and in different layers where the afferents arrive from different sources. Therefore, we had to divide dendrites in all layers into subclasses (see Materials and Methods) for a more accurate calculation of the number of afferent synapses. The established dendrite subclasses and their corresponding diameters, which were used for drawing subclass boundaries, will be described below and summarized in Table 1. The dendrites sampled for electron microscopy were classified and selected on the basis of the same criteria. We used different diameter values for the subclass boundaries for different cells and different layers, because this way the dendritic trees could be subdivided more accurately into subclasses.
Finally, we have to define the coordinate system we used. We prepared coronal sections from the dorsal hippocampus, thus according to our arrangement of the sections on the slides, the apical dendrite of the pyramidal cells and thus the radial–vertical direction is parallel with the y axis. The x axis is parallel with the laminar boundaries (horizontal direction) and points toward the subiculum and the CA3a area. The z axis is perpendicular to the plane of the section and thus points to the rostral and caudal directions. Subsequent sections follow each other along the_z_ axis.
The detailed geometry of the cells and several measured parameters not detailed in this paper are available at the following worldwide web (www) page: http://www.koki.hu/∼gulyas/ca1cells.
Light microscopical properties of reconstructed interneurons
Immunostaining for the three interneuron populations revealed characteristic distribution patterns as well as dendritic and axonal arborizations throughout all layers and areas of the hippocampus similar to those described previously in several papers (Baimbridge and Miller, 1982; Kosaka et al., 1987; Sloviter, 1989; Gulyás et al., 1992; Miettinen et al., 1992; Toth and Freund, 1992; for review, seeFreund and Buzsaki, 1996). Because we studied only the inputs of CA1 interneuron populations, here we briefly describe only the dendritic trees, without the characteristics of their axonal arborization (for those details see the papers cited above).
Dendritic tree of PV-containing neurons
Immunostaining for PV visualized only interneurons. Labeled neurons were predominantly found in stratum pyramidale and in the upper third of stratum oriens. The majority of neurons located in the principal cell layers showed the characteristic features of pyramidal basket cells. Occasionally, PV cells could be found in stratum radiatum. In most cases they had large to medium size cell bodies, but occasionally cells with small somata were also found in stratum radiatum. Dendrites ran radially spanning all layers. For reconstruction, we selected cells with large to medium cell bodies located in stratum pyramidale and at the border of strata pyramidale and oriens. Twenty-six cells were selected, and all dendrites were reconstructed to their natural ends from three to eight serial sections (60 μm). Two to six (5.50 ± 1.24) primary dendrites arose from the soma and ran radially into stratum oriens or through stratum radiatum into stratum lacunosum-moleculare, branching infrequently. As seen in Figures 1,2, and Table2, PV cells had the most extensive dendritic tree (4347.74 ± 1124.95 μm) among the three examined neuron populations with a large variation among individual cells. Cells with a large dendritic tree can have twice as long total dendritic length than those with small trees. The distribution of dendrites among layers (Tables 2, 3) shows that the cells are likely to collect the majority of their inputs in strata radiatum and oriens, and only a smaller portion in strata lacunosum-moleculare and pyramidale.
Fig. 1.
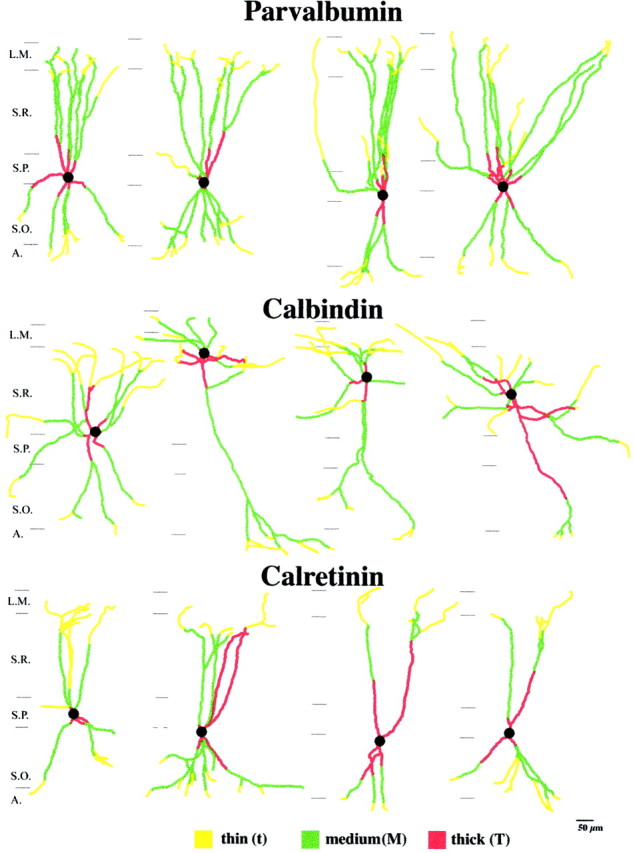
Reconstructed dendritic trees of PV-, CB-, and CR-containing interneurons from the CA1 region of the rat hippocampus. Four examples are shown from each reconstructed cell population, illustrating the characteristics of branching patterns. Different types of dendritic segments separated on the basis of their diameter are indicated with different colors. Note the variance in the total length of dendrites of individual cells within a cell group and the differential distribution of dendrites in distinct layers for the three cell populations. Parvalbumin cells had the largest dendritic tree, and calretinin cells had the smallest. The horizontal extent of the dendritic tree was widest for calbindin cells and narrowest for calretinin cells. Scale bar, 50 μm. L.M., Stratum lacunosum-moleculare; S.R., stratum radiatum;S.P., stratum pyramidale; S.O., stratum oriens.
Fig. 2.

Total length of dendrites (A), and surfaces of somata (B) of CA1 area interneurons. _A,_PV cells have the longest total dendritic length, and CR cells have the shortest. However, as indicated by the small open squares representing the length of individual dendrites, there was a high variability among individual cells within a group. Only the length of CR dendrites showed significant (p< 0.05) difference from the other two cell populations.B, As for the total dendritic lengths, the soma surface was largest for PV cells and smallest for CR cells with considerable variance. The values are given in square micrometers. The differences among the groups were significant (n = 20;p < 0.05).
Table 2.
Basic parameters of the three reconstructed cell populations
| Dendritic length | PV (n = 26) | CB (n = 19) | CR (n = 29) |
|---|---|---|---|
| Total | 4347.74 ± 1124.95 | 3441.12 ± 937.59 | 2499.41 ± 946.34 |
| Str. lacunosum-moleculare | 655.65 ± 255.20 (15.0%) | 130.15 ± 116.76 (3.8%) | 554.13 ± 357.85 (22.2%) |
| Str. radiatum | 2369.24 ± 786.24 (54.5%) | 2621.87 ± 827.15 (76.2%) | 883.12 ± 467.84 (35.3%) |
| Str. pyramidale | 248.28 ± 121.01 (5.7%) | 196.81 ± 161.60 (5.7%) | 232.73 ± 160.41 (9.3%) |
| Str. oriens | 1074.57 ± 534.78 (24.7%) | 492.28 ± 300.03 (14.3%) | 829.44 ± 415.96 (33.2%) |
| Soma surface (μm2) | 1006.01 ± 183.78 | 798.56 ± 139.61 | 520.45 ± 154.21 |
Table 3.
Average length of different dendrite subclasses for the three sampled cell populations in the different layers
| PV | CB | CR | |
|---|---|---|---|
| Im M | 213.92 ± 123.59 (4.9%) | 0.00 ± 0.00 (0.0%) | 0.00 ± 0.00 (0.0%) |
| Lm t | 441.74 ± 207.79 (10.1%) | 130.15 ± 116.76 (3.9%) | 554.13 ± 351.63 (24.3%) |
| Rad T | 255.27 ± 164.62 (5.8%) | 647.00 ± 237.20 (19.4%) | 377.19 ± 194.35 (16.5%) |
| Rad M | 1712.61 ± 635.29 (39.4%) | 1159.85 ± 422.67 (34.8%) | 387.86 ± 392.18 (17.0%) |
| Rad t | 401.36 ± 219.34 (9.2%) | 815.02 ± 424.46 (24.4%) | 118.06 ± 196.25 (5.2%) |
| Pyr | 248.28 ± 121.01 (5.7%) | 184.00 ± 160.13 (5.5%) | 232.73 ± 157.62 (10.2%) |
| Ori T | 21.13 ± 46.78 (0.4%) | 12.81 ± 40.67 (0.4%) | 86.87 ± 124.91 (3.8%) |
| Ori M | 685.81 ± 302.91 (15.7%) | 211.86 ± 137.23 (6.4%) | 375.81 ± 244.32 (16.5%) |
| Ori t | 367.63 ± 243.00 (8.5%) | 174.63 ± 190.93 (5.2%) | 146.82 ± 148.46 (6.4%) |
| Thick | 572.10 ± 193.37 (13.2%) | 647.00 ± 237.20 (19.4%) | 464.06 ± 241.79 (20.4%) |
| Medium | 2656.09 ± 793.42 (61.1%) | 1568.52 ± 441.82 (47.0%) | 1550.53 ± 677.03 (68.0%) |
| Thin | 1188.58 ± 444.06 (27.3%) | 989.65 ± 492.63 (29.7%) | 264.88 ± 217.57 (11.6%) |
Although PV cells include both basket and axo-axonic cells, the smooth transition of morphological features among the reconstructed cells does not justify a division into two separate morphological classes. It is highly unlikely that our sample contained only basket cells but no axo-axonic cells, thus, the results do not support the conclusion of Li et al. (1992) that basket and axo-axonic cells considerably differ in the length of dendrite they have in stratum lacunosum-moleculare.
The subclasses of dendrites classified in the case of PV cells are shown in Table 1. The distribution of thick, medium, and thin dendrites is shown in Figure 1. Generally, thick or medium dendrites arose from the somata. Thick dendrites were smooth and became thinner after the first branchpoint or after a few hundred micrometers, even if the dendrite did not branch. Medium dendrites were smooth or irregular in appearance. Thin dendrites bore beads in all layers. The diameter of the dendrites varied between 0.3 and 2.7 μm among the different subclasses. As can be seen from Table 1, PV cells had the thickest dendrites.
Dendritic tree of CB-containing neurons
The highest numbers of CB-containing nonpyramidal cell somata were found in stratum radiatum, with a peak density near the border with stratum lacunosum-moleculare. A smaller number of cells were seen in strata oriens and pyramidale. Cells were only occasionally seen in stratum lacunosum-moleculare. As in earlier studies (Toth and Freund, 1992; Gulyás and Freund, 1996), we could distinguish two types of CB cells on the basis of their location and dendritic morphology. Type I cells were most numerous in stratum radiatum, but could also be found in strata pyramidale and oriens in much lower numbers. These cells were multipolar or bitufted with two to five primary dendrites running in all directions, often descending to stratum oriens, but only very rarely entering stratum lacunosum-moleculare. Type II cells could be found exclusively in stratum oriens. They had large, fusiform cell bodies and several long, horizontally oriented dendrites. Because type II cells were found to project to the medial septum and thus are not typical local interneurons, we did not include them in our samples.
We selected 19 cells from all parts of stratum radiatum with variable morphologies belonging to type I. Because the horizontal extent of the dendritic trees were the largest in the case of the CB cells, they had to be reconstructed from 4–11 consecutive sections to reach the natural ends of each dendrite. CB cells had three to six primary dendrites (4.053 ± 1.08) and a rather variable total dendritic length (3441.12 ± 937.59 μm). The great majority of dendrites were restricted to stratum radiatum (76.2%; Table 2). The largest variation in the length of individual dendrites were seen in the case of CB cells.
The sampled cells showed different morphological features. In one end of the spectrum were cells with multipolar morphology (Fig. 1, first cell). Here five or six dendrites arose from the cell bodies and ran in all directions, often spanning a considerable distance horizontally. These cells were mainly located in the middle or bottom half of stratum radiatum. Cells on the other extreme (Fig. 1, second cell) had one or two dendrites descending through stratum pyramidale into stratum oriens and several dendrites extending radially toward the stratum radiatum/lacunosum-moleculare border. These cells were more often located in the top half of stratum radiatum. The majority of the CB cells had morphological features somewhere between the two extremes, with a continuous distribution. Only occasional short dendritic segments entered stratum lacunosum-moleculare, independent from other morphological features.
Generally, the diameter of the dendrites was small in the case of CB cells (Table 1), and varied between 0.2 and 1.8 μm. Dendrites arising from the soma were thick and branched within 50–100 μm of origin. The dendrites did not necessarily change their diameter to medium after the first bifurcation, but might taper after a few hundred micrometers without branching. The CB cells were much less beaded than PV cells. Thick and medium dendrites were always smooth, whereas thin dendrites could be irregular or rarely beaded.
Dendritic tree of CR-containing neurons
Two types of CR cells, a spiny and a spine-free type, have been described in the hippocampus (Gulyás et al., 1992). In the CA1 area, only spine-free CR cells are present (Gulyás et al., 1996), although they can be found in all layers, even in the hippocampal fissure, showing a rather even laminar distribution. The dendrites arise from multipolar, bipolar, or fusiform cell bodies and run primarily radially, traversing several layers. Dendrites of neighboring cells often form dendrodendritic contacts.
We selected 29 cells with cell bodies located in stratum pyramidale and lower stratum radiatum. CR cells had the smallest total dendritic length (2499.41 ± 946.34 μm, significantly different from both PV and CB cells). Their dendrites ascended or descended radially invading all layers, similar to the PV cells. However, CR cells had fewer primary dendrites (2.97 ± 0.94), and the laminar distribution of the dendritic tree was even more balanced than in the case of PV cells (Table 2). The sampled cells showed rather homogenous morphological features. The diameter of the dendrites and thus the diameter of the subclasses were similar to CB cells (varied between 0.2 and 1.6 μm; Table 1). The dendritic surface, particularly of the thickest dendrites, was more irregular or beaded than the dendrites of PV cells. Thick dendrites almost always had an irregular appearance. Medium dendrites were either irregular or beaded, whereas thin dendrites were always beaded.
Calculation of the somatic surfaces
To estimate the number of synapses converging onto the somata, first we had to measure the surfaces of the somata for all the three examined cell types (Table 2, Fig. 2B). The soma diameters and surfaces correlated with the size of the dendritic trees, thus PV cells had the largest (1006 ± 183 μm2), and CR cells had the smallest (520 ± 154 μm2) surface. CB cells were in between (798.56 ± 139.61). The difference between PV and CR cells was almost twofold and statistically significant (p < 0.05).
Electron microscopic investigation of synaptic input densities
At the electron microscopic level, the examined dendrites and somata shared all characteristic features of interneurons. The dendrites had no spines, they received excitatory and inhibitory inputs on their shaft. The cytoplasm of both the dendrites and the somata were electrondense and possessed numerous mitochondria. The somata contained large amounts of rough endoplasmic reticulum and ribosomes. The nuclei were invaginated and often had intranuclear rods. The irregularity of the dendrite diameters apparent at the light microscopic level were also observed in the electron microscope.
PV-immunoreactive dendrites
From the three examined populations, PV dendrites received the most abundant innervation. As demonstrated in Figures 3, 5, and7A and Table 4, the density of synapses was two or three times higher than on the other two cell groups for all layers and thickness subclass. The diameter of the PV dendrites, as already seen at the LM level, was also larger than the similar dendrite subclasses of the other cell populations. They possessed the largest number of mitochondria, which were often clustered within the thick varicosities of the medium or thin dendrites. Thick dendrites were usually fairly even in diameter.
Fig. 3.

Distribution of excitatory and inhibitory inputs on medium-diameter dendrites of PV-, CB-, and CR-immunoreactive interneurons in CA1 stratum radiatum. The dendrites and the synapses were reconstructed from serial ultrathin sections immunostained for GABA. A large difference can be seen both in the absolute and relative number of excitatory and inhibitory synapses terminating on the three types of dendrites. The surface of the PV-positive dendrite is densely covered by synapses in contrast to the sparse innervation of CB- and CR-positive dendrites. On the other hand, the proportion of inhibitory terminals compared to all synaptic inputs is lowest on the PV and highest on the CB dendrites. Excitatory terminals are colored_light gray_, GABAergic inhibitory boutons are_dark_. Note the large variance in the size of axon terminals. GABA-negative and GABA-positive axon terminals labeled with e1–e9 and i1–i4, respectively, are shown in electron micrographs in Figure 4. Scale bar, 1 μm.
Fig. 5.
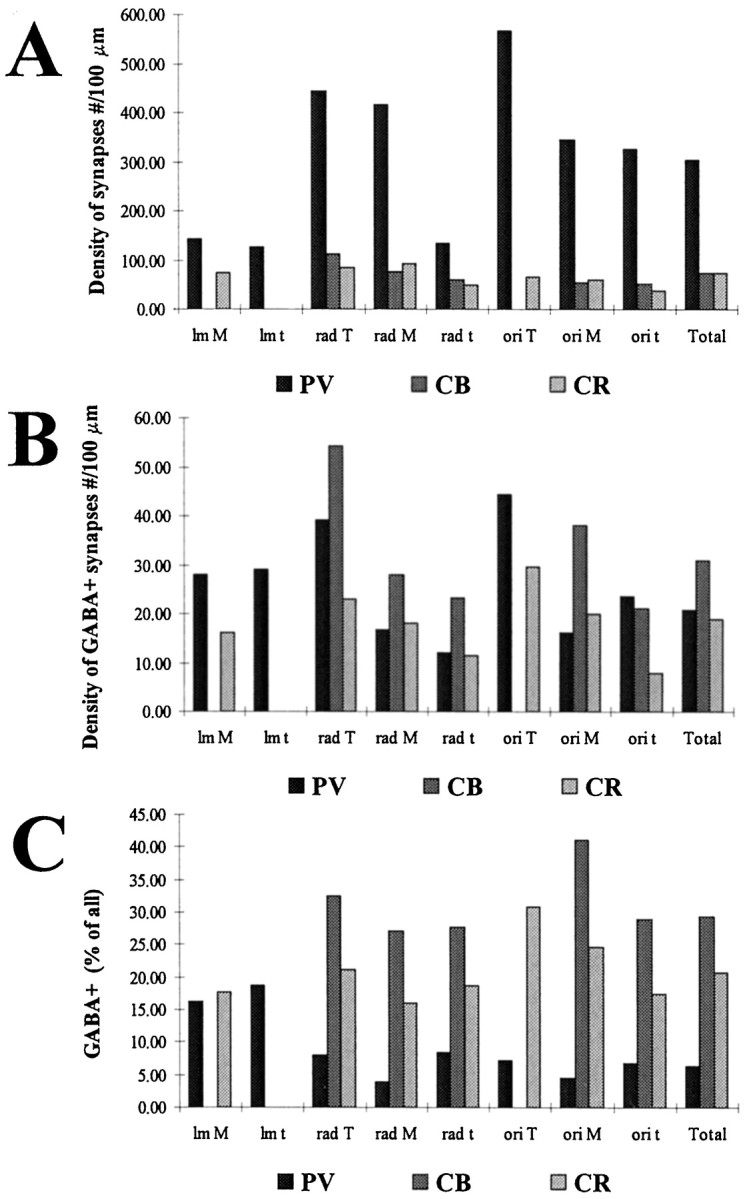
Density of total synaptic input (A) and GABA-positive (B) synapses, as well as the ratio of terminals positive for GABA (C) terminating on different dendrite subclasses of the examined interneuron populations. Densities are expressed in number of synapses per 100 μm. The density of synapses is largest on PV dendrites (A), regardless of the layer or dendrite subclass. Conversely, the density of GABA-positive terminals is largest on CB dendrites (B), which means that the ratio of GABA-positive inputs is much higher on CB than on PV dendrites (C). For abbreviations, see Table1.
Fig. 7.

Absolute number (A) and proportion (B) of excitatory and inhibitory synapses converging onto the three examined cell populations. PV-positive cells received several times more excitatory input than CB or CR cells. The ratio of inhibition was highest on CB cells and lowest on PV cells. The SEM seen in the Tables derives from the SEM of dendritic length measurements and is not indicated here.
Table 4.
Synaptic densities on examined dendrite subclasses and somata
| Type | PV | CB | CR | |||||||||
|---|---|---|---|---|---|---|---|---|---|---|---|---|
| Total | Excitatory | Inhibitory | GABA- positive (% of all) | Total | Excitatory | Inhibitory | GABA- positive (% of all) | Total | Excitatory | Inhibitory | GABA- positive (% of all) | |
| Lm M | 171.34 | 143.44 | 27.89 | 16.28 | + | + | + | + | 91.44 | 75.31 | 16.14 | 17.65 |
| Lm t | 155.72 | 126.75 | 28.97 | 18.60 | *** | *** | *** | *** | **** | **** | **** | **** |
| Rad T | 483.81 | 444.68 | 39.13 | 8.09 | 167.86 | 113.51 | 54.35 | 32.38 | 108.36 | 85.36 | 23.00 | 21.23 |
| Rad M | 432.68 | 416.01 | 16.67 | 3.85 | 103.41 | 75.44 | 27.97 | 27.04 | 111.97 | 93.93 | 18.04 | 16.11 |
| Rad t | 145.63 | 133.50 | 12.14 | 8.33 | 84.37 | 61.01 | 23.36 | 27.69 | 61.21 | 49.73 | 11.48 | 18.75 |
| Pyr M | * | * | * | * | ** | ** | ** | ** | 70.89 | 42.53 | 28.36 | 40.00 |
| Ori T | 612.94 | 568.45 | 44.49 | 7.26 | + | + | + | + | 96.09 | 66.39 | 29.70 | 30.91 |
| Ori M | 361.08 | 344.95 | 16.13 | 4.47 | 92.76 | 54.56 | 38.19 | 41.18 | 81.41 | 61.36 | 20.06 | 24.64 |
| Ori t | 348.54 | 325.08 | 23.46 | 6.73 | 72.45 | 51.48 | 20.97 | 28.95 | 45.87 | 37.89 | 7.98 | 17.39 |
| Total | 325.60 | 304.89 | 20.72 | 6.36 | 105.46 | 74.42 | 31.03 | 29.43 | 91.85 | 72.83 | 19.02 | 20.71 |
| Somatic | 58.79 | 40.70 | 18.09 | 30.77 | 30.72 | 12.75 | 17.97 | 58.49 | 25.77 | 14.22 | 11.55 | 44.83 |
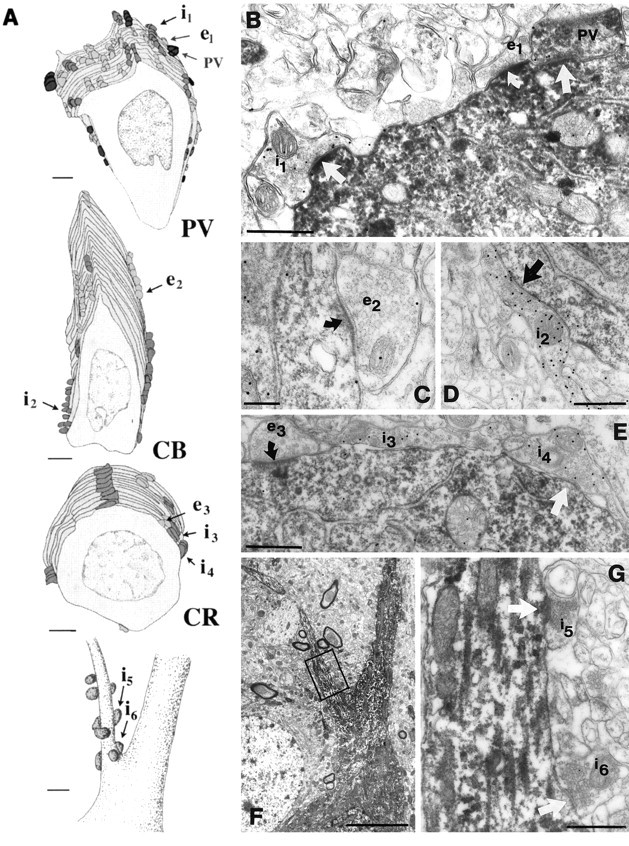
We distinguished three types of terminals forming synapses on the PV dendrites (Fig.4A,B): (1) GABA-negative terminals forming asymmetrical synapses, (2) GABA-positive terminals forming symmetrical synapses, and (3) GABA-positive terminals also showing PV immunoreactivity. In the latter case, the density of gold particles was lower than in other GABA-positive terminals, most probably because of the DAB end product masking the immunoreactive GABA epitopes. Although the PV immunoreaction end product often precipitated on the postsynaptic sites, the symmetrical or asymmetrical nature of the synapses could be established in most cases, especially in dendrites with weaker immunostaining for the calcium-binding protein. In all cases the GABA-positive or GABA-negative character of the terminals correlated with the type of the synaptic active zones. We saw a large variation in the size of presynaptic terminals (Fig. 4A, e1–e5, i1) and in the size of synaptic active zones. Since in this study we did not intend to measure these characteristics, only the number of sections containing a terminal or a synapse was recorded. We found that qualitatively the terminal size correlated with the size of the synaptic specialization and the number of vesicles (Pierce and Lewin, 1994). In general, GABA-positive and PV-positive axon terminals were larger (six to eight sections) than GABA-negative terminals (three to six sections; Fig. 4, e vs i, PV). The same variability and size differences among terminal types were seen for synaptic terminals in contact with CB and CR dendrites as well.
Fig. 4.
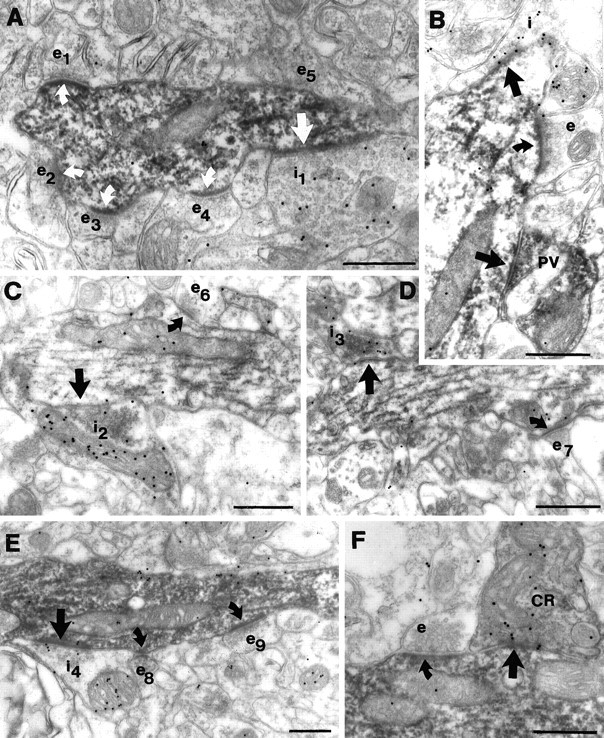
Types of afferent boutons on the dendrites of the examined interneuron populations. A, B, PV-positive dendrites received synapses from GABA-negative (e1–e5), GABA-positive (i1), as well as PV/GABA-positive terminals. From the five excitatory terminals (e1–e5) contacting a short section of the reconstructed dendrite shown in Figure 3, four (e1–e4) formed asymmetrical synapses (curved white arrows) in this plane of section. The large GABA-positive terminal (i1) also formed a synapse (white arrow) with the dendrite, however, as often happens in immunostained material, the symmetrical nature of the synapse is not evident because of the DAB precipitate in the postsynaptic profile. B demonstrates a GABA-negative, likely excitatory (e), a GABA-positive inhibitory (i), and a PV-positive (PV) terminal forming synapses on a PV-positive (nonreconstructed) dendrite. C, D, Electron micrographs of two parts of the reconstructed CB dendrite in Figure 3 demonstrate the large variation in the size of GABA-negative excitatory (e6 vs e7) and GABA-positive inhibitory (i2 vs i3) terminals forming asymmetrical (curved arrows) and symmetrical (arrow) synapses. _E, F,_CR-positive dendrites, besides the GABA-positive and -negative terminals, might receive inputs from CR-immunoreactive axons as well. Excitatory terminals e8 and e9 and the inhibitory synapse i4 contact the reconstructed dendrite shown in Figure 3. In F a dendrite (not shown in Fig. 3) is innervated by a GABA-positive CR-positive axon terminal as well as by a GABA-negative (e) terminal. Scale bars, 0.5 μm.
In spite of the high density of total synaptic input, the density of GABA-positive terminals was nearly equal to or lower than the density of GABAergic terminals on the CR and CB dendrites, respectively (Fig.5B). It follows that the proportion of GABA-positive terminals was two to five times lower on PV dendrites than on CR and CB dendrites in stratum oriens and stratum radiatum (Fig. 5C). The ratio of GABA-positive terminals was higher in stratum lacunosum-moleculare, but still below the value for CB dendrites in other layers.
Terminals immunoreactive for both PV and GABA were responsible on average, for a quarter of the GABA-positive inputs (27.6%). They were concentrated in the perisomatic region, where they formed 45 and 61% of the local inhibitory terminals on thick dendrites in strata radiatum and oriens, respectively (for somata see below). It is important to note here that immunostaining for PV consistently visualizes the PV-containing dendrites, but the staining of PV-positive main axons, and especially axon terminals may vary a lot depending on the quality of fixation. This suggests that the PV level in axon terminals is around the detection threshold of the antibody we used. Therefore, the above values are likely to underestimate the real ratio of PV-positive GABAergic terminals.
CB-immunoreactive dendrites
The density of synaptic inputs on CB dendrites is lower than that on PV cells, and is close to the values found on CR cells. The diameters of the dendrites were generally smaller, but more uniform, and they possessed less mitochondria. Varicose CB dendrites were rare compared to those of PV neurons. The majority of CB dendrites are located in stratum radiatum. Considerable amounts of dendrites can be found in stratum oriens as well, and only a minimal number in stratum lacunosum-moleculare. For electron microscopy, we sampled dendrites in stratum radiatum and stratum oriens and found that the distribution of afferent synapses was similar in these two layers. Two types of terminals could be distinguished: GABA-negative forming asymmetrical synapses and GABA-positive making symmetrical synapses (Fig.4C,D). The variability and size differences of GABA-negative and -positive terminals were similar to those seen in the case of PV dendrites. The density of excitatory terminals was rather low compared to PV cells and showed little variation among dendrites of different thickness, with the highest density of inputs on stratum radiatum thick dendrites. The density of GABA-positive terminals was slightly higher on CB dendrites compared to PV dendrites (with some variability), resulting in the highest ratio of GABA-positive terminals among interneuron types examined (Table 4, Figs. 4, 5C).
CR-immunoreactive dendrites
The density of synaptic inputs was lowest on the CR dendrites, but only slightly below the values for CB dendrites. The diameters of the CR dendrites were similar to those of CB dendrites, but these, being the most beaded from the three examined cell types at the light microscopic level, showed rather large variability in diameter.
We distinguished three types of input onto CR dendrites: (1) GABA-negative terminals forming asymmetrical synapses, (2) GABA-positive terminals forming symmetrical synapses, and (3) GABA-positive terminals also immunoreactive for CR, because CR cells are known to form frequent axo-dendritic contacts with each other (Gulyás et al., 1992, 1996). The density of excitatory synaptic inputs onto CR dendrites, with some variability, was similar to the values obtained for CB dendrites. However, the density of GABA-positive inputs was close to that of PV cells. This way the density of total afferent synapses was the lowest for CR cells, and the percentage of GABA-positive terminals higher than for PV dendrites, but lower than for CB dendrites. The ratio of inhibitory terminals increased slightly toward the perisomatic region (Table 4; see Fig. 10).
Fig. 10.
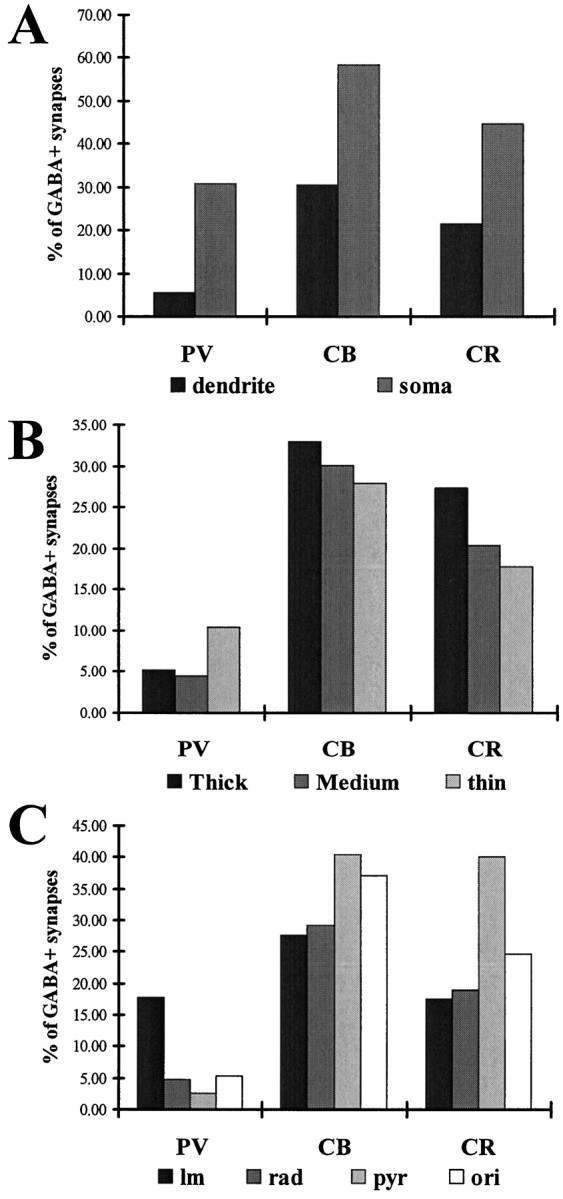
Ratio of inhibitory inputs on different compartments calculated from total convergence values.A, The ratio of inhibitory synapses on somata was higher than on dendrites for all cell populations. B, Ratio of inhibition versus dendrite thickness. Thinner and thus more remote dendritic regions had a lower percentage of inhibitory terminals than the proximal dendrites in the case of CB and CR cells. A similar trend was seen on PV cells in the case of thick and medium dendrites. The trend broke in the case of thin dendrites, most probably because a large amount of thin dendrites were found in stratum lacunosum-moleculare, where the ratio of inhibition is generally higher. C, The ratio of inhibition in different layers for the three cell types.
Similar to the PV–PV contacts, approximately a quarter of the GABA-positive terminals on CR neurons contained CR (26.9%). However, in contrast to the PV terminals, which were predominantly found in the perisomatic region, CR terminals were distributed rather evenly throughout the dendritic tree.
Density of inputs onto the somata
The reconstructions of the soma surfaces (Table 2, Figs.6_A,_7) and the calculation of the synaptic densities (Table 4; Fig. 8) showed that, similar to the dendritic trees, PV-positive somata received the highest density and CR cell bodies the lowest density of synaptic input. Besides the GABA-positive terminals, the somata of the examined interneuron populations also received abundant GABA-negative asymmetrical synapses as well (Fig. 6B–E), which is a characteristic feature distinguishing interneurons from pyramidal cells. The proportion of GABAergic terminals was higher on the somata than on the dendrites for all three cell types (Table 4). Similar to the dendrites, CB somata received the strongest GABAergic innervation, and PV cell bodies the weakest. In the case of PV cells, a large portion (70%) of the GABA-positive terminals also contained PV (Fig. 4B). In the case of CR somata, the ratio of CR- and GABA-positive terminals represented only 11.5% of all GABA-positive terminals, supporting the conclusion drawn from the distribution of CR-positive terminals that inputs from other CR cells are not concentrated in the perisomatic region, unlike in the case of PV–PV connections.
Fig. 6.
Afferents on the somata and axon initial segments of interneurons. A, Partial reconstructions of the somatic inputs of a PV, a CB, and a CR neuron, as well as the distribution of axo-axonic synapses on the axon initial segment of a PV neuron. Inhibitory cells receive both excitatory (light gray) and inhibitory (dark gray and_black_) inputs onto their somata. A large proportion of the somatic inhibitory terminals on the PV somata came from PV-positive axon terminals (black). Eight to twelve axo-axonic synapses terminate on the axon initial segment of an interneuron. Innervation of the axon initial segment of a PV neuron is shown at the_bottom_ of the panel. The axo-axonic synapses clustered close to the soma at the very beginning of the axon initial segment. Terminals labeled i1–i6 and e1–e3 are shown in electron micrographs in B–G. _B,The three types of somatic input arriving onto PV cells are shown in the electron micrograph. Bouton e1 is a GABA-negative (presumed excitatory) terminal. Similar to the dendritic contacts, GABA-positive terminals could be PV-positive (PV) or negative (i1). C–E, CB- and CR-positive somata also received GABA-negative (excitatory, e2, e3) and GABA-positive (inhibitory, i2, i3-i4) synapses, but in a lower density than PV-containing somata. F, G, Low- and high-power electron micrographs of the axon initial segment (A) receiving symmetrical synapses. Note in_A that the proportion of inhibitory terminals is higher in the somatic region than in the dendritic tree for all examined populations. In B–E and G, curved arrows indicate asymmetrical synapses, _arrows_indicate symmetrical synapses. Scale bars: A, 2 μm for somata, 1 μm for AIS; B, D,E, G, 0.5 μm; C, 0.25 μm; F, 5 μm.
Fig. 8.

Characteristics of the somatic input.A, Density of somatic synapses (number of synapses per 100 μm2) and the ratio of GABA-positive terminals (expressed as percentage). The density of synapses, similarly to the values on the dendrites, were highest for PV cells and similar for the other two cell populations. The ratio of GABAergic terminals was higher than on the dendrites. B, Calculated total number of excitatory and inhibitory synapses on the somata of PV, CB, and CR cells, as well as the number of inhibitory synapses converging onto the axon initial segments. Because of their larger size, PV cells received many more inputs than the CB and especially the CR cells.
Innervation of the axon initial segments
Serial reconstructions (Fig. 6A; n = 3–3) showed that, in contrast to earlier data, interneurons do receive innervation onto their axon initial segments (AISs). Eight to twelve axon terminals formed symmetrical synapses on the first 10–15 μm of the AISs (Fig. 6F,G). Further synapses were not found on the examined first 30 μm of the AIS. The average number of axo-axonic terminals per cell did not differ significantly for the examined cell populations (Table5). In the case of PV-immunostained material, none of the terminals forming symmetrical synapses on AISs contained PV (Fig. 6A).
Table 5.
Estimated total number of excitatory and inhibitory synapses converging onto interneurons
| PV | CB | CR | ||||
|---|---|---|---|---|---|---|
| Excitatory | Inhibitory | Excitatory | Inhibitory | Excitatory | Inhibitory | |
| Dendritic input | 14824 ± 3949 | 868 ± 225 | 2498 ± 666 | 1087 ± 277 | 1605 ± 626 | 438 ± 159 |
| Somatic input | 413 ± 40 | 177 ± 17 | 102 ± 10 | 142 ± 15 | 77 ± 14 | 57 ± 10 |
| AIS | — | 10 ± 2 | — | 7 ± 1 | — | 8 ± 1 |
| Total synapses | 15238 | 1055 | 2601 | 1237 | 1682 | 503 |
| Excit. + inhib. | 16294 | 3839 | 2186 |
Calculation of the total number and distribution of afferent synapses
Using the data set on the total length of different dendrite subclasses in different layers and the respective electron microscopic data sets for the three examined cell populations, we calculated the total number and distribution of excitatory and inhibitory inputs onto PV, CB, and CR cells. For the calculations, the average length of a given dendrite subclass was multiplied with the density of synapses on the same subclass. There were however some dendrite subclasses in the light microscopic data set that were not sampled for electron microscopy because they contributed only minimally to the total length, and therefore the time-consuming process of sampling was not feasible. For those subclasses where the synaptic densities were not sampled, we used density values of dendrites from a neighboring layer with the same thickness, because these dendrites were the most similar in appearance to the nonsampled segments (for the replacements, see Table 4footnote). To calculate the convergence in the somatic region, we multiplied the average soma surface with the density of input synapses.
Total number of inputs on PV, CB, and CR cells
First we calculated the total number of excitatory and inhibitory inputs converging onto all dendritic classes of each neurons. The values for dendritic convergence are shown in the first row of Table 5. Values for the somatic convergence and the input of axon initial segments are shown in Figure 8B and Table 5. Averages and SEs in Table 5 derive from the calculated convergence onto each light microscopically reconstructed cells. For detailed values of convergence onto individual cells, see the above-mentioned www page. Concerning both the total convergence, as well as the inputs onto different domains (dendritic, somatic, AIS), PV cells received the largest number of synapses (Fig. 7, Table 5). The total number of synapses converging onto an average PV cell was six to eight times larger than that onto CB and CR cells. This large difference is because of the fact that PV cells have the largest dendritic tree, and the density of synaptic inputs is the highest on their dendrites. As expected from the density data, and as demonstrated in Figure 7B, the ratio of excitatory versus inhibitory terminals is strikingly different on the three cell populations. PV cells receive the smallest proportion of inhibitory synapses (6.4%), whereas CR (20.7%) and especially CB cells (29.4%) receive much more (Fig. 7B). Differences in the somatic input followed the pattern seen for the dendrites: PV cells received the most numerous synaptic inputs and CR cells the least (Table 5). The largest proportion of inhibitory terminals arrived onto CB and the smallest onto PV cell bodies. The percentage of inhibitory synapses was higher for the somata than the dendritic region for all cells.
Layer- and cell compartment-specific distribution of excitatory and inhibitory inputs
The distribution of total synaptic input (A, C) and inhibitory (B,D) terminals among layers is demonstrated in Figure 9. In C and_D_, which show the relative distribution of inputs, CB cells are seen to receive the vast majority of their excitatory and inhibitory input in stratum radiatum. Thus, they receive excitatory input predominantly from Schaffer collaterals. The inputs are more evenly distributed among the layers for CR and PV cells, although the excitatory input onto PV cells relative to the inhibitory input is smaller in stratum lacunosum-moleculare than in other layers. The relative contribution of perforant path and/or reuniens thalami fibers is highest on CR cells, but it is still only about a third of the Schaffer collateral input.
Fig. 9.
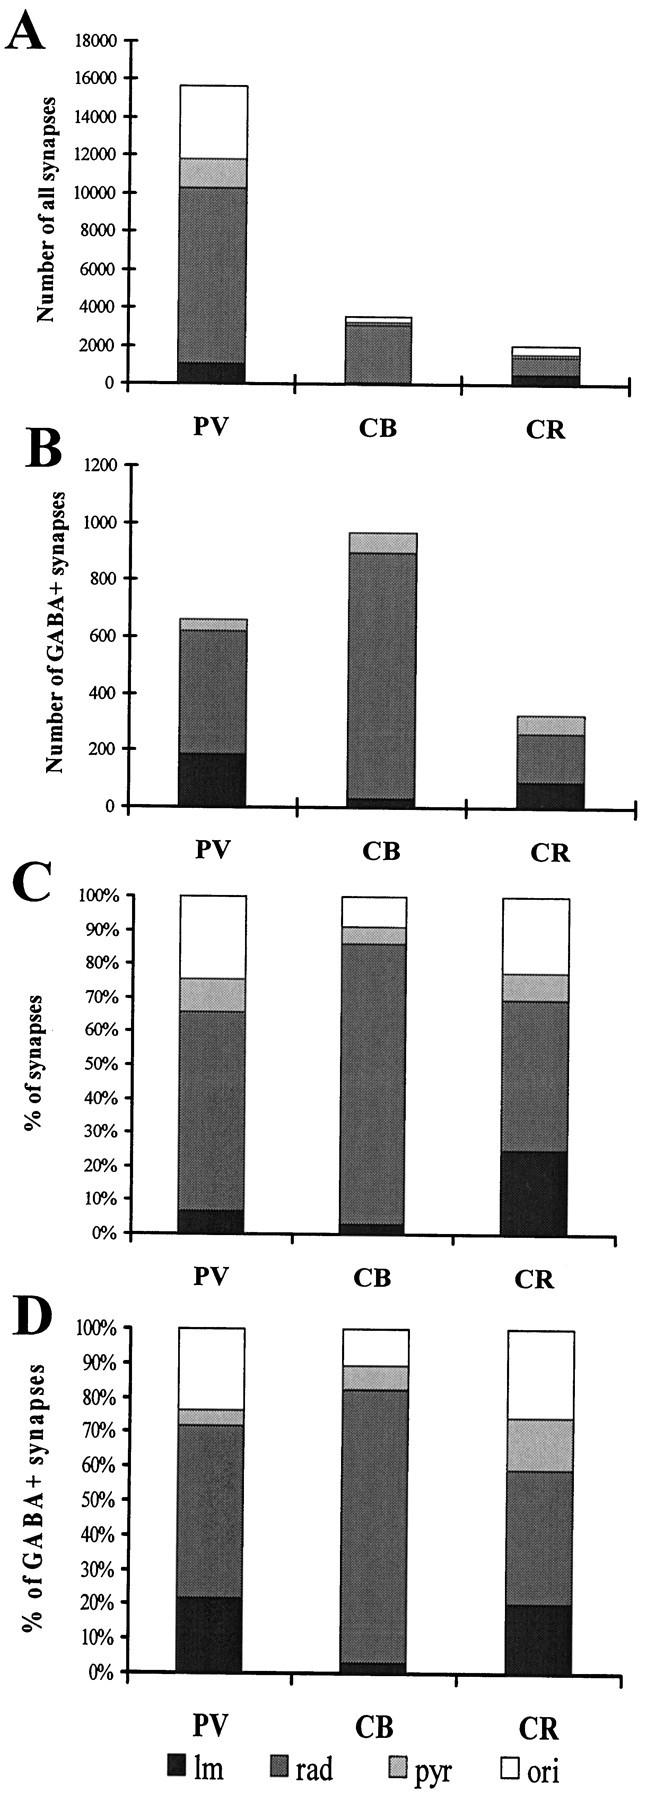
Distribution of all (A, C) and inhibitory (C, D) terminals on dendrites in different layers. A and B show the absolute, whereas C and D show the relative weight of inputs within different layers. CB cells receive most of their excitatory and inhibitory inputs in stratum radiatum. The input of the PV and especially the CR cells is more balanced.
We examined the proportion of inhibitory terminals on the soma, as well as on dendrites of different thickness, at different distances form the soma and in different layers (Fig. 10). Our first finding was that the ratio of inhibitory terminals is always higher on the somata than on the dendrites, irrespective of the laminar location (Fig. 10A). The second observation along the same lines was that, for CB and CR cells, inhibitory synapses on thick dendrites were always larger in number than on the medium diameter and thin dendrites (Fig. 10B, Table 4). If data were summed for all layers, the ratio of inhibitory terminals correlated with the dendritic diameter. For PV cells, inhibitory contacts were of similar density on thin dendrites than on thick dendrites. Dendrite thickness does not necessarily correlate with the distance from the soma, because for a PV or CR cell, a stratum lacunosum-moleculare medium dendrite is further away from the soma than a stratum radiatum thin dendrite (the diameter of dendrite subclasses was defined separately within each layer). Therefore, we calculated the proportion of inhibitory synapses on proximal, medium distal, and distal dendrites as well. The distribution matched the findings for the simple dendrite thickness calculations. Namely, proximal dendrites of CB and CR cells received relatively larger amounts of inhibitory terminals than the distal segments. For PV cells, the proportion of inhibitory synapses on dendrites did not correlate with the distance either.
The analysis of proportion of inhibition in different layers revealed that the ratio of inhibitory terminals differs among layers for each cell population (Table 4, Fig. 6C). In the case of CB and CR cells the variation is relatively small, but PV cells receive considerably more inhibition onto their dendrites in stratum lacunosum-moleculare (∼18%) than in other layers (∼5%). This suggests that, for PV cells, the inputs from the perforant pathway and/or the nucleus reuniens thalami are under a stronger inhibitory control than the synapses formed by Schaffer collaterals in strata radiatum and oriens.
Analysis of the relative distribution of inhibitory synapses among different domains (Fig. 11) revealed that relative to its size, the soma receives a disproportionately high ratio of the total inhibitory inputs. PV cell somata possess the largest share of inhibitory terminals (16.9% of all GABAergic boutons), and those of CB cells possess the lowest (11.7%). The contribution of terminals on the axon initial segments is negligible, at least regarding their number.
Fig. 11.

Relative distribution of GABA+inhibitory terminals on different domains of the examined cell types. Note that although the relative surface of the somata is small compared to the total dendritic surface, a large portion of the inhibitory inputs (15–20%) converges onto the perisomatic region (darker shades, soma, and AIS) in the case of PV cells. The contribution of dendritic inhibition (lighter shades, thin, medium, thick dendrites) is highest for CB cells and lowest for PV cells.
DISCUSSION
The main findings of the present study are: (1) the total dendritic length and diameter is largest for PV cells and smallest for CR cells; (2) the density of inputs and thus the total number of afferent synapses is several times higher on PV cells than on CB or CR cells, whereas the ratio of inhibitory inputs is significantly higher on CB and CR cells, suggesting that there is no obvious correlation between the number of excitatory and inhibitory inputs converging onto neurons; (3) the relative distribution of excitatory and inhibitory inputs among different layers show interneuron-specific differences; and (4) inhibitory terminals are concentrated in the perisomatic and proximal dendritic regions, irrespective of the laminar location of the soma.
Technical considerations
The question of shrinkage and the accuracy of the pseudo-3D reconstruction algorithm has been discussed in Materials and Methods. Error may be introduced by incomplete visualization of cells using immunocytochemistry. We minimized this problem by applying a combination of sensitivity-increasing steps (see Materials and Methods), achieving that dendrites could clearly be followed until their natural ends. Throughout the study we considered GABA-negative terminals to be mostly excitatory. This obvious oversimplification does not introduce significant error for two reasons: first, GABA-negative terminals encountered bore the characteristic features of glutamatergic synapses, i.e., they formed asymmetrical synapses and possessed medium-size round vesicles; second, the majority of hippocampal synapses are formed either by GABAergic or glutamatergic terminals because fibers of diverse neurochemical nature arriving from subcortical areas are relatively sparse, and most of them carry varicosities that are largely nonsynaptic (Oleskevich et al., 1991;Umbriaco et al., 1995)
Large differences in synaptic convergence among the examined cell types
PV cells possessed the largest dendritic tree, soma surface, as well as the highest density of afferent synapses, thus the total number of synapses converging onto the cells is several times (∼4–8) higher than on CB or CR cells. Furthermore, the majority of afferents on PV cells is excitatory (93.6%) with a sparse inhibitory input. Pyramidal cells form mostly single synaptic contacts on their target elements (Gulyás et al., 1993b; Sik et al., 1993), thus the number of converging principal cells probably closely matches the number of excitatory inputs. In contrast, interneurons form multiple contacts with their targets (Gulyás et al., 1993a; Buhl et al., 1994;Miles et al., 1996), thus the number of converging afferent inhibitory cells must be severalfold lower. The large difference in the convergence of excitatory and inhibitory inputs among the cells matches the findings (Soltesz et al., 1995; Miles et al., 1996) that the activity level of hippocampal basket cells (the majority of them PV-immunoreactive) is higher than the activity level of other interneuron populations. This however is not necessarily the consequence of the stronger excitatory drive, because several other factors influence the activity of a given neuron. Passive and active membrane properties (and their distribution) might be different on the examined cell populations, and that would significantly effect the threshold and pattern of firing.
Inhibition is concentrated in the perisomatic region and on proximal dendrites
Regardless of the total contribution of inhibitory terminals to the synapses converging onto a cell type, the ratio of inhibitory terminals was highest on the somata, still high on proximal dendrites, and lowest on thinner distal dendrites (except for PV dendrites in stratum lacunosum-moleculare). In a modeling study (M. Megias, Z. Emri, K. Antal, T. F. Freund, A. I. Gulyás, unpublished observations) using realistic neurons based on the geometry of our reconstructed cells, we demonstrated that in the model neurons the diameter (and thus the surface/volume ratio) of a compartment affects the interaction of EPSPs and IPSPs. In the perisomatic region, more inhibitory terminals are required to ensure the same efficacy of inhibition (same reduction in EPSP amplitude) than in the distal dendritic region, which may explain why the relative abundance of inhibitory terminals is higher in the perisomatic region.
The sources of inputs of different interneuron populations
The relative contribution of afferent pathways to the inputs of the examined interneurons was different (Fig. 9). CB cells showed the strongest input selectivity. They received most of their inputs in stratum radiatum and almost none in stratum lacunosum-moleculare. PV, and especially CR cells, showed a more balanced dendritic distribution, receiving synapses in all layers of the hippocampus. Thus, CB cells seem to receive input primarily from the Schaffer collaterals and hardly any from the entorhinal or reuniens thalami afferents. The other two cell populations receive input from all pathways present in CA1. The high input selectivity of CB cells suggests that they are activated largely in a feedforward manner by CA3 pyramidal cells. In contrast, PV and CR cells can be activated in a feedforward manner by the Schaffer collaterals and entorhinal/reuniens thalami afferents, as well as in a feedback manner by the local CA1 pyramidal cell collaterals. Local collaterals of CA1 pyramidal cells were shown earlier to terminate primarily on horizontal interneurons in stratum oriens (Blasco-Ibanez and Freund, 1995), as suggested also by the physiological evidence for feedback activation of these interneuron types (McBain et al., 1994;Ali and Thomson, 1998).
Because CB cells mediate dendritic inhibition of principal cells (Gulyás and Freund, 1996), the laminar distribution of their dendrites suggests that dendritic inhibition of pyramidal cells in the CA1 area is primarily driven by Schaffer collaterals in a feedforward manner. In contrast, perisomatic inhibition, which is mediated, at least in part, by the PV-containing basket and axo-axonic cells (Kosaka et al., 1987) can be activated both in a feedforward and feedback manner. The CR cells, which selectively innervate other interneurons (Gulyás et al., 1996) and may play an important role in the generation of hippocampal high frequency oscillations, receive both feedforward and feedback excitation.
The proportion of inhibitory synapses in specific layers was different, suggesting that excitatory inputs from various sources are under different degrees of inhibition. The inhibitory control seems to be relatively strong (18–40%) for the perforant path/reuniens thalami input of PV cells and for all input pathways converging onto CB and CR cells. In contrast, the inhibitory control of the Schaffer collateral and CA1 pyramidal cell recurrent collateral excitation of PV cells appears to be relatively weak (3–5%).
Two parallel systems of mutually connected interneurons
In the case of CR and PV cells, a considerable proportion (∼27%) of their inhibitory input arrives from axon terminals stained for the same neurochemical marker. PV cells innervate each other primarily in the perisomatic region, whereas CR cells innervate each other throughout all somatodendritic compartments. Earlier data indicated that CR cells do not innervate PV neurons (Gulyás et al., 1996). On the other hand, PV terminals are confined to strata pyramidale and proximal oriens, therefore even if they contacted CR cells, the number of these contacts is likely to be negligible. Thus, two groups of interneurons appear to exist where connections between the groups are sparse or nonexistent, whereas individual members of each group are extensively connected to each other. These two inhibitory cell ensembles are therefore largely independent and have profoundly different efferent connectivity. PV cells have a direct effect on pyramidal cells, whereas CR cells influence pyramidal cells only indirectly, via the innervation of CB cells, VIP/CCK-containing basket cells (Gulyás et al., 1996) and somatostatin-containing cells (Acsady et al., 1996). Mutual inhibitory connections were suggested to be responsible for the generation of rhythmic, synchronous activity patterns (Perkel and Mulloney, 1974; Mulloney et al., 1981;Wang and Rinzel, 1993; Whittington et al., 1995). Modeling studies revealed that the most important factor influencing the frequency of the oscillation is the decay time constant of the IPSCs (Wang and Rinzel, 1993; Traub et al., 1996). Earlier studies suggested that different interneuron populations exert their effect via GABAA receptors with different kinetics (Pearce, 1993; Buhl et al., 1994; Banks et al., 1998). Perisomatic, most probably PV-containing, inhibitory cells were shown to generate faster IPSCs than dendritic inhibitory cell populations. Thus, the two systems might generate oscillations with different parameters. It is noteworthy that only those cells form mutually interconnected networks (PV and CR) that are also driven by entorhinal and/or recurrent input rather than by the Schaffer collaterals alone.
In summary, the present paper provides the first comprehensive set of data about the absolute and relative numbers of inhibitory and excitatory synaptic inputs of three functionally distinct types of GABAergic interneurons. These data are of crucial importance for modeling studies, as well as for interpreting physiological and pharmacological results. In addition, they predict the behavior of these neurons during different network activity patterns in the hippocampus. The PV cells were shown to receive six to eight times more excitatory input than CB or CR cells, and the ratio of inhibitory terminals among their afferent boutons is rather low. Consequently, in PV cells the contribution of individual EPSPs to somatic depolarization is small, but because of their large number they more effectively depolarize the cell than afferents of CB or CR cells. Therefore, the firing of PV cells will follow the average background activity level more faithfully than the output of CB or CR cells, which are more effectively influenced by individual inputs. CB cells are largely activated in a feedforward manner by Schaffer collaterals, whereas PV and CR cells receive additional feedforward input from the entorhinal cortex and local feedback inputs from recurrent collaterals. However, as revealed by the relative density of synaptic inputs, the feedforward drive of PV cells from the CA3 area is probably under a much weaker inhibitory control then their entorhinal inputs or the inputs of CB or CR cells in all layers.
Footnotes
This work was supported by the Howard Hughes Medical Institute, the McDonnell Foundation, National Institute of Neurological Disorders and Stroke (30549), FPI grants, Ministerio de Educación y Ciencia, Spain, and OTKA (National Science Foundation of Hungary) (T23261). We are grateful to Drs. G. Buzsáki, K. Kaila, R. Miles, and I. Mody for helpful discussions and comments on this manuscript and to E. Borók, G. Góda, and E. Oswald for excellent technical assistance.
Correspondence should be addressed to Attila I. Gulyás, Institute of Experimental Medicine, Hungarian Academy of Sciences, P. O. Box 67, H-1450 Budapest, Hungary. E-mail: gulyas@koki.hu.
REFERENCES
- 1.Acsady L, Gorcs TJ, Freund TF. Different populations of vasoactive intestinal polypeptide-immunoreactive interneurons are specialized to control pyramidal cells or interneurons in the hippocampus. Neuroscience. 1996;73:317–334. doi: 10.1016/0306-4522(95)00609-5. [DOI] [PubMed] [Google Scholar]
- 2.Ali AB, Thomson AM. Facilitating pyramid to horizontal oriens-alveus interneurone inputs: dual intracellular recordings in slices of rat hippocampus. J Physiol (Lond) 1998;507:185–199. doi: 10.1111/j.1469-7793.1998.185bu.x. [DOI] [PMC free article] [PubMed] [Google Scholar]
- 3.Amaral DG, Witter MP. The three-dimensional organization of the hippocampal formation: a review of anatomical data. Neuroscience. 1989;31:571–591. doi: 10.1016/0306-4522(89)90424-7. [DOI] [PubMed] [Google Scholar]
- 4.Baimbridge KG, Miller JJ. Immunohistochemical localization of calcium-binding protein in the cerebellum, hippocampal formation and olfactory bulb of the rat. Brain Res. 1982;245:223–229. doi: 10.1016/0006-8993(82)90804-6. [DOI] [PubMed] [Google Scholar]
- 5.Banks MI, Li TB, Pearce RA. The synaptic basis of GABAA,slow. J Neurosci. 1998;18:1305–1317. doi: 10.1523/JNEUROSCI.18-04-01305.1998. [DOI] [PMC free article] [PubMed] [Google Scholar]
- 6.Blasco-Ibanez JM, Freund TF. Synaptic input of horizontal interneurons in stratum oriens of the hippocampal CA1 subfield: structural basis of feed-back activation. Eur J Neurosci. 1995;7:2170–2180. doi: 10.1111/j.1460-9568.1995.tb00638.x. [DOI] [PubMed] [Google Scholar]
- 7.Buhl EH, Halasy K, Somogyi P. Diverse sources of hippocampal unitary inhibitory postsynaptic potentials and the number of synaptic release sites. Nature. 1994;368:823–828. doi: 10.1038/368823a0. [DOI] [PubMed] [Google Scholar]
- 8.Buzsaki G, Chrobak JJ. Temporal structure in spatially organized neuronal ensembles: a role for interneuronal networks. Curr Opin Neurobiol. 1995;5:504–510. doi: 10.1016/0959-4388(95)80012-3. [DOI] [PubMed] [Google Scholar]
- 9.Cobb SR, Buhl EH, Halasy K, Paulsen O, Somogyi P. Synchronization of neuronal activity in hippocampus by individual GABAergic interneurons. Nature. 1995;378:75–78. doi: 10.1038/378075a0. [DOI] [PubMed] [Google Scholar]
- 10.Freund TF, Antal M. GABA-containing neurons in the septum control inhibitory interneurons in the hippocampus. Nature. 1988;336:170–173. doi: 10.1038/336170a0. [DOI] [PubMed] [Google Scholar]
- 11.Freund TF, Buzsaki G. Interneurons of the hippocampus. Hippocampus. 1996;6:345–470. doi: 10.1002/(SICI)1098-1063(1996)6:4<347::AID-HIPO1>3.0.CO;2-I. [DOI] [PubMed] [Google Scholar]
- 12.Freund TF, Gulyás AI, Acsady L, Gorcs T, Toth K. Serotonergic control of the hippocampus via local inhibitory interneurons. Proc Natl Acad Sci USA. 1990;87:8501–8505. doi: 10.1073/pnas.87.21.8501. [DOI] [PMC free article] [PubMed] [Google Scholar]
- 13.Gulyás AI, Freund TF. Pyramidal cell dendrites are the primary targets of calbindin D28k- immunoreactive interneurons in the hippocampus. Hippocampus. 1996;6:525–534. doi: 10.1002/(SICI)1098-1063(1996)6:5<525::AID-HIPO5>3.0.CO;2-H. [DOI] [PubMed] [Google Scholar]
- 14.Gulyás AI, Miettinen R, Jacobowitz DM, Freund TF. Calretinin is present in non-pyramidal cells of the rat hippocampus-I. A new type of neuron specifically associated with the mossy fibre system. Neuroscience. 1992;48:1–27. doi: 10.1016/0306-4522(92)90334-x. [DOI] [PubMed] [Google Scholar]
- 15.Gulyás AI, Miles R, Hájos N, Freund TF. Precision and variability in postsynaptic target selection of inhibitory cells in the hippocampal CA3 region. Eur J Neurosci. 1993a;5:1729–1751. doi: 10.1111/j.1460-9568.1993.tb00240.x. [DOI] [PubMed] [Google Scholar]
- 16.Gulyás AI, Miles R, Sik A, Toth K, Tamamaki N, Freund TF. Hippocampal pyramidal cells excite inhibitory neurons through a single release site. Nature. 1993b;366:683–687. doi: 10.1038/366683a0. [DOI] [PubMed] [Google Scholar]
- 17.Gulyás AI, Hájos N, Freund TF. Interneurons containing calretinin are specialized to control other interneurons in the rat hippocampus. J Neurosci. 1996;16:3397–3411. doi: 10.1523/JNEUROSCI.16-10-03397.1996. [DOI] [PMC free article] [PubMed] [Google Scholar]
- 18.Halasy K, Buhl EH, Lorinczi Z, Tamas G, Somogyi P. Synaptic target selectivity and input of GABAergic basket and bistratified interneurons in the CA1 area of the rat hippocampus. Hippocampus. 1996;6:306–329. doi: 10.1002/(SICI)1098-1063(1996)6:3<306::AID-HIPO8>3.0.CO;2-K. [DOI] [PubMed] [Google Scholar]
- 19.Hodgson AJ, Penke B, Erdei A, Chubb IV, Somogyi P. Antisera to γ-aminobutyric acid. I. Production and characterization using a new model system. J Histochem Cytochem. 1985;33:229–239. doi: 10.1177/33.3.3973378. [DOI] [PubMed] [Google Scholar]
- 20.Kosaka T, Katsumaru H, Hama K, Wu JY, Heizmann CW. GABAergic neurons containing the Ca2+-binding protein parvalbumin in the rat hippocampus and dentate gyrus. Brain Res. 1987;419:119–130. doi: 10.1016/0006-8993(87)90575-0. [DOI] [PubMed] [Google Scholar]
- 21.Li XG, Somogyi JM, Tepper JM, Buzsaki G. Axonal and dendritic arborization of an intracellularly labelled chandelier cell in the CA1 region of rat hippocampus. Exp Brain Res. 1992;90:519–525. doi: 10.1007/BF00230934. [DOI] [PubMed] [Google Scholar]
- 22.McBain CJ, DiChiara TJ, Kauer JA. Activation of metabotropic glutamate receptors differentially affect two classes of hippocampal interneurons and potentiates excitatory synaptic transmission. J Neurosci. 1994;14:4433–4445. doi: 10.1523/JNEUROSCI.14-07-04433.1994. [DOI] [PMC free article] [PubMed] [Google Scholar]
- 23.Miettinen R, Freund TF. Convergence and segregation of septal and median raphe inputs onto different subsets of hippocampal inhibitory interneurons. Brain Res. 1992;594:263–272. doi: 10.1016/0006-8993(92)91133-y. [DOI] [PubMed] [Google Scholar]
- 24.Miettinen R, Gulyás AI, Baimbridge KG, Jacobowitz DM, Freund TF. Calretinin is present in non-pyramidal cells of the rat hippocampus-II. Co-existence with other calcium binding proteins and GABA. Neuroscience. 1992;48:29–43. doi: 10.1016/0306-4522(92)90335-y. [DOI] [PubMed] [Google Scholar]
- 25.Miles R, Toth K, Gulyás AI, Hájos N, Freund TF. Differences between somatic and dendritic inhibition in the hippocampus. Neuron. 1996;16:815–823. doi: 10.1016/s0896-6273(00)80101-4. [DOI] [PubMed] [Google Scholar]
- 26.Mulloney B, Perkel DH, Budelli RW. Motor-pattern production: interaction of chemical and electrical synapses. Brain Res. 1981;229:25–33. doi: 10.1016/0006-8993(81)90742-3. [DOI] [PubMed] [Google Scholar]
- 27.Oleskevich S, Descarries L, Watkins KC, Seguela P, Daszuta A. Ultrastructural features of the serotonin innervation in adult rat hippocampus: an immunocytochemical description in single and serial thin sections. Neuroscience. 1991;42:777–791. doi: 10.1016/0306-4522(91)90044-o. [DOI] [PubMed] [Google Scholar]
- 28.Pearce RA. Physiological evidence for two distinct GABAA responses in rat hippocampus. Neuron. 1993;10:189–200. doi: 10.1016/0896-6273(93)90310-n. [DOI] [PubMed] [Google Scholar]
- 29.Perkel DH, Mulloney B. Motor pattern production in reciprocally inhibitory neurons exhibiting postinhibitory rebound. Science. 1974;185:181–183. doi: 10.1126/science.185.4146.181. [DOI] [PubMed] [Google Scholar]
- 30.Pierce JP, Lewin GR. An ultrastructural size principle. Neuroscience. 1994;58:441–446. doi: 10.1016/0306-4522(94)90071-x. [DOI] [PubMed] [Google Scholar]
- 31.Rogers JH. Two calcium-binding proteins mark many chick sensory neurons. Neuroscience. 1989;31:697–709. doi: 10.1016/0306-4522(89)90434-x. [DOI] [PubMed] [Google Scholar]
- 32.Sik A, Tamamaki N, Freund TF. Complete axon arborization of a single CA3 pyramidal cell in the rat hippocampus, and its relationship with postsynaptic parvalbumin-containing interneurons. Eur J Neurosci. 1993;5:1719–1728. doi: 10.1111/j.1460-9568.1993.tb00239.x. [DOI] [PubMed] [Google Scholar]
- 33.Sloviter RS. Calcium-binding protein (calbindin-D28k) and parvalbumin immunocytochemistry: localization in the rat hippocampus with specific reference to the selective vulnerability of hippocampal neurons to seizure activity. J Comp Neurol. 1989;280:183–196. doi: 10.1002/cne.902800203. [DOI] [PubMed] [Google Scholar]
- 34.Soltesz I, Smetters DK, Mody I. Tonic inhibition originates from synapses close to the soma. Neuron. 1995;14:1273–1283. doi: 10.1016/0896-6273(95)90274-0. [DOI] [PubMed] [Google Scholar]
- 35.Somogyi P, Hodgson AJ. Antisera to γ-aminobutyric acid. III. Demonstration of GABA in Golgi-impregnated neurons and in conventional electron microscopic sections of cat striate cortex. J Histochem Cytochem. 1985;33:249–257. doi: 10.1177/33.3.2579124. [DOI] [PubMed] [Google Scholar]
- 36.Toth K, Freund TF. Calbindin D28k-containing nonpyramidal cells in the rat hippocampus: their immunoreactivity for GABA and projection to the medial septum. Neuroscience. 1992;49:793–805. doi: 10.1016/0306-4522(92)90357-8. [DOI] [PubMed] [Google Scholar]
- 37.Traub RD, Whittington MA, Colling SB, Buzsaki G, Jefferys JG. Analysis of gamma rhythms in the rat hippocampus in vitro and in vivo. J Physiol (Lond) 1996;493:471–484. doi: 10.1113/jphysiol.1996.sp021397. [DOI] [PMC free article] [PubMed] [Google Scholar]
- 38.Umbriaco D, Garcia S, Beaulieu C, Descarries L. Relational features of acetylcholine, noradrenaline, serotonin and GABA axon terminals in the stratum radiatum of adult rat hippocampus (CA1). Hippocampus. 1995;5:605–620. doi: 10.1002/hipo.450050611. [DOI] [PubMed] [Google Scholar]
- 39.Wang X-J, Rinzel J. Spindle rhythmicity in the reticularis thalami nucleus: Synchronization among mutually inhibitory neurons. Neuroscience. 1993;53:899–904. doi: 10.1016/0306-4522(93)90474-t. [DOI] [PubMed] [Google Scholar]
- 40.Whittington MA, Traub RD, Jeffreys JG. Synchronized oscillations in interneurons driven by metabotropic glutamate receptor activation. Nature. 1995;373:612–615. doi: 10.1038/373612a0. [DOI] [PubMed] [Google Scholar]
- 41.Wolf E, Birinyi A, Pomahazi S. A fast 3-dimensional neuronal tree reconstruction system that uses cubic polynomials to estimate dendritic curvature. J Neurosci Methods. 1995;63:137–145. doi: 10.1016/0165-0270(95)00102-6. [DOI] [PubMed] [Google Scholar]
- 42.Wouterlood FG, Saldana E, Witter MP. Projection from the nucleus reuniens thalami to the hippocampal region: light and electron microscopic tracing study in the rat with the anterograde tracer Phaseolus vulgaris-leucoagglutinin. J Comp Neurol. 1990;296:179–203. doi: 10.1002/cne.902960202. [DOI] [PubMed] [Google Scholar]