Astrocytic Gap Junctions Remain Open during Ischemic Conditions (original) (raw)
Abstract
Gap junctions are highly conductive channels that allow the direct transfer of intracellular messengers such as Ca2+and inositol triphosphate (IP3) between interconnected cells. In brain, astrocytes are coupled extensively by gap junctions. We found here that gap junctions among astrocytes in acutely prepared brain slices as well as in culture remained open during ischemic conditions. Uncoupling first occurred after the terminal loss of plasma membrane integrity. Gap junctions therefore may link ischemic astrocytes in an evolving infarct with the surroundings. The free exchange of intracellular messengers between dying and potentially viable astrocytes might contribute to secondary expansion of ischemic lesions.
Keywords: stroke, apoptosis, calcium, pH, IP3, cell culture, digital imaging
When local cerebral blood flow declines to <15–20% of normal, anoxic depolarization ensues (Astrup et al., 1977). Within minutes both neurons and astrocytes are depleted of cellular energy metabolites and lose their ability to regulate transmembrane ion gradients (Hansen, 1985). Ionic homeostasis is lost, and all cell types are killed during the resultant ischemic infarction (Siesjo, 1992; Ginsberg, 1995). Several lines of evidence indicate that the evolving infarct gradually expands: cells in the ischemic core lose viability first, whereas more peripherally located, better perfused regions are recruited to the infarct only at a later stage (Hossmann, 1996). It has been estimated that an ischemic lesion achieves its final size 4–8 hr after arterial occlusion in rodents but that the same process lasts several days in human brain (Ginsberg, 1995). It is possible to limit the extent of infarction without changing either the duration or degree of ischemia. A variety of interventions may control an ischemic lesion, including blocking NMDA receptor-linked calcium channels (Park, 1988; Siesjo, 1992), increasing cellular calcium buffers (Tymianski et al., 1993), lowering brain temperature (Dietrich et al., 1996), reducing free-radical formation (Pelligrini-Giampietro et al., 1990; Chan, 1994), and decreasing the frequency of spontaneous waves of spreading depression (Nedergaard and Astrup, 1986; Mies et al., 1993). Thus, the blood flow threshold below which infarction proceeds can be modulated operationally.
A key step in understanding why an ischemic infarct gradually expands may be to determine how dying cells communicate with their counterparts in surrounding nonischemic tissue. This avenue of investigation has been neglected, because both the infarct and its surrounding tissue are electrically silent. Neuronal activity is abolished at cerebral blood flow levels <35% of normal (Astrup et al., 1981; Hossmann, 1994). However, nonelectrical interastrocytic communication might proceed undetected during the first critical hours of ischemia. Such astrocytic communication is expressed as oscillations in cytosolic Ca2+ concentrations ([Ca2+]i) and as slowly propagating waves of intracellular [Ca2+]i increase (Smith, 1994). Astrocytic calcium waves activate surrounding neurons (Nedergaard, 1994; Parpura et al., 1994), which in turn can trigger astrocytic calcium waves by releasing glutamate (Cornell-Bell et al., 1990; Dani et al., 1992; Porter and McCarthy, 1996). As a result, a signaling loop is formed between neurons and astrocytes in normal brain that might be an important regulator of local activity. How this process can be perturbed in ischemia remains unknown. For instance, glutamate released from ischemic neurons might initiate calcium waves in adjacent astrocytes. Astrocytic calcium waves then may increase [Ca2+]i levels in neurons beyond the ischemic focus to a degree that causes irreversible injury. Thus, aberrant [Ca2+]i signaling in tissue surrounding the evolving infarct could contribute to the extension of an ischemic lesion.
Astrocytic [Ca2+]i excitability is signaled from cell to cell by secondary messenger diffusion across gap junctions (Jaffe, 1991; Sanderson, 1995). Here we asked how astrocytic gap junctional permeability is affected by ischemia. Our observations indicate that astrocytic gap junctions remain open during ischemic conditions both in acutely prepared brain slices as well as in cell culture. As a result, secondary messengers can traffic freely through them. Such local gap junction-mediated transfer of secondary messengers might be especially harmful in the acute phase of stroke, when the partial reduction in blood flow endangers cells at the infarct border.
MATERIALS AND METHODS
_Electrophysiology in cortical and hippocampal slices._Brain slices were prepared from 13- to 16-d-old (P13–P16) Sprague Dawley rats of both sexes. Brains were removed rapidly and glued with the posterior surfaces down. Coronal slices of 300 μm were cut on a vibratome (TPI, St. Louis, MO), using a slice-cutting solution containing (in mm) 2.5 KCl, 1.25 NaH2PO4, 10 MgSO4, 0.5 CaCl2, and 10 glucose. Slices were incubated in a standard slice solution containing (in mm) 126 NaCl, 2.5 KCl, 1.25 NaH2PO4, 2 MgCl2, 2 CaCl2, 10 glucose, and 26 NaHCO3, gassed with 5% CO2/95% O2 at room temperature (21–23°C), and mounted in a tissue chamber (1.5 ml vol) at the microscope stage, as described earlier (Kang et al., 1995). Cells were identified by using differential interference contrast (DIC) microscopy with a 40× water immersion lens (Olympus BX50WI, Olympus, Japan). Two cameras, an intensified CCD (IC- 100; PTI) for fluorescence imaging and a CCD (COHU, San Diego, Ca) for visualizing DIC, were used. Fluo-3 and Lucifer yellow were excited at 480 nm, and emission was collected at >530 nm. Fluorescent images were sampled every 5 sec with Axon Image Workbench (Foster City, CA) installed in a Pentium PC computer. Whole-cell recordings were obtained by using an Axopatch 200B amplifier connected to a separate Pentium PC computer. Recording electrodes with resistances of 3–7 MΩ were pulled from KG-33 glass capillaries, using a P-97 micropipette puller (Sutter Instrument, Novato, CA). The intracellular solution for filling whole-cell electrodes contained (in mm) 117 K-gluconate, 13 KCl, 2 MgCl2, and 10 HEPES, pH-adjusted to 7.2 with KOH (osmolarity 280). Seal resistance of <3 GΩ was rejected. Lucifer yellow (4%) was added to the intracellular solution in some of the experiments; diffusion of Lucifer yellow was visualized 10 min later. In other experiments, fluo-3 free acid (20 μm) was added to the pipette solution. Ischemic conditions were induced by deoxygenating the slice solution (0 mm glucose) with 5% CO2/95% N2 at room temperature. Octanol was dissolved in DMSO (1 m) and added in a final concentration of 5 mm to either the regular or deoxygenated recording solution.
Total current, _I_to, recorded from a coupled astrocyte is determined by both gap junction resistance (_R_j) and membrane resistance (_R_m). Assuming that gap junction conductance between astrocytes is equal and that the_R_m of individual astrocytes is identical, the current passing through gap junctions of the recorded cells into one coupled cell can be determined by: _I_j =V/(_R_j +_R_m), where I_j is gap junction current and V is the voltage step. If there are_n cells coupled to the recorded cell, the recorded current can be described by the equation: _I_to =V/_R_m +nV/(_R_j +_R_m). If there are m cells coupled second in series and p cells third in series, then_I_to = V/_R_m +nV/(_R_j +_R_m) +mV/(2_R_j +_R_m) +pV/(3_R_j +_R_m). Thus, the fraction of total current that passes through gap junctions of the recorded cells can be determined by: _I_j = (_I_to− _I_m)/_I_to, where _I_m is current passing through the plasma membrane of the recorded cell. Of note, although octanol did not detectably reduce hyperpolarization-activated current in superficially located astrocytes, we observed that currents evoked by depolarization steps were reduced by 5 mm octanol in accordance with the knowledge that conductances through both voltage- and transmitter-activated channels are affected by octanol (Terrar and Victory, 1988; McLarnon et al., 1991). Coupling during resting conditions and responses to ischemia were qualitatively similar in cortical and hippocampal astrocytes; therefore, the data are pooled in Figure 4B.
Fig. 4.
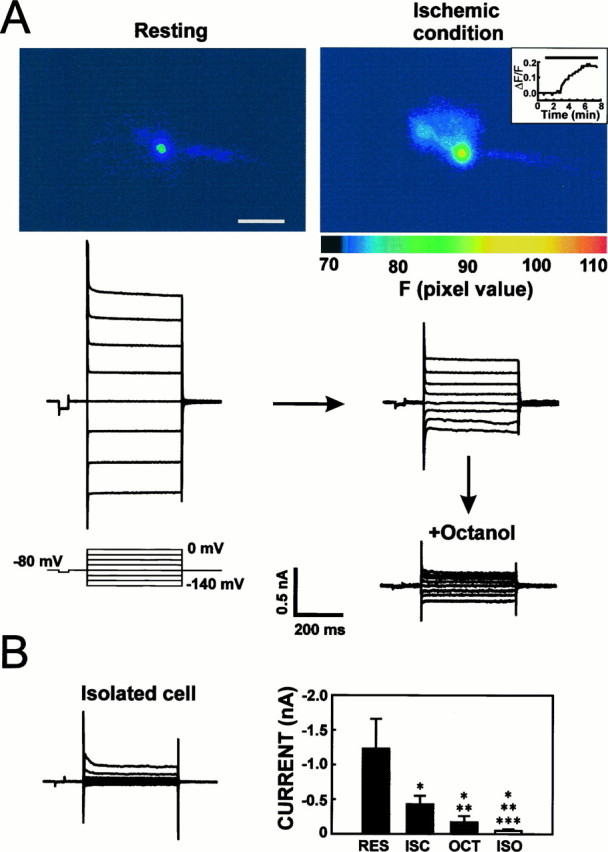
Quantification of gap junction coupling during ischemic conditions in acutely prepared slices. In vitro_ischemic conditions reduced, but did not block, astrocytic gap junctions in brain slices. A, An astrocyte in stratum radiatum of the hippocampal CA1 region was patched in the whole-cell voltage-clamp configuration, and current was activated from a holding potential of −80 mV (step protocol, see inset). The patch pipette contained the calcium indicator fluo-3. Anoxic aglycemia induced a twofold increase in the emission signal of fluo-3 within 5 min of ischemia. Inset, Map Δ_F/F as a function of time in the same astrocyte. Line indicates ischemic conditions. Large currents were activated in the same cell during resting conditions, as expected in a gap junction-coupled cell. Ischemic conditions decreased currents when both depolarization and hyperpolarization steps from +80 to −60 mV were delivered. The observed decrease in activated current occurred concomitantly with the increase in fluo-3 signal. Octanol (5 mm) decreased the current further, indicating that ischemia reduced, but did not block, astrocytic gap junctions. B, Current recordings from an isolated surface astrocyte revealed an even lower amplitude of activated current than in octanol-treated coupled cells, suggesting that 5 mm octanol did not block gap junction coupling completely. Right panel summarizes the mean current activated when 60 mV hyperpolarization steps were delivered during resting condition (RES), ischemic condition (ISC; 20–40 min), subsequent octanol treatment of the ischemic astrocytes (OCT), and in isolated astrocytes patched at the surface of the slice (ISO). Recordings during control and ischemic conditions as well as during octanol exposure were obtained in the same cells (n = 7), whereas isolated cells were recorded separately (n = 9). Coupling during resting condition and responses to anoxic aglycemia were qualitatively similar in cortical and hippocampal astrocytes, and the data have been pooled. Values are mean ± SD. *Denotes different from control condition; **denotes different from ischemic condition; ***denotes different from octanol treatment at p < 0.001, using Student’s_t_ test. Scale bar, 20 μm.
Biocytin staining. Pairs of DIC-identified interneurons and astrocytes were stained with biocytin in selected experiments to verify their identity. In these experiments, 0.5% biocytin was added to the pipette solution. Both cells were patched in the current-clamp configuration, and biocytin was allowed to equilibrate for 15 min. Without removing the patch pipettes, we perfused the slices with 4% paraformaldehyde, 0.2% picric acid, and 0.1% glutaraldehyde, pH 7.4. Twenty minutes later, the pipettes were withdrawn carefully, and the slices were post-fixed for another 10–12 hr at 4°C. After several washes with 0.1 m PBS, slices were treated with 0.3% H2O2 for 15 min and incubated in 0.2% Triton X-100 and 0.2% albumin for 45 min at 4°C. Then the slices were stained with the ABC kit (Vectastain Elite, Vector Laboratories, Burlingame, CA) according to the manufacturer’s directions, and the slices were mounted in Permount.
Glial fibrillary acidic protein immunoreactivity. Slices were fixed in 4% paraformaldehyde for 3 hr before staining against glial fibrillary acidic protein (GFAP). After several washes, the slices were incubated overnight in 2% Triton X-100 and 1% normal goat serum in phosphate buffer, followed by a 2 d incubation in anti-GFAP (polyclonal, 1:100; Sigma, St. Louis, MO) in the presence of 2% Triton X-100. Subsequently, the slices were rinsed and incubated in the secondary antibody (goat anti-rabbit; 1:200) overnight and mounted in Slowfade (Molecular Probes, Eugene, OR) after several washes. GFAP staining and DIC of selected fields were visualized with an Olympus Confocal microscope attached to an inverted microscope (IX-50). The images were analyzed by Adobe Photoshop 4.0 on a PowerComputer.
Tissue dissociation and culture. Mixed forebrain cultures were derived from 16-d-gestation rat embryos and prepared as previously described (Nedergaard et al., 1991). We plated 8 × 10⁵ cells on poly-l-lysine- and gelatin-coated 25-mm-round coverslips or on similarly treated 35 mm Corning dishes. The cultures were kept at 37°C in 5% CO2humidified air. The culture medium consisted of 10% fetal calf serum and 90% of an equal mixture of DMEM and F12, supplemented with 8 mg/mld-glucose, 20 U/ml penicillin G, 20 mg/ml streptomycin, and 50 ng/ml amphotericin. Medium was added, but not removed, every third day of culturing. When these culturing procedures were followed, >95% of the substrate cells stained positively for GFAP after 14 d_in vitro_ (DIV).
Experimental procedure. The cultures were exposed to the various insults after 14–21 DIV. Neuron-free areas were selected for observation. All exposures were performed in HBSS containing 10 mm HEPES, pH 7.3, at 37°C (Life Technologies, Gaithersburg, MD) with or without calcium (1.6 mm). Unless otherwise stated, the calcium-free HBSS always contained 1 mm EGTA. All groups were incubated for 4 hr in HBSS before being returned to fresh culture medium.
Metabolic inhibition. Fresh solutions of 1 mmKCN and 0.2 mm iodoacetate were prepared before use in HBSS with or without Ca2+. The cultures were exposed to KCN and iodoacetate for 2 hr before three washes and then returned to fresh culture medium after 2 hr. We chose to study metabolic inhibition rather than O2 depletion in cultured astrocytes, because the exceedingly low oxygen consumption of cultured cells makes it difficult to obtain anoxic conditions outside an anaerobic chamber, resulting in various degrees of injury.
Ionophore exposure. Lasalocid is a lipophilic calcium ionophore that passively inserts into cellular membrane. The actions of lasalocid are similar to the calcium ionophore ionomycin, commonly used to calibrate calcium indicators in situ. A 10 mmstock solution of lasalocid (Sigma) was prepared in dry dimethylformamide (DMF). The final concentration of 0.4% DMF had no effect on cell survival or gap junction permeability. The cultures were exposed to 40 μm lasalocid for 5 or 15 min in HBSS with or without calcium. After the 15 min exposure, cultures were washed in HBSS (± calcium) every 20–30 min to remove the ionophore completely and then were returned to fresh culture medium at 4 hr.
Nonlethal calcium increments. One group of cultures was exposed to 1 μm thapsigargin. Another group was exposed to lasalocid for 5 min and after several washes was returned to culture medium. A 5 min exposure to 40 μm lasalocid was not associated with cell damage.
Viability criteria. Loss of membrane integrity, as determined by trypan blue or propidium iodide inclusion, was used as a marker of cell death (Phillips, 1973; Goldman et al., 1989; Nedergaard, 1991; Tymianski et al., 1993). In selected cultures, loss of cytoplasmic dicarboxy-dichlorofluorescein diacetate (CDCF) also was used as a marker of cell death (see Figs. 7, 12). Loss of CDCF fluorescence and nuclear staining with propidium iodide occurred simultaneously. However, when propidium iodide was used in low concentrations (2 μm) and/or when the laser power was filtered to <10% of full power, detecting propidium iodide lagged behind the loss of CDCF fluorescence by several minutes. CDCF and propidium iodide were excited by the 488 and 567 nm line, respectively, and emission was collected at 617 nm. The second criterion used to determine loss of viability was positive staining for DNA fragmentation detected by the binding of biotin-dUTP [catalyzed by terminal deoxynucleotidyl transferase (TdT) to 3′-OH ends of DNA; Boehringer Mannheim, Indianapolis, IN]. The kit was used according to the manufacturer’s instructions.
Fig. 7.
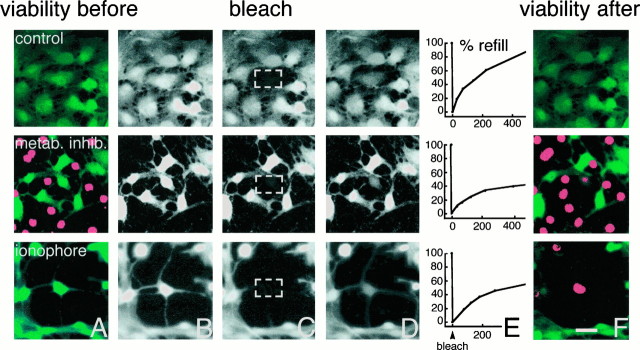
Astrocytic gap junctions remain open during the process of cell death. Cultured astrocytes were loaded with CDCF (green). CDCF is plasma membrane-impermeable, and cell death defined by loss of membrane integrity thus can be detected as a rapid loss of CDCF fluorescence. Concomitantly, propidium iodide (red) gains access to the cell interior and stains the nuclei of dead cells red. Additionally, the small molecular weight of CDCF allows it to diffuse freely across gap junctions so that gap junction permeability can be evaluated by fluorescence recovery after photobleach (FRAP) just before the loss of membrane integrity.Top panels, Fluorescence recovery after photobleach in a healthy culture. A, Fluorescence before photobleach. All cells have intact membranes and therefore do not incorporate propidium iodide but are CDCF-positive (green).B, CDCF fluorescence before photobleach (gray color scale). C, CDCF fluorescence immediately after photobleach. The white square indicates the target area of photobleach.D, The cell has partly regained fluorescence because of influx of CDCF from surrounding gap junction-coupled cells 2 min later.E, Percentage of refill as a function of time in the same cell. Forty percent recovery of fluorescence occurred within 2 min. F, All cells remain viable in this control culture when observed 15 min later (propidium iodide−/CDCF+). Middle panels, Photobleach in a dying culture exposed to KCN and iodoacetate for 80 min. A, Several astrocytes have lost viability in this field (propidium iodide+/CDCF−).B–D, Photobleach in a still viable cell.E, Fluorescence recovered by 21% within 2 min.F, Thirteen minutes later the target cell has lost viability (propidium iodide+/CDCF−). Thus, dying astrocytes remain coupled during the process of cell death. Bottom panels, Photobleach in a dying culture exposed to the calcium ionophore lasalocid 40 min earlier. A, All cells are still propidium iodide−/CDCF+, indicating that no loss of viability has occurred yet. B–D, Photobleach in a still viable cell.E, Fluorescence recovered by 31% within 2 min.F, Seventeen minutes after photobleach, the cell has lost viability (propidium iodide+/CDCF−). Thus, refill occurred minutes before irreversible membrane injury. Scale bar, 15 μm.
Fig. 12.
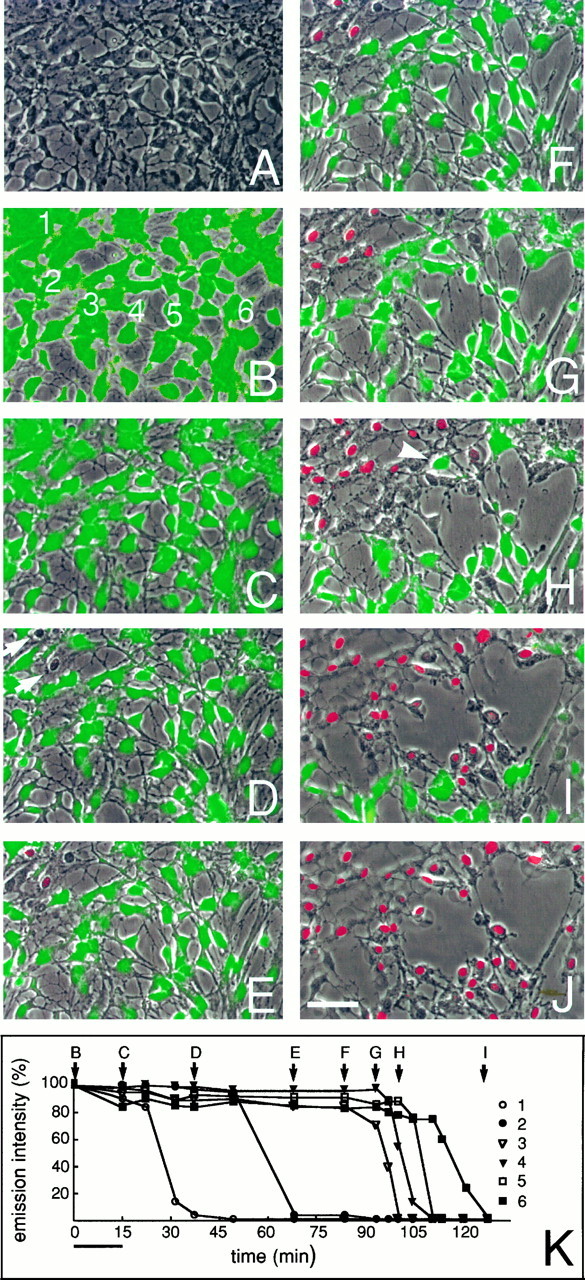
Astrocytic gap junctions close concurrently with the loss of membrane integrity. These photos depict the temporal and spatial pattern of cell death after exposure to ionophore. The culture was preloaded with CDCF, and the HBSS contained propidium iodide (2 μm). A, Phase-contrast micrograph of a field shortly before exposure to the calcium ionophore.B, C, CDCF fluorescence digitally overlaid on the phase image of the same field before (B) and immediately after (C) ionophore exposure. All cells remained viable at this stage, but a general loss of CDCF fluorescence occurred during ionophore exposure. D, At 40 min after exposure, two cells have lost membrane integrity, and thereby CDCF fluorescence, but have not yet incorporated propidium iodide (arrows).E, At 70 min, injury has progressed to include four cells. Nuclear staining with propidium iodide (red) is now detectable in two cells. F–J, After 80–128 min, injury progressed with the recruitment of additional dying astrocytes. With further progression, cells began lifting from the substrate layer, leaving the plane of focus (top left corner). The gradual expansion of injury continued for the most part contiguously and moved across the field with a velocity of ∼3 μm/min. Note that CDCF fluorescence was retained until membrane integrity was lost, even in cells surrounded by dead cells (arrowhead).K, Relative emission intensity of CDCF in six labeled cells (B) during progression of injury. CDCF fluorescence is mapped as a function of time. Fluorescence remains relatively constant until membrane ruptures. Scale bar, 50 μm.
Viability determination. The cultures were exposed to the various insults after 12–17 DIV. During the first 4 hr they were incubated in HBSS ± Ca2+ and then returned to fresh culture medium. To quantify injury, we selected and photographed (20×, phase contrast) two to eight fields in each culture before exposure. After 0.5–24 hr postexposure, cells were stained with trypan blue (0.2% in HBSS for 15 min before two washes in HBSS). The same fields were identified and photographed (bright field and phase contrast). Then the cultures were fixed in 4% paraformaldehyde for 5 min and stained for DNA fragmentation. After staining, the fields of interest were photographed (bright field and phase contrast). Quantification was done by using either a slide projector or Universal Imaging software. In each region the total number of trypan blue- and dUTP-stained cells was counted as illustrated in Figure 6. A total of 657 cultures were exposed to insults, as noted above.
Fig. 6.
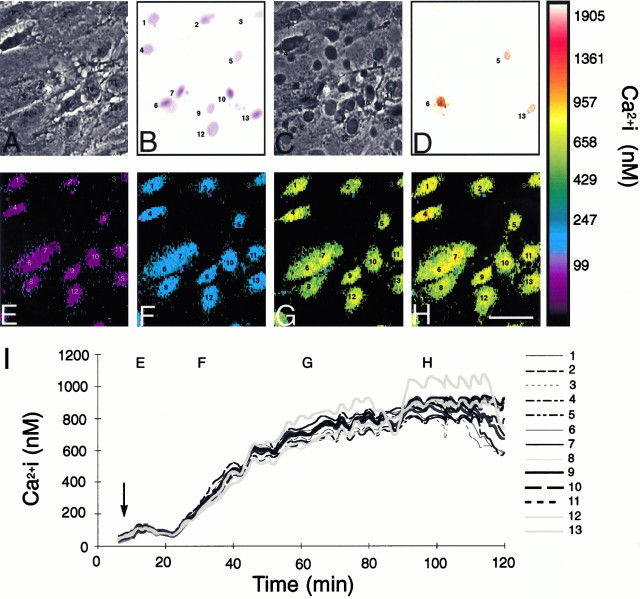
Pattern of astrocytic death after metabolic inhibition during culture conditions. A, Phase-contrast photomicrograph of a representative field of astrocytes during the resting condition. B, The same field after metabolic inhibition. Most cells stained with trypan blue 24 hr after exposure, indicating irreversible loss of viability. C, Corresponding phase-contrast photomicrograph 24 hr after exposure. Cell shrinkage and retraction of processes are evident. D, TUNEL stain of the same field. Only three cells were dUTP-positive.E–H, Pseudocolor display of [Ca2+]i changes in the same field.I, [Ca2+]i changes in individual cells mapped as a function of time. [Ca2+]i increased uniformly in all cells studied. Gap junction function was evaluated in cultures treated similarly (see Fig. 7). The uniform cellular reaction to metabolic inhibition, both with regard to [Ca2+]i changes and irreversible membrane damage, allowed gap junction permeability to be evaluated as a function of both [Ca2+]i and viability. Scale bar, 15 μm.
Measurement of intracellular Ca2+ in cultured astrocytes. The cultures were loaded with 2 μmfura-2 AM in their culture medium for 1 hr and washed in HBSS supplemented with 10 mm HEPES, pH 7.3, for 30 min at 37°C. The culture-bearing coverslip was mounted in a Leiden incubation chamber containing 1 ml of HBSS on the stage of an inverted microscope (Olympus IX70). The microscope was equipped with a xenon/mercury bulb (OptiQuip, Highland Mills, NY) and a filter wheel (Lambda 10, Sutter Instrument) controlled by Universal Imaging software. Bandpass filters (340 ± 5; 380 ± 5) and an emission filter 510 were purchased from ChromaTech (Brattleboro, VT). The cultures were viewed with a 20×, 0.75 numerical aperture fluor objective. Measuring the fluorescence signal in terms of free [Ca2+]i was based on the procedure described by Grynkiewicz et al. (1985). At pH 7.0,_R_min and _R_max were found to be 0.14 and 5.43, respectively, in our system. A_K_D = 194 nm was used (Lattanzio, 1990). For each measurement the background signal was obtained by determining emission signal in a representative field of the same size in an unloaded sister culture. This background level then was subtracted from each experimental measurement. The binding affinity of calcium indicators, including fura-2, is reduced by acidosis (Nedergaard, 1995). We determined _R_max and_R_min at pH 7.0, 6.5, and 6.0, as described byGrynkiewicz et al. (1985), and used a _K_D of 299 nm for calcium measurement at pHi 6.5 and a_K_D of 471 nm for pHi 6.0 (Lattanzio, 1990).
Intracellular pH. Cytosolic pH (pHi) was determined in cultures loaded with pH-sensitive fluorescent dyes. The cells were loaded for 5–15 min with a 5 μm concentration of either 2′,7′-bis-(2-carboxyethyl)-5 (and -6) carboxyfluorescein AM (BCECF; Molecular Probes) or 5-[and 6-] carboxyfluorescein (DCF; Molecular Probes). BCECF has a p_K_a of 7.0 (Rink et al., 1982), and DCF has a p_K_a of 6.4 (Thomas, 1986). Excitation wavelengths of 490 ± 5 nm (pH-sensitive) and 440 ± 5 nm (pH-insensitive) were used. Emissions of >510 nm were measured for each excitation wavelength every 10 sec cycle. The ratio of emission intensities at the 490 and 440 nm excitation wavelengths was calculated. Then the following equation was used to transform the 490/440 nm ratios into pHi: pHi = p_K_a + log[(_R_−_R_min)/(R_max−_R)],
where R was the ratio measured at the given pH, and _R_min and _R_maxwere the limiting values of this ratio at extremes of acidic and alkaline pH, respectively. BCECF and DCF were used in the pH range of 6.5–7.5 and 5.7–6.9, respectively. Both probes were calibrated by the end of each experiment. Intracellular calibration was conducted with a 10 μm concentration of the K+/H+ exchanger nigericin (Molecular Probes) in a potassium Ringer’s solution containing (in mm) 100 KCl, 10 glucose, 1 CaCl2, 2.5 K2HPO4, 10 HEPES, 1 MgSO4, and 90 sucrose. Nigericin exposure will, when combined with high levels of extracellular potassium, equilibrate extra- and intracellular pH (Nedergaard et al., 1991).
Fluorescence recovery after photobleach (FRAP). Cultures were incubated with 2 μm CDCF for 5 min and postincubated with HBSS, free of CDCF for another 20 min to allow complete deesterification. Bio-Rad (Richmond, CA) confocal scanning microscopes MRC600 and MRC1000, both attached to an inverted microscope (Diaphot, Nikon, Tokyo, Japan), were used for imaging the CDCF signal. Excitation was provided by the 488 nm line of a krypton/argon laser. Emission was collected at its emission maximum of 509 nm with the confocal aperture set to its maximum opening (7 mm). After a baseline fluorescence image of the culture was obtained, the area of laser scanning was reduced by 10× zooming. Complete or almost complete photobleaching occurred after three to four scans, each lasting 1 sec at full laser power. Subsequently, the microscope settings were returned to recording configuration, and refills were monitored for 2 min. Images were recorded on a Pinnacle drive and analyzed by a Bio-Rad software package for image analysis. Refills after photobleach were normalized against control levels and mapped individually against time in Figures 8 and 11(middle panels). However, for statistical comparison, normalized mean values of refill during the periods of 0–25, 25–50, 50–75, 75–100, 100–125, and 125–150 min were calculated. ANOVA was used to compare mean values, whereas Tukey’s multiple range test was used to determine which groups significantly differed from control values.
Fig. 8.
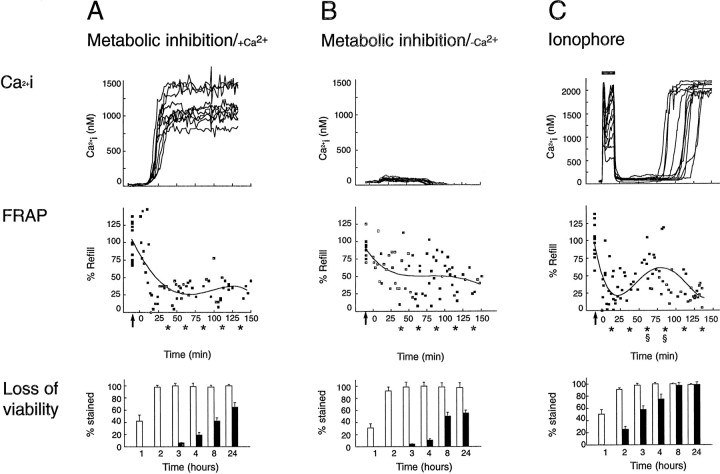
Calcium decreases, but does not block, astrocytic coupling during the process of cell death. Comparison of [Ca2+]i (top panels), gap junction coupling normalized against control values (middle panels), and loss of viability (bottom panels) during and after lethal injury. Control cultures were characterized by a resting [Ca2+]i averaging 50–100 nm and by substantial refill. A, Top panel, A rapid increase in [Ca2+]i and a corresponding decrease in gap junction coupling with no sign of recovery (middle panel) occurred when energy metabolism was inhibited by KCN (inhibitor of oxidation chain) and iodoacetate (blocker of glycolysis). Refill after photobleach in separate experiments is mapped individually (squares) and the data fit by four-order regression. Arrows indicate refill during resting control conditions in the same cultures. Bottom panel, The percentage of cell death after the same procedure. Almost complete loss of viability was observed at 2–3 hr. Trypan blue staining was detected within 1–3 hr (white bars), whereas DNA fragmentation (dUTP staining, black bars) developed slowly and incompletely after metabolic inhibition. B,Top panel, Ca2+ did not increase when astrocytes were inhibited metabolically in the absence of extracellular Ca2+. Middle panel, Uncoupling was less pronounced when metabolic inhibition was not associated with [Ca2+]i increments. Bottom panel, The pattern of astrocytic death evoked by metabolic inhibition proceeded independently of concomitant [Ca2+]i changes. C,Top panel, Fifteen-minute exposure to the calcium ionophore lasalocid is associated with a surge in [Ca2+]i. Middle panel, The increase in [Ca2+]i is associated with a transient decrease in refill after photobleach. After normalization of [Ca2+]i to near resting levels, coupling slowly improved but declined again concomitant with a terminal increase in [Ca2+]i.Bottom panel, Ionophore exposure resulted in generalized death within 3 hr. These observations indicate that the permeability of astrocytic gap junctions is lowered, but not blocked, after lethal injury and that increments in Ca2+ partially are responsible for the decrease in coupling. *FRAP values compared with control values; p > 0.01. Data obtained 0–25, 25–50, 50–75, 75–100, 100–125, and 125–150 min after metabolic inhibition or ionophore exposure were pooled; two-way ANOVA was used to compare mean values, and Dunnett’s multiple range test was used to establish significant differences between control values and treatment values. §FRAP values compared with FRAP values 0–25 min after initiation of ionophore exposure [31 ± 5% (0–25 min),n = 25 vs 65 ± 8% (50–75 min),n = 12 and 51 ± 10% (75–100 min),n = 11; p > 0.01]. Thus, coupling increased significantly after ionophore exposure in astrocytes destined to die and was significantly higher 50–100 min after ionophore exposure than during the initial 0–25 min. The calcium tracings in the top panels plot data from representative cells. A total of 150 cells were analyzed in 15 individual experiments in A–C.
Fig. 11.
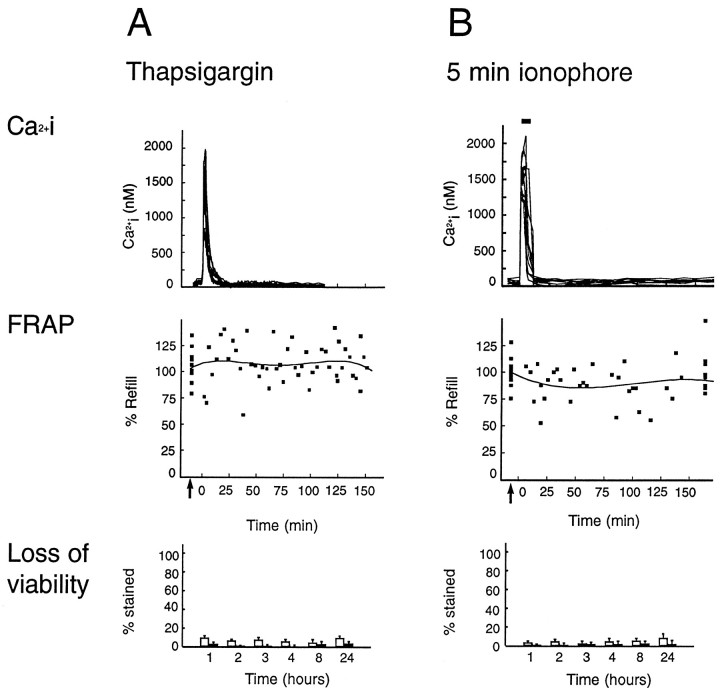
Nonlethal [Ca2+]i increments are not associated with a significant decrease in astrocytic coupling. Shown is a comparison of [Ca2+]i (top panels), gap junction coupling normalized against control values (middle panels), and loss of viability (bottom panels) during and after nonlethal [Ca2+]i increments. A,Top panel, A rapid increase in [Ca2+]i was evoked by thapsigargin (1 μm). No sign of decrease in coupling was observed (middle panel). Refill after photobleach in separate experiments is mapped individually (squares) and the data fit by four-order regression. Bottom panel, The percentage of cell death after the same procedure. No loss of viability was observed by either trypan blue staining (white bars) or TUNEL stain (dUTP staining, black bars) at any time point. B, Top panel, [Ca2+]i increments during 5 min exposure to ionophore (lasalocid, 40 μm). Middle panel, Uncoupling was not observed when ionophore exposure was not associated with the loss of viability. Bottom panel, No astrocytic death was evoked by short-term ionophore exposure. These observations indicate that nonlethal increments in Ca2+ do not significantly lower the permeability of astrocytic gap junctions.
Metabolic measurements. ATP concentrations were measured by the enzyme fluorometric method described by Lowry and Passonneau (1972)and expressed as micromolars per gram of protein. Briefly, 0.1 ml of ice-cold 3 m perchloric acid was added to each well for 15 min and then diluted with 20 μl of 8 mm EDTA. The mixtures were removed from the dish and centrifuged at 5000 ×g for 10 min; the supernatant was neutralized to pH 6.8–7.0 with a mixture of 2 m KOH, 0.4 m imidazole, and 0.4 m KCl. Then the mixtures were centrifuged at 5000 × g for 10 min, and the supernates were stored at −80°C until being analyzed. Protein content was measured in sister cultures by the Bio-Rad Coomassie-based protein assay, with a bovine serum albumin standard. Protein was collected by applying 0.4 ml of boiling distilled water to each cell well; then the contents were suctioned off and boiled for 5 min before frozen storage and measurement.
Immunocytochemistry. Immunocytochemical staining for Cx43 was performed according to the procedure described by Zhu et al. (1991). A polyclonal antibody directed against the cytoplasmic C-terminal of Cx43 was kindly provided by Bruce Nicholson.
Western blotting for Cx43. Cultured astrocytes were collected directly in 1× SDS gel-loading buffer. Aliquots of homogenate were resolved by SDS-PAGE on 10% gels and transferred to nitrocellulose (Sambrook et al., 1989). Nitrocellulose sheets were blocked by incubation in a nonfat dry milk-containing buffer before incubation in a 1:1000 dilution of rabbit antiserum against Cx43 (kindly provided by B. Nicholson). Then the nitrocellulose sheets were washed, and a Cx43 antibody binding was visualized by using the ECL system (Amersham, Arlington Heights, IL).
RESULTS
Identification of astrocytes in acutely prepared brain slices
Cells were visualized in acutely prepared cortical or hippocampal slices by using DIC microscopy. Astrocytes were identified by their characteristically small cell bodies and few processes. By comparison, neuronal cell bodies were large, with clearly visible relatively thick processes under DIC microscopy. To test the validity of cell identification by DIC microscopy, we first compared DIC-determined morphology with several traditional approaches for astrocyte identification. First, immunoreactivity against GFAP was mapped. Figure1A shows a representative field under DIC microscopy containing three cells having a morphology typical of astrocytes. These cells stained brightly against GFAP, confirming astrocytic identity (Fig.1B). Second, DIC microscopy was compared with biocytin staining. Figure 1C illustrates two representative cells, an astrocyte and a interneuron, under DIC microscopy. These cells were patch-clamped and injected with biocytin. The biocytin staining confirmed cell identity (Fig. 1D). The biocytin-stained astrocyte was characterized by an abundance of short, heavily branched, unevenly sized processes, whereas neuronal processes were few, but characteristically elongated and unbranched. In addition, neuronal cell bodies were considerably larger than the astrocytes. Third, electrophysiological properties of cells having a morphology typical of astrocytes under DIC microscopy were characterized (Fig.1E). The cells were patch-clamped in the whole-cell current-clamp configuration and stimulated by current pulses delivered through the patch pipette. All recordings from cells having a morphology typical of astrocytes were characterized by large negative resting membrane potentials (−85 ± 0.5 mV, n = 60) and the absence of action potentials after depolarization (Fig.1F). By contrast, neuronal membrane potential was lower (−72.5 ± 0.6 mV, n = 64), and the cells fired repeatedly when depolarized (Fig. 1F).
Fig. 1.
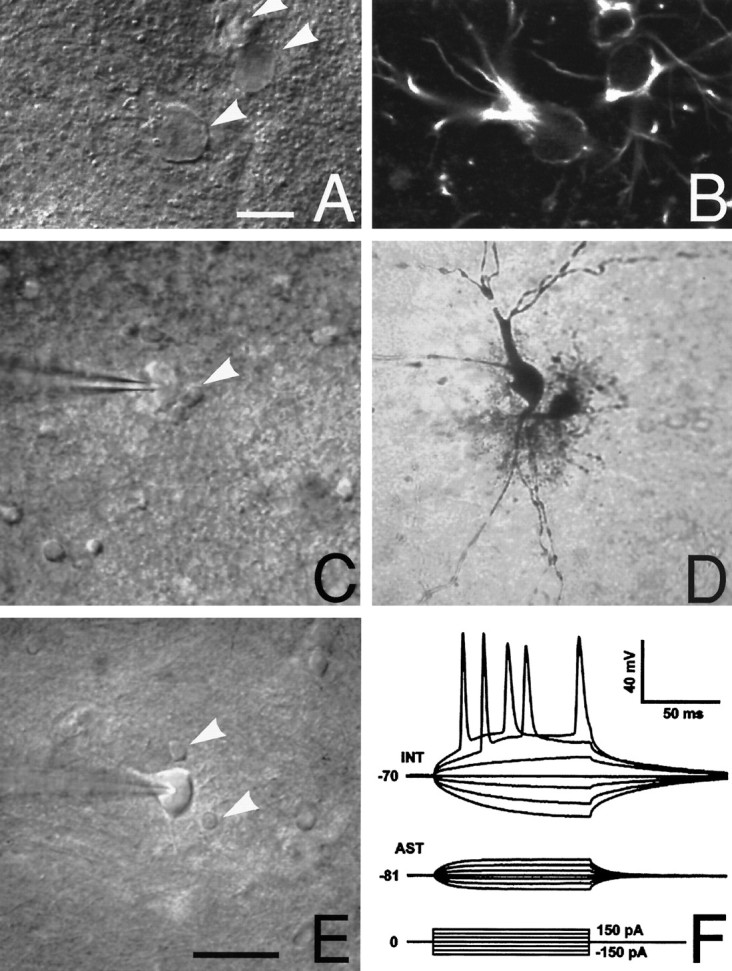
Astrocytes in the stratum radiatum of the hippocampal CA1 region. A, Differential interference contrast (DIC) microscopy was used to identify both astrocytes and neurons before electrophysiological recordings. Astrocytes were identified by their characteristically small rounded cell bodies and poorly defined irregular processes (arrowheads). Scale bar, 10 μm. B, Immunoreactivity against glial fibrillary acidic protein (GFAP) in the same field as A. Three cells identified as astrocytes by DIC microscopy were GFAP-positive. C, Another hippocampal slice visualized by DIC microscopy. Two cells, one with a morphology typical of astrocytes (arrowhead) and one interneuron (impaled by patch electrode), are indicated. D, Biocytin was injected into both of these cells to compare DIC with cellular morphology. The cell identified by DIC as an astrocyte was characterized by an extensive array of branched short processes, phenotypical for astrocytes. In contrast, the presumed interneuron had few, but evenly sized, unbranched processes—a morphology stereotypical for neurons. All eight pairs of biocytin-injected astrocytes and neurons had similar patterns of cellular morphology. E, A representative field containing one interneuron (impaled by patch electrode) surrounded by two representative astrocytes (arrowheads). Scale bar, 50 μm for C–E. F, Astrocytes and neurons also were identified by their electrophysiological properties. Shown are representative tracings from an astrocyte (AST) with a resting membrane potential of −81 mV. No action potentials were evoked by depolarization pulses. All 60 astrocytes identified by DIC microscopy lacked depolarization-evoked action potentials. In contrast, trains of action potentials were evoked by depolarization pulses in an interneuron (INT) with a resting membrane potential of −70 mV.
Astrocytic gap junctions remain open during ischemic conditions in brain slices
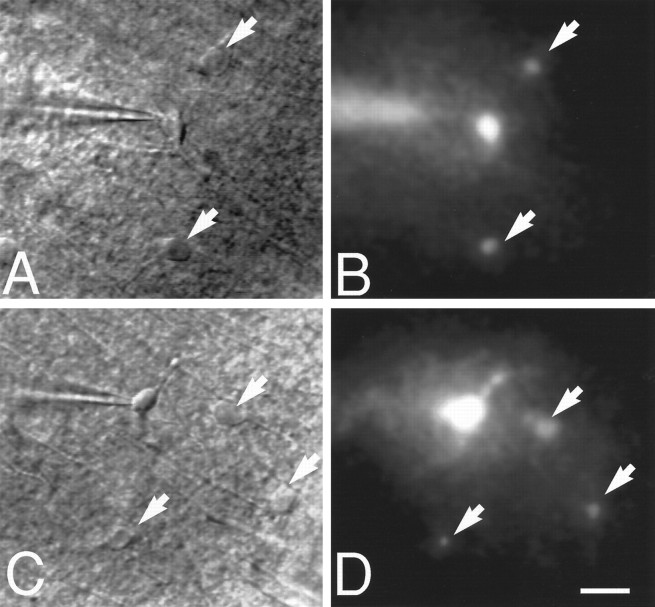
To evaluate the extent of astrocytic coupling during ischemic conditions, we first injected the gap junction-permeable fluorescent indicator Lucifer yellow (MW 446) during control and ischemic conditions. When astrocytes located 50–100 μm below the surface of slices were patch-clamped in the whole-cell current-clamp configuration and injected with 4% Lucifer yellow during normoxic control conditions, it resulted in the staining not only of the injected cell but also of several surrounding cells, in accordance with earlier reports (Fig.2B) (Connors et al., 1984). Surprisingly, when Lucifer yellow was injected during ischemic conditions, neighboring cells also stained. Lucifer yellow was injected after the slices had been perfused with a glucose-free slice solution deoxygenated with 95% N2/5% CO2 for 15 min (Fig. 2D). Collectively, nine of nine Lucifer yellow injections during ischemic condition all resulted in the staining of two or more neighboring cells, whereas eight of eight injections during normoxic control condition resulted in the staining of two or more adjacent astrocytes.
Fig. 2.
Intercellular injection of Lucifer yellow disclosed that astrocytic gap junctions remain open during ischemic conditions in brain slices. A, A representative field containing three cells with a morphology typical for astrocytes under DIC microscopy. One cell was patched by an electrode; the two remaining cells are indicated by arrows. B, Dye coupling during normoxic control conditions in the same field. Lucifer yellow (4%) was injected into the patched cell (resting membrane potential, −81 mV). After 10 min, several neighboring cells (arrows) were brightly fluorescent, indicating that Lucifer yellow had diffused from the injected cell to surrounding coupled cells. C, A representative field containing four cells with a morphology typical for astrocytes during ischemic conditions. D, Diffusion of Lucifer yellow in the same field. Lucifer yellow was injected into the patched astrocyte 15 min after the induction of ischemia. Ten minutes later, three neighboring cells stained brightly with Lucifer yellow. Thus, astrocytic coupling persisted during ischemic conditions. Intercellular Lucifer yellow diffusion was observed in eight other slices during ischemic conditions. Scale bar, 20 μm.
Astrocytes at the slice surface are functionally uncoupled
Cells having an astrocyte-typical morphology by DIC from slice surface were patch-clamped in the whole-cell current-clamp configuration (Fig.3A). Lucifer yellow injected into these cells did not stain neighboring cells, which suggests that superficial astrocytes were functionally uncoupled during slice preparation (Fig. 3B; n = 15). Also, current injection resulted in significantly larger voltage changes than in deeper astrocytes (compare Figs. 1F and3C), most likely reflecting the uncoupled state of surface cells. We cannot exclude the possibility that some of the surface cells studied were oligodendrocytes. Oligodendrocytes also are characterized by large negative resting membrane potential but are, in contrast to astrocytes, poorly coupled (Sontheimer and Waxman, 1993).
Fig. 3.
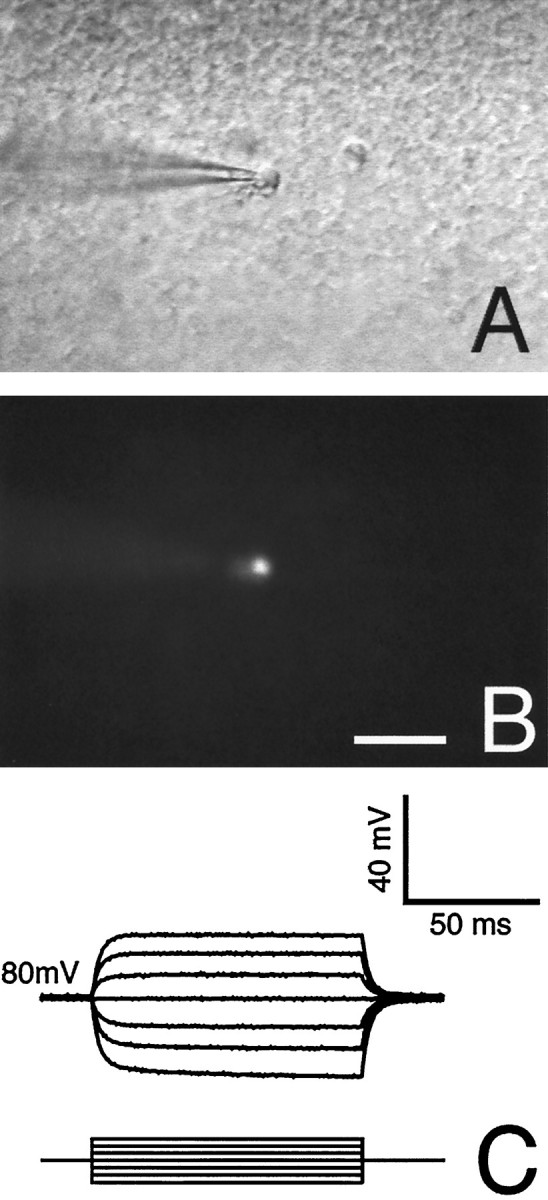
Surface astrocytes in acutely prepared slices do not transfer Lucifer yellow. A, DIC micrograph of a representative field containing two surface cells with a morphology typical for astrocytes (one cell is patched). B, Lucifer yellow was injected into one cell and allowed to diffuse for 10 min during normoxic control conditions. No dye diffusion to surrounding cells was detected. Absence of dye diffusion was observed in all eight injections in surface astrocytes. C, Tracing from the same cell with a resting membrane potential of −80 mV. Input resistance was several orders of magnitude higher than deeper astrocytes (compare with Fig. 1F). Scale bar, 30 μm.
Ischemic conditions rapidly reduce astrocyte coupling_in situ_
These experiments established that Lucifer yellow can diffuse among ischemic astrocytes located deeply within the slice; hence astrocytes remain coupled during ischemia. To quantify the degree of coupling during ischemia relative to control values, we repeated these experiments, but we used the magnitude of hyperpolarization-evoked current as a relative measure of coupling. Astrocytes located 50–100 μm below the surface of slices were patch-clamped in the whole-cell voltage-clamp configuration and stimulated by voltage steps delivered through the patch pipette. All recordings were characterized by a large negative resting membrane potential (−85.1 ± 0.5 mV,n = 60) and the absence of action potentials after depolarization. Characteristically, very large currents were obtained by varying the applied voltage during resting conditions (Fig.4A), as would be expected from cells that are coupled extensively (Sontheimer et al., 1990; Bordey and Sontheimer, 1997). For example, a 60 mV hyperpolarization activated a current of −1.23 ± 0.16 nA (n = 7). After the slices were made ischemic by superfusion with a glucose-free recording solution deoxygenated with 95% N2/5% CO2 for ∼5 min, the current had decreased to −0.43 ± 0.05 nA (n = 7) or ∼35% of resting values. Prolonging the ischemia for an additional 20–40 min did not change this current–voltage relationship. However, subsequent exposure to the gap junction inhibitor octanol (5 mm) reduced the current to −0.17 ± 0.03 nA (n = 7). The same result was obtained when nonischemic astrocytes were exposed directly to an octanol-containing recording solution (−0.18 ± 0.04 nA, n = 2). Ten mm octanol decreased current more efficiently than did 5 mm but were not tolerated by the cells. The relative inefficiency of gap junction blockers in slices has been reported previously (Largo et al., 1996).
Whole-cell current recorded from coupled astrocytes is a function of both their gap junction conductance and conductance through other membrane channels, in particular K-channels (Sontheimer et al., 1990;Sontheimer and Waxman, 1993). To establish the relative contribution of gap junctions to whole-cell current, we next patch-clamped astrocytes from the slice surface (Fig. 4B) that had been uncoupled mechanically (either completely or partially) from neighboring astrocytes during slice preparation (see Fig. 3). In these cells, a 60 mV hyperpolarization step activated a current averaging only −0.05 ± 0.01 nA (n = 7). Ischemic conditions did not affect this current (−0.05 ± 0.02 nA,n = 2). Moreover, octanol had no effect (−0.05 ± 0.02 nA, n = 3), as would be expected in uncoupled cells. Assuming that conductance through channels other than gap junctions are comparable in superficial and more deeply located astrocytes, we can conclude that at least 96% of current triggered by a 60 mV hyperpolarization step (1.23–0.05/1.23) passes through gap junctions during control conditions (see Materials and Methods). That hyperpolarization-induced current in surface astrocytes was considerably less than current during the ischemic condition in deeper (coupled) astrocytes further supports the notion that gap junctions only partially uncoupled during ischemic condition.
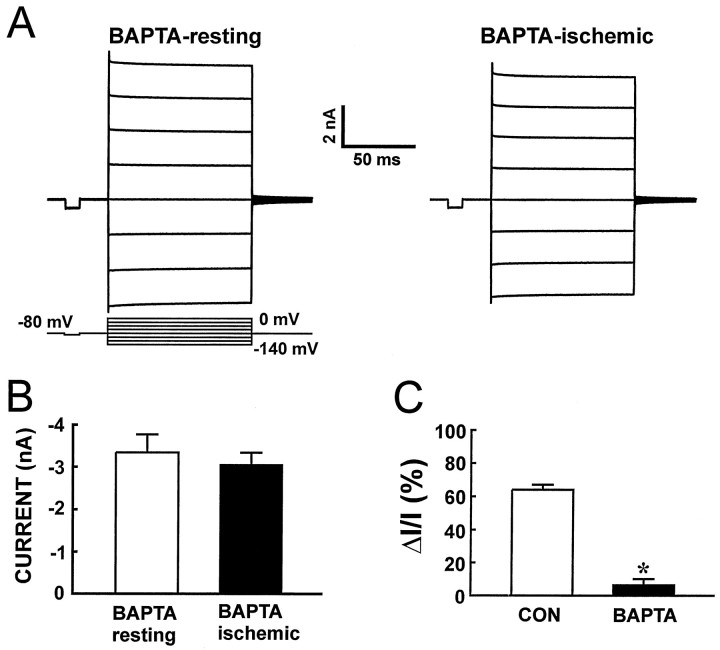
We next examined the relation between [Ca2+]i and gap junction coupling during ischemia (Fig. 4A). In selected experiments the calcium indicator fluo-3 was added to the electrode solution. Fluo-3 emission increased ∼5 min after superfusion of a glucose-free deoxygenated slice solution, in accordance with earlier reports (Duffy and MacVicar, 1996). This [Ca2+]iincrease coincided with the decrease in hyperpolarization-evoked current that was observed (Fig. 4A). To test the role of calcium in ischemic uncoupling, we added the calcium chelator BAPTA (20 mm) to the recording solution. Current activated by 60 mV hyperpolarization steps was increased significantly during resting condition in the presence of BAPTA (−3.34 ± 0.43 nA,n = 6; Fig.5A), likely reflecting the opening of additional gap junctions caused by the lowering of resting [Ca2+]i. Importantly, current amplitude was not reduced significantly after 15 min of ischemia in the presence of BAPTA (−3.06 ± 0.28, n = 6), as demonstrated in Figure 5, A and B. As a result, the relative changes in current evoked by ischemia differed significantly between the non-BAPTA and the BAPTA group (Fig.5C). Thus, buffering of Ca2+ attenuated the ischemic-induced reduction in coupling strength.
Fig. 5.
Buffering intracellular Ca2+attenuates the uncoupling effect of ischemia. A, A single astrocyte was patched with an electrode solution containing a 20 mm concentration of the calcium chelator BAPTA. The amplitude of activity-induced current was considerably higher in the presence than in the absence of BAPTA, suggesting that the lowering of [Ca2+]i increased coupling during the resting condition. Anoxic aglycemia was induced 15 min later. In contrast to the previous figure (see Fig. 4), activated current did not decrease in BAPTA-loaded cell recordings during ischemic conditions.B, Summarized amplitude of current activated by a 60 mV hyperpolarization step in BAPTA-loaded astrocytes during resting and ischemic conditions (n = 6). The amplitude of current did not decrease significantly in the presence of BAPTA (paired Student’s t test). C, Comparison of the relative decrease in current (Δ_I_/I) evoked by ischemia in the absence (CON) and presence of BAPTA in the recording electrode. BAPTA loading significantly reduced the uncoupling effect of ischemia (p < 0.01, Student’s_t_ test).
Overall, these electrophysiological studies demonstrated that astrocytic coupling is lowered to ∼35% of resting level during ischemia and that Ca2+ appears to be an important regulator of gap junction permeability in that condition.
Astrocytes in culture remain coupled during the death process
To relate more precisely the functional changes in coupling with the extent and progression of cellular injury, we repeated our study in cultured astrocytes. Metabolic inhibition was accomplished by exposure to KCN, an inhibitor of oxidative metabolism, and iodoacetate, a blocker of glycolysis (see Materials and Methods). ATP concentrations decreased from a control level of 24 ± 6 μm/gm protein (n = 22) to undetectable levels within 5 min (n = 8). [Ca2+]iincreased shortly thereafter and continued to increase during the remaining observation period (Fig.6E–I). Accordingly, most cells stained with trypan blue within 2 hr (Fig.6B), whereas DNA fragmentation developed slowly and incompletely (Fig. 6D).
Gap junction permeability was quantified in dying astrocytes, using FRAP (Wade et al., 1986; Giaume et al., 1991). This technique capitalizes on the observation that, when a culture is loaded with a low-molecular-weight fluorescence probe (<1 kDa), the recovery of fluorescence in a bleached target cell will reflect the influx of dye from surrounding unbleached cells. As such, the rate of refill is a measure of gap junction permeability. For these studies, cultures were loaded with CDCF (445 Da; Nedergaard et al., 1990). After a baseline fluorescence image of the culture was obtained by confocal microscopy, the area of laser scanning was reduced to include only one cell. Photobleaching was complete or almost complete after three or four scans, each lasting 1 sec at full laser power. Subsequently, the microscope settings were returned to recording configuration, and the refill was monitored (Fig.7B–D, top panels). In control cultures, astrocytes were interconnected extensively by gap junctions. Fluorescence recovery after photobleach at 2 min averaged 38% ± 4% (mean ± SEM; range, 22–56%) (Figs. 7B–D, top panels). Octanol (0.5 mm) blocked this refill (2 ± 4%, n = 21). The variability in coupling strength observed is in accordance with previous reports (Kettenmann and Ransom, 1990; Sontheimer et al., 1991).
In metabolically inhibited cultures we found that coupling was reduced but never abolished; photobleach of single astrocytes resulted in significant refill after hours of metabolic inhibition (Fig. 7,middle panel). Mapping of normalized refill as a function of time confirmed that, within 15 min, coupling decreased to ∼30% of control levels and remained at that level during the subsequent 2 hr (Fig. 8A, middle panel). Concurrent with evaluation of gap junction function, loss of viability was visualized by the loss of CDCF fluorescence and nuclear staining with propidium iodide. This approach allowed us to quantify gap junction coupling just before irreversible membrane damage on a single-cell level. Contrary to what is generally believed, we noted that significant refill occurred up to the final loss of membrane integrity (see Fig. 7).
Measurements of [Ca2+]i in fura-2-loaded sister cultures revealed that the decrease in coupling was accompanied by an increase in [Ca2+]i (Fig. 8A, top panel). To test whether the [Ca2+]i increase directly reduced coupling, we repeated the experiment in the absence of extracellular Ca2+, which forces [Ca2+]i to remain at resting or subnormal values (Fig. 8B, top panel) (Nedergaard et al., 1990). We observed that gap junction function was relatively preserved when metabolic inhibition occurred in the absence of [Ca2+]i increments (FRAP values plotted in Fig. 8B, middle panel). Mean values of refill, 25–125 min after metabolic inhibition, averaged 31 ± 3% (n = 35) and 59 ± 6% of control values (n = 48; p > 0.0001) in the presence and absence of [Ca2+]i, respectively. By the end of the observation period (125–150 min), [Ca2+]i no longer had any significant effect on coupling: refill was in this period reduced to 33 ± 3% (+Ca2+; n = 4) and 48 ± 6% (−Ca2+; n = 7) of control values. The cells at this time point were in an advanced stage of degradation. Morphological changes included cellular shrinkage, process retraction, and nuclear condensation in both sets of exposures. Remarkably, uncoupling was not observed in any of the experiments (Fig.8A,B, middle panels).
Ca2+, but not H+, is a major regulator of astrocytic coupling in vitro
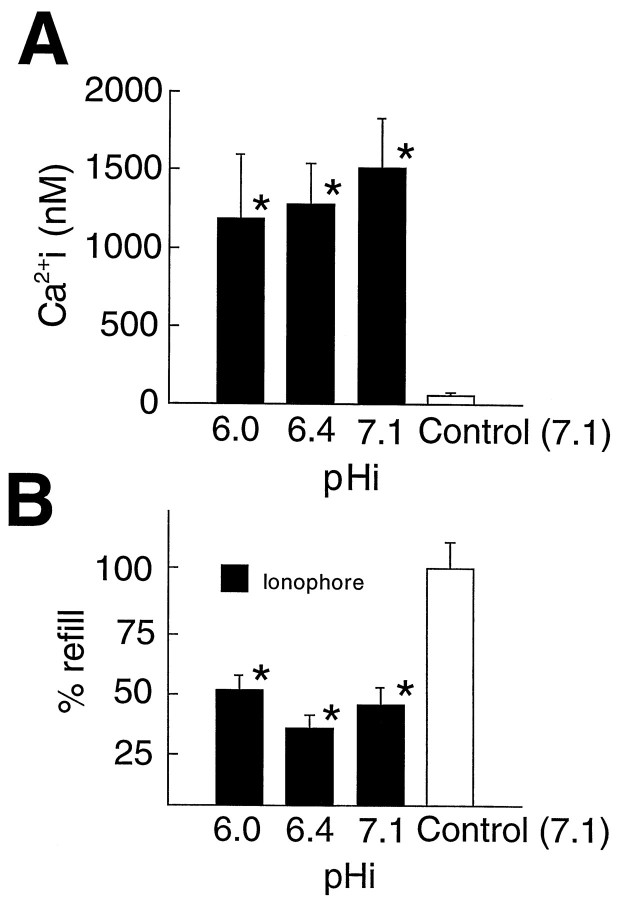
Ischemia induces an increase not only in intracellular Ca2+ but also in H+ ions. We manipulated the intracellular concentrations of H+to examine the effect of acidosis on gap junctions. Intracellular acidosis was achieved by exposure to an acidified HBSS containing lactic acid, a weak acid that promotes intracellular acidification (Nedergaard et al., 1991). First, to establish the relationship between intracellular pH (pHi) and extracellular pH (pHe) during acidic conditions, we quantified pHi in cells loaded with either the fluorescence pH indicator BCECF (p_K_a, 7.0; Rink et al., 1982) or DCF (p_K_a, 6.4; Thomas, 1986;Nedergaard et al., 1991) and exposed them to an acidified HBSS (pHe range, 5.9–7.3). We observed a resting pHi of 7.03 ± 0.03 (n = 11) that was poorly regulated during acidic conditions. Thus, pHiwas a direct function of pHe, in agreement with earlier reports (Fig. 9A) (Nedergaard et al., 1991). Lowering pHi caused no detectable decrease in gap junction permeability; control cultures with pHi 7.0 recovered 37 ± 6% of fluorescence within 2 min, whereas acidic astrocytes recovered 35 ± 7% and 40 ± 6% of original fluorescence at pHi 6.0 and 6.4, respectively. Normalized values of fluorescence recovery are plotted in Figure 9B. Thus, low pHi in these in vitro studies did not reduce gap junction conductance.
Fig. 9.
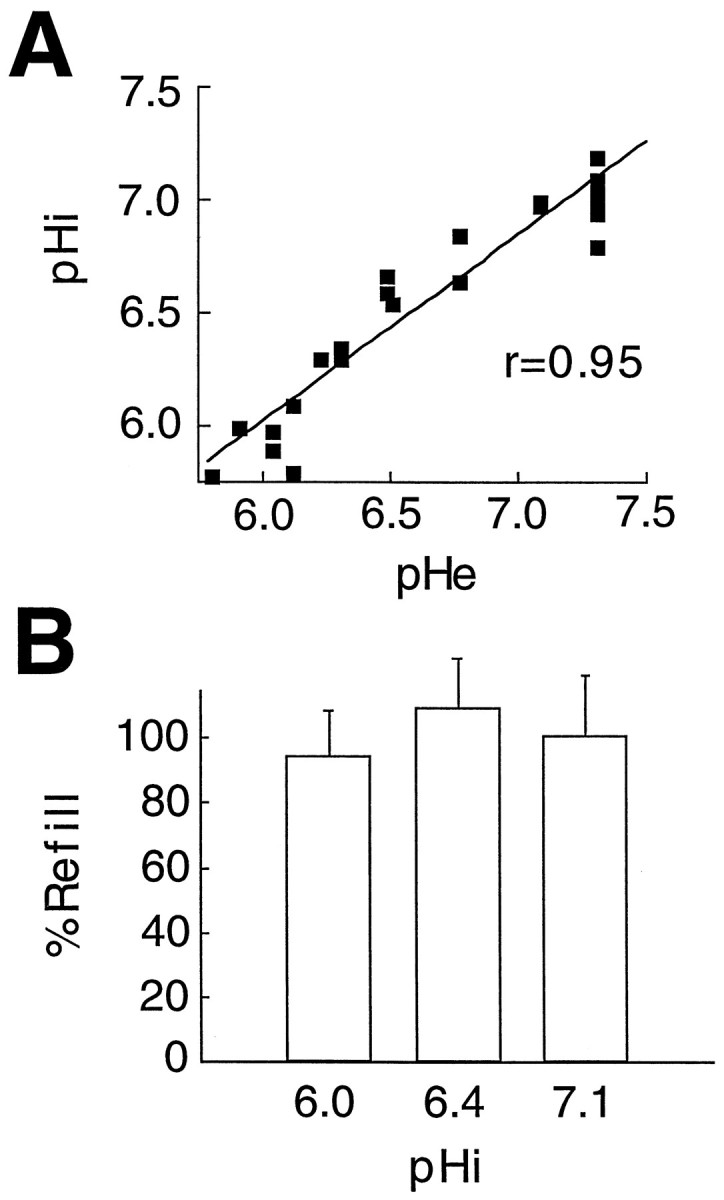
Acidosis does not modulate astrocytic coupling_in vitro_. A, To quantify coupling as a function of pHi, we first evaluated the relation of pHi and pHe in astrocytes loaded with the pH indicators BCECF and DCF. Exposure to an acidified lactic acid-containing solution resulted in a parallel reduction in pHi and pHe. Thus, pHi is a direct function of pHe in cultured astrocytes. B, Fluorescence recovery after photobleach was not altered significantly when pHi was lowered from 7.0 during control conditions to either pHi 6.4 or 6.0.
We then tested the effect of Ca2+ in isolation. Selective increases in intracellular calcium levels ([Ca2+]i) were accomplished by exposure to a calcium ionophore, lasalocid, which permits free calcium entry into cells (Chattopadhyay et al., 1992). During ionophore exposure [Ca2+]i levels peaked at 1800 ± 432 nm (n = 24) from a resting level of 54 ± 11 nm (n = 52) (Fig.10A). As judged by FRAP, this [Ca2+]i increase was associated with a rapid reduction in gap junction permeability; within a few minutes refill was reduced to ∼30% of control values (Fig. 7,bottom panel) (Fig. 8C, middle panel). Thus, increments in [Ca2+]i rapidly reduced, but did not block, astrocytic gap junctions both in vivo and in vitro.
Fig. 10.
Acidosis does not potentiate the uncoupling effect of high [Ca2+]i.A, [Ca2+]i increments evoked by ionophore treatment were not affected significantly by concomitant acidosis. Controls were exposed to vehicle (0.4% DMF).B, Gap junction coupling detected by FRAP. The [Ca2+]i increase evoked by ionophore treatment reduced refill to 42 ± 6% of control values at pHi 7.0. Intracellular acidosis (pHi 6.0 and 6.4) did not decrease coupling further. Thus, intracellular acidosis does not potentiate the action of Ca2+ in reducing gap junction function. Two-way ANOVA was used to compare mean values, and Dunnett’s multiple range test was used to establish significant differences between treatment groups and controls. *Denotes significant difference at p < 0.01 relative to control. Error bars represent the mean ± SEM.
It has been reported that protons and calcium ions can act synergistically to decrease conductance in muscle cells (Spray et al., 1981; Burt, 1987). To address the possibility of a similar cooperation between hydrogen and calcium ions in the regulation of astrocytic gap junctions, we increased [Ca2+]i levels in acidified astrocytes. [Ca2+]iincrements evoked by ionophore exposure were, as expected, not altered significantly by intracellular acidosis, and acidified cells experienced the same amplitude of [Ca2+]i increments as did control cells (Fig. 10A). Importantly, the reduction in gap junction permeability during ionophore exposure was not enhanced by concurrent acidosis. At pHi 6.4 and pHi 6.0, ionophore exposure decreased refill to the same extent as that observed at pHi 7.0 (Fig. 10B). Thus, acidosis did not potentiate the effect of increased [Ca2+]i on gap junction conductance. Of note, ionophore exposure by itself was not associated with changes in pHi (data not shown). Collectively, these results indicate that gap junctions in cultured cortical astrocytes are not sensitive to acidosis either alone or in combination with the elevation of [Ca2+]i.
Gap junctional function can recover after lethal [Ca2+]i overload
We asked whether or not gap junction coupling was suppressed permanently during the death process when energy metabolism was not inhibited. Exposure to the calcium ionophore lasalocid was used to evoke a lethal [Ca2+]i increase. Generalized death occurred after 15 min of exposure to 40 μm lasalocid. Most astrocytes stained with trypan blue within 2 hr, whereas DNA fragmentation evolved slowly (see Fig.8C, bottom panel). The [Ca2+]i increments _during_ionophore exposure resulted, as described previously, in a rapid decrease of junction permeability to ∼30% of control values (see Fig. 7E, bottom panel). This decline in conductance was not permanent. After ionophore exposure, gap junction permeability slowly normalized to ∼60% of control values (see Fig.8C, middle panel). Thus, astrocytes can improve and thereby modulate their gap junction coupling during the process of cell death. Recovery of gap junction permeability was not a direct function of [Ca2+]i. [Ca2+]i normalized within minutes, but the partial recovery of gap junctional function occurred slowly and peaked ∼85 min after ionophore exposure (see Fig. 8C, middle panel). Coupling might, however, be regulated by other modulators of gap junction permeability activated by the death process or the transient [Ca2+]i increase, such as protein kinase C (Enkvist and McCarthy, 1992; Reynhout et al., 1992), tyrosine protein kinases (Atkinson and Sheridan, 1988), cAMP (Bennett et al., 1991), or arachidonic acid (Giaume and Venance, 1996).
Nonlethal calcium increments do not alter gap junction permeability
To test whether surges in [Ca2+]inot associated with cell death affected coupling, we exposed cultured astrocytes to either thapsigargin (1 μm) or lasalocid (40 μm × 5 min). Both inhibitors induced transient [Ca2+]i increases to μmlevels, yet neither was associated with a loss of viability (Fig.11). No significant changes in gap junction permeability were observed during or after these exposures. Thus, astrocytic coupling was not regulated by transient, nonlethal increments in [Ca2+]i; as a result, calcium increments within the physiological range are unlikely to influence astrocytic coupling.
Uncoupling occurs only on the terminal loss of plasma membrane integrity
Cellular demise was visualized by a loss of CDCF fluorescence concomitant with propidium iodide and/or trypan blue incorporation. These changes in cell staining reflect the loss of membrane integrity, a commonly used death criterion (Phillips, 1973). CDCF fluorescence was lost rapidly (<2 min) from dying cells. Of interest, CDCF fluorescence was retained in cells neighboring the dying cells. When a field of dying astrocytes was imaged by time-lapse, as individual cells lost membrane integrity, it was clear that CDCF fluorescence was retained in viable cells despite the death of their immediate neighbors (see Figs.7, 12). Thus, gap junctions connecting dying and viable cells must close. If these junctions remained open, CDCF fluorescence would be expected to decline gradually in the still viable cells. To the contrary, the intensity of CDCF fluorescence in individual cells was unaffected by the loss of membrane integrity in adjacent cells (Fig. 12). Likewise, no transfer of propidium iodide (668 Da) from dead to viable cells was detected.
Another common observation was that astrocytic death was not random in the culture dish. Rather, the death of a few astrocytes triggered the death of their immediate neighbors, which again triggered the death of their neighbors. This pattern of death, with successive recruitment of cells, resulted in a gradual expansion of regions comprising dead cells. This wave-like extension of injury spread with a velocity of ∼2–6 μm/min (Fig. 12).
Astrocytic Cx43 immunoreactive plaques aggregate with death
Astrocytes are strongly immunoreactive for Cx43 (Dermietzel et al., 1991; Giaume et al., 1991). In normal viable astrocytes, the Cx43 staining appears as punctate junctional plaques on the membrane surface at points of intercellular contact. After lethal injury, whether because of ionophore exposure or metabolic inhibition, Cx43 immunoreactive plaques rapidly enlarged but remained in the membrane. Concurrent with the increase in plaque size, plaque number decreased, suggesting that existing plaques had aggregated. This pattern remained essentially unchanged during the subsequent hours (Fig.13 and Table1). That Cx43 immunoreactive plaques remain in the membrane during the process of astrocytic death is consistent with the observation that the same cells remain functionally coupled.
Fig. 13.
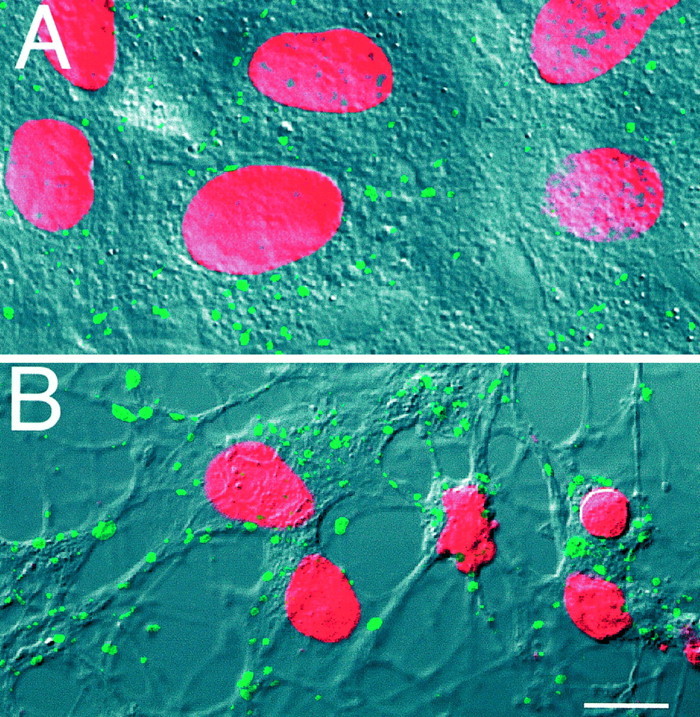
Loss of astrocytic viability is associated with the aggregation of Cx43 immunoreactive plaques. A, Cx43 immunoreactive plaques (fluorescein) are localized in the plasma membrane, with preference for sites of cell-to-cell contact. The culture was counterstained with propidium iodide (red) after fixation to quantify the number of plaques per nucleus. The fluorescence images were superimposed on DIC so that the distribution of gap junction plaques could be visualized. B, Two hours after metabolic inhibition, the number of Cx43 immunoreactive plaques had decreased concurrently with an increase in plaque size. Plaques remained in the plasma membrane. Note the decrease in nuclear size associated with the loss of viability.
Table 1.
Size of nuclei and Cx43 immunoreactive plaques during the process of astrocytic death (μm2)
| Ionophore | |||
|---|---|---|---|
| Nuclear size | Plaque size | Number of plaques | |
| Controls | 164 ± 14 | 0.84 ± 0.09 | 33 ± 5 |
| 15 min | 154 ± 8 | 0.84 ± 0.11 | 33 ± 5 |
| 30 min | 112 ± 12 | 0.95 ± 0.18 | 27 ± 6 |
| 1 hr | 63 ± 11 | 1.48 ± 0.10 | 24 ± 5 |
| 2 hr | 56 ± 8 | 1.36 ± 0.11 | 23 ± 6 |
| 4 hr | 45 ± 11 | 1.29 ± 0.06 | 21 ± 4 |
| Metabolic inhibition | |||
| Nuclear size | Plaque size | Number of plaques | |
| Controls | 155 ± 11 | 0.91 ± 0.08 | 35 ± 4 |
| 15 min | 147 ± 15 | 1.08 ± 0.10 | 36 ± 6 |
| 30 min | 95 ± 20 | 1.35 ± 0.16 | 31 ± 9 |
| 1 hr | 54 ± 8 | 1.52 ± 0.20 | 28 ± 6 |
| 2 hr | 50 ± 7 | 1.38 ± 0.14 | 22 ± 4 |
| 4 hr | 42 ± 8 | 1.49 ± 0.12 | 23 ± 3 |
Cx43 dephosphorylates during the process of cell death
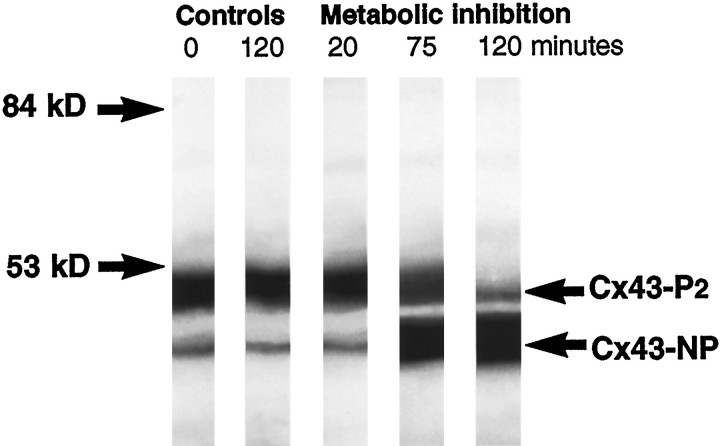
Several lines of evidence have suggested a functional relationship between Cx43 phosphorylation and gap junctional communication. Cx43 is synthesized as a single 42 kDa species that first is converted to a 44 kDa (Cx43-P1) and then to a 46 kDa (Cx43-P2) species by phosphorylation on serine. Processing of Cx43 to the P2 form is correlated strongly with its incorporation into junction plaques (Musil et al., 1990; Musil and Goodenough, 1991). We observed that lethal insults, including both ionophore exposure and metabolic inhibition, triggered a rapid loss of Cx43-P2 (Fig. 14). The time course of Cx43-P2 loss (Fig. 14) closely paralleled the loss of functional coupling, supporting the notion that functional channels are composed of Cx43-P2.
Fig. 14.
Western blot analysis of Cx43. A 20 min metabolic inhibition did not change the ratio between unphosphorylated Cx43 (Cx43-NP) and phosphorylated Cx43 (Cx43-P 2), as compared with control. However, a partial dephosphorylation had taken place at 75 min and progressed by 120 min. Dephosphorylation parallels functional uncoupling (see Fig. 8A, middle panel), supporting the notion that Cx43-P2is required for the formation of functional channels. Two control samples, one collected directly and one incubated in HBSS for 2 hr, are shown. Prolonged incubation in HBSS was not associated with detectable changes in phosphorylation pattern.
DISCUSSION
Astrocytes are electrically nonexcitable cells that communicate with each other by means of calcium signaling across gap junctions (Smith, 1994). We explored the possibility that astrocytic gap junctions are functional during the process of cell death. The uniformity of the observed response, using two different preparations and several fatal insults, suggests that astrocytes stereotypically decrease coupling but that they do not uncouple during or after lethal injury. Thus, secondary messengers can migrate freely among dying astrocytes. The observation raises the intriguing possibility that astrocytic signaling across gap junctions persists, perhaps in aberrant versions, during the acute phase of focal stroke and may contribute to the extension of focal injury.
Calcium and hydrogen ions as modulators of gap junctional permeability
Because the concentrations of Ca2+ and H+ change dramatically during ischemia, we first established to what extent these ions contribute to the modulation of gap junction permeability in astrocytes. Ca2+ is a well known regulator of junction conductance (Unwin and Ennis, 1980;Loewenstein, 1981). Ca2+ might not always interact directly with gap junctions but rather via a cytoplasmic intermediate. The sensitivity to Ca2+ disappeared after internal perfusion of, for example, crayfish segmented axons but recovered when calmodulin was added (Johnston and Ramon, 1981; Arellano et al., 1988). Conditions favoring phosphorylation of the channel protein also increased the sensitivity to calcium in the same preparation (Arellano et al., 1990). To our knowledge, there are no published reports of the effect of Ca2+ on astrocytic gap junctions. Astrocytes uniformly express a single-unit conductance of 50–60 pS or multiples thereof, consistent with their expression of Cx43 (see Fig.13) (Giaume et al., 1991; Dermietzel and Spray, 1993). We found here that, when the patch pipette contained BAPTA (20 mm), astrocytic coupling increased threefold during resting conditions in brain slices. In contrast, BAPTA-AM loading (20 μm) of cultured astrocytes did not reduce resting [Ca2+]i and was not associated with an increase in the coupling strength during resting conditions (Wang et al., 1997). Brief nonlethal increments of [Ca2+]i did not alter detectably the extent of coupling in cultures (see Fig. 11), suggesting that the increases in [Ca2+]i concentration of 300–1000 nm observed during the propagation of intercellular calcium waves (Cornell-Bell et al., 1990) did not perturb astrocytic coupling significantly. Ischemic-induced increments in [Ca2+]i were consistently associated with a decrease in coupling in both preparations, indicating that lethal [Ca2+]i increments reduced coupling strength. Combined, the observations suggest that astrocytic gap junctions only are sensitive to sustained (>5–10 min) pertubations of [Ca2+]i.
Data about the sensitivity of astrocytic junctions to pH are conflicting. Anders et al. (1988) found that astrocytic uncoupling first occurred when extracellular pH was lowered to 4.5 by exposure to a lactic acid-containing solution. The degree of intracellular acidosis that develops during this exposure is lethal to cultured astrocytes (Nedergaard et al., 1991), suggesting that pH in the physiological range does not regulate coupling. By contrast, CO2elevation triggered a partial uncoupling within the pH range from 6 to 7 among cultured astrocytes (Dermietzel et al., 1991; Pappas et al., 1996). Also, astrocytic coupling in slices was blocked by CO2 elevation (Connors et al., 1984). In our study, in which the concentrations of both [Ca2+]i and pH were controlled_in vitro_, astrocytic junctions were insensitive to pH changes within the physiological range (see Fig. 9). Indeed, additional experiments confirmed that coupling was unaffected by severe acidosis. We used the knowledge that CDCF is also a pH indicator with a p_K_a of 4.2; a 20% reduction of the 495/440 nm ratio corresponds approximately to pHi 4.6 (Nedergaard et al., 1991). At this low pHi, refill was 30 ± 9% (n = 5) or not significantly different from control values, indicating directly that astrocytic gap junctions are functional even during severe acidosis. It is likely that differences in regional origin, cellular differentiation, and culture conditions contribute to the seemingly divergent observations on pH sensitivity of gap junctions.
Collectively, these observations indicate that astrocytic gap junctions, at least in culture, are insensitive to short-lasting increments of Ca2+ and H+ within physiological range. Sustained lethal Ca2+elevations decreased permeability but did not uncouple astrocytic gap junctions.
Astrocytes remain coupled during cell death
Having established that Ca2+ decreases, but does not close, gap junctions, we asked if other factors in the process of cell death affect astrocyte coupling. Astrocyte death was evoked either by ionophore exposure or by metabolic inhibition. Death proceeded according to a schedule that could not be characterized by the classical criteria as either typically necrotic or apoptotic. Membrane and cytoplasmic changes occurred before nuclear changes (see Fig. 8, bottom panel), and DNA laddering was absent (results not shown), suggesting necrotic cell death. However, other signs of necrosis, such as cell swelling, were not present. On the contrary, cell size and nuclear diameter were reduced after injury (see Fig. 13 and Table 1). This mixed pattern of cell death has an in vivo correlate: typically, shrinkage and membrane degradation become apparent before DNA breakdown in ischemic brain (Petito, 1996).
Dynamic changes in coupling were noted after injury that primarily were an inverse function of cytosolic [Ca2+]. When astrocytic death was evoked by ionophore exposure, junction coupling reached its lowest level just after the initial peak in [Ca2+]i, and a secondary decrease in coupling coincided with the terminal increase in [Ca2+]i (see Fig. 8C, middle panel). Similarly, when death was induced by metabolic inhibition, gap junction permeability declined concurrently with a progressive increase in [Ca2+]i, and the decrease in coupling was less pronounced when [Ca2+]i was low (see Fig.8B). These in vitro observations were corroborated by electrophysiological measurements in intact brain, when the ischemic condition decreased astrocyte coupling to ∼35% of resting levels. Indeed, buffering astrocytic [Ca2+]i by BAPTA attenuated the uncoupling effect of ischemia (see Fig. 5). Immunolabeling against Cx43 revealed that gap junction plaques aggregated but remained in the membrane during the process of astrocytic death (see Fig.13B). The plaques were composed primarily of the unphosphorylated Cx43 species, because Cx43 dephosphorylated slowly after injury (see Fig. 14). The time course of dephosphorylation paralleled the decrease in functional coupling, suggesting that the phosphorylated moiety of Cx43 is required for gap junction function (Musil et al., 1990; Musil and Goodenough, 1991). No aggregation of immunoreactive plaques or dephosphorylation of Cx43 occurred after nonlethal calcium exposure (results not shown).
Functional significance of coupling between dying and viable astrocytes
Few studies have addressed the issue of coupling between dying and viable cells during and after cerebral injury. Such communication might be adaptive with regard to regeneration. Wolszon et al. (1994) found that, when a neuron in embryonic leech was ablated by UV irradiation, a calcium wave traversed gap junctions to include the coupled axon of a neighboring neuron. The remaining neuron responded by accelerating the extension of its previously coupled axon, thereby taking over territory vacated by its ablated partner. In contrast, gap junction diffusion also might amplify the extent of injury. For instance, among cells transfected with the thymidine kinase gene from herpes simplex virus, not only the transfectants but also their neighbors were killed by gangliovir (Mesnil et al., 1996). Gangliovir acts as a terminator of DNA replication after phosphorylation by the transfecting thymidine kinase. This effect was not observed when the cells were not connected by gap junctions or when the cells were cultured without direct cell-to-cell contact, demonstrating that “bystander death” required gap junctions. Indeed, time-lapse studies of our cultures confirmed that astrocytes did not die randomly but, rather, in groups. The death of a few astrocytes triggered their neighbors’ death, which in turn triggered their neighbors’ death. The successive involvement of neighboring cells resulted in a slowly progressing wave of death (see Fig. 12). Cellular interactions, among those gap junction-mediated diffusion, might be an important factor in progression of death among astrocytes.
Several lines of evidence have indicated that an ischemic infarct also expands during the first few hours of ischemia (for review, seeHossmann, 1994). Could signaling across astrocytic gap junctions contribute to this secondary extension of brain injury? A network of gap junctions that connect dying astrocytes in the deeply ischemic core with astrocytes in less ischemic surroundings might serve as a necessary shuttle for removing ischemic products such as excess intracellular Ca2+ and inositol triphosphate (IP3). However, a continuous influx of Ca2+ into glia located in the ischemic border zone might trigger aberrant astrocytic Ca2+ waves. Indeed, it is possible that waves of spreading depression may represent an in vivo correlate to aberrant astrocytic calcium signaling within ischemic tissue (Nedergaard et al., 1995). Spontaneous waves of spreading depression are evoked within the ischemic peri-infarct zone during the acute phase of stroke (Nedergaard and Astrup, 1986; Iijima et al., 1992; Siesjo et al., 1995). These waves of spreading depression have multiple origins but always are generated in the immediate surroundings of an evolving infarct. Tissue bordering the infarct does not repolarize after the invasion of spreading depression but remains depolarized and eventually is incorporated into the evolving infarct (Hossmann, 1994). As a result, the infarct grows stepwise after each episode of spreading depression (Mies et al., 1993). Further studies are required to establish whether astrocytic calcium waves are an in vitro correlate to spreading depression. However, our demonstration that astrocytic gap junctions remain open in ischemic brain tissue provides a basis for glial signaling, as well as a direct conduit for the passage of lethal agents among ischemic and nonischemic astrocytes.
Footnotes
This study was supported by National Institute of Neurological Diseases and Stroke/National Institutes of Health Grants NS130007 and NS135011. M.N. is an Established Investigator, sponsored by The American Heart Association. We thank S. Goldman, B. Grafstein, and H. Sontheimer for their comments on this manuscript.
Correspondence should be addressed to Dr. Maiken Nedergaard, Department of Cell Biology and Anatomy, New York Medical College, Valhalla, NY 10595.
REFERENCES
- 1.Anders JJ. Lactic acid inhibition of gap junctional intercellular communication in in vitro astrocytes as measured by fluorescence recovery after laser photobleaching. Glia. 1988;1:371–379. doi: 10.1002/glia.440010604. [DOI] [PubMed] [Google Scholar]
- 2.Arellano G, Ramon F, Rivera A, Zampighi G. Calmodulin acts as an intermediary for the effects of calcium on gap junctions from crayfish lateral axons. J Membr Biol. 1988;101:119–131. doi: 10.1007/BF01872827. [DOI] [PubMed] [Google Scholar]
- 3.Arellano R, Rivera A, Ramon F. Protein phosphorylation and hydrogen ions modulate calcium-induced closure of gap junction channels. Biophys J. 1990;57:363–367. doi: 10.1016/S0006-3495(90)82537-6. [DOI] [PMC free article] [PubMed] [Google Scholar]
- 4.Astrup J, Symon L, Branston N, Lassen N. Cortical evoked potential and extracellular potassium and hydrogen at cortical levels of brain ischemia. Stroke. 1977;8:51–57. doi: 10.1161/01.str.8.1.51. [DOI] [PubMed] [Google Scholar]
- 5.Astrup J, Siesjo B, Symon L. Threshold in cerebral ischemia—the ischemic penumbra. Stroke. 1981;12:723–725. doi: 10.1161/01.str.12.6.723. [DOI] [PubMed] [Google Scholar]
- 6.Atkinson M, Sheridan J. Altered junctional permeability between cells transformed by v-ras, v-mos, or v-src. Am J Physiol. 1988;255:C674–C683. doi: 10.1152/ajpcell.1988.255.5.C674. [DOI] [PubMed] [Google Scholar]
- 7.Bennett M, Barrio L, Bergiello T, Spray D, Hertzberg E, Saez J. Gap junctions: New tools. New answers. New questions. Neuron. 1991;6:305–320. doi: 10.1016/0896-6273(91)90241-q. [DOI] [PubMed] [Google Scholar]
- 8.Bordey A, Sontheimer H. Postnatal development of ionic currents in rat hippocampal astrocytes in situ. J Neurophysiol. 1997;78:461–477. doi: 10.1152/jn.1997.78.1.461. [DOI] [PubMed] [Google Scholar]
- 9.Burt J. Block of intercellular communication: interaction of intracellular H+ and Ca2+. Am J Physiol. 1987;253:C607–C612. doi: 10.1152/ajpcell.1987.253.4.C607. [DOI] [PubMed] [Google Scholar]
- 10.Chan P. Oxygen radicals in focal cerebral ischemia. Brain Pathol. 1994;4:59–65. doi: 10.1111/j.1750-3639.1994.tb00811.x. [DOI] [PubMed] [Google Scholar]
- 11.Chattopadhyay A, Komath SS, Raman B. Aggregation of lasalocid A in membranes: a fluorescence study. Biochim Biophys Acta. 1992;1104:147–150. doi: 10.1016/0005-2736(92)90143-a. [DOI] [PubMed] [Google Scholar]
- 12.Connors BW, Benardo LS, Prince DA. Carbon dioxide sensitivity of dye coupling among glia and neurons of the neocortex. J Neurosci. 1984;4:1324–1330. doi: 10.1523/JNEUROSCI.04-05-01324.1984. [DOI] [PMC free article] [PubMed] [Google Scholar]
- 13.Cornell-Bell AH, Finkbeiner SM, Cooper MS, Smith SJ. Glutamate induces calcium waves in cultured astrocytes: long range glial signaling. Science. 1990;247:470–474. doi: 10.1126/science.1967852. [DOI] [PubMed] [Google Scholar]
- 14.Dani JW, Chernjavsky A, Smith SJ. Neuronal activity triggers calcium waves in hippocampal astrocyte networks. Neuron. 1992;8:429–440. doi: 10.1016/0896-6273(92)90271-e. [DOI] [PubMed] [Google Scholar]
- 15.Dermietzel R, Spray D. Gap junctions in the brain: where? What type? How many and why? Trends Neurosci. 1993;16:186–192. doi: 10.1016/0166-2236(93)90151-b. [DOI] [PubMed] [Google Scholar]
- 16.Dermietzel R, Hertzberg E, Kessler J, Spray D. Gap junctions between cultured astrocytes: immunocytochemical, molecular, and electrophysiological analysis. J Neurosci. 1991;11:1421–1432. doi: 10.1523/JNEUROSCI.11-05-01421.1991. [DOI] [PMC free article] [PubMed] [Google Scholar]
- 17.Dietrich W, Busto R, Globus M, Ginsberg M. Brain damage and temperature: cellular and molecular mechanisms. In: Siesjo B, Wieloch T, editors. Cellular and molecular mechanisms of ischemic brain damage. Lippincott–Raven; Philadelphia: 1996. pp. 177–198. [PubMed] [Google Scholar]
- 18.Duffy S, MacVicar B. In vitro ischemia promotes calcium influx and intracellular calcium release in hippocampal astrocytes. J Neurosci. 1996;16:71–81. doi: 10.1523/JNEUROSCI.16-01-00071.1996. [DOI] [PMC free article] [PubMed] [Google Scholar]
- 19.Enkvist K, McCarthy K. Activation of protein kinase C blocks astroglial gap junction communication and inhibits the spread of calcium wave. J Neurochem. 1992;59:519–526. doi: 10.1111/j.1471-4159.1992.tb09401.x. [DOI] [PubMed] [Google Scholar]
- 20.Giaume C, Venance L. Characterization and regulation of gap junction channels in cultured astrocytes. In: Spray D, Dermietzel R, editors. Gap junctions in the nervous system. Landes; Austin, TX: 1996. pp. 135–157. [Google Scholar]
- 21.Giaume C, Marin P, Cordier J, Glowinski J, Premont J. Adrenergic regulation of intercellular communications between cultured striatal astrocytes from the mouse. Proc Natl Acad Sci USA. 1991a;88:5577–5581. doi: 10.1073/pnas.88.13.5577. [DOI] [PMC free article] [PubMed] [Google Scholar]
- 22.Giaume C, Fromaget C, el Aoumari A, Cordier J, Glowinski J, Gros D. Gap junctions in cultured astrocytes: single-channel currents and characterization of channel-forming protein. Neuron. 1991b;6:133–143. doi: 10.1016/0896-6273(91)90128-m. [DOI] [PubMed] [Google Scholar]
- 23.Ginsberg M. Neuroprotection in brain ischemia: an update. The Neuroscientist. 1995;1:95–103. [Google Scholar]
- 24.Goldman S, Pulsinelli W, Clarke W, Kraig R, Plum F. The effects of extracellular acidosis on neurons and glia in vitro. J Cereb Blood Flow Metab. 1989;9:471–477. doi: 10.1038/jcbfm.1989.70. [DOI] [PMC free article] [PubMed] [Google Scholar]
- 25.Grynkiewicz G, Poenie G, Tsien R. A new generation of calcium indicators with greatly improved fluorescence properties. J Biol Chem. 1985;260:3440–3450. [PubMed] [Google Scholar]
- 26.Hansen AJ. Effects of anoxia on ion distribution in the brain. Physiol Rev. 1985;65:101–148. doi: 10.1152/physrev.1985.65.1.101. [DOI] [PubMed] [Google Scholar]
- 27.Hossmann K. Viability thresholds and the penumbra of focal ischemia. Ann Neurol. 1994;36:557–565. doi: 10.1002/ana.410360404. [DOI] [PubMed] [Google Scholar]
- 28.Hossmann KA. Excitotoxic mechanisms and focal ischemia. In: Siesjo B, Wieloch T, editors. Cellular and molecular mechanisms of ischemic brain damage. Lippincott–Raven; Philadelphia: 1996. pp. 69–74. [Google Scholar]
- 29.Iijima T, Mies G, Hossmann KA. Repeated negative DC deflections in rat cortex following middle cerebral artery occlusion are abolished by MK-801: effect on volume of ischemic injury. J Cereb Blood Flow Metab. 1992;12:727–733. doi: 10.1038/jcbfm.1992.103. [DOI] [PubMed] [Google Scholar]
- 30.Jaffe L. The path of calcium in cytosolic calcium oscillations: a unifying hypothesis. Proc Natl Acad Sci USA. 1991;88:9883–9887. doi: 10.1073/pnas.88.21.9883. [DOI] [PMC free article] [PubMed] [Google Scholar]
- 31.Johnston M, Ramon F. Electrotonic coupling in internally perfused crayfish segmented axons. J Physiol (Lond) 1981;317:509–518. doi: 10.1113/jphysiol.1981.sp013840. [DOI] [PMC free article] [PubMed] [Google Scholar]
- 32.Kang J, Huguenard J, Prince DA. Ca-activated potassium channels underlying the afterhyperpolarization in rat neocortical pyramidal neurons. Soc Neurosci Abstr. 1995;21:718.16. [Google Scholar]
- 33.Kettenmann H, Ransom BR, Schlue W-R. Intracellular pH shifts capable of uncoupling cultured oligodendrocytes are seen only in low HCO3 solution. Glia. 1990;3:110–117. doi: 10.1002/glia.440030204. [DOI] [PubMed] [Google Scholar]
- 34.Largo C, Tombaugh G, Aitken P, Herreras O, Somjen G. Gap junction blockade but not poisoning of glia blocks spreading depression. Soc Neurosci Abstr. 1996;22:570.6. [Google Scholar]
- 35.Lattanzio F. The effects of pH and temperature on fluorescent calcium indicators as determined with chelex-100 and EDTA buffer systems. Biochem Biophys Res Commun. 1990;171:102–108. doi: 10.1016/0006-291x(90)91362-v. [DOI] [PubMed] [Google Scholar]
- 36.Loewenstein W. Junctional intercellular communication: the cell-to-cell membrane channel. Physiol Rev. 1981;61:829–913. doi: 10.1152/physrev.1981.61.4.829. [DOI] [PubMed] [Google Scholar]
- 37.Lowry O, Passonneau J. A flexible system of enzymatic analysis. Academic; New York: 1972. [Google Scholar]
- 38.McLarnon JG, Wong JHP, Sawyer D, Baimbridge KG. The actions of intermediate and long-chain n-alkanols on unitary NMDA currents in hippocampal neurons. Can J Physiol Pharmacol. 1991;69:1422–1427. doi: 10.1139/y91-213. [DOI] [PubMed] [Google Scholar]
- 39.Mesnil M, Piccoli C, Tiraby G, Willecke K, Yamasaki H. Bystander killing of cancer cells by herpes simplex virus thymidine kinase gene is mediated by connexins. Proc Natl Acad Sci USA. 1996;93:1831–1835. doi: 10.1073/pnas.93.5.1831. [DOI] [PMC free article] [PubMed] [Google Scholar]
- 40.Mies G, Iijima T, Hossmann K-A. Correlation between peri-infarct DC shifts and ischaemic neuronal damage in rats. NeuroReport. 1993;4:709–711. doi: 10.1097/00001756-199306000-00027. [DOI] [PubMed] [Google Scholar]
- 41.Musil L, Cunningham B, Edelman G, Goodenough D. Differential phosphorylation of the gap junction protein connexin 43 in junctional communication-competent and -deficient cell lines. J Cell Biol. 1990;111:2077–2088. doi: 10.1083/jcb.111.5.2077. [DOI] [PMC free article] [PubMed] [Google Scholar]
- 42.Musil L, Goodenough D. Biochemical analysis of connexin 43 intracellular transport, phosphorylation, and assembly into gap junctional plaques. J Cell Biol. 1991;115:1357–1374. doi: 10.1083/jcb.115.5.1357. [DOI] [PMC free article] [PubMed] [Google Scholar]
- 43.Nedergaard M. Energy depletion kills neurons independently of cytosolic calcium. J Cereb Blood Flow Metab. 1991;11:S421. [Google Scholar]
- 44.Nedergaard M. Direct signaling from astrocytes to neurons in cultures of mammalian brain cells. Science. 1994;263:1768–1771. doi: 10.1126/science.8134839. [DOI] [PubMed] [Google Scholar]
- 45.Nedergaard M. Intracellular Ca2+ transients evoked by lactic acid in cultured mammalian neurons. Am J Physiol. 1995;268:R506–R513. doi: 10.1152/ajpregu.1995.268.2.R506. [DOI] [PubMed] [Google Scholar]
- 46.Nedergaard M, Astrup J. Infarct rim: effects of hyperglycemia on direct current potential and 14C 2-deoxyglucose phosphorylation. J Cereb Blood Flow Metab. 1986;6:607–615. doi: 10.1038/jcbfm.1986.108. [DOI] [PubMed] [Google Scholar]
- 47.Nedergaard M, Hansen AJ. Characterization of cortical depolarization evoked in focal cerebral ischemia. J Cereb Blood Flow Metab. 1993;13:568–574. doi: 10.1038/jcbfm.1993.74. [DOI] [PubMed] [Google Scholar]
- 48.Nedergaard M, Desai S, Pulsinelli WA. Dicarboxy-dichlorofluorescein: a new fluorescent probe for measuring acidic intracellular pH. Anal Biochem. 1990;187:109–114. doi: 10.1016/0003-2697(90)90425-9. [DOI] [PubMed] [Google Scholar]
- 49.Nedergaard M, Goldman SA, Desai S, Pulsinelli WA. Acid-induced death in neurons and glia. J Neurosci. 1991;11:2489–2497. doi: 10.1523/JNEUROSCI.11-08-02489.1991. [DOI] [PMC free article] [PubMed] [Google Scholar]
- 50.Nedergaard M, Cooper AJL, Goldman SA. Gap junctions are required for the propagation of spreading depression. J Neurobiol. 1995;28:433–444. doi: 10.1002/neu.480280404. [DOI] [PubMed] [Google Scholar]
- 51.Pappas C, Rioult M, Ranson B. Octanol, a gap junction uncoupling agent, changes intracellular [H+] in rat astrocytes. Glia. 1996;16:7–15. doi: 10.1002/(SICI)1098-1136(199601)16:1<7::AID-GLIA2>3.0.CO;2-2. [DOI] [PubMed] [Google Scholar]
- 52.Park C, Nehls D, Graham D, Teasdale G, McCulloch J. The glutamate antagonist MK-801 reduces focal ischemic brain damage in the rat. Ann Neurol. 1988;24:543–551. doi: 10.1002/ana.410240411. [DOI] [PubMed] [Google Scholar]
- 53.Parpura V, Basarsky TA, Liu F, Jeftinija K, Jeftinija S, Haydon PG. Glutamate-mediated astrocyte–neuron signaling. Nature. 1994;369:744–747. doi: 10.1038/369744a0. [DOI] [PubMed] [Google Scholar]
- 54.Pasti L, Volterra A, Pozzan T, Carmignoto G. Intracellular calcium oscillations in astrocytes: a highly plastic, bidirectional form of communication between neurons and astrocytes in situ. J Neurosci. 1997;17:7817–7830. doi: 10.1523/JNEUROSCI.17-20-07817.1997. [DOI] [PMC free article] [PubMed] [Google Scholar]
- 55.Pelligrini-Giampietro D, Cherici G, Alesiani M, Carla V, Moroni F. Excitatory amino acid release and free-radical formation may cooperate in the genesis of ischemia-induced neuronal damage. J Neurosci. 1990;10:1035–1041. doi: 10.1523/JNEUROSCI.10-03-01035.1990. [DOI] [PMC free article] [PubMed] [Google Scholar]
- 56.Petito C (1996) Apoptosis following ischemic brain injury. Paper presented at 20th Princeton Conference, Memphis, TN.
- 57.Phillips H. Dye exclusion tests for cell viability. In: Kruse P, Patterson M, editors. Tissue culture methods and applications. Academic; New York: 1973. pp. 406–408. [Google Scholar]
- 58.Porter J, McCarthy K. Hippocampal astrocytes in situ respond to glutamate released from synaptic terminals. J Neurosci. 1996;16:5073–5081. doi: 10.1523/JNEUROSCI.16-16-05073.1996. [DOI] [PMC free article] [PubMed] [Google Scholar]
- 59.Reynhout J, Lampe P, Johnson R. An activator of protein kinase C inhibits gap junction communication between cultured bovine lens cells. Exp Cell Res. 1992;198:337–342. doi: 10.1016/0014-4827(92)90388-o. [DOI] [PubMed] [Google Scholar]
- 60.Rink T, Tsien R, Pozzan S. Cytoplasmatic pH and free Mg2+ in lymphocytes. J Cell Biol. 1982;95:189–196. doi: 10.1083/jcb.95.1.189. [DOI] [PMC free article] [PubMed] [Google Scholar]
- 61.Sambrook J, Fritsch EH, Maniatis T. In: Molecular cloning: a laboratory manual, pp 1847–1871. Cold Spring Harbor Laboratory; Cold Spring Harbor, NY: 1989. [Google Scholar]
- 62.Sanderson M. Calcium waves, gradients, and oscillations, Ciba Foundation Symposium 188, pp 175–194. Wiley; Chichester, UK: 1995. Intercellular calcium waves mediated by inositol trisphosphate. [PubMed] [Google Scholar]
- 63.Siesjo B. Pathophysiology and treatment of focal cerebral ischemia. I. Pathophysiology. J Neurosurg. 1992;77:169–184. doi: 10.3171/jns.1992.77.2.0169. [DOI] [PubMed] [Google Scholar]
- 64.Siesjo B, Zhao Q, Pahlmark K, Siesjo P, Katsura K, Folbergrova J. Glutamate, calcium, and free radicals as mediators of ischemic brain damage. Ann Thorac Surg. 1995;59:1316–1320. doi: 10.1016/0003-4975(95)00077-x. [DOI] [PubMed] [Google Scholar]
- 65.Smith SJ. Neuromodulatory astrocytes. Curr Biol. 1994;4:807–810. doi: 10.1016/s0960-9822(00)00178-0. [DOI] [PubMed] [Google Scholar]
- 66.Sontheimer H, Waxman S. Expression of voltage-activated ion channels by astrocytes and oligodendrocytes in the hippocampal slice. J Neurophysiol. 1993;70:1863–1873. doi: 10.1152/jn.1993.70.5.1863. [DOI] [PubMed] [Google Scholar]
- 67.Sontheimer H, Minturn J, Black J, Waxman S, Ransom B. Specificity of cell–cell coupling in rat optic nerve astrocytes in vitro. Proc Natl Acad Sci USA. 1990;87:9833–9837. doi: 10.1073/pnas.87.24.9833. [DOI] [PMC free article] [PubMed] [Google Scholar]
- 68.Sontheimer H, Waxman S, Ransom B. Relationship between Na+ current expression and cell–cell coupling in astrocytes cultured from rat hippocampus. J Neurophysiol. 1991;65:989–1002. doi: 10.1152/jn.1991.65.4.989. [DOI] [PubMed] [Google Scholar]
- 69.Spray D, Harris A, Bennett M. Gap junctional conductance is a simple and sensitive function of intracellular pH. Science. 1981;211:712–715. doi: 10.1126/science.6779379. [DOI] [PubMed] [Google Scholar]
- 70.Terrar DA, Victory JGG. Isoflurane depresses membrane currents associated with contraction in myocytes isolated from guinea-pig ventricle. Anesthesiology. 1988;69:742–749. doi: 10.1097/00000542-198811000-00017. [DOI] [PubMed] [Google Scholar]
- 71.Thomas J. Intracellular trapped pH indicators. In: Thomas J, editor. Optical methods in cell physiology. Wiley; New York: 1986. pp. 311–322. [Google Scholar]
- 72.Tymianski M, Wallace M, Spigelman I, Carlen P, Tator C, Charlton M. Cell-permeant Ca2+ chelators reduce early excitotoxic and ischemic neuronal injury in vitro and in vivo. Neuron. 1993;11:221–235. doi: 10.1016/0896-6273(93)90180-y. [DOI] [PubMed] [Google Scholar]
- 73.Unwin P, Ennis P. Two configurations of a channel-forming membrane protein. Nature. 1980;283:545–549. doi: 10.1038/307609a0. [DOI] [PubMed] [Google Scholar]
- 74.Wade MH, Trosko J, Schindler M (1986) Fluorescence photobleaching assay of gap junction-mediated communication between human cells. Science 525–528. [DOI] [PubMed]
- 75.Wang Z, Tymianski M, Jones OT, Nedergaard M. Impact of cytoplasmic buffering on the spatial and temporal characteristics of intracellular calcium signals in astrocytes. J Neurosci. 1997;17:7359–7371. doi: 10.1523/JNEUROSCI.17-19-07359.1997. [DOI] [PMC free article] [PubMed] [Google Scholar]
- 76.Wolszon L, Rehder V, Kater S, Macagno E. Calcium wave fronts that cross gap junctions may signal neuronal death during development. J Neurosci. 1994;14:3437–3448. doi: 10.1523/JNEUROSCI.14-06-03437.1994. [DOI] [PMC free article] [PubMed] [Google Scholar]
- 77.Zhu D, Caveney S, Kidder G, Naus C. Transfection of C6 glioma cells with connexin 43 cDNA: analysis of expression, intercellular coupling, and cell proliferation. Proc Natl Acad Sci USA. 1991;88:1883–1887. doi: 10.1073/pnas.88.5.1883. [DOI] [PMC free article] [PubMed] [Google Scholar]
