Imaging dynamic and selective low-complexity domain interactions that control gene transcription (original) (raw)
. Author manuscript; available in PMC: 2020 Jan 15.
Published in final edited form as: Science. 2018 Jun 21;361(6400):eaar2555. doi: 10.1126/science.aar2555
Abstract
INTRODUCTION
DNA binding transcription factors (TFs) are quintessential regulators of eukaryotic gene expression. Early studies of TFs revealed their well-structured DNA binding domains (DBDs) and identified functionally critical activation domains (ADs) required for transcription. It later became evident that many Ads contain intrinsically disordered low-complexity sequence domains (LCDs), but how LCDs activate transcription has remained unclear. Although it is known that transcriptional activation by LCDs requires selective interaction with binding partners, it has been challenging to directly measure selective LCD-LCD recognition in vivo and unravel its mechanism of action.
RATIONALE
Traditional biochemical reconstitution and genetics studies have identified most of the molecular players central to transcription regulation. However, the mechanism by which weak, dynamic protein-protein interactions drive gene activation in living cells has remained unknown. Advances in live-cell single molecule imaging have opened a new frontier for studying transcription in vivo. In this study, we used synthetic LacO (Lac operator) arrays as well as endogenous GGAA microsatellite loci to study LCD-LCD interactions of TFs such as EWS/FLI1, TAF15, and Sp1 in live cells. To probe the dynamic behavior of TF LCDs at target genomic loci, we have combined CRISPR-Cas9 genome editing, mutagenesis, gene activation, cell transformation assays, and various high-resolution imaging approaches including fluorescence correlation spectroscopy, fluorescence recovery after photobleaching, lattice light-sheet microscopy, three-dimensional DNA fluorescence in situ hybridization, and live-cell single-particle tracking.
RESULTS
Live-cell single-molecule imaging revealed that TF LCDs interact to form local high-concentration hubs at both synthetic DNA arrays and endogenous genomic loci. TF LCD hubs stabilize DNA binding, recruit RNA polymerase II (RNA Pol II), and activate transcription. LCD-LCD interactions within hubs are highly dynamic (seconds to minutes), selective for binding partners, and differentially sensitive to These findings suggest that under physiological conditions, rapid, reversible, and selective multivalent LCD-LCD interactions occur between TFs and the RNA Pol II machinery to activate transcription. We observed formation of functional TF LCD hubs at a wide range of intranuclear TF concentrations. Although we detected apparent liquid-liquid phase separation with gross overexpression of LCDs, transcriptionally competent TF LCD hubs were observed at physiological TF levels at endogenous chromosomal loci in the absence of detectable phase separation. In addition, mutagenesis, gene expression, and cell transformation assays in Ewing’s sarcoma cells revealed a functional link between LCD-LCD interactions, transactivation capacity, and oncogenic potential.
CONCLUSION
The use of various imaging methods in live cells powerfully complements in vitro studies and provides new insights into the nature of LCD interactions and their role in gene regulation. We propose that transactivation domains function by forming local high-concentration hubs of TFs via dynamic, multivalent, and specific LCD-LCD interactions. It also seems likely that weak, dynamic, and transient contacts between TFs play a role in disease-causing dysregulation of gene expression (i.e., EWS/FLI1 in Ewing’s sarcoma), suggesting that LCD-LCD interactions may represent a new class of viable drug targets. Although we examined a small subset of TF LCDs, the principles uncovered regarding the dynamics and mechanisms driving LCD-LCD interactions may be applicable to other classes of proteins and biomolecular interactions occurring in many cell types.
Many eukaryotic transcription factors (TFs) contain intrinsically disordered low-complexity sequence domains (LCDs), but how these LCDs drive transactivation remains unclear. We used live-cell single-molecule imaging to reveal that TF LCDs form local high-concentration interaction hubs at synthetic and endogenous genomic loci.TF LCD hubs stabilize DNA binding recruit RNA polymerase II (RNA Pol II), and activate transcription. LCD-LCD interactions within hubs are highly dynamic, display selectivity with binding partners, and are differentially sensitive to disruption by hexanediols. Under physiological conditions, rapid and reversible LCD-LCD interactions occur between TFs and the RNA Pol II machinery without detectable phase separation. Our findings reveal fundamental mechanisms underpinning transcriptional control and suggest a framework for developing single-molecule imaging screens for drugs targeting gene regulatory interactions implicated in disease.
Graphical Abstract
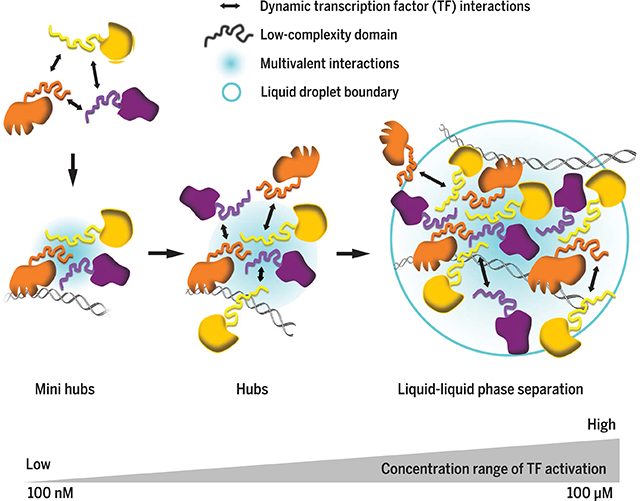
From hubs to phase separation: Activation occurs in a wide range of TF concentrations. In vivo LCD-dependent transactivation occurs in hubs formed over a broad range of TFconcentrations (100 nMto 100 μM) and time scales (<1 s tominutes). At endogenous concentrations,TF LCDs form transactivation hubs at native genomic loci without undergoing evident phase separation. Upon TF LCD overexpression, phase separation is observed at synthetic TF binding site arrays.
Sequence-specific DNA binding transcription factors (TFs) are preeminent players in eukaryotic gene regulation. From the earliest studies of human TFs, it was recognized that regulatory proteins such as Sp1 contain well-structured DNA binding domains (DBDs) and functionally critical transactivation domains that participate in specific TF-TF interactions to direct gene transcription (1–3). Numerous atomic structures of DBDs have provided a concrete understanding of TF-DNA interactions. In contrast, many transactivation domains contain low-complexity sequence domains (LCDs) that persist in an intrinsically disordered conformation not amenable to conventional structural determination. Mutations in TF LCDs not only disrupt transcription but also have been implicated in cancer and neurodegenerative disorders (4, 5). However, the mechanism by which TF LCDs execute specific transactivation functions has remained an enigma. Elucidation of how LCDs operate in vivo, given the dynamic nature of TF-TF interactions required for gene regulation, has been an equally challenging problem.
Several in vitro studies have suggested that purified LCDs from the FET protein family (FUS, EWS, and TAF15) can undergo reversible hydrogel formation or liquid-liquid phase separation at high concentrations and low temperatures (6–8). Moreover, the C-terminal domain of RNA polymerase II (RNA Pol II) is itself an LCD and can undergo phase separation (9) and be incorporated into FET LCD hydrogels in a phosphorylation-regulated manner (10). FET LCDs were also reported to undergo phase separation in live cells upon overexpression (7, 11).
However, stark differences exist between in vivo physiological conditions and those used for in vitro or overexpression studies. Temperature, protein concentration, purity, and micro-environment may all substantially affect the behavior of LCDs. There is also a vigorous debate as to whether LCDs undergo cross-β polymerization or remain in a disordered conformation when interacting with partners (6–8, 11–17). From the perspective of elucidating how TFs work in vivo, an equally pressing unresolved mechanistic question concerns the dynamics and time scales governing LCD-LCD interactions that would allow TFs to function in rapid cellular processes. Selectivity of cognate LCD-LCD interactions is another important yet poorly understood feature that is required for proper TF function in vivo. Thus far, selective LCD-LCD recognition has not been directly demonstrated in vivo, let alone understood at a mechanistic level. In this study, we combined a variety of high-resolution imaging strategies—including fluorescence correlation spectroscopy (FCS) (18, 19), fluorescence recovery after photobleaching (FRAP) (20), lattice light-sheet microscopy (21), three-dimensional (3D) DNA fluorescence in situ hybridization (FISH) (22), and live-cell single-particle tracking (SPT) (23, 24)—to probe the dynamic behavior of TF LCDs at target genomic loci under physiological conditions.
Synthetic LacO arrays mediate formation of LCD interaction hubs
We first established proof-of-concept experiments by using a synthetic Lac operator (LacO) array (~50,000 LacO repeats) integrated into the genome of human U2OS cells (25) that express various enhanced yellow fluorescent protein (EYFP)-tagged TF LCDs fused to the Lac repressor (LacI) (Fig. 1A). To probe potential sequence specific LCD-LCD interactions, we examined two distinct classes of LCDs: QGYS-rich LCDs from the FET family and a QGTS-rich LCD from Sp1 that is low in tyrosine (table S1) (Q Gln; G, Gly; Y, Tyr; S, Ser; T, Thr).
Fig. 1. A LacO array can mediate the formation of an LCD hub in live cells, which involves extensive LCD self-interaction and recruits RNA Pol II.

(A) Schematic for a LacO array (n ≈ 50,000 repeats for array 1, n ≈ 15,000 repeats for array 2) in the U20S genome nucleating an LCD hub when EYFP-LCD-LacI is transiently expressed. Alternatively, EYFP-LacI is expressed as a control. NLS, nuclear localization signal. (B) Confocal fluorescence and bright-field images of LacO-containing U20S cells where LacO array 1 (highlighted by circles) is bound by EYFP-labeled LCD-LacI or LacI. LCD-LacI-bound, but not LacI-bound, LacO arrays are visible in bright-field images. (C andD) Copy number of EYFP-labeled (C) or mCherry-labeled (D) TAF15 LCD-LacI (red) or LacI (blue) molecules bound to LacO array 1 (C) or 2 (D) as a function of mean nuclear concentration of the TF. Concentrations were measured by fluorescence intensity comparison. Each dot represents one cell. (E) Averaged FRAP curves at LacO array 1 bound by mCherry-labeled TAF15 LCD-LacI (red) or LacI (blue). Error bars represent SD. a.u., arbitrary units; N, number of cells analyzed. (F) (Top) Schematic of the proteins expressed in the LacO-containing U20S line. (Bottom) Confocal fluorescence images show that Halo-RPB1 (labeled with 200 nM Halo ligand JF500, green) is enriched at LacO array 2 bound by mCherry-EWS LCD-LacI (red). (G) (Left) Averaged Halo-RPB1 images at LacO array 2 bound by mCherry-labeled LacI, EWS LCD-LacI, FUS LCD-LacI, or TAF15 LCD-LacI (N = 55, 69, 81, or 143). (Right) Fluorescence intensity of Halo-RPB1 at the LacO array center in the average images after subtraction of nuclear Halo-RPB1 background (see supplementary methods). ** denotes a statistically significant increase compared with the LacI condition (P < 0.01, two-sample t test). Error bars represent bootstrapped SD (45).
As expected, the LacO array recruits a large number of EYFP-LCD-LacI molecules via targeted DNA binding, forming a concentrated local interaction hub in the nucleus. LacO-associated hubs formed by LCD-LacI but not LacI are visible by bright-field microscopy (Fig. 1B), suggesting that the refractive index and mass density of LCD-LacI hubs differ considerably from the surrounding nuclear environment.
We found that both TAF15-LacI and Sp1-LacI give rise to much brighter and larger LacO-associated LCD hubs than LacI alone. To quantify this effect, we used two orthogonal methods to measure the protein concentrations in live cells. Specifically, we performed fluorescence intensity and FCS measurements of intracellular protein and compared the results with standard concentration curves of a purified fluorescent tag (EYFP or mCherry) calibrated by the same method (fig. S1). Next, we estimated the absolute protein copy number in each hub by using the average in-hub protein concentration (fig. S2A) and hub dimensions measured in single-cell images (fig. S2B). The two independent concentration measurements consistently showed that the LCD-LacI copy number in the LacO-associated hub increases with the TF nuclear concentration much faster than with LacI alone and reaches levels up to orders of magnitude greater than the number of LacO repeats available for direct LacO-LacI binding (Fig. 1C and fig. S2, C and D), suggesting likely cooperative multivalent interactions at the LacO array that is contributed by extensive LCD self-interactions. Similarly, smaller LacO arrays containing substantially fewer (~15,000) LacO repeats similarly nucleate LCD self-interactions (Fig. 1D and fig. S2, E and F).
Moreover, LCD-LacI but not LacI alone can form hundreds of smaller puncta throughout the nucleus once its intranuclear concentration reaches a certain threshold (Figs. 1B and 2A, and fig. S2, G andH). LCDs can form intranuclear puncta in some cases even without being fused to a DBD such as LacI (Fig. 3A, bottom). These results suggest that LCD-LCD interactions can promote self-assembly of LCD hubs upon overexpression without assistance from DNA (7, 11).
Fig. 2. LCD hub formation involves selective protein-protein interactions, which can be disrupted by 1,6-HD with sequence-dependent sensitivity.

(A) Confocal fluorescence images of U2OS cells containing LacO array 1 that coexpress various combinations of mCherry-LCD and EYFP-LCD-LacI. The region surrounding the LacO array is zoomed in.
(B) Quantification of the enrichment of mCherry-LCD (red) at the LacO array 1 bound by various EYFP-labeled LCD-LacI fusion proteins (green), calculated as the peak mCherry fluorescence intensity at the array divided by the average intensity immediately surrounding the array (fig. S5A). Null, mCherry not fused to any LCD. An mCherry enrichment at the array above 1 suggests LCD-LCD interactions. * denotes a statistically significant difference above 1 (P < 0.05, one-sample t test). NS, nonsignificant difference above 1. Error bars represent SE. (C) Fluorescence images of FUS and Sp1 LCD hubs before (0 s) and after (29 s) addition of 10% 1,6-HD.
(D) Number of nuclear puncta formed by FUS or Sp1 LCD surviving over time upon addition of 1,6-HD at different concentrations. Error bars represent SE.
Fig. 3. LCD-LCD interactions involved in hub formation are highly dynamic.

(A) Snapshots of a two-color SPT movie simultaneously imaging EYFP-labeled (green) EWS LCD-LacI (top, forming a LacO-associated LCD hub) or EWS LCD (bottom, forming self-aggregated LCD hubs not affiliated with the LacO array) and Halo-tagged EWS LCD (2 nM PA-JF646 labeled, red) in U2OS cells containing LacO array 1. A white dashed contour outlines the cell nucleus. We imaged the hubs in the EYFP channel (green) and tracked individual Halo-EWS LCD molecules with an acquisition time of 500 ms in the PA-JF646 channel (red). (B) Residence times of LCD (red) bound at the LacO-array-associated LCD hub or at self-aggregated LCD hubs not affiliated with the array (green). *P < 0.05, two-sample_t_ test. Error bars represent SE.
In addition, FRAP dynamics of LCD-LacI at the LacO array was also significantly different from that of LacI (Fig. 1E). Because diffusion contributes negligibly to the FRAP dynamics (fig. S3, A and B), such differences can be attributed to changes in dissociation rates. Specifically, when we fit the FRAP curves with a reaction-dominant model (26), we found that fusing TAF15 or FUS LCD to LacI leads to more than 60% reduction in the dissociation rate constant of LacI (fig. S3, C to F). This result suggests that at increased local TF concentrations, TF LCD hubs driven by LCD-LCD interactions stabilize TF binding to its cognate genomic site via multivalent contacts that could include both DBDs for tethering to chromatin and one or more LCDs within TF proteins that can form multiple transient interactions with different partner proteins.
LCD hubs interact with RNA Pol II
Having demonstrated homotypic LCD self-interactions, we next investigated the potential role of heterotypic LCD-LCD interactions in hub formation. First, we tested whether TF LCD hubs can interact with RNA Pol II in vivo by using a LacO-containing U2OS line in which we replaced the endogenous RPB1 (major and catalytic subunit of RNA Pol II) with an α-amanitin-resistant Halo-tagged RPB1 (27). We subsequently labeled the cells with a fluorescent HaloTag ligand and visualized RNA Pol II distribution in vivo. We found that mCherry-FET-LacI expression mediates significant enrichment of RNA Pol II in LacO-associated hubs compared with background levels recorded using LacI alone (Fig. 1, F and G, and fig. S4, A to C). Moreover, self-assembled LCD-LacI hubs that are unaffiliated with a LacO array also enrich RNA Pol II (fig. S4D), suggesting that LCD hubs interact with RNA Pol II potentially without assistance from DNA. While recapitulating the in vitro incorporation of RNA Pol II into LCD hydrogels (10), these experiments go one step further and suggest that LCD hub formation can facilitate the recruitment of the general transcription machinery in vivo—a key step toward transactivation.
LCD-LCD interactions are sequence specific and differentially sensitive to hexanediol disruption
Next, we probed the sequence specificity of interactions between various classes of LCD. To this end, we coexpressed both EYFP-LCD-LacI and mCherry-LCD in LacO-containing cells. mCherry-LCD lacking a DBD becomes enriched at the array only when it can interact with the coexpressed LCD that is fused to LacI (Fig. 2A and fig. S5A). Notably, the array can enrich mCherry-LCD over a wide range of expression levels. The EWS-LacI-bound LacO array also enriches endogenous EWSR1, as detected by immunofluorescence (fig. S5B). Therefore, mCherry-LCD enrichment at the array is most likely due to specific LCD-LCD interactions rather than potential nonspecific overexpression artifacts. Using this two-color imaging assay, we confirmed homotypic self-interactions of all tested LCDs (from the FET family and Sp1). Intriguingly, although all three FET LCDs interacted among themselves, none of them interacted with the Sp1 LCD (Fig. 2, A and B), suggesting that LCD interactions exhibit strong sequence specificity that is likely an essential feature underlying combinatorial TF regulation of gene expression.
To better understand the nature of LCD-LCD interactions, we treated cells with 1,6-hexanediol (1,6-HD), an aliphatic alcohol known to dissolve various intracellular membraneless compartments and FUS hydrogels in vitro through disruption of hydrophobic interactions (28–30). We observed that both FUS and Sp1 LCD hubs rapidly disassemble within 30 s when exposed to 10% 1,6-HD. The LacO-associated LCD-induced hub shrank to a size comparable to that of the array bound by LacI alone, whereas all nuclear puncta not associated with LacO disappeared (Fig. 2C and Movie 1). We also found that 2,5-hexanediol (2,5-HD), a less hydrophobic derivative of 1,6-HD that barely melts FUS hydrogels in vitro (28), disrupts LCD hubs less efficiently in live cells (fig. S5, C and D). This correlation between hydrophobicity of hexanediols and LCD hub melting suggests that these aliphatic alcohols may directly influence LCD-LCD interactions by disrupting key hydrophobic contacts. These in vivo results also mirror in vitro hydrogel studies using these same disrupting agents (28).
Sp1 LCD hubs were disrupted significantly faster and more extensively than FUS LCD hubs with 2 or 5% 1,6-HD (Fig. 2D). Thus, although a combination of intermolecular forces may contribute to LCD hub formation, our results indicate that hydrophobic interactions might be more sensitive to disruption and play a more dominant role in Sp1 LCD self-interactions than FUS LCD, consistent with the Sp1 LCD containing hydrophobic residues sparsely interspersed among Q repeats (31). The differential sequence dependence of LCD-LCD interactions revealed by 1,6-HD treatment may be correlated to the selectivity of homo- and heterotypic LCD interactions observed above.
LCD-LCD interactions are highly dynamic
To study the dynamics of protein-protein interactions between LCD pairs, we coexpressed EYFP-LCD-LacI and Halo-LCD in the LacO-containing U2OS cells and performed SPT of Halo-LCD to measure residence times (RTs) of LCD-LCD interactions within the LacO-associated hub (Fig. 3A, top). For all LCDs tested, RTs resulting from self-interactions fell in the range of 11 to 33 s (Fig. 3B). When EYFP-LCD and Halo-LCD from the FET family were coexpressed at high levels, they spontaneously formed hubs that are unaffiliated with the array and resemble intranuclear puncta (Fig. 3A, bottom). These non-array hubs bind Halo-LCD via homo-or heterotypic interactions with even shorter RTs (7 to 10 s). As expected, the Sp1 LCD that failed to interact with the FUS LCD had an RT of <1 s at the non-array FUS LCD hubs (Fig. 3B). The fact that RTs of many LCDs in self-aggregated hubs unaffiliated with genomic DNA are substantially shorter than in hubs formed at the LacO array suggests that TF-DNA interactions that maintain a high local concentration of TF LCDs contribute to stabilizing LCD-LCD interactions and vice versa. Together, these findings reveal the rapid, reversible, and interdependent nature of LCD-LCD and TF-DNA interactions as well as their propensity to form local high-concentration hubs that likely stabilize multicomponent complexes—e.g., transcription preinitiation complex, a prerequisite for transactivation.
EWS/FLI1 forms hubs at endogenous GGAA microsatellites
Having unmasked the sequence specificity and dynamic nature of LCD-LCD interactions by using synthetic LacO arrays in living cells, we next tested LCD behavior at native GGAA microsatellites (>20 GGAA repeats) in the Ewing’s sarcoma cell line A673 (32–35). These cancer-derived cells carry a chromosomal translocation t(11;22)(q24;q12) producing a fusion oncogene, EWS/FLI1, that encodes a potent TF consisting of a trans-activating LCD from EWSR1 and the DBD from FLI1 that targets GGAA sequences (Fig. 4A).
Fig. 4. Combined DNA FISH and EWS/FLI1-Halo imaging show that endogenous EWS/FLI1 forms hubs at GGAA microsatellites.

(A) Schematic for GGAA microsatellites in the A673 genome nucleating hubs of endogenously Halo-tagged EWS/FLI1.
(B) Western blot of EWS/FLI1 and β-actin (normalization control) from clonal EWS/FLI1-Halo knock-in (KI), WT and clonal EWS/FLI1 knockout (KO) A673 lines. (C) z_-projected 3D image of endogenous EWS/FLI1-Halo in an A673 cell nucleus (stained with 200 nM Halo ligand JF549) taken on the lattice light-sheet microscope. (D) Confocal fluorescence images of 3D DNA FISH targeting GGAA microsatellite-adjacent CAV1 gene (enhanced Cy5 labeled, red) and endogenous EWS/FLI1-Halo (JF549 labeled, green). The zoomed-in views depict the region surrounding one particular_CAV1 locus. EWS/FLI1-Halo enrichment at the locus is visible but buried in high background.
(E) Averaged two-color images of five GGAA microsatellite-adjacent gene loci (CAV1, FCGRT, ABHD6, KDSR, and KIAA1797) and two gene loci not containing a GGAA microsatellite (Non-GGAA locus 1 targeting ADGRA3 and locus 2 targeting REEP5). The right column shows average surface plots of EWS/FLI1-Halo.
To visualize the behavior of endogenously expressed EWS/FLI1, we fused a HaloTag to its DBD using CRISPR-Cas9-mediated genome editing of A673 cells (Fig. 4, A and B, and fig. S6A) (36). This knock-in strategy allowed us to image fluorescently tagged endogenous EWS/FLI1 at its normal expression levels (Fig. 4B), which was essential because LCDs tend to self-aggregate and behave aberrantly upon overexpression. To ensure that Halo-tagging does not disrupt transactivation functions of EWS/FLI1, we confirmed that EWS/FLI1-Halo activates a luciferase reporter construct containing a GGAA microsatellite-driven promoter (33) as efficiently as wild-type (WT) EWS/FLI1 (fig. S6C). More importantly, using the gold standard neoplastic transformation assay (37), we confirmed that the EWS/FLI1-Halo knock-in A673 cells form colonies in soft agar much like the WT A673 cells—albeit, less efficiently (fig. S6, D and E).
We next performed high-resolution lattice light-sheet microscopy and found that EWS/FLI1 forms many small interaction hubs (>1000 per nucleus) in the nucleus (Fig. 4C and Movie 2). The detected number of intranuclear hubs has the same order of magnitude as the total number of EWS/FLI1-bound GGAA microsatellites across the human genome (~6000) estimated by chromatin immunoprecipitation sequencing and bioinformatics analyses (38). To examine the spatial relationship between EWS/FLI1 hubs and GGAA microsatellites, we performed simultaneous confocal imaging of EWS/FLI1-Halo and 3D DNA FISH targeting genes adjacent to GGAA microsatellites that are regulated by EWS/FLI1 (Fig. 4D), including CAV1, FCGRT, ABHD6, KDSR, and_KIAA1797_ (33, 39). Although EWS/FLI1 enrichment is detected at many single loci of these genes, the crowded distribution of intranuclear EWS/FLI1 hubs makes it difficult to clearly visualize EWS/FLI1 enrichment at single target loci. By recording images of ~1000 loci for each gene, the signal-to-noise ratio is markedly improved to reveal specific EWS/FLI1 enrichment at GGAA repeats, whereas no enrichment was seen at non-GGAA gene loci (Fig. 4E). These results indicate that EWS/FLI1 forms hubs at endogenous GGAA microsatellite DNA elements.
Dynamic EWS LCD-LCD interactions mediate formation of EWS/FLI1 hubs
We previously showed that because of LCD-LCD interactions, the LCD-LacI copy number in the LacO-associated hub increases much faster with the TF concentration than that of LacI alone, reaching levels that are orders of magnitude higher than the number of available TF binding sites at the LacO array (Fig. 1, C and D, and fig. S2, C to F). Using the methods established earlier, we estimated the intranuclear concentration of endogenously Halo-tagged EWS/FLI1 in A673 cells to be ~200 nM and the median copy number of EWS/FLI1 per hub at GGAA microsatellites to be 24 (fig. S7, A andB). It was reported that most EWS/FLI1-bound microsatellites contain 11 to 19 GGAA motifs, with a median around 15 (38). Because the DBD of FLI1 occupies two consecutive GGAA repeats (33), the median number of EWS/FLI1 molecules recruited to a microsatellite via direct DNA-protein interaction is estimated to be 8. The fact that there are a significantly greater number of EWS/FLI1 molecules in a GGAA-affiliated hub than what direct binding to GGAA repeats could accommodate suggests that, like the synthetic LacO arrays, these native genomic elements can also efficiently nucleate EWS LCD-LCD interactions to form local high-concentration TF hubs. Moreover, when transiently expressing EWS/FLI1-Halo or a Halo-tagged LCD deletion mutant (FLI1DBD) in U2OS cells, we again observe that the total number of EWS/FLI1 molecules in the GGAA-affiliated hubs increases much faster than FLI1 DBD as a function of TF concentration (fig. S7,C and D), providing strong evidence that LCD-LCD interactions occur at GGAA-affiliated EWS/FLI1 hubs.
We previously observed that the formation of an LCD interaction hub slows down dissociation of LCD-LacI from the LacO array (Fig. 1E and fig. S3F). If LCD-LCD interactions are also involved in EWS/FLI1 hub formation at GGAA microsatellites, we expect the RT of EWS/FLI1 within GGAA-affiliated hubs to be longer than that of EWS/FLI1 outside hubs. We stained the EWS/FLI1-Halo knock-in A673 cells with two fluorescent ligands (40,41): High-concentration JF549 staining allows visualization of EWS/FLI1 hubs in the cell nucleus, whereas low-concentration PA-JF646 staining allows real-time tracking of individual EWS/FLI1 molecules (Fig. 5A and Movie 3). SPT revealed the average RTs of EWS/FLI1 in and outside the GGAA-affiliated hubs to be 90 and 16 s, respectively (Fig. 5B and fig. S8, A and B). The fact that EWS/FLI1 binds to GGAA repeats for a significantly longer time again suggests that EWS LCD-LCD interactions are involved in the formation of the GGAA-affiliated hubs. It is very likely that both LCD-LCD interactions and DBD binding to GGAA repeats work together to stabilize hub formation, much as we observed for LCD-LacI at the LacO array.
Fig. 5. Dynamic LCD-LCD interactions occur at GGAA microsatellites, which stabilize EWS/FLI1 binding and drive its transactivation function.

(A) Snapshots of an SPT movie imaging endogenous EWS/FLI1-Halo labeled with two Halo ligands, JF549 (200 nM) and PA-JF646 (20 nM). We imaged the EWS/FLI1-Halo hubs in the JF549 channel (green) and tracked individual EWS/FLI1-Halo molecules in and outside the hubs in the PA-JF646 channel (red).
(B) Residence times of EWS/FLI1 bound in hubs are longer than its residence times outside hubs, as determined by SPT (**P< 0.01, two-sample t test). Error bars represent SE. (C) EWS LCD is enriched at LacO array 1 bound by EWS LCD-LacI, but EWS(YS29) LCD is not recruited to the array by EWS(YS29) LCD-LacI. However, EWS(YF29) LCD is recruited to the array by EWS(YF29) LCD-LacI. (D) (Top) Schematic of proteins transiently expressed in EWS/FLI1KO A673 cells: Halo-tagged EWS/FLI1, EWS(YS)/FLI1, or FLI1 DBD. (Bottom) Residence times of EWS/FLI1 and its variants binding in and outside their hubs, as determined by SPT. *P< 0.05, two-sample t test. Error bars represent SE. (E) Snapshots of an SPT movie simultaneously imaging SNAPf-tagged EWS/FLI1 (200 nM JF549 labeled, green) and Halo-tagged EWS or EWS(YS) LCD (20 nM PA-JF646 labeled, red) in EWS/FLI1 KO A673 cells. Individual LCD-Halo molecules were tracked with the strategy described in (A). (F) Residence times of EWS bound at EWS/FLI1 hubs are longer than for EWS(YS) LCD, as determined by SPT (*P < 0.05, two-sample t test). Error bars represent SE. (G) Luciferase assay shows that EWS/FLI1 but not EWS(YS)/FLI1 or FLI1 DBD transactivates a GGAA microsatellite-driven reporter (**P < 0.01, two-sample t test). Error bars represent SE. (H) RT-qPCR shows down-regulation of GGAA microsatellite-associated EWS/FLI1 target genes in A673 cells upon EWS/FLI1 KO. Stable expression of exogeneous (Exo) EWS/FLI1, but not of the mutant EWS(YS)/FLI1, rescues the expression defect in EWS/FLI1 KO A673 cells. For each target gene, the mRNA level was normalized using five different invariant genes (fig. S10A) and graphed as a fold change relative to the mRNA level present in the WT A673 line (set to 1). *P < 0.05, two-sample _t_test. NS, not statistically significant. Error bars represent SD.
To confirm that hub formation in this native setting is dependent on the EWS LCD, we determined how mutations in the LCD might affect RTs of EWS/FLI1. We started by replacing different numbers (m = 3, 7, 10, 17, or29) of tyrosines (Y) in the EWS LCD (residues 47 to 266 of EWSR1) with serines (S) and then testing the self-interaction capability of mutant LCDs [EWS (YSm)] using the LacO array assay established earlier. As previously shown, when we coexpressed EYFP-EWS-LacI and mCherry-EWS, the mCherry signal became enriched at the LacO array owing to EWS LCD self-interaction. Notably, when we replaced WT EWS in both fusion proteins with EWS(YSm), mCherry enrichment at the array progressively decreased with an increasing number of Y-to-S mutations (fig. S9A) and vanished for EWS(YS29), in which all tyrosines are replaced (Fig. 5C). Similarly, we found that EWS(YS29) does not interact with WT EWS (fig. S9, B andC). By contrast, a mutant replacing all 29 tyrosines with phenylalanine (F) [EWS(YF29)] retains hub formation activity with itself and with WT EWS (Fig. 5C and fig. S9D), suggesting that aromatic amino acids and hydrophobic contacts represent major drivers of EWS LCD-LCD interactions. The conformational disorder, proline residues, and acidic amino acids of the EWS LCD might play a role in keeping these key hydrophobic residues exposed to solvent and potential binding partners without being sequestered in a collapsed state (42).
Next, we probed the effects of mutations that disrupt LCD hub formation on RTs of EWS/FLI1. To examine behaviors of EWS/FLI1 variants in A673 cells without interference of endogenous EWS/FLI1, we generated an EWS/FLI1 knockout A673 line using CRISPR-Cas9-mediated genome editing (Fig. 4B and fig. S6B) and verified that transiently and moderately reexpressed EWS/FLI1-Halo in the knockout line exhibited binding dynamics comparable to that of endogenous EWS/FLI1-Halo (Fig. 5, B and D, and fig. S8C). We then transiently expressed similar levels of FLI1 DBD-Halo or a Halo-tagged 37-residue Y-to-S mutant [EWS(YS)/FLI1]. Both mutants still displayed some hubs in the nucleus, but the hubs are considerably diminished. SPT revealed that the in-hub RTs of the mutants become significantly reduced (by 51 to 65%) relative to those of WT EWS/FLI1, whereas their outsidehub RTs remain largely unchanged (Fig. 5D). Together, these results confirm that LCD-LCD interactions drive the formation of EWS hubs at GGAA microsatellites.
To measure the dynamics of just the protein-protein interactions occurring within the EWS LCD hubs, we transiently expressed SNAPf-tagged EWS/FLI1 and Halo-tagged EWS in the EWS/FLI1 knockout line and labeled both fusion proteins using fluorescent ligands with distinct emission spectra (40, 41). Whereas EWS/FLI1-SNAPf forms hubs at GGAA microsatellites via protein-DNA binding, EWS LCD-Halo, which does not interact with DNA, binds to EWS/FLI1 hubs only via protein-protein interactions. We visualized EWS/FLI1 hubs and simultaneously tracked individual EWS LCD molecules that bind to the hubs (Fig. 5E). SPT revealed the average RT of EWS LCD in EWS/FLI1 hubs to be 16 s, which suggests that LCD-LCD interactions are highly dynamic (Fig. 5F). As expected, the mutant EWS(YS) LCD has a significantly shorter RT (~7 s) at EWS/FLI1 hubs, consistent with its diminished interaction with the EWS LCD.
EWS LCD-LCD interactions are essential for transcription and transformation functions of EWS/FLI1
Finally, we tested whether LCD-LCD interactions influence EWS/FLI1 functions. We found that whereas EWS/FLI1 efficiently induces gene activation at a GGAA microsatellite in a luciferase assay, the mutant EWS(YS)/FLI1 and FLI1 DBD do not (Fig. 5G). We further engineered the EWS/FLI1 knockout A673 line to stably express EWS/FLI1 or EWS(YS)/FLI1 and performed reverse transcription quantitative polymerase chain reaction (RT-qPCR) to measure the expression levels of GGAA microsatellite-associated EWS/FLI1 target genes. As expected, we found that expression of EWS/FLI1, but not EWS(YS)/FLI1, specifically rescues the gene expression defect in the knockout line, indicating that EWS LCD-LCD interactions are required for transactivation (Fig. 5H and fig. S10A). Moreover, the knockout line stably expressing EWS/FLI1, but not EWS(YS)/FLI1, forms colonies in soft agar like WT A673 cells (fig. S10B). This demonstrates that EWS LCD-LCD interactions are required for oncogenic transformation. Taken together with previously published RT-qPCR and RNA sequencing data in mesenchymal stem cells showing the important role of EWS LCD in inducing expression of GGAA microsatellite-associated genes (43), our results suggest that the formation of EWS LCD-dependent hubs is essential for EWS/FLI1 to activate transcription of these target genes and drive oncogenic gene expression programs in Ewing’s sarcoma.
Discussion
DNA binding TFs are key regulators of eukaryotic gene expression. Early studies of TFs revealed their well-structured DBDs and identified functionally critical activation domains (ADs) required for transcription. It later became evident that many transactivation sequences contain intrinsically disordered LCDs, but how they mediate transactivation remained unclear. Despite the composition of LCDs and their generally unstructured nature, ADs must interact with specific binding partners to activate transcription. However, it has been challenging if not impossible to directly measure selective LCD-mediated target recognition by ADs in vivo. Two other key aspects of transcriptional control mechanisms have also remained largely uncharted: What is the nature of the protein-protein transactions that drive gene activation, and how stable or dynamic are these critical interactions in living cells?
We addressed these problems by employing single-molecule imaging to visualize LCD-LCD interactions in live cells. Our findings indicate that TF-TF interactions are extremely transient, with RTs of 5 to 20 s and rarely longer than 1 min. These studies lead us to propose that transactivation domains function by forming transient local regions of high TF concentrations or “hubs” (sometimes also referred to as clusters) via dynamic, multivalent, and sequence-specific LCD-LCD interactions. A key future endeavor will be to unlock the biochemical and structural basis for selective LCD-LCD interactions. Such selectivity is likely essential to implement the complex combinatorial logic of transcriptional regulation.
Recent advances in live-cell single-molecule imaging have not only opened a new frontier for studying transcription in vivo but have also provided an opportunity to gain greater insight into the nature and behavior of LCDs and their propensity to remain largely as intrinsically disordered peptide sequences. By deploying high-resolution single-molecule imaging of TF LCD interactions in live cells, our studies offer a powerful complement to pioneering in vitro studies that provided the first clues about LCD interactions (10). Importantly, to the extent that one can make comparisons between hydrogels and intracellular LCD hub formation, many aspects of FET-LCD function uncovered in vitro are borne out within live cells. For example, the behavior of LCDs upon mutations, disruption by hexanediols, and interaction with RNA Pol II observed in vivo are generally consistent with the role of LCDs proposed on the basis of in vitro assays. In addition, single-molecule live-cell imaging revealed several new aspects of LCD-driven interactions. Most notable are the fast dynamics and sequence specificity of LCD interactions as they form transient local high-concentration hubs that drive transactivation (Fig. 6). We were also intrigued by the formation of LCD-dependent hubs throughout the nucleoplasm that are not associated with cognate genomic DNA. These LCD interaction-driven puncta, which display a capacity to interact with RNA Pol II, sensitivity to 1,6-HD, and fast dynamics (recovery times of 7 to 10 s), may provide an opportunity in future studies to further probe mechanisms governing LCD-LCD-mediated hub formation and transactivation.
Fig. 6. A model for functional LCD-LCD interactions in vivo: From hubs to phase separation.

(A) Dynamic and sequence-specific LCD-LCD interactions drive hub formation in live cells. (B) LCD-dependent transactivation occurs in hubs formed over a broad range of TF concentrations. At endogenous concentrations, TF LCDs form transactivation hubs at native genomic loci without undergoing evident phase separation. Upon TF LCD overexpression, phase separation is observed at synthetic TF binding site arrays.
To analyze the behavior of LCD-LCD interactions in live cells, we exploited the advantages of various imaging platforms and developed two distinct in vivo cell-based assays: one involving large synthetic TF binding site (LacO) arrays and the other targeting endogenous GGAA microsatellite regulatory elements in the human genome. When used in combination, the two assays afford powerful and complementary platforms for probing the properties of TF LCD interactions in the live-cell context. The highly reiterated LacO binding sites can serve as a useful cell-based assay system capable of nucleating local high-concentration hubs in vivo for any protein domain or LCD of interest through LacO-LacI mediated binding. These arrays can be readily detected by fluorescence imaging with a high signal-to-noise ratio and allow flexibility in probing various interaction properties of LCDs while offering a convenient alternative to various in vitro assays such as hydrogel polymerization and droplet formation for studying gelation and phase separation of intrinsically disordered proteins, two processes that are likely coupled with each other under certain physiological settings (44).
Our studies were not designed to address the structure and nature of LCD-driven phase separated compartments, but under certain overexpression conditions we detected what appears to be liquid-liquid phase separation (i.e., spherical shape and local changes in refractive index). Although we can detect apparent liquid-liquid phase separation with gross overexpression of LCDs, we did not obtain evidence for phase separation of TF hubs (i.e., EWS/FLI1) formed at endogenous expression levels. However, transactivation by TF LCD hubs is observed at endogenous TF levels at native chromosomal loci in the absence of detectable phase separation. Given the transience of LCD-LCD interactions and our direct measurements of TF concentrations in the nucleus and within hubs, we surmise that LCD-dependent transactivation can occur in hubs formed over a broad range of TF concentrations (100 nM to 100 mM) and time scales—from extremely brief specific and nonspecific LCD-LCD and TF-DNA binding events (0.1 to 1 s) to assembly of relatively stable hubs (minutes) driven by specific, multivalent interactions. Both the composition and diversity of LCDs in hubs and their interaction specificity could influence the range of their operational concentrations and their potential for phase separation and/or polymer formation. New insights regarding the rapid binding dynamics and functional importance of TF LCDs (i.e., LCD-dependent oncogenic potential of EWS/FLI1) suggest that understanding these mechanisms may also inform our ability to develop strategies to modulate gene expression in the context of disease. Given the transient interactions exhibited by TFs and the critical role of gene dysregulation in disease (i.e., EWS/FLI1 in Ewing’s sarcoma), our findings offer the potential to develop single-molecule imaging platforms to screen drugs targeting gene regulatory pathways. In particular, we imagine that moderate- to high-throughput screens for gene expression inhibitors or activators based on high-resolution single-cell and single-molecule imaging could provide a strategy to probe large sectors of the proteome that have resisted traditional in vitro and cell-based screens for small molecules. With new classes of chemicals, natural products, or peptidomimetic libraries, it may even be possible to eventually target LCDs that are the key drivers of regulatory protein-protein interactions and hub formation involved in gene activation and potentially many other biomolecular interactions implicated in disease. Finally, although we examined only a small subset of TF LCDs, the fundamental principles that we have uncovered about the rapid dynamics and hub mechanisms driving LCD-LCD interactions may be applicable to other classes of regulatory proteins and biomolecular interactions occurring in a variety of cell types.
Materials and methods summary
The number of LacO repeats in the LacO arrays was determined by RT-qPCR. FCS and fluorescence intensity measurement were performed on fluorescently labeled TFs in live cells. By comparing the results with standard concentration curves of a purified fluorescent tag, the TF nuclear concentration and its copy number at hubs were determined. FRAP and SPT were performed to measure interaction dynamics between various TFs and their target genomic loci and to examine how LCD-LCD interactions affect TF-DNA interaction dynamics. SPT was also used to determine LCD-LCD interaction dynamics. Two-color confocal fluorescence imaging was used to examine interactions between different classes of LCDs and between LCD hubs and RNA Pol II.
CRISPR-Cas9-mediated genome editing was performed to label the endogenous EWS/FLI1 in A673 cells with a HaloTag or to knock out the protein, allowing fluorescence imaging or functional studies of EWS/FLI1. Luciferase and soft agar colony formation assays were used to verify the functions of EWS/FLI1-Halo. Lattice light-sheet microscopy was used to visualize intranuclear hubs of the endogenous EWS/FLI1-Halo. Simultaneous confocal imaging of EWS/FLI1-Halo and 3D DNA FISH were performed to examine the spatial relationship between hubs of endogenous EWS/FLI1 and GGAA microsatellites. Luciferase, RT-qPCR, and soft agar colony formation assays were used to examine the effects of Y-to-S mutations on the transactivation and transformation functions of EWS/FLI1. Detailed descriptions for all materials and methods are provided in the supplementary materials.
Supplementary Material
Chong Supplements
supplemental movie 1
supplemental movie 2
supplemental movie 3
ACKNOWLEDGMENTS
We thank S. Lessnick, S. McKnight, and M. Kato for discussions and providing reagents; Q. Gan and A. Hansen for providing codes to analyze imaging data; J. Bosco and P. Sharma for help with molecular cloning; K. Heydari and the CRL Flow Cytometry Facility for assistance with flow cytometry; the CRL Molecular Imaging Center for providing access to confocal fluorescence microscopes; and J. Goodrich, G. S. Martin, and members of Tjian and Darzacq labs for critical reading of the manuscript.
Funding: This work was supported by California Institute of Regenerative Medicine grant LA1-08013 (to X.D.), NIH grants UO1-EB021236 and U54-DK107980 (to X.D.), and the Howard Hughes Medical Institute (to Z.L., L.L., and R.T.).
Footnotes
Competing interests: L.L. has filed a patent and patent applications (e.g., U.S. Patent 9,933,417) covering azetidine-containing fluorophores such as JF549.
REFERENCES AND NOTES
- 1.Kadonaga JT, Courey AJ, Ladika J, Tjian R, Distinct regions of Sp1 modulate DNA binding and transcriptional activation. Science 242, 1566–1570 (1988). doi: 10.1126/science.3059495 [DOI] [PubMed] [Google Scholar]
- 2.Courey AJ, Tjian R, Analysis of Sp1 in vivo reveals multiple transcriptional domains, including a novel glutamine-rich activation motif. Cell 55, 887–898 (1988). doi: 10.1016/0092-8674(88)90144-4 [DOI] [PubMed] [Google Scholar]
- 3.Su W, Jackson S, Tjian R, Echols H, DNA looping between sites for transcriptional activation: Self-association of DNA-bound Sp1. Genes Dev. 5, 820–826 (1991). doi: 10.1101/gad.5.5.820 [DOI] [PubMed] [Google Scholar]
- 4.Friedman MJ et al. , Polyglutamine domain modulates the TBP-TFIIB interaction: Implications for its normal function and neurodegeneration. Nat. Neurosci. 10, 1519–1528 (2007). doi: 10.1038/nn2011 [DOI] [PubMed] [Google Scholar]
- 5.Kovar H, Jekyll Dr.and Hyde Mr.: The Two Faces of the FUS/EWS/TAF15 Protein Family. Sarcoma 2011, 837474 (2011). doi: 10.1155/2011/837474 [DOI] [PMC free article] [PubMed] [Google Scholar]
- 6.Kato M et al. , Cell-free formation of RNA granules: Low complexity sequence domains form dynamic fibers within hydrogels. Cell 149, 753–767 (2012). doi: 10.1016/j.cell.2012.04.017 [DOI] [PMC free article] [PubMed] [Google Scholar]
- 7.Patel A et al. , A Liquid-to-Solid Phase Transition of the ALS Protein FUS Accelerated by Disease Mutation. Cell 162, 1066–1077 (2015). doi: 10.1016/j.cell.2015.07.047 [DOI] [PubMed] [Google Scholar]
- 8.Burke KA, Janke AM, Rhine CL, Fawzi NL, Residue-by-Residue View of In Vitro FUS Granules that Bind the C-Terminal Domain of RNA Polymerase II. Mol. Cell 60, 231–241 (2015). doi: 10.1016/j.molcel.2015.09.006 [DOI] [PMC free article] [PubMed] [Google Scholar]
- 9.Boehning M et al. , RNA polymerase II clustering through CTD phase separation. bioRxiv 316372 [Preprint]. 7 May 2018. doi: 10.1101/316372 [DOI] [Google Scholar]
- 10.Kwon I et al. , Phosphorylation-regulated binding of RNA polymerase II to fibrous polymers of low-complexity domains. Cell 155, 1049–1060 (2013). doi: 10.1016/j.cell.2013.10.033 [DOI] [PMC free article] [PubMed] [Google Scholar]
- 11.Altmeyer M et al. , Liquid demixing of intrinsically disordered proteins is seeded by poly(ADP-ribose). Nat. Commun 6, 8088 (2015). doi: 10.1038/ncomms9088 [DOI] [PMC free article] [PubMed] [Google Scholar]
- 12.Xiang S et al. , The LC Domain of hnRNPA2 Adopts Similar Conformations in Hydrogel Polymers, Liquid-like Droplets, and Nuclei. Cell 163, 829–839 (2015). doi: 10.1016/j.cell.2015.10.040 [DOI] [PMC free article] [PubMed] [Google Scholar]
- 13.Murray DT et al. , Structure of FUS Protein Fibrils and Its Relevance to Self-Assembly and Phase Separation of Low-Complexity Domains. Cell 171, 615–627 (2017). doi: 10.1016/j.cell.2017.08.048 [DOI] [PMC free article] [PubMed] [Google Scholar]
- 14.Lin Y, Protter DS, Rosen MK, Parker R, Formation and Maturation of Phase-Separated Liquid Droplets by RNA-Binding Proteins. Mol. Cell 60, 208–219 (2015). doi: 10.1016/j.molcel.2015.08.018 [DOI] [PMC free article] [PubMed] [Google Scholar]
- 15.Elbaum-Garfinkle S et al. , The disordered P granule protein LAF-1 drives phase separation into droplets with tunable viscosity and dynamics. Proc. Natl. Acad. Sci. U.S.A. 112, 7189–7194 (2015). doi: 10.1073/pnas.1504822112 [DOI] [PMC free article] [PubMed] [Google Scholar]
- 16.Nott TJ et al. , Phase transition of a disordered nuage protein generates environmentally responsive membraneless organelles. Mol. Cell 57, 936–947 (2015). doi: 10.1016/j.molcel.2015.01.013 [DOI] [PMC free article] [PubMed] [Google Scholar]
- 17.Molliex A et al. , Phase separation by low complexity domains promotes stress granule assembly and drives pathological fibrillization. Cell 163, 123–133 (2015). doi: 10.1016/j.cell.2015.09.015 [DOI] [PMC free article] [PubMed] [Google Scholar]
- 18.Elson EL, Magde D, Fluorescence correlation spectroscopy. I. Conceptual basis and theory. Biopolymers 13, 1–27 (1974). doi: 10.1002/bip.1974.360130102 [DOI] [PubMed] [Google Scholar]
- 19.Youker RT, Teng H, Measuring protein dynamics in live cells: Protocols and practical considerations for fluorescence fluctuation microscopy. J. Biomed. Opt. 19, 090801 (2014). doi: 10.1117/1.JB0.19.9.090801 [DOI] [PMC free article] [PubMed] [Google Scholar]
- 20.Sprague BL, McNally JG, FRAP analysis of binding: Proper and fitting. Trends Cell Biol. 15, 84–91 (2005). doi: 10.1016/j.tcb.2004.12.001 [DOI] [PubMed] [Google Scholar]
- 21.Chen BC et al. , Lattice light-sheet microscopy: Imaging molecules to embryos at high spatiotemporal resolution. Science 346, 1257998 (2014). doi: 10.1126/science.1257998 [DOI] [PMC free article] [PubMed] [Google Scholar]
- 22.Solovei I, Cremer M, 3D-FISH on cultured cells combined with immunostaining. Methods Mol. Biol 659, 117–126 (2010). doi: 10.1007/978-1-60761-789-1_8 [DOI] [PubMed] [Google Scholar]
- 23.Chen J et al. , Single-molecule dynamics of enhanceosome assembly in embryonic stem cells. Cell 156, 1274–1285 (2014). doi: 10.1016/j.cell.2014.01.062 [DOI] [PMC free article] [PubMed] [Google Scholar]
- 24.Hansen AS, Pustova I, Cattoglio C, Tjian R, Darzacq X, CTCF and cohesin regulate chromatin loop stability with distinct dynamics. eLife 6, e25776 (2017). doi: 10.7554/eLife.25776 [DOI] [PMC free article] [PubMed] [Google Scholar]
- 25.Janicki SM et al. , From silencing to gene expression: Real-time analysis in single cells. Cell 116, 683–698 (2004). doi: 10.1016/S0092-8674(04)00171-0 [DOI] [PMC free article] [PubMed] [Google Scholar]
- 26.Sprague BL, Pego RL, Stavreva DA, McNally JG, Analysis of binding reactions by fluorescence recovery after photobleaching. Biophys. J 86, 3473–3495 (2004). doi: 10.1529/biophysj.103.026765 [DOI] [PMC free article] [PubMed] [Google Scholar]
- 27.Darzacq X et al. , In vivo dynamics of RNA polymerase II transcription. Nat. Struct. Mol. Biol 14, 796–806 (2007). doi: 10.1038/nsmb1280 [DOI] [PMC free article] [PubMed] [Google Scholar]
- 28.Lin Y et al. , Toxic PR Poly-Dipeptides Encoded by the C9orf72 Repeat Expansion Target LC Domain Polymers. Cell 167, 789–802 (2016). doi: 10.1016/j.cell.2016.10.003 [DOI] [PMC free article] [PubMed] [Google Scholar]
- 29.Strom AR et al. , Phase separation drives heterochromatin domain formation. Nature 547, 241–245 (2017). doi: 10.1038/nature22989 [DOI] [PMC free article] [PubMed] [Google Scholar]
- 30.Rog O, Köhler S, Dernburg AF, The synaptonemal complex has liquid crystalline properties and spatially regulates meiotic recombination factors. eLife 6, e21455 (2017). doi: 10.7554/eLife.21455 [DOI] [PMC free article] [PubMed] [Google Scholar]
- 31.Gill G, Pascal E, Tseng ZH, Tjian R, A glutamine-rich hydrophobic patch in transcription factor Sp1 contacts the dTAFII110 component of the Drosophila TFIID complex and mediates transcriptional activation. Proc. Natl. Acad. Sci. U.S.A 91, 192–196 (1994). doi: 10.1073/pnas.91.1.192 [DOI] [PMC free article] [PubMed] [Google Scholar]
- 32.Martinez-Ramirez A et al. , Characterization of the A673 cell line (Ewing tumor) by molecular cytogenetic techniques. Cancer Genet. Cytogenet 141, 138–142 (2003). doi: 10.1016/S0165-4608(02)00670-2 [DOI] [PubMed] [Google Scholar]
- 33.Gangwal K et al. , Microsatellites as EWS/FLI response elements in Ewing’s sarcoma. Proc. Natl. Acad. Sci. U.S.A 105, 10149–10154 (2008). doi: 10.1073/pnas.0801073105 [DOI] [PMC free article] [PubMed] [Google Scholar]
- 34.Lessnick SL, Ladanyi M, Molecular pathogenesis of Ewing sarcoma: New therapeutic and transcriptional targets. Annu. Rev. Pathol 7, 145–159 (2012). doi: 10.1146/annurev-pathol-011110-130237 [DOI] [PMC free article] [PubMed] [Google Scholar]
- 35.Johnson KM et al. , Role for the EWS domain of EWS/FLI in binding GGAA-microsatellites required for Ewing sarcoma anchorage independent growth. Proc. Natl. Acad. Sci. U.S.A 114, 9870–9875 (2017). doi: 10.1073/pnas.1701872114 [DOI] [PMC free article] [PubMed] [Google Scholar]
- 36.Ran FA et al. , Genome engineering using the CRISPR-Cas9 system. Nat. Protoc 8, 2281–2308 (2013). doi: 10.1038/nprot.2013.143 [DOI] [PMC free article] [PubMed] [Google Scholar]
- 37.Lessnick SL, Dacwag CS, Golub TR, The Ewing’s sarcoma oncoprotein EWS/FLI induces a p53-dependent growth arrest in primary human fibroblasts. Cancer Cell 1, 393–401 (2002). doi: 10.1016/S1535-6108(02)00056-9 [DOI] [PubMed] [Google Scholar]
- 38.Johnson KM, Taslim C, Saund RS, Lessnick SL, Identification of two types of GGAA-microsatellites and their roles in EWS/FLI binding and gene regulation in Ewing sarcoma. PLOS ONE 12, e0186275 (2017). doi: 10.1371/journal.pone.0186275 [DOI] [PMC free article] [PubMed] [Google Scholar]
- 39.Guillon N et al. , The oncogenic EWS-FLI1 protein binds in vivo GGAA microsatellite sequences with potential transcriptional activation function. PLOS ONE 4, e4932 (2009). doi: 10.1371/journal.pone.0004932 [DOI] [PMC free article] [PubMed] [Google Scholar]
- 40.Grimm JB et al. , A general method to improve fluorophores for live-cell and single-molecule microscopy. Nat. Methods 12, 244–250 (2015). doi: 10.1038/nmeth.3256 [DOI] [PMC free article] [PubMed] [Google Scholar]
- 41.Grimm JB et al. , Bright photoactivatable fluorophores for single-molecule imaging. Nat. Methods 13, 985–988 (2016). doi: 10.1038/nmeth.4034 [DOI] [PubMed] [Google Scholar]
- 42.Staller MV et al. , A High-Throughput Mutational Scan of an Intrinsically Disordered Acidic Transcriptional Activation Domain. Cell Syst. 6, 444–455 (2018). doi: 10.1016/j.cels.2018.01.015 [DOI] [PMC free article] [PubMed] [Google Scholar]
- 43.Boulay G et al. , Cancer-Specific Retargeting of BAF Complexes by a Prion-like Domain. Cell 171, 163–178 (2017). doi: 10.1016/j.cell.2017.07.036 [DOI] [PMC free article] [PubMed] [Google Scholar]
- 44.Harmon TS, Holehouse AS, Rosen MK, Pappu RV, Intrinsically disordered linkers determine the interplay between phase separation and gelation in multivalent proteins. eLife 6, e30294 (2017). doi: 10.7554/eLife.30294 [DOI] [PMC free article] [PubMed] [Google Scholar]
- 45.Efron B, Tibshirani R, An Introduction to the Bootstrap (Chapman & Hall, CRC Press, 1993). [Google Scholar]
Associated Data
This section collects any data citations, data availability statements, or supplementary materials included in this article.
Supplementary Materials
Chong Supplements
supplemental movie 1
supplemental movie 2
supplemental movie 3