Ventricular tachycardia storm management in a COVID-19 patient: a case report (original) (raw)
Abstract
Background
Coronavirus disease 2019 (COVID-19) has been associated with myocardial involvement. Among cardiovascular manifestations, cardiac arrhythmias seem to be fairly common, although no specifics are reported in the literature. An increased risk of malignant ventricular arrhythmias and electrical storm (ES) has to be considered.
Case summary
We describe a 68-year-old patient with a previous history of coronary artery disease and severe left ventricular systolic disfunction, who presented to our emergency department describing cough, dizziness, fever, and shortness of breath. She was diagnosed with COVID-19 pneumonia, confirmed after three nasopharyngeal swabs. Ventricular tachycardia (VT) storm with multiple implantable cardioverter defibrillator (ICD) shocks was the presenting manifestation of cardiac involvement during the COVID-19 clinical course. A substrate-based VT catheter ablation procedure was successfully accomplished using a remote navigation system. The patient recovered from COVID-19 and did not experience further ICD interventions.
Discussion
To date, COVID-19 pneumonia associated with a VT storm as the main manifestation of cardiac involvement has never been reported. This case highlights the role of COVID-19 in precipitating ventricular arrhythmias in patients with ischaemic cardiomyopathy who were previously stable.
Keywords: COVID-19, Arrhythmic storm, Ventricular tachycardia, Catheter ablation, Case report
Learning points
- COVID-19 can precipitate ventricular arrhythmias (VAs) in patients with ischaemic cardiomyopathy who were previously stable, even in the absence of overt myocardial injury and raised cardiac enzymes.
- Ventricular tachycardia storm in COVID-19 patients should be managed according to guidelines on VAs and, when catheter ablation is recommended, it should be performed preferably with a remote navigation system, also in order to minimize the infectious risk of the staff of the electrophysiology laboratory.
- The role of SARS-CoV-2 infection in triggering ventricular arrhythmias may be related to cytokine storms and intracellular calcium overload, but specific efforts should be made to understand mechanisms linking life-threatening arrhythmias and COVID-19.
Introduction
In December 2019, an outbreak of an emerging disease, named coronavirus disease (COVID-19), occurred in Wuhan, China, due to a novel coronavirus (later named severe acute respiratory syndrome coronavirus 2, SARS-CoV-2),1 and was declared a global pandemic in early March 2020. The clinical course of SARS-CoV-2 infection is mostly characterized by respiratory tract involvement, potentially leading to pneumonia and SARS, but it has also been associated with myocardial involvement and with arrhythmic events in a non-negligible number of patients.1–4 Therefore, an increased risk of malignant ventricular arrhythmias (VAs) and electrical storm (ES) has to be considered. While it is established that ES is more likely to occur in patients with severe left ventricular (LV) dysfunction and coronary artery disease (CAD), evident triggers cannot always be identified.5,6 Electrolyte imbalance (such as hypokalaemia), worsening heart failure, myocardial infarction (MI), adrenergic hyperactivity, hyperthyroidism, and sepsis have to be considered in the initial evaluation of patients with ES.6–11 To date, evidence linking SARS-CoV-2 infection and ventricular tachycardia (VT) storm are lacking.
Timeline
| 20 days before admission | Symptom onset (cough and dizziness). |
|---|---|
| 6 days before admission | Persistent fever unresponsive to antipyretic drugs and gradually worsening shortness of breath. |
| Admission | Diagnosis of pneumonia, suspected for coronavirus disease (COVID-19), with two real-time reverse transcription–polymerase chain reaction (RT–PCR) assays on nasopharyngeal swabs negative for SARS-CoV-2 infection. |
| Day 1–7 | Non-invasive ventilation and antibiotic therapy. |
| Day 8 | Electrical storm due to sustained episodes of ventricular tachycardia (VT) in absence of acute cardiac precipitating factors. Device detection of sustained and non-sustained VT episodes, started from the onset of COVID-19-related symptoms. |
| Day 9 | Substrate-based VT catheter ablation targeting local abnormal ventricular activity (LAVA) with a remote magnetic navigation system. |
| Days 10–14 | Absence of VT recurrence. Third nasopharyngeal swab positive for SARS-CoV-2 infection. Resolution of COVID-19 pneumonia. |
| Day 15 | Discharge in home isolation. |
| Two months after discharge | Absence of ICD shocks. |
Case presentation
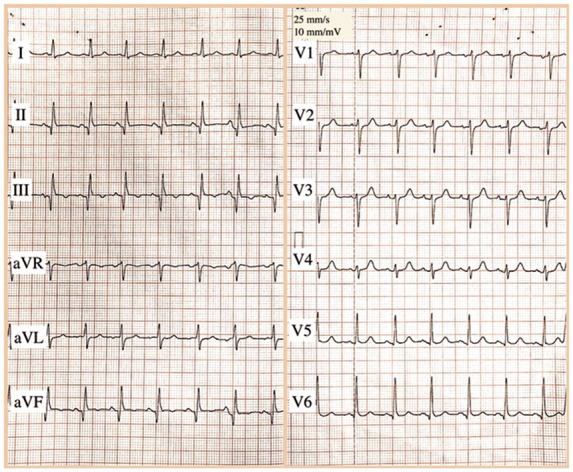
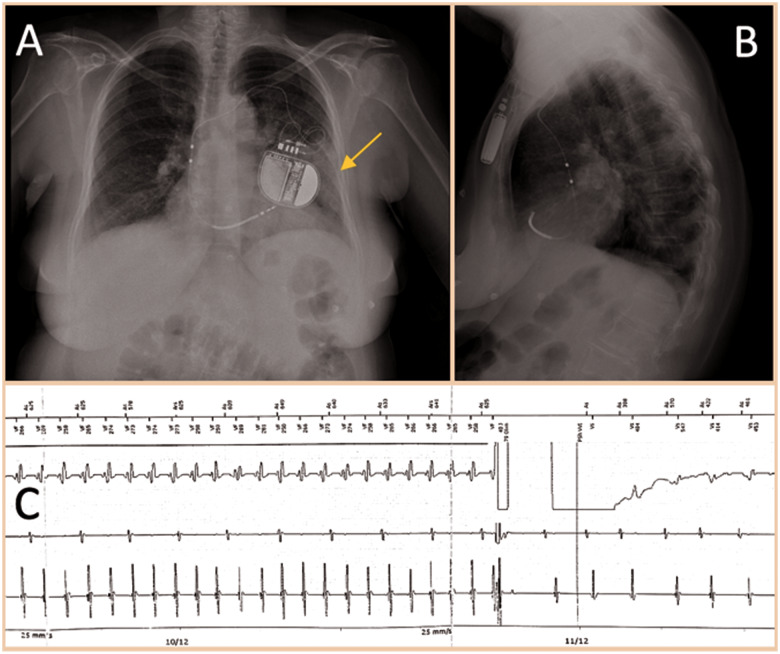
A 68-year-old Caucasian woman presented to our emergency department at the end of February 2020 with cough and dizziness for the past 20 days and persistent fever unresponsive to antipyretic drugs for the past 6 days, associated with worsening shortness of breath. Her past medical history included a prior inferolateral ST-segment elevation myocardial infarction (STEMI) in 2014. Due to the persistence of severe left ventricular (LV) dysfunction [LV ejection fraction (EF) 34%], she was implanted with a single-chamber implantable cardioverter defibrillator (ICD) for primary prevention of sudden cardiac death 3 months later. Follow-up was uneventful and she never experienced ICD interventions. Her medical therapy on admission was metoprolol 100 mg b.i.d., ramipril 5 mg/day, spironolactone 25 mg/day, rosuvastatin 10 mg/day, cardioaspirin 100 mg/day, and rabeprazole 20 mg/day. Her cardiovascular examination was unremarkable, while lung auscultation revealed left basal crackles. A 12-lead electrocardiogram (ECG) showed sinus rhythm with signs of inferior MI (Figure 1). Laboratory tests were within the normal range, except for C-reactive protein (CRP) (27.6 mg/L, reference range <1.0 mg/L). Arterial blood gas analysis revealed oxygen partial pressure of 67 mmHg and oxygen saturation of 94%. Two real-time reverse transcription–polymerase chain reaction (RT–PCR) assays on nasopharyngeal swabs resulted negative for SARS-CoV-2. A chest radiograph demonstrated a consolidation in the left inferior lobe, suggestive for pneumonia (Figure 2A and B). Non-invasive ventilation and antibiotic therapy were started.
Figure 1.

The 12-lead electrocardiogram (ECG) on admission. Sinus rhythm at a rate of 100 b.p.m. with Q waves and negative T waves in the inferior leads.
Figure 2.
Chest radiograph with left pulmonary consolidation (arrow) in the left inferior lobe, suggestive for pneumonia. Anterior–posterior view (A) and lateral view (B). Electrogram with sustained ventricular tachycardia interrupted by DC shock (C).
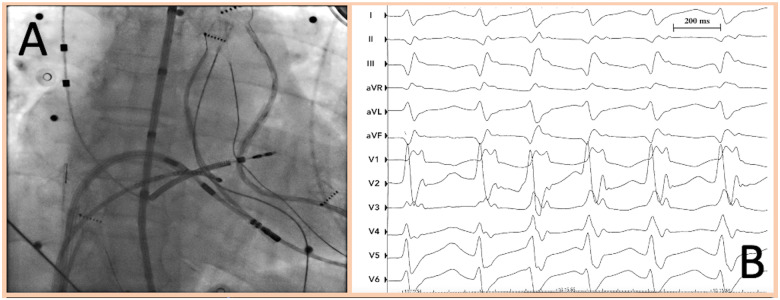
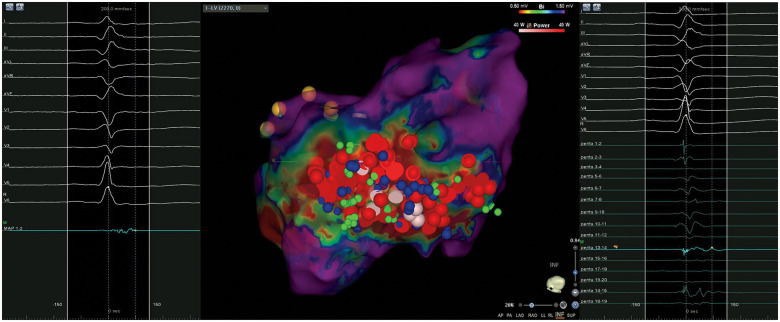
During her hospital stay, the patient had multiple episodes of sustained VT treated with ICD shocks (Figure 2C). Device interrogation detected frequent VA episodes over the past 20 days, self-terminating or successfully interrupted with antitachycardia pacing (ATP). ES (12 VT episodes within 24 h) persisted despite intravenous infusion of beta-blockers (metoprolol), amiodarone, and deep sedation. A transthoracic echocardiogram showed mid-range LV dysfunction (LVEF 37%) and excluded the presence of LV thrombi. According to European guidelines,12 catheter ablation was performed under deep sedation the day after, with the patient afebrile and mainly in sinus rhythm, with persistence of sporadic non-sustained VT episodes (Figure 3A and B). Three different ultrasound-guided venous accesses were obtained: two in the right femoral vein and one in the left femoral vein. A 10-pole catheter (DecaNav, Biosense Webster, Inc., Diamond Bar, CA, USA) was placed in the coronary sinus, and an ultrasound imaging catheter (intracardiac echocardiography, ICE, Acu-Nav, Acuson, Mountain View, CA, USA) was advanced in the mid-right atrium, to guide transseptal puncture. The electroanatomic CARTO3 mapping system (Biosense Webster, Inc., CA, USA) was used to map the left ventricle in sinus rhythm with a Pentaray catheter (Biosense Webster). The bipolar voltage map showed a large ischaemic scar in the inferolateral LV wall. A substrate-based ablation targeting local abnormal ventricular activity (LAVA) was performed with a 3.5 mm tip magnetic irrigated radiofrequency catheter (Navistar® RMT Thermocool, Biosense Webster) and with a remote magnetic navigation system (Niobe™, Stereotaxis, Inc., St. Louis, MO, USA) (Figure 4). At the end of the ablation procedure, non-inducibility of clinical VT by programmed ventricular stimulation was confirmed.
Figure 3.
Left anterior oblique (LAO) fluoroscopic view during radiofrequency catheter ablation (A). Non-sustained ventricular tachycardia episode with clinical morphology during the catheter ablation procedure (B).
Figure 4.
Three-dimensional bipolar voltage map of the left ventricle (LV) showing a low voltage scar in the inferolateral wall. Red regions represent scar (bipolar voltage 0.5 mV), and purple regions represent normal myocardium (bipolar voltage 1.5 mV). Other regions represent abnormal myocardial regions (bipolar voltage between 0.5 and 1.5 mV). Red and pink dots (VisiTag) represent radiofrequency pulses. Green and blue dots represent local abnormal ventricular activity (LAVA) points tagged with a Pentaray catheter (right) or ablation catheter (left), respectively.
During the subsequent hospital stay, continuous ECG monitoring did not show further VT events. Repeated blood test showed progressive CRP reduction, while the high-sensitivity troponin T level remained negative (5 ng/L, normal values <15.0 ng/L). Despite clinical improvement, a third nasopharyngeal swab resulted positive for SARS-CoV-2 and the patient was finally diagnosed with COVID-19 pneumonia. Another chest radiograph showed a near-complete resolution of pneumonia findings and she was discharged home to self-isolate with the addition of amiodarone 200 mg/day and apixaban 5 mg b.i.d. During the first 2 months after discharge, the patient remained asymptomatic, without further ICD interventions.
Discussion
The spectrum of COVID-19 clinical manifestations is highly variable, ranging from asymptomatic cases to SARS and cardiac involvement.1–4 It is known that patients with pre-existing cardiovascular disease have worse outcomes,13,14 and some authors have suggested that SARS-CoV-2 infection might be associated with myocardial involvement and eventually with life-threatening ventricular arrhythmias.15 Palpitations were reported in 7.3% of patients admitted for COVID-19,16 while cardiac arrhythmias were noted in 44.4% of severely ill hospitalized COVID-19 patients,2 although no specific data regarding the type of arrhythmia were reported. To date, this kind of presentation with atypical pneumonia, later proved to be COVID-19 related, associated with concurrent VT storm as the presenting manifestation of cardiac involvement has never been reported.
We considered that the patient was suffering from SARS-CoV-2 infection from admission, since RT–PCR on nasopharyngeal swabs is prone to have false-negative results,17,18 and cases of patients with suspected COVID-19 who ‘turn positive’ have been described.19 However as stated by Xiao et al.,20 some patients may experience false-negative RT–PCR results or prolonged viral clearance despite clinical improvement or radiological resolution of pneumonia, rather than simply ‘turning positive’.
Despite the history of pre-existing CAD, the patient had never experienced sustained VAs as documented by ICD interrogations, suggesting the role played by SARS-CoV-2 infection as a potential arrhythmogenic trigger. This finding can be corroborated by the detection of mildly symptomatic sustained/non-sustained VT episodes from symptom onset, ∼20 days before admission. The mechanisms of cardiac arrhythmias in COVID-19 patients may be multifactorial and may have not yet been completely understood. A cytokine storm triggered by an imbalanced type 1 and type 2 T-helper cell activity4, as well as hypoxia-induced intracellular calcium overload leading to early afterdepolarization, may represent a major trigger of reentrant VT in these patients,21,22 more than myocardial injury per se.
According to European guidelines, catheter ablation is recommended (class I A) in patients with CAD and recurrent ICD shocks due to sustained VT. Since the patient was not in stable VT after metoprolol and amiodarone administration, we decided to perform an extensive substrate-based ablation targeting LAVA23 which has been proven to be feasible, safe, and associated with superior survival free from recurrent VT.24,25 We used a remote magnetic navigation system since it has been thought to be superior to manual navigation for VT ablation (due to better contact force and stability),26,27 and in order to minimize unnecessary exposure of the electrophysiology laboratory staff to a likely COVID-19 patient.
Conclusion
Great attention is paid to respiratory failure in COVID-19 patients, but the real prevalence of cardiovascular involvement in such patients may be underestimated. To our knowledge, this is the first report describing a VT storm that may have been triggered by SARS-CoV-2 infection, underlining the complexity of the COVID-19 clinical profile. This case highlights the role of cardiac electrophysiologists during the COVID-19 outbreak and might be helpful for the management of similar cases.
Lead author biography

Dr. Gianfranco Mitacchione graduated in 2009 at the University of Bari (Italy). He attended the 5-years Cardiology Recidency at the University of Insubria (Italy) and he subsequently completed a PhD in Experimental and Translational Medicine at the same University. He attended a two years post-doctoral research fellowship in cardiovascular physiology at New-York Medical School (Valhalla, NY-USA) and Lewis Kats School of Medicine at Temple University (Philadelphia - PA-USA). He contributed to several research projects and now is working in Luigi Sacco Hospital (Milan-Italy) as cardiac electrophysiologist.
Supplementary material
Supplementary Material is available at European Heart Journal - Case Reports online.
Slide sets: A fully edited slide set detailing this case and suitable for local presentation is available online as Supplementary data.
Consent: the authors confirm that written consent for submission and publication of this case report, including images and associated text, has been obtained from the patient in line with COPE guidance.
Author contributions: G.M. conceived this case report; G.M. and M.S. wrote the original draft of this paper; A.G. revised the literature and contributed to the original draft; G.M. and M.S. revised and edited this case report based on reviewers’ comments; and G.B.F. supervised the entire work as senior author.
Conflict of interest: none declared.
Supplementary Material
ytaa217_Slide_sets_Presentation
References
- 1.Huang C, Wang Y, Li X, Ren L, Zhao J, Hu Y, Zhang L, Fan G, Xu J, Gu X, Cheng Z, Yu T, Xia J, Wei Y, Wu W, Xie X, Yin W, Li H, Liu M, Xiao Y, Gao H, Guo L, Xie J, Wang G, Jiang R, Gao Z, Jin Q, Wang J, Cao B.. Clinical features of patients infected with 2019 novel coronavirus in Wuhan, China. Lancet 2020;395:497–506. [DOI] [PMC free article] [PubMed] [Google Scholar]
- 2.Wang D, Hu B, Hu C, Zhu F, Liu X, Zhang J, Wang B, Xiang H, Cheng Z, Xiong Y, Zhao Y, Li Y, Wang X, Peng Z.. Clinical characteristics of 138 hospitalized patients with 2019 novel coronavirus-infected pneumonia in Wuhan, China. JAMA 2020;323:1061–1069. [DOI] [PMC free article] [PubMed] [Google Scholar]
- 3.Shi S, Qin M, Shen B, Cai Y, Liu T, Yang F, Gong W, Liu X, Liang J, Zhao Q, Huang H, Yang B, Huang C.. Association of cardiac injury with mortality in hospitalized patients with COVID-19 in Wuhan, China. JAMA Cardiol 2020;doi: 10.1001/jamacardio.2020.0950. [DOI] [PMC free article] [PubMed] [Google Scholar]
- 4.Zhou F, Yu T, Du R, Fan G, Liu Y, Liu Z, Xiang J, Wang Y, Song B, Gu X, Guan L, Wei Y, Li H, Wu X, Xu J, Tu S, Zhang Y, Chen H, Cao B.. Clinical course and risk factors for mortality of adult inpatients with COVID-19 in Wuhan, China: a retrospective cohort study. Lancet 2020;395:1054–1062. [DOI] [PMC free article] [PubMed] [Google Scholar]
- 5.Brigadeau F, Kouakam C, Klug D, Marquié C, Duhamel A, Mizon-Gérard F, Lacroix D, Kacet S.. Clinical predictors and prognostic significance of electrical storm in patients with implantable cardioverter defibrillators. Eur Heart J 2006;27:700–707. [DOI] [PubMed] [Google Scholar]
- 6.Proietti R, Sagone A.. Electrical storm: incidence, prognosis and therapy. Indian Pacing Electrophysiol J 2011;11:34–42. [PMC free article] [PubMed] [Google Scholar]
- 7.Credner SC, Klingenheben T, Mauss O, Sticherling C, Hohnloser SH.. Electrical storm in patients with transvenous implantable cardioverter-defibrillators: incidence, management and prognostic implications. J Am Coll Cardiol 1998;32:1909–1915. [DOI] [PubMed] [Google Scholar]
- 8.Hohnloser SH, Al-Khalidi HR, Pratt CM, Brum JM, Tatla DS, Tchou P, Dorian P.. Electrical storm in patients with an implantable defibrillator: incidence, features, and preventive therapy: insights from a randomized trial. Eur Heart J 2006;27:3027–3032. [DOI] [PubMed] [Google Scholar]
- 9.Greene M, Newman D, Geist M, Paquette M, Heng D, Dorian P.. Is electrical storm in ICD patients the sign of a dying heart? Outcome of patients with clusters of ventricular tachyarrhythmias. Europace 2000;2:263–269. [DOI] [PubMed] [Google Scholar]
- 10.Bänsch D, Böcker D, Brunn J, Weber M, Breithardt G, Block M.. Clusters of ventricular tachycardias signify impaired survival in patients with idiopathic dilated cardiomyopathy and implantable cardioverter defibrillators. J Am Coll Cardiol 2000;36:566–573. [DOI] [PubMed] [Google Scholar]
- 11.Muser D, Liang J, Santangeli P.. Electrical storm in patients with implantable cardioverter-defibrillators: a practical overview. J Innov Card Rhythm Manag 2017;8:2853–2861. [DOI] [PMC free article] [PubMed] [Google Scholar]
- 12.Priori SG, Blomstrom-Lundqvist C, Mazzanti A, Bloma N, Borggrefe M, Camm J, Elliott PM, Fitzsimons D, Hatala R, Hindricks G, Kirchhof P, Kjeldsen K, Kuck KH, Hernandez-Madrid A, Nikolaou N, Norekval TM, Spaulding C, Van Veldhuisen DJ; ESC Scientific Document Group. 2015 ESC Guidelines for the management of patients with ventricular arrhythmias and the prevention of sudden cardiac death the Task Force for the Management of Patients with Ventricular Arrhythmias and the Prevention of Sudden Cardiac Death of the Europea. Eur. Heart J 2015;36: 2793–2867l. [DOI] [PubMed] [Google Scholar]
- 13.Guo T, Fan Y, Chen M, Wu X, Zhang L, He T, Wang H, Wan J, Wang X, Lu Z.. Cardiovascular implications of fatal outcomes of patients with coronavirus disease 2019 (COVID-19). JAMA Cardiol 2020;doi: 10.1001/jamacardio.2020.1017. [DOI] [PMC free article] [PubMed] [Google Scholar]
- 14.Mehra MR, Desai SS, Kuy S, Henry TD, Patel AN.. Cardiovascular disease, drug therapy, and mortality in Covid-19. N Engl J Med 2020;doi: 10.1056/NEJMoa2007621. [DOI] [PMC free article] [PubMed] [Google Scholar] [Retracted]
- 15.Kochi AN, Tagliari AP, Forleo GB, Fassini GM, Tondo C.. Cardiac and arrhythmic complications in patients with COVID-19. J Cardiovasc Electrophysiol 2020;31:1003–1008. [DOI] [PMC free article] [PubMed] [Google Scholar]
- 16.Kui L, Fang YY, Deng Y, Liu W, Wang MF, Ma JP, Wang Xiao W, Zhong YN, Li MH, Li CH, Liu GC, Clinical HG.. characteristics of novel coronavirus cases in tertiary hospitals in Hubei Province. Chin Med J (Engl) 2020;133:1025–1031. [DOI] [PMC free article] [PubMed] [Google Scholar]
- 17.Wang W, Xu Y, Gao R, Lu R, Han K, Wu G, Tan W.. Detection of SARS-CoV-2 in different types of clinical specimens. JAMA 2020; 323:1843–1844. [DOI] [PMC free article] [PubMed] [Google Scholar]
- 18.Li Y, Yao L, Li J, Chen L, Song Y, Cai Z, Yang C.. Stability issues of RT–PCR testing of SARS-CoV-2 for hospitalized patients clinically diagnosed with COVID-19. J Med Virol 2020;92:903–908. [DOI] [PMC free article] [PubMed] [Google Scholar]
- 19.Zhang JF, Yan K, Ye HH, Lin J, Zheng JJ, Cai T.. SARS-CoV-2 turned positive in a discharged patient with COVID-19 arouses concern regarding the present standard for discharge. Int J Infect Dis 2020;doi: 10.1016/j.ijid.2020.03.007. [DOI] [PMC free article] [PubMed] [Google Scholar]
- 20.Xiao AT, Tong YX, Zhang S.. False-negative of RT–PCR and prolonged nucleic acid conversion in COVID-19: rather than recurrence. J Med Virol 2020;doi: 10.1002/jmv.25855. [DOI] [PMC free article] [PubMed] [Google Scholar]
- 21.Zheng YY, Ma YT, Zhang JY, Xie X.. COVID-19 and the cardiovascular system. Nat Rev Cardiol 2020;17:259–260. [DOI] [PMC free article] [PubMed] [Google Scholar]
- 22.Landstrom AP, Dobrev D, Wehrens XHT.. Calcium signaling and cardiac arrhythmias. Circ Res 2017;120:1969–1993. [DOI] [PMC free article] [PubMed] [Google Scholar]
- 23.Sacher F, Lim HS, Derval N, Denis A, Berte B, Yamashita S, Hocini M, Haissaguerre M, Jaïs P.. Substrate mapping and ablation for ventricular tachycardia: the LAVA approach. J Cardiovasc Electrophysiol 2015;26:464–471. [DOI] [PubMed] [Google Scholar]
- 24.Biase L Di, Burkhardt JD, Lakkireddy D, Carbucicchio C, Mohanty S, Mohanty P, Trivedi C, Santangeli P, Bai R, Forleo G, Horton R, Bailey S, Sanchez J, Al-Ahmad A, Hranitzky P, Gallinghouse GJ, Pelargonio G, Hongo RH, Beheiry S, Hao SC, Reddy M, Rossillo A, Themistoclakis S, Russo A Dello, Casella M, Tondo C, Natale A.. Ablation of stable VTs versus substrate ablation in ischemic cardiomyopathy the VISTA randomized multicenter trial. J Am Coll Cardiol 2015;66:2872–2882. [DOI] [PubMed] [Google Scholar]
- 25.Jaïs P, Maury P, Khairy P, Sacher F, Nault I, Komatsu Y, Hocini M, Forclaz A, Jadidi AS, Weerasooryia R, Shah A, Derval N, Cochet H, Knecht S, Miyazaki S, Linton N, Rivard L, Wright M, Wilton SB, Scherr D, Pascale P, Roten L, Pederson M, Bordachar P, Laurent F, Kim SJ, Ritter P, Clementy J, Haïssaguerre M.. Elimination of local abnormal ventricular activities: a new end point for substrate modification in patients with scar-related ventricular tachycardia. Circulation 2012;125:2184–2196. [DOI] [PubMed] [Google Scholar]
- 26.Zhang F, Yang B, Chen H, Ju W, Kojodjojo P, Cao K, Chen M.. Magnetic versus manual catheter navigation for mapping and ablation of right ventricular outflow tract ventricular arrhythmias: a randomized controlled study. Heart Rhythm 2013;10:1178–1183. [DOI] [PubMed] [Google Scholar]
- 27.Burkhardt JD. Remote magnetic navigation for ventricular ablation: did the machine win this round? J Interv Card Electrophysiol 2017;48:5–7. [DOI] [PubMed] [Google Scholar]
Associated Data
This section collects any data citations, data availability statements, or supplementary materials included in this article.
Supplementary Materials
ytaa217_Slide_sets_Presentation


