Divergent impacts of warming weather on wildlife disease risk across climates (original) (raw)
. Author manuscript; available in PMC: 2021 Nov 20.
Published in final edited form as: Science. 2020 Nov 20;370(6519):eabb1702. doi: 10.1126/science.abb1702
Abstract
INTRODUCTION:
Infectious disease outbreaks among wildlife have surged in recent decades alongside global climate change. However, the circumstances under which climate change is most likely to promote or inhibit infectious disease remain unknown for several reasons. First, researchers know little about how climate change will alter disease risk across hosts and parasites with diverse life history traits (e.g., host thermal biology, habitat, and parasite transmission mode). Second, not all parasites will be affected by climate change, but it remains unclear how the relative risk of disease caused by bacteria, viruses, fungi, and helminths is changing. Third, impacts of temperature abnormalities and variability, rather than increasing mean temperatures alone, remain largely unexplored. Finally, it is not clear which regions of the globe may become more amenable to disease and which may become less suitable.
RATIONALE:
Recently, the thermal mismatch hypothesis has emerged to predict how infection risk is affected by temperature across climate zones in an amphibian-disease system. This hypothesis suggests that hosts adapted to cooler and warmer climates should be at greatest risk of infection under abnormally warm and cool conditions, respectively, because smaller-bodied parasites are more likely to maintain performance over a wider range of temperatures than larger-bodied hosts but are limited by extreme conditions. However, thermal mismatches may not affect diverse hosts and parasites equally because wildlife host and parasite traits can greatly influence disease outcomes. For example, thermal mismatches might exert an especially strong influence over disease outcomes in ectothermic hosts because their immune responses are highly temperature-dependent.
To address this challenge, we examined how disease risk was affected by temperature for diverse wildlife hosts and parasites that vary in ecologically important traits across a worldwide climatic gradient. We amassed a global, spatiotemporal dataset describing parasite prevalence across 7346 wildlife populations and 2021 host-parasite combinations. Further, we compiled long-term climate records at each location and short-term weather records during each survey. Our modeling approach investigated how relationships between parasite prevalence and weather depend on local climate and host and parasite traits. Finally, we projected broad-scale changes in disease risk based on thermal mismatches and ensemble climate change model predictions.
RESULTS:
We found that on average, hosts from cool and warm climates experienced increased disease risk at abnormally warm and cool temperatures, respectively, as predicted by the thermal mismatch hypothesis. This effect was greatest among hosts that are ectothermic and nonmigratory and among systems in which the parasite is directly transmitted (without vectors or intermediate hosts). However, the thermal mismatch effect was similar in terrestrial and freshwater systems. Projections based on climate change models indicate that ectothermic wildlife hosts from temperate and tropical zones may experience sharp increases and moderate reductions in disease risk, respectively, though the magnitude of these changes depends on parasite taxa. Prevalence of helminth parasites increased most in temperate zones, whereas fungal parasite prevalence decreased most in tropical zones.
CONCLUSION:
Cold-adapted hosts may experience increasing disease risk during abnormally warm periods. Meanwhile, the risk to warm-adapted hosts may increase during cool periods and mildly decrease during warm periods. Further, these effects are dependent on the identity and traits of the parasite and the host. Our results highlight the complexity of the influences of climate change on diverse host-parasite dynamics, whereas our broad-scale predictions suggest contrasting impacts of climate change across climate zones and diverse parasites. As climate change accelerates, hosts adapted to cooler or milder climates may suffer increasing risk of infectious disease outbreaks, whereas those adapted to warmer climates could see mild reductions in infectious disease risk.
Graphical Abstract
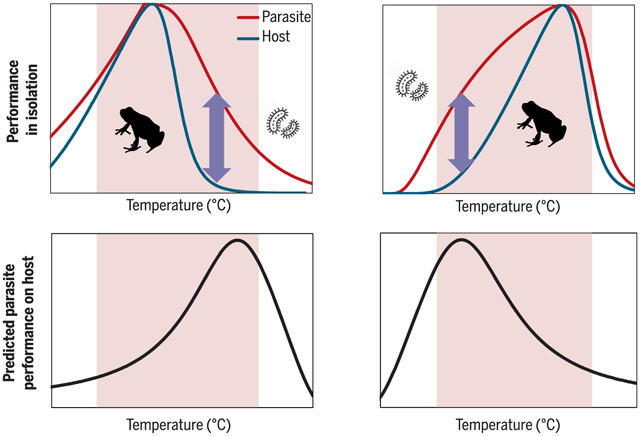
The thermal mismatch hypothesis. Predicted patterns of thermal host and parasite performance in isolation (top, left and right) versus patterns of host-parasite interactions (bottom, left and right). Because smaller organisms generally have broader thermal performance curves in isolation than larger organisms, peak parasite growth on hosts is likely at temperatures at which host performance is poor (arrows in top left and top right; curves in bottom left and bottom right). Cold-adapted hosts (left, top and bottom) and warm-adapted hosts (right, top and bottom) should thus experience maximal parasite growth at relatively warm and cool temperatures, respectively. Shaded areas span intermediate temperatures over which relationships between temperature and parasite performance on host are likely to be approximately linear.
Disease outbreaks among wildlife have surged in recent decades alongside climate change, although it remains unclear how climate change alters disease dynamics across different geographic regions. We amassed a global, spatiotemporal dataset describing parasite prevalence across 7346 wildlife populations and 2021 host-parasite combinations, compiling local weather and climate records at each location. We found that hosts from cool and warm climates experienced increased disease risk at abnormally warm and cool temperatures, respectively, as predicted by the thermal mismatch hypothesis. This effect was greatest in ectothermic hosts and similar in terrestrial and freshwater systems. Projections based on climate change models indicate that ectothermic wildlife hosts from temperate and tropical zones may experience sharp increases and moderate reductions in disease risk, respectively, though the magnitude of these changes depends on parasite identity.
In recent years, ecological communities have experienced increases in mean environmental temperatures and weather variability (1), as well as simultaneous increases in outbreaks of emerging infectious diseases (2, 3). However, complex links between climate change and infectious disease risk in wildlife remain difficult to untangle for several reasons (4–6). First, despite positive relationships between warmer temperatures and disease in many host-parasite systems [e.g., (7, 8)], warming could plausibly reduce risk in many cases [e.g., if the parasite performs poorly under warmer conditions (6)]. Second, few studies have explored how disease risk is affected by temperature abnormalities, even though increasing temperature variability is a hallmark of climate change [however, see (9, 10)]. Third, although host or parasite traits often influence disease outcomes (11), it is difficult to predict how disease risk is shifting across hosts and parasites with diverse life history traits (4, 5).
The thermal mismatch hypothesis has recently emerged to explain how abnormal temperatures alter infection risk in an amphibian-disease system (12–14). This hypothesis suggests that hosts adapted to cooler and warmer climates should be at greatest infection risk under abnormally warm and cool conditions (thermal mismatches), respectively (see summary figure). The hypothesis assumes that all organisms are physiologically adapted to their local climate but that smaller-bodied parasites generally have broader thermal tolerances than larger-bodied hosts, meaning that the parasites can maintain performance over a wider range of temperatures [perhaps because they acclimate or adapt to new conditions faster (15)]. Sometimes, parasites may even directly reduce the thermal breadths of their hosts (10). Thus, host infection risk is hypothesized to peak at temperatures at which host performance is low but parasite performance remains high. Further, all organisms are expected to be limited by extremes that exceed their critical thermal minima or maxima (15). Therefore, infection risk is expected to be maximized during unusually cool conditions in warm environments and warm conditions in cool environments. Although thermal performance curves are inherently nonlinear, the hypothesis predicts that, under intermediate conditions where hosts occur at threshold densities needed for transmission (16), infection risk can be effectively modeled as a linear relationship with temperature. Importantly, the hypothesis is robust to violations of the aforementioned assumptions (fig. S1). The thermal mismatch hypothesis could offer a tool for understanding the impacts of climate change and disease across regions because it suggests that under abnormally warm conditions, hosts from cooler climates should experience higher disease risk, whereas hosts from warmer climates may experience no change or a reduction in risk.
The thermal mismatch hypothesis has been broadly supported on the basis of continental and global-scale analyses of survey records of the fungal pathogen Batrachochytrium dendrobatidis across 394 amphibian host species and 1396 populations (12–14). Additionally, experimental infections revealed that hosts from warm climates experienced the greatest B. dendrobatidis infection loads and mortality under cool conditions, and vice versa (13), even when amphibians were able to thermoregulate (17), and a meta-analysis indicated that host mortality risk in the lab also increased under thermal mismatches (18). However, this hypothesis has only been shown to affect disease risk in amphibians infected with B. dendrobatidis, a system with an ectothermic host and ectoparasite that might be especially sensitive to environmental conditions. Several wildlife host and parasite traits influence disease outcomes, including host thermal biology, habitat, parasite taxa, and transmission mode (12). For example, thermal mismatches might exert a stronger influence over disease outcomes in ectothermic hosts than endothermic hosts because the body temperatures and immune responses of ectotherms are more dependent on environmental temperature (19). Thus, it remains unclear how temperature abnormalities influence the risk of disease outbreaks across diverse host-parasite systems from disparate climates.
Modeling changing infectious disease risk
Our primary goal was to assess how thermal mismatches, or short-term weather fluctuations, affect shifts in disease risk under long-term climate change across diverse host-parasite systems. To accomplish this, we compiled a population-level spatiotemporal parasite prevalence dataset from wildlife surveys reported in the literature. We limited our dataset to short-term surveys of wild animals, reported from precise geographic locations (see the Materials and methods). Our dataset contained 7346 population-level survey records from 355 studies on seven continents and represented 309 parasite lineages, 1381 host species from 52 taxonomic orders, and 2021 host-parasite combinations (figs. S2 and S3). The dataset contained a diverse assemblage of host taxa (31% birds, 30% amphibians, 22% fish, 9% mammals, 7% insects, and 1% reptiles) and parasite taxa (31% protozoa, 28% fungi, 23% viruses, 11% helminths, 6% bacteria, and 1% arthropods) from terrestrial (62%) and freshwater (38%) systems. We further collected the dates and locations of all surveys and compiled (i) local weather data provided by the Climate Research Unit (20) to estimate the temperature and precipitation during the month(s) of each survey (hereafter, “weather”) and (ii) local long-term climate data (1970–2000 mean temperatures, hereafter, “climate”) provided by Worldclim (21).
We fit five binomial mixed-effects models to examine how interactions between climate, weather, and various traits or features (host thermal biology, host habitat preference, host migratory distance, parasite taxa, and parasite transmission complexity) influenced parasite prevalence in hosts, which served as an indicator of disease risk. Thermal mismatches were represented as statistical interactions between climate and weather variables (hereafter, “thermal mismatch interaction”), whereas three-way interactions evaluated how traits or taxa influenced the strength of thermal mismatch effects (hereafter, “trait-dependent thermal mismatch interactions”). We then generated model predictions at the 10th and 90th percentiles (~5° and ~22°C) of 30-year mean temperature, representative of cold and warm climates, respectively. Given our hypothesis, we expected to find negative thermal mismatch interactions, suggesting that infection risk among hosts from cooler climates increased at warm temperatures, and vice versa. Each model controlled for monthly precipitation and the four other traits or features as fixed effects and included study and host taxa as random effects. Our models assume linear relationships between temperature and parasite prevalence covering the intermediate portions of the temperature spectrum, as predicted by the thermal mismatch hypothesis (see Materials and methods). Survey data were not spatially autocorrelated, and thus we did not control for autocorrelation (fig. S4).
Relationships between climate, weather, and disease
All models (tables S2 to S6) produced a significant, negative two-way interaction between climate and weather; thus, thermal mismatches broadly influenced parasite prevalence in our dataset of diverse host-parasite interactions (thermal mismatch interaction: climate × weather; model coefficient (β) = −0.003, p < 0.0001).Impacts of thermal mismatches on parasite prevalence were highly dependent on host and parasite traits. Model comparisons demonstrated that, whereas thermal mismatch interactions always improved models, the greatest model improvements in Akaike information criterion (AIC), Nagelkerke’s pseudo-_R_2, and chi-square values were observed with trait-dependent thermal mismatch interactions (except habitat; table S1).
As predicted, partial residual (PR) plots revealed that ectothermic hosts from relatively cool or warm climates experienced the greatest parasite prevalence when temperatures were unusually warm or cool, respectively (trait-dependent thermal mismatch interaction–thermal biology; p < 0.0001; Fig. 1, A and B, and table S2). However, endotherms experienced the greatest parasite prevalence during cold weather. This could be an effect of cold-induced physiological changes in endotherms that can be immunosuppressive (22) or increasing transmission rates of airborne pathogens in cool, less humid air (23). Further, we expected that the effects of thermal mismatches on parasite prevalence may be less detectable in long-distance migrant hosts because these hosts experience greater variation in climate and have more flexibility to avoid adverse weather. Indeed, PR plots revealed that this was the case (trait-dependent thermal mismatch interaction–migratory distance; p < 0.0001; fig. S5, A and B, and table S3), although we caution that long-distance migrant hosts experience conditions over the annual cycle that often differ from the climate of the survey location.
Fig. 1. Thermal mismatch effects on parasite prevalence depend on host thermal biology but not habitat.
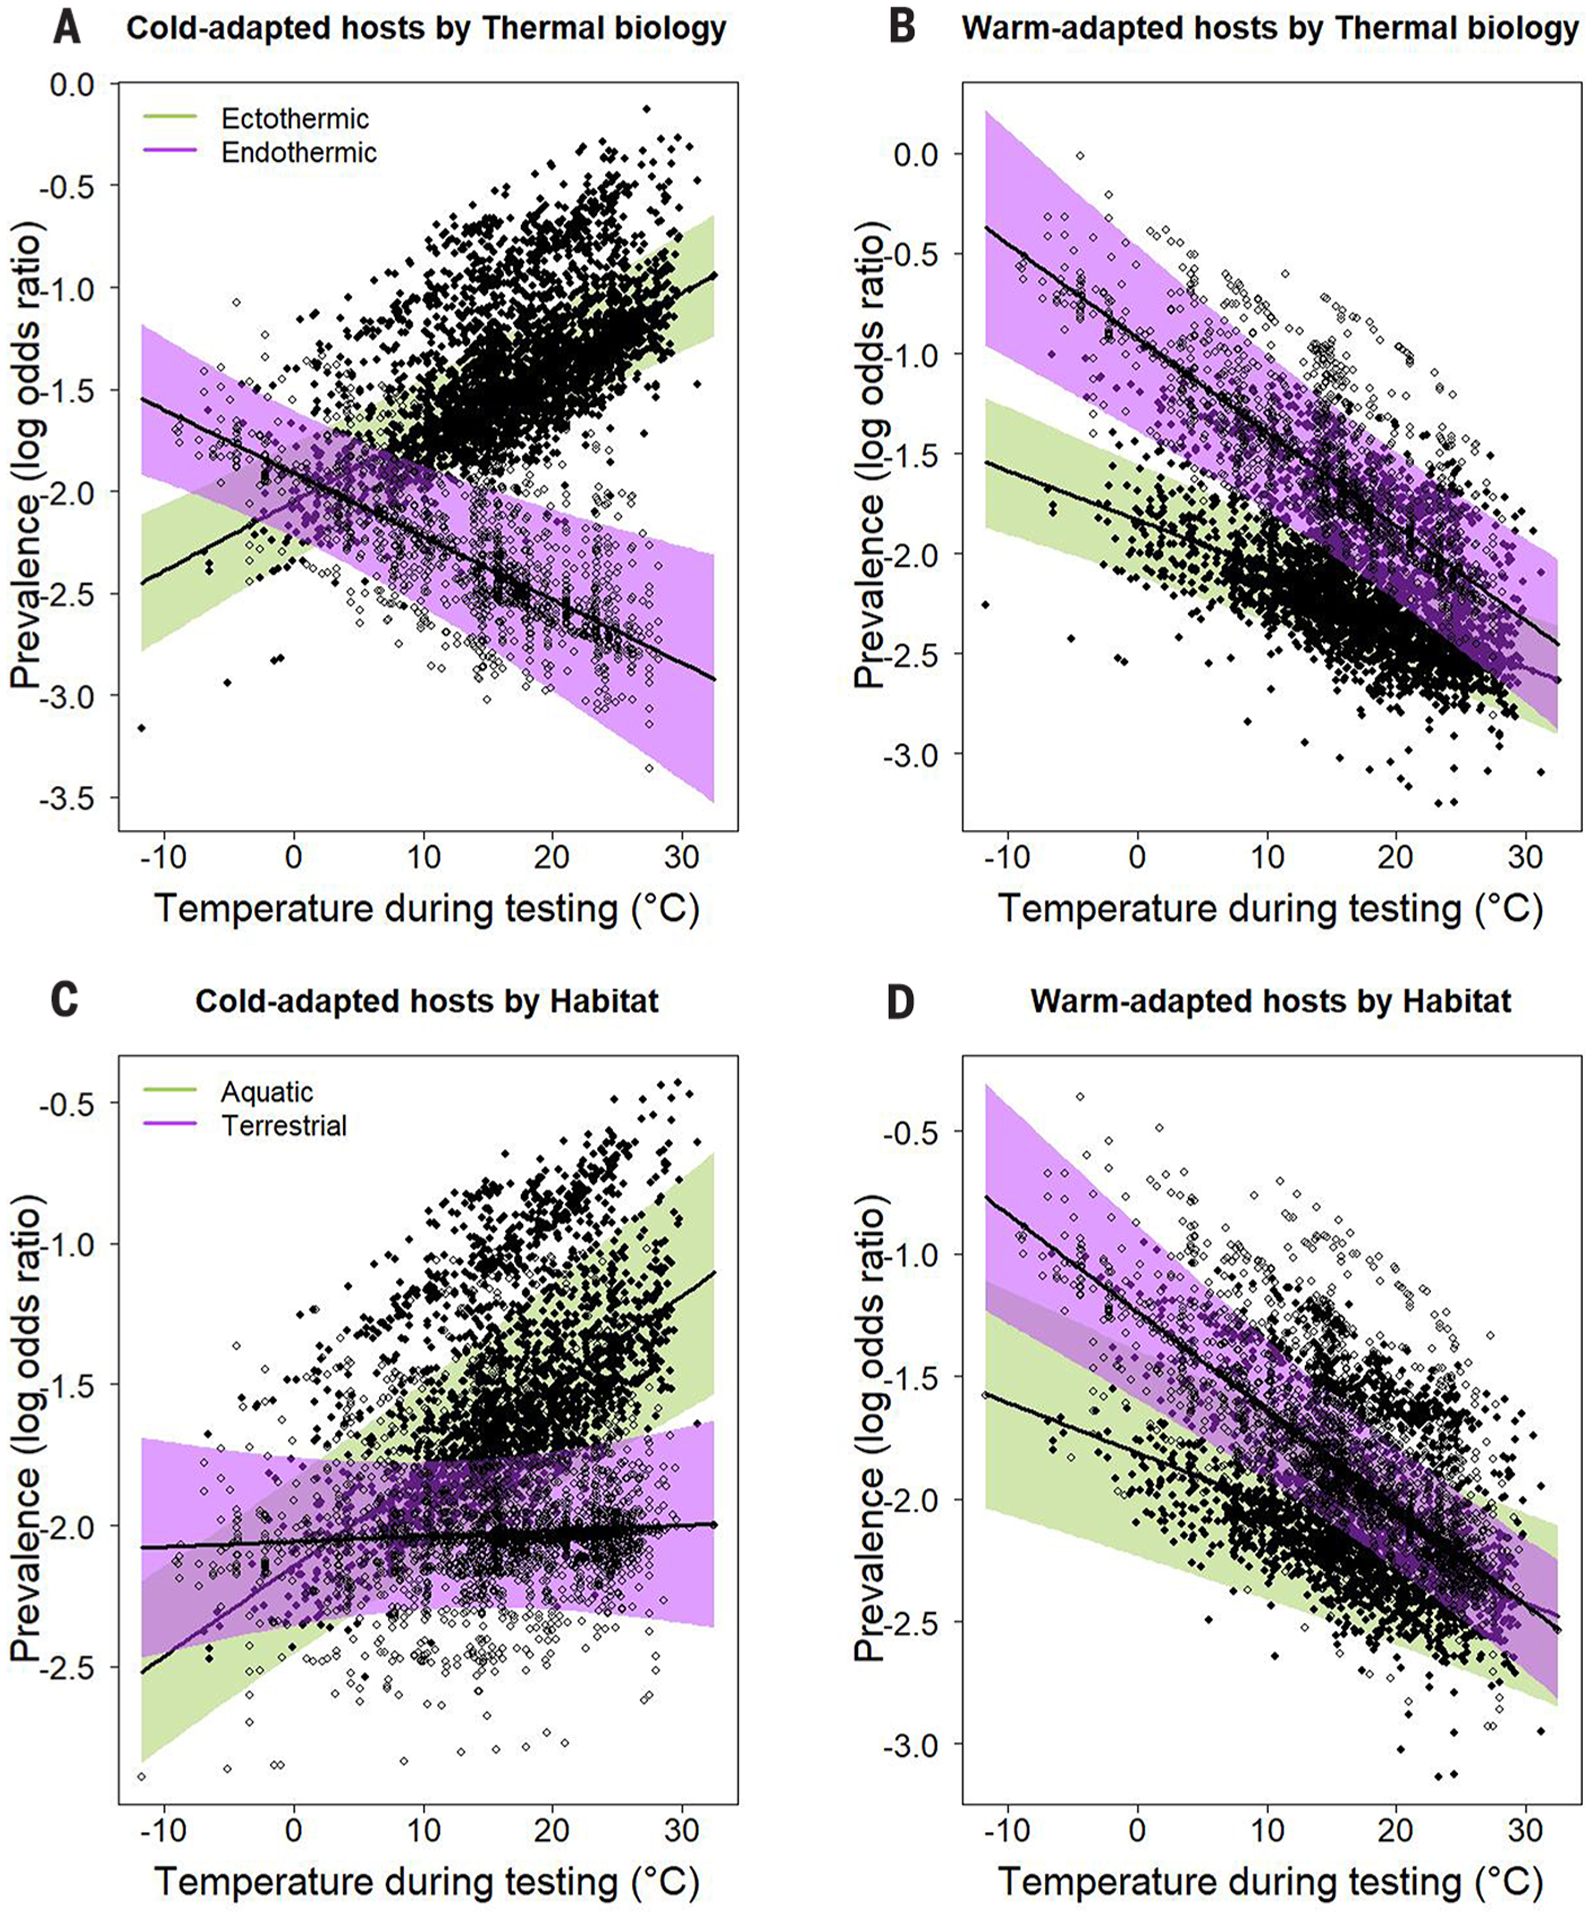
(A to D) Partial residual plots from binomial mixed-effects models display the significant three-way interactions among long-term climate, weather, and either host thermal biology [(A) and (B)] or habitat [(C) and (D)] that affect parasite prevalence (as log-odds ratios). Points represent host populations, and shading shows 95% confidence bands; green bands and solid points represent ectothermic and aquatic hosts, whereas purple bands and open points represent endothermic and terrestrial hosts. Cold-adapted (prediction at 10th percentile climate of ~5°C) hosts are represented in (A) and (C), and warm-adapted (prediction at 90th percentile climate of ~22°C) hosts are represented in (B) and (D). The models suggest that ectothermic and endothermic hosts from cooler climates typically experience higher and lower prevalence under warm conditions, respectively (A). Meanwhile, all warm-adapted hosts experience high prevalence when conditions are cool (B). Cold-adapted aquatic hosts experience greater parasite prevalence at warm temperatures than terrestrial hosts (C), though all warm-adapted hosts experience greater prevalence at cool temperatures (D), as predicted by the thermal mismatch hypothesis.
We expected that terrestrial hosts experience greater parasite prevalence under thermal mismatches than aquatic hosts because environmental temperatures are typically less variable in water than in air, despite exceptions [e.g., perched wetlands (24)]. Surprisingly, all hosts experienced similarly high parasite prevalence after thermal mismatches (trait-dependent thermal mismatch interaction–habitat; p = 0.24; Fig. 1, C and D, and table S4), though terrestrial hosts were not as likely to experience high parasite prevalence under warm temperatures in cold climates [possibly because aquatic hosts have evolved narrower thermal breadths (15)]. Finally, we observed increased parasite prevalence after thermal mismatches in host-parasite interactions with a directly transmitted parasite (trait-dependent thermal mismatch interaction–transmission mode; p < 0.0001; fig. S5, C and D, and table S6) rather than an indirectly transmitted parasite (relying on intermediate hosts or vectors; fig. S5, C and D), possibly because of the inherent complications present in these systems that might impede detection of temperature effects. For example, indirectly transmitted parasites may benefit from behavioral thermoregulation of intermediate hosts at high temperatures, which can provide shelter and thus mitigate the effects of unusually warm weather conditions in cold-adapted parasites.
Although we expected to see thermal mismatch effects across parasite taxa—including bacteria, viruses, fungi, and helminths—we predicted that the strength of effects in cool or warm climates depends on taxon. For example, fungal parasites might have a particularly strong advantage when infecting warm-adapted hosts at cold temperatures because many fungi perform best at cool or intermediate temperatures (25), whereas the opposite might be true for parasites that often grow well under warm temperatures, such as helminths (26). Indeed, the impacts of thermal mismatches on parasite prevalence were highly dependent on parasite taxa (Fig. 2 and table S5). Fungal prevalence exhibited the strongest thermal mismatch effect, increasing sharply under cold abnormalities in warm climates but more gradually under warm abnormalities in cool climates (Fig. 2). By contrast, helminth prevalence was positively related to temperature across climates, though this relationship was much stronger in cool climates (Fig. 2), suggesting that warming may benefit helminths more than other parasites. Several previous studies have found positive associations between helminth transmission and temperature [e.g., (26)], and helminth success in hosts is closely tied to host food consumption (27), which may be limited in abnormally cool conditions.
Fig. 2. Variation in thermal mismatch patterns among parasite taxa.
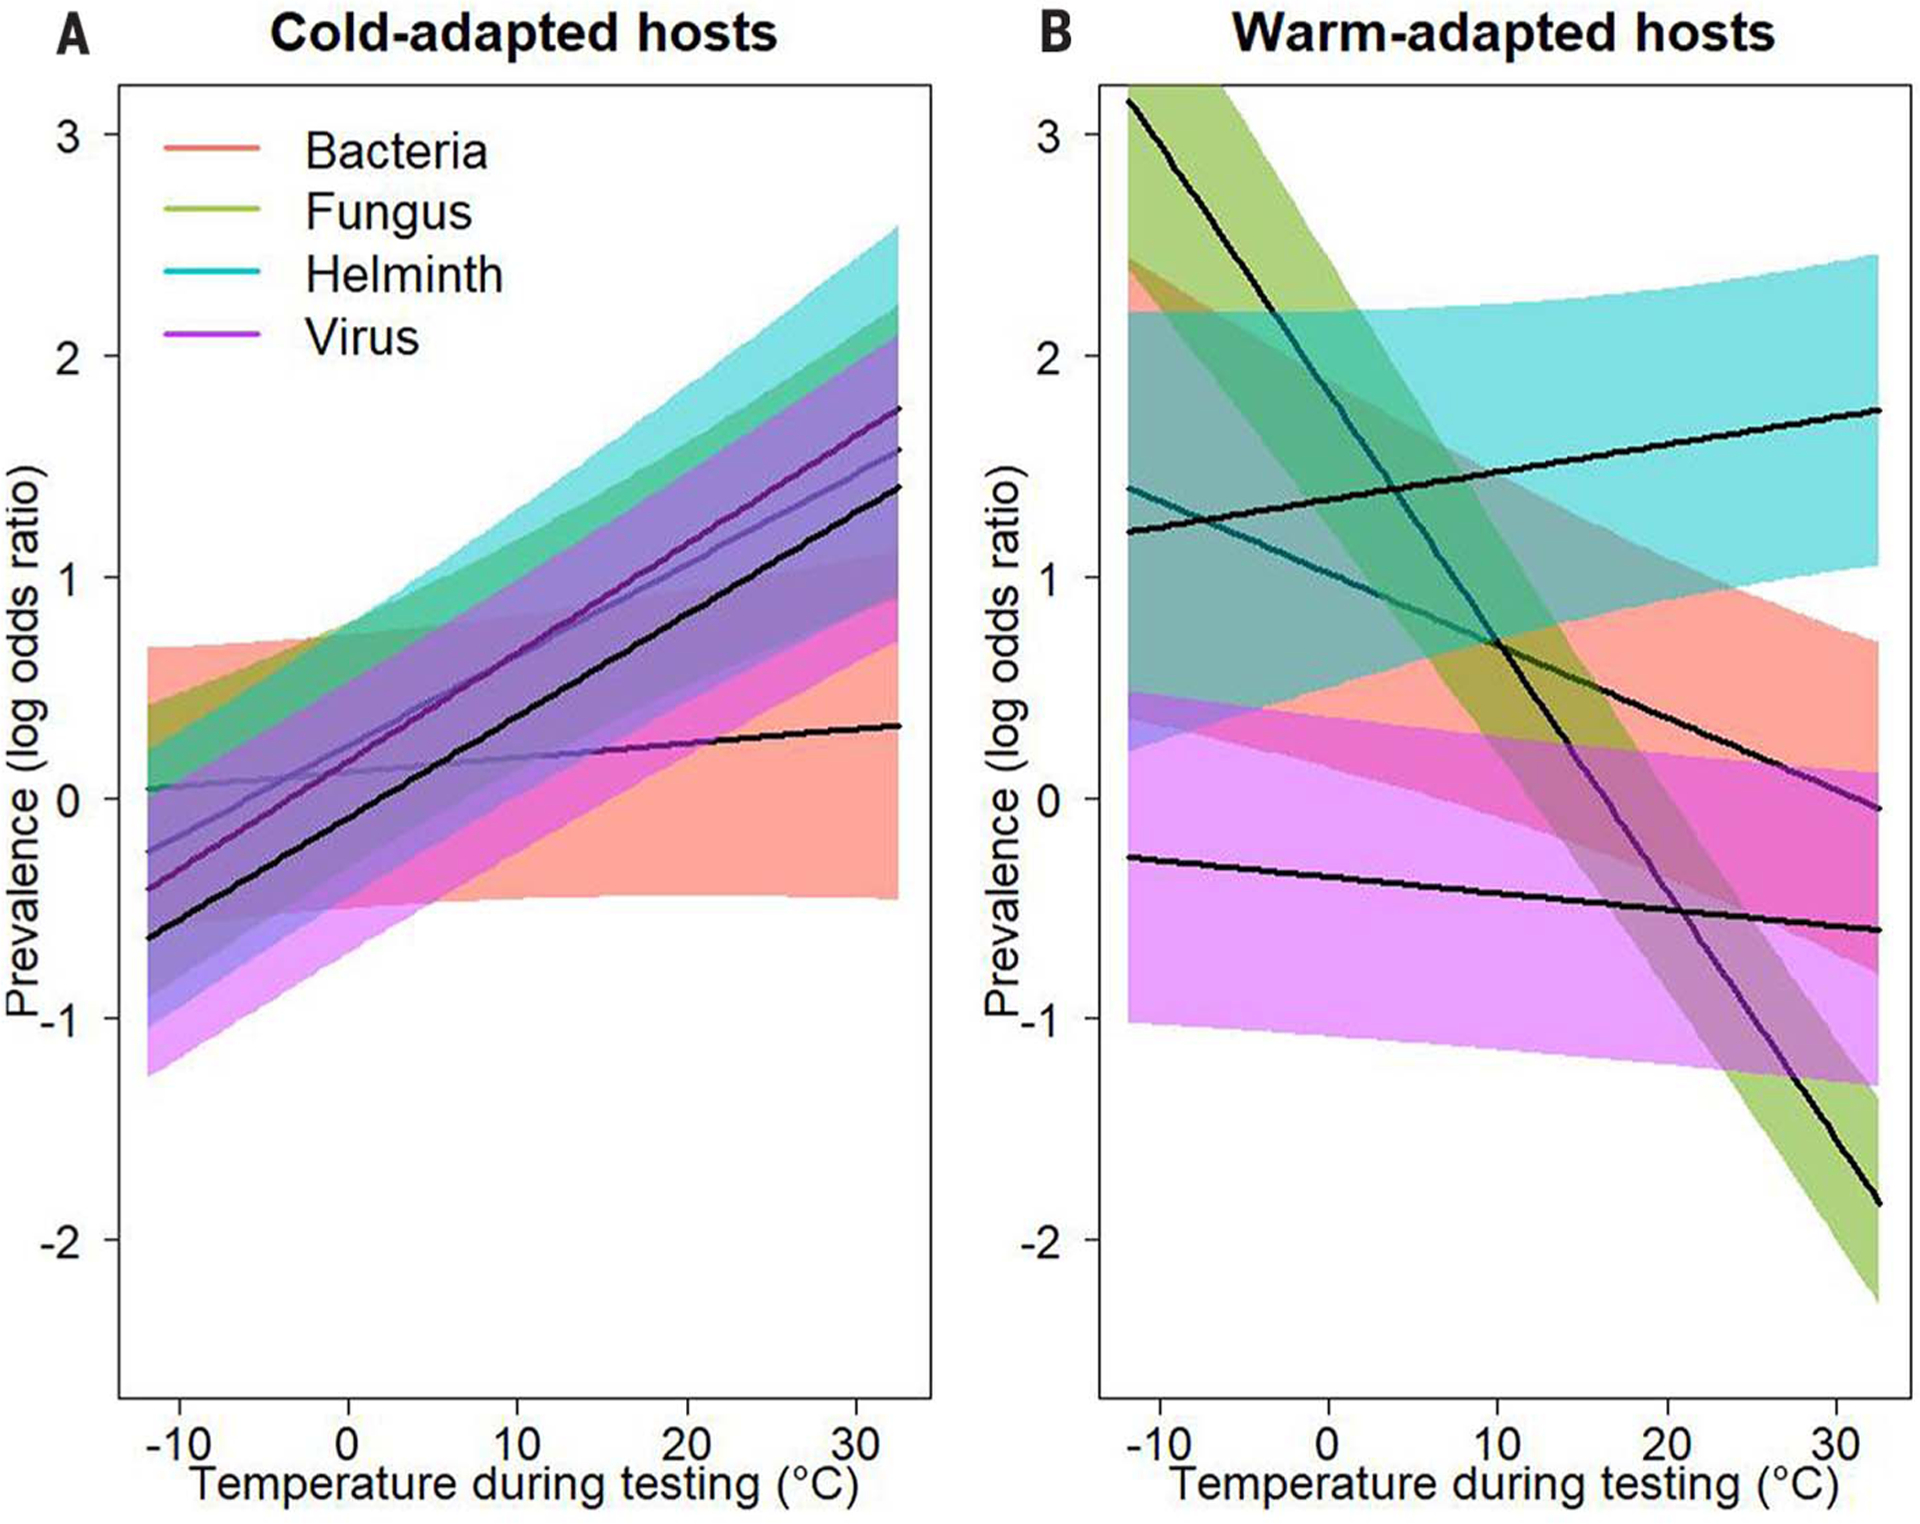
(A and B) Partial residual plots from a binomial mixed-effects model display the significant three-way interactions among long-term climate, weather, and parasite taxa. Shading shows associated 95% confidence bands for four parasite taxa: bacteria (red), fungi (green), helminths (blue), or viruses (purple). Cold-adapted (prediction at 10th percentile climate of ~5°C) hosts are represented in (A), and warm-adapted (prediction at 90th percentile climate of ~22°C) hosts are represented in (B). The models suggest that hosts from cooler climates typically experience a higher prevalence of fungal, helminth, and viral parasites under warm conditions, whereas those from warmer climates experience a higher prevalence of fungal and bacterial parasites when conditions are cool.
Bacterial prevalence decreased moderately under cool temperatures in warm climates but only slightly under warm temperatures in cool climates (Fig. 2). Finally, viral parasite prevalence increased under warm temperatures in cool climates but not cool temperatures in warm climates, though we advise caution in interpreting this result because viral infections progress quickly and thus hosts may be likely to clear infections or suffer mortality in time frames shorter than the monthly resolution of our weather data. These results were largely robust to reductions in model complexity (table S7) or shifts in the relative proportion of host taxa (figs. S6 to S8 and table S8).
Predicting changing disease risk across the globe
Our models indicate that climate change may increase disease risk for many wildlife hosts from cooler climates, whereas wildlife from warmer climates may experience reduced disease risk. Following these models, we aimed to explore global patterns of disease risk in wildlife under climate change. We generated nearly global predictions from our model results (excluding polar areas) for how prevalence of four parasite taxa (bacteria, fungi, helminths, and viruses) will change under projected annual mean temperatures in 2070 following various greenhouse gas emission scenarios [Representative Concentration Pathways (RCPs) 2.6, 4.5, 6.0, and 8.5 by the Community Climate System Model (28); see Materials and methods]. To generate these predictions, we represented climate with long-term mean temperature and weather with projected mean temperature under a given RCP. We then divided these predictions by predictions generated under the current climate (with long-term mean temperature representing climate and weather) to standardize the change in risk relative to the present.
The resulting maps show that climate change may increase parasite prevalence sharply at high latitudes and elevations but decrease it moderately at low latitudes (Fig. 3). Predictably, the magnitude of these effects increased at greater RCPs: Changes in parasite prevalence ranged from −22 to +66% at RCP-2.6 (95% of cells warming between 0.21° and 3.57°C) but ranged from −31 to +86% at RCP-8.5 (2.11° and 7.49°C). At RCP-8.5, predictions vary by parasite taxa, although warming is expected to increase parasite prevalence at high latitudes and decrease prevalence at low latitudes across all taxa (Fig. 4). Notably, fungal parasites exhibit the greatest increases in risk at high latitudes and greatest decreases in risk at low latitudes, whereas helminths benefit most from warming overall, decreasing only slightly at low latitudes (similar to predictions generated by Carlson et al. (27). Across all taxa, both our models and predictions found that cold-adapted hosts generally experienced steeper increases in parasite prevalence under warm conditions than warm-adapted hosts experienced under cool conditions, suggesting that climate change–driven increases in parasite prevalence for cold-adapted hosts may exceed decreases in risk for warm-adapted hosts across systems. This pattern might be explained by the shape of most thermal performance curves, which are often left-skewed with a greater per-degree change in performance at temperatures above than below an organism’s thermal optimum (29) [however, see (30) for exceptions]. Boreal zones appear likely to experience the greatest increases in parasite prevalence, adding an additional stressor to a region that is projected to experience some of the most pronounced changes to its climate (28). We caution that our predictions are highly generalized and are only a general expectation for global changes in disease risk under warming, because parasite species are given equal weight in this analysis regardless of their commonness in the environment or pathogenicity. Thus, we recommend against using these maps to make predictions about any single host-parasite system but present them as only a general expectation for global changes in disease occurrence under warming.
Fig. 3. Global projections of shifts in parasite prevalence under climate change.
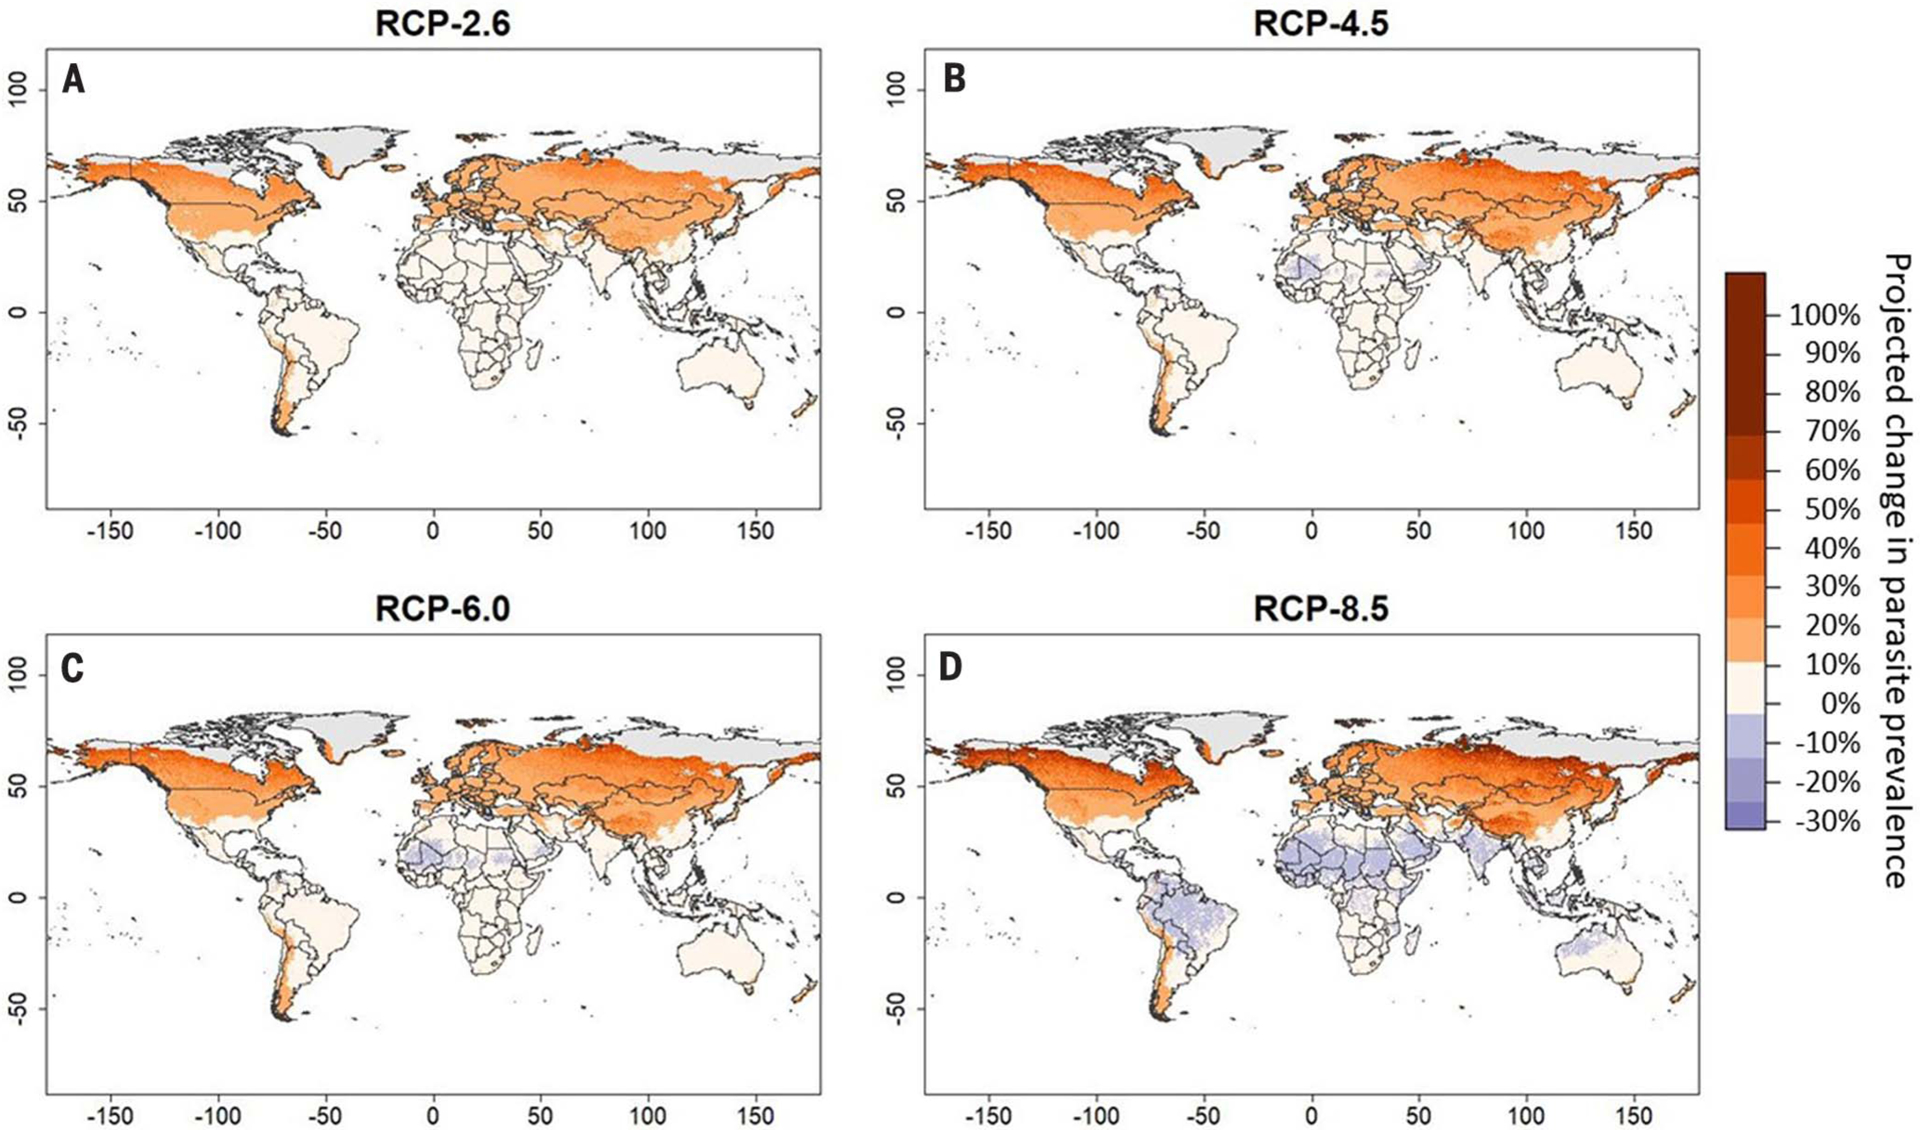
(A to D) Maps display projected change in overall parasite prevalence under four RCPs in 2070: 2.6 (A), 4.5 (B), 6.0 (C), and 8.5 (D). Parasite prevalence predictions were generated for each cell based on a binomial mixed-effects model containing a two-way thermal mismatch interaction between long-term climate and weather. Predictions were generated for the current climate as well as for each RCP scenario, in which projected mean temperatures substituted for survey temperatures. The proportional difference between the two projections is plotted.
Fig. 4. Global projections of shifts in prevalence of four parasite taxa under climate change.
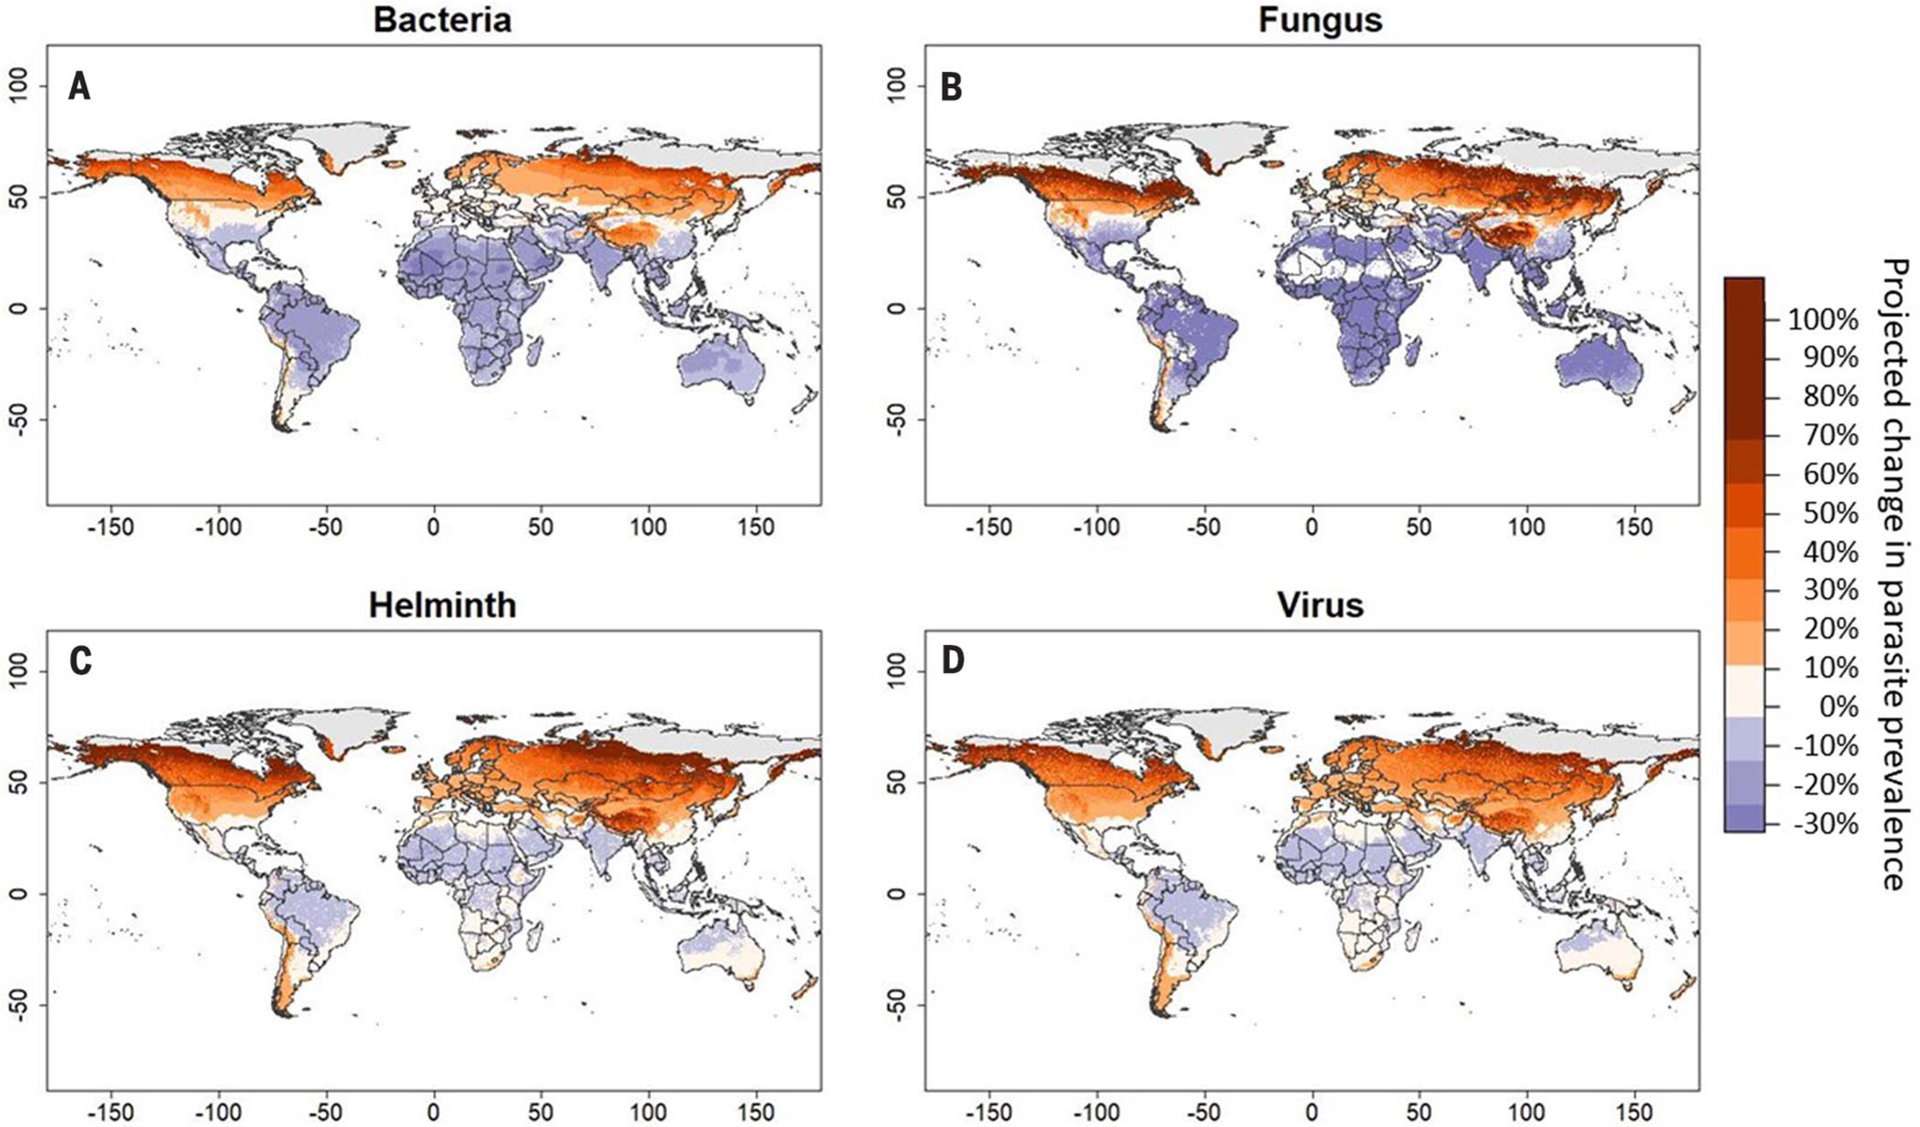
(A to D) Maps display projected changes in parasite prevalence of four taxa—bacteria (A), fungi (B), helminths (C), and viruses (D)—in 2070 under RCP-8.5. Disease risk predictions were generated for each cell based on a binomial mixed-effects model containing a three-way thermal mismatch interaction between long-term climate, weather, and parasite taxa. Predictions were generated for current climate as well as RCP-8.5, and the proportional difference between the two projections is plotted.
Conclusions
Here, we amassed a global spatiotemporal dataset of population-level parasite prevalence across thousands of wildlife populations worldwide and describe how temperature abnormalities influence parasite prevalence across diverse host-parasite systems from disparate climates. We show that cold-adapted hosts may experience increasing parasite prevalence, and thus disease risk, during abnormally warm periods. Meanwhile, risk to warm-adapted hosts may increase during cool periods and mildly decrease during warm periods. Further, these effects are dependent on the identity and traits of the parasite and the host. Our results highlight the complexity of the influences of climate change on diverse host-parasite dynamics, whereas our broad-scale predictions suggest contrasting impacts of climate change across climate zones and diverse parasites. As climate change accelerates, wildlife hosts adapted to cooler or milder climates may suffer increasing risk of infectious disease outbreaks, whereas those adapted to warmer climates could see mild reductions in infectious disease risk.
Materials and methods
Overview of data selection and extraction
We aimed to acquire spatiotemporal datasets describing population-level parasite prevalence across as many host-parasite systems as possible, defining a population as a group of hosts of the same species sampled at a single location and time. Because we aimed to test interacting effects of climate (30-year baseline mean temperature) and weather (temperature at the time of sampling) on host-parasite outcomes at the specific locations of each survey, our dataset was limited to records with information about location (to a 10th of a degree) and date (to month). We further limited our dataset to surveys among animal wildlife, excluding systems with human hosts and farmed or captive animal hosts because of the various complications arising from reporting, medical treatment, and climate-controlled buildings. We excluded any data acquired through antibody tests because these data do not reflect current parasite presence. Because our predictions only hold under intermediate local temperature conditions, we excluded two data points collected during very cold weather (<−10°C; our dataset had no surveys conducted above 30°C). In addition, we excluded marine systems because spatiotemporal data of equivalent resolution are not readily available. Finally, we limited our dataset to definitive hosts.
We used several strategies to gather appropriate datasets, including searching the literature (31–223), searching the internet for available datasets, assembling datasets from scratch for several host-parasite systems that are sampled frequently, and contacting various experts in disease ecology. Our internet search identified five available spatiotemporal datasets that we downloaded: (i) avian malaria data from Malavi (224), (ii) the Global Mammal Parasite Database [GMPD (225)], (iii) fish parasite data from the National Wild Fish Health Survey (NWFHS) database (https://www2.usgs.gov/ecosystems/disease/fishdisease. html), (iv) neotropical avian parasite data presented in Barrow et al. (40), and (v) honeybee data from McMahon et al. (135). We supplemented the Malavi and GMPD datasets with month and year of collection from the original published articles cited for each entry and excluded any entries describing captive hosts or missing geographic coordinates or for which we could not find dates. The NWFHS and Barrow et al. (40) databases were organized at the individual level and needed to be summarized to the population level. When summarizing individual-level data at the population level, we grouped individuals into populations based on species, identical location (geographic coordinates in decimal degrees, rounded to two decimal places), and month.
We also manually collected spatiotemporal survey data from the literature. First, we searched Web of Science for the term “disease survey*,” yielding 1925 results from a wide variety of host-parasite systems, and extracted data from 28 papers that met our criteria. Second, we targeted several host-parasite systems for which we knew data would be available in the literature. We searched Web of Science for the term Batrachochytrium dendrobatidis (Bd), producing 1215 total results and extracting data from 159 papers. We also searched Web of Science for papers relating to iridoviruses, using the terms (“Frog virus 3” OR “Epizootic haematopoietic” OR “necrosis virus” OR “European sheatfish virus” OR “European catfish virus” OR “Regina ranavirus” OR “Santee-Cooper ranavirus” OR “Bohle iridovirus” OR “Red sea bream iridovirus” OR “White sturgeon iridovirus” OR “ranavirus”), obtaining 612 results and extracting data from 29 papers that reported iridovirus prevalence. Despite the focus on Bd and iridovirus, they accounted for only 21 and 5% of our dataset, respectively. We screened all papers using the metagear package (226) in R 3.4.2 (227) and manually extracted relevant data. All literature searches and data collection associated with these searches took place between May 2018 and February 2019, and all data were combined into a single dataset for analysis.
When extracting data from papers and databases, we recorded host and parasite species, number of hosts sampled, host life stage, number of infected and uninfected individuals or infection prevalence (if only one was given, the other was calculated), date of sampling, and geographic coordinates. When coordinates were not given in a paper or database, we searched named sites for coordinates on Google Maps. We only included field surveys conducted over a continuous period up to a maximum of 4 months and up to a maximum area of 50 km2 to ensure that weather data were local and sufficiently short term. We collected taxonomic information and standardized all classifications according to the International Union for Conservation of Nature [IUCN (228)]. Prevalence data was bimodally distributed in our dataset, with many populations having no infection or 100% infection, and this pattern was consistent across time periods (fig. S9). Surveys were most common in summer regardless of latitude, though there was some variation (fig. S10).
We classified all parasites as either bacteria, viruses, protozoa, helminths, arthropods, or fungi (hereafter referred to as “parasite taxa”) and classified them as having either direct or indirect life cycles. All hosts were classified as either ecto- or endothermic, terrestrial or aquatic, and migratory (long-distance migrants) or nonmigratory (short-distance migrants or residents). Amphibian habitat associations were classified based on Sodhi et al. (229). Birds were classified as terrestrial except for species in the orders Anseriformes, Charadriiformes (family Laridae only), Gaviiformes, Pelecaniformes, and Sphenisciformes (other aquatic taxa were not present in our dataset). Mammals, reptiles, and insects were assessed at the species level on the basis of the judgment of the data collectors. See below for definitions of the classifications.
Climate data
We extracted historic monthly mean temperature and total precipitation data from the University of East Anglia Climate Research Unit [CRU (20)] for the location and specific month(s) that each population was tested in the field [raster package (230)]. CRU data are the finest-scale global, historic climate data available, offered at a resolution of 0.5°2 cells (about 50 km2) for each month dating to 1901. If sampling took place over the course of up to four consecutive months or less, and was not reported at the monthly level, then we averaged climate data across the sampling months. We did not use data collected over longer periods of time because doing so would have been inappropriate to seasonal analysis.
We collected annual mean temperature between 1970 and 2000 for each population (as a representative of mean temperature in their climate) on the basis of their locations using interpolated Worldclim rasters (21), which have been used in hundreds of previous ecological studies to represent long-term climate means. Long-term annual temperatures in the range of a species are a useful approximation of thermal tolerance (19, 231). Though the time period is somewhat arbitrary, such high-resolution historic data are not available at a global scale for other time periods. In our view, this window adequately represents the historic mean conditions in a given area to which an organism has likely adapted.
Statistical analyses
All analyses were conducted in R 3.4.2 (227). We fit a series of four generalized linear mixed-effects models (GLMMs) with binomial distributions to test relationships between thermal mismatches, host or parasite traits, and parasite prevalence in wildlife using the package glmmTMB (232). Thermal mismatches were represented in models as statistical interactions between 30-year mean temperature (representing climate) and monthly mean temperature during sampling (representing weather) for a given host population at the location it was sampled. Because we expect that hosts adapted to warm conditions should have the greatest parasite prevalence under cool conditions and vice versa, the estimate of the coefficient of the two-way thermal mismatch interaction is hypothesized to be negative. In our five models, we tested for effects of three-way interactions (the thermal mismatch interactors and one of five host or parasite traits) on the number of infected and uninfected hosts (binomial response variable). Host or parasite traits were each categorical factors—either host thermal biology (ecto- or endotherm), host habitat type (summarized as terrestrial or aquatic based on where the host spends a majority of its time at its tested life stage), host migratory strategy (migratory or nonmigratory), parasite transmission complexity (direct or indirect; the latter representing parasites that are vector-transmitted or requiring an intermediate host), or parasite taxa (limited to virus, bacteria, fungus, protozoa, or helminth). Our goal in assessing the impacts of migration was to determine whether hosts migrating long distances were less affected by thermal mismatches, because they experience a greater range of climates than other species; thus, we considered all hosts migrating on average >200 km per year to be migratory (a category that included some birds, mammals, and fish) and others to be nonmigratory, even if they do migrate shorter distances. In the model testing for an interaction between thermal mismatch and parasite taxa, we subsetted the data to exclude insect parasitoids and protozoans because these categories were not fully crossed with our other fixed effects. We did not explicitly test for differences in relationships across host taxa because of redundancy between taxonomic group and our other traits, and we did not compare zoonotic systems with others because we lacked sufficient data in zoonotic systems.
In each model, we included the following as fixed effects: the absolute value of latitude, log-transformed total precipitation during the month(s) of sampling, and the other host or parasite traits that were not part of the three-way thermal mismatch interaction (excluding parasite transmission mode, which is highly redundant with parasite taxa). Because studies contained varying numbers of surveys, study was included as a random effect to account for nonindependence among sampling events within a study. Further, we included host taxonomic class as a random effect to ensure that outsized effects of a single taxonomic group did not sway the outcome of the models. Unfortunately, traditional phylogenetic correlation structures cannot be included in mixed models with a binomial error distribution because the distribution is only defined by a single parameter specifying both the mean and variance, whereas correlation structures affect only variance parameters.
To evaluate the importance of the thermal mismatch and its dependence on host, parasite, and environmental traits, we compared among nested models using AIC scores, Nagelkerke’s pseudo-_R_2 values [MuMIn package (233)], and chi-square values. Because highly complex models with partially correlated predictor variables can sometimes produce spurious results (though this is less of a concern when analyzing large datasets), we explored fitting simplified models corresponding to each of the five primary models that did not include any host or parasite taxa or traits other than main effects of terms included in interactions but were otherwise identical. Additionally, we explored fitting models in which major host taxa (birds, mammals, amphibians, invertebrates, and fish) were equally represented by randomly subsampling 2000 rows from the original data-set for each category. All results were visualized using the visreg package (234).
Spatial structure of the data
Unfortunately, the size of our dataset made controlling for spatial structure computationally unfeasible (requires accounting for >56 million distance estimates per model). Instead, we generated correlograms to evaluate spatial autocorrelation (Moran’s I) at a sequence of distances up to 30° from each point. To reduce the computational burden, which increases exponentially with the number of records, we randomly subsampled 1000 rows from our dataset nine times and produced correlograms for each subsample [ncf package (235)].
Climate change projections
We generated two sets of global maps, projecting future change in parasite prevalence at four RCPs (different possible greenhouse gas trajectories predicted by climate models, with RCP-2.6 representing an optimistic climate change scenario and RCP-8.5 representing a business-as-usual model) or for four parasite taxa (bacteria, fungi, helminth, and virus). The RCP maps were based on a GLMM that tests how the two-way interaction between 30-year mean temperature and temperature during surveying predicts population-level parasite prevalence [glmmTMB package (232)]. The model contained log-transformed monthly precipitation and study as a random effect, though we did not include categorical fixed effects because this would necessitate assuming categorical values of host or parasite traits while generating model predictions and our goal was to keep the predictions general (study ID was randomized when making predictions). We first generated predictions for all cells on a global map (aggregated by mean to 0.21°2 resolution) based on projections of 2070 annual mean temperature at four RCP scenarios (2.6, 4.5, 6.0, and 8.5) by the Community Climate System Model, version 4 [CCSM4 (28)]. For each cell, we used Bioclim 30-year mean temperature [bio1 (21)] as 30-year mean temperature and CCSM4 bio1 projections as the temperature during surveying. We then divided each of these by a “current climate” projection in which Bioclim 30-year mean temperature was used for both temperature variables. Resulting rasters show change in parasite prevalence globally and were plotted using the raster package (230) and color palettes from RColorBrewer (236).
Projections of parasite prevalence by taxa were based on a GLMM that tests the three-way interaction between both temperature terms and parasite taxa, a categorical variable with the four levels given above. Predictions were generated for current and future climate (RCP-8.5) based on 30-year temperature and temperature during sampling, respectively. All other methods were identical to those described above.
Supplementary Material
Suppl Mat
ACKNOWLEDGMENTS
We thank all of those who assembled disease or climatic datasets that were used in the analysis. We also thank E. Mordecai, T. Raffel, and the Rohr lab for their insightful thoughts on the manuscript.
Funding:
Funds were provided by grants to J.R.R. from the National Science Foundation (EF-1241889 and DEB-1518681) and the National Institutes of Health (R01TW010286-01).
Footnotes
Competing interests: The authors declare no competing interests.
Data and materials availability:
All data and code compiled for this study are available on Github (223).
REFERENCES AND NOTES
- 1.Intergovernmental Panel on Climate Change (IPCC), “Climate change 2014: Synthesis report. Contribution of Working Groups I, II and III to the fifth assessment report of the Intergovernmental Panel on Climate Change,” Core Writing Team, Pachauri RK, Meyer LA, Eds. (IPCC, Geneva, 2014). [Google Scholar]
- 2.Jones KE et al. , Global trends in emerging infectious diseases. Nature 451, 990–993 (2008). doi: 10.1038/nature06536; [DOI] [PMC free article] [PubMed] [Google Scholar]
- 3.Liang L, Gong P, Climate change and human infectious diseases: A synthesis of research findings from global and spatio-temporal perspectives. Environ. Int 103, 99–108 (2017). doi: 10.1016/j.envint.2017.03.011; [DOI] [PubMed] [Google Scholar]
- 4.Rohr JR et al. , Frontiers in climate change-disease research. Trends Ecol. Evol 26, 270–277 (2011). doi: 10.1016/j.tree.2011.03.002; [DOI] [PMC free article] [PubMed] [Google Scholar]
- 5.Altizer S, Ostfeld RS, Johnson PTJ, Kutz S, Harvell CD, Climate change and infectious diseases: From evidence to a predictive framework. Science 341, 514–519 (2013). doi: 10.1126/science.1239401; [DOI] [PubMed] [Google Scholar]
- 6.Lafferty KD, Mordecai EA, The rise and fall of infectious disease in a warmer world. F1000 Res. 5, 2040 (2016). doi: 10.12688/f1000research.8766.1; [DOI] [PMC free article] [PubMed] [Google Scholar]
- 7.Ryan SJ, Carlson CJ, Mordecai EA, Johnson LR, Global expansion and redistribution of Aedes-borne virus transmission risk with climate change. PLOS Negl. Trop. Dis 13, e0007213 (2019). doi: 10.1371/journal.pntd.0007213; [DOI] [PMC free article] [PubMed] [Google Scholar]
- 8.Paull SH, Johnson PT, Experimental warming drives a seasonal shift in the timing of host-parasite dynamics with consequences for disease risk. Ecol. Lett 17, 445–453 (2014). doi: 10.1111/ele.12244; [DOI] [PubMed] [Google Scholar]
- 9.Raffel TR et al. , Disease and thermal acclimation in a more variable and unpredictable climate. Nat. Clim. Chang 3, 146–151 (2013). doi: 10.1038/nclimate1659 [DOI] [Google Scholar]
- 10.Greenspan SE et al. , Infection increases vulnerability to climate change via effects on host thermal tolerance. Sci. Rep 7, 9349 (2017). doi: 10.1038/s41598-017-09950-3; [DOI] [PMC free article] [PubMed] [Google Scholar]
- 11.Johnson PT, de Roode JC, Fenton A, Why infectious disease research needs community ecology. Science 349, 1259504 (2015). doi: 10.1126/science.1259504; [DOI] [PMC free article] [PubMed] [Google Scholar]
- 12.Cohen JM et al. , Impacts of thermal mismatches on chytrid fungus Batrachochytrium dendrobatidis prevalence are moderated by life stage, body size, elevation and latitude. Ecol. Lett 22, 817–825 (2019). doi: 10.1111/ele.13239; [DOI] [PubMed] [Google Scholar]
- 13.Cohen JM et al. , The thermal mismatch hypothesis explains host susceptibility to an emerging infectious disease. Ecol. Lett 20, 184–193 (2017). doi: 10.1111/ele.12720; [DOI] [PubMed] [Google Scholar]
- 14.Cohen JM, Civitello DJ, Venesky MD, McMahon TA, Rohr JR, An interaction between climate change and infectious disease drove widespread amphibian declines. Glob. Change Biol 25, 927–937 (2019). doi: 10.1111/gcb.14489; [DOI] [PubMed] [Google Scholar]
- 15.Rohr JR et al. , The complex drivers of thermal acclimation and breadth in ectotherms. Ecol. Lett 21, 1425–1439 (2018). doi: 10.1111/ele.13107; [DOI] [PubMed] [Google Scholar]
- 16.Lloyd-Smith JO et al. , Should we expect population thresholds for wildlife disease? Trends Ecol. Evol 20, 511–519 (2005). doi: 10.1016/j.tree.2005.07.004; [DOI] [PubMed] [Google Scholar]
- 17.Sauer EL et al. , Variation in individual temperature preferences, not behavioural fever, affects susceptibility to chytridiomycosis in amphibians. Proc. Biol. Sci 285, 20181111 (2018). doi: 10.1098/rspb.2018.1111; [DOI] [PMC free article] [PubMed] [Google Scholar]
- 18.Sauer EL et al. , A meta-analysis reveals temperature, dose, life stage, and taxonomy influence host susceptibility to a fungal parasite. Ecology 101, e02979 (2020). doi: 10.1002/ecy.2979; [DOI] [PubMed] [Google Scholar]
- 19.Deutsch CA et al. , Impacts of climate warming on terrestrial ectotherms across latitude. Proc. Natl. Acad. Sci. U.S.A 105, 6668–6672 (2008). doi: 10.1073/pnas.0709472105; [DOI] [PMC free article] [PubMed] [Google Scholar]
- 20.Harris I, Jones PD, Osborn TJ, Lister DH, Updated high-resolution grids of monthly climatic observations—the CRU TS3.10 dataset. Int. J. Climatol 34, 623–642 (2014). doi: 10.1002/joc.3711 [DOI] [Google Scholar]
- 21.Fick SE, Hijmans RJ, WorldClim 2: New 1-km spatial resolution climate surfaces for global land areas. Int. J. Climatol 37, 4302–4315 (2017). doi: 10.1002/joc.5086 [DOI] [Google Scholar]
- 22.Morley NJ, Lewis JW, Temperature stress and parasitism of endothermic hosts under climate change. Trends Parasitol. 30, 221–227 (2014). doi: 10.1016/j.pt.2014.01.007; [DOI] [PubMed] [Google Scholar]
- 23.Dalziel BD et al. , Urbanization and humidity shape the intensity of influenza epidemics in U.S. cities. Science 362, 75–79 (2018). doi: 10.1126/science.aat6030; [DOI] [PMC free article] [PubMed] [Google Scholar]
- 24.Nickus U, Bishop K, Erlandsson M, Evans CD, Forsius M, Laudon H, Livingstone DM, Monteith D, Thies H, “Direct impacts of climate change on freshwater ecosystems” in Climate Change Impacts on Freshwater Ecosystems, Kernan M, Battarbee RW, Moss B, Eds. (2010), pp. 38–64. [Google Scholar]
- 25.Deacon JW, Fungal Biology (Wiley, 2013). [Google Scholar]
- 26.Anderson RM, Mercer JG, Wilson RA, Carter NP, Transmission of Schistosoma mansoni from man to snail: Experimental studies of miracidial survival and infectivity in relation to larval age, water temperature, host size and host age. Parasitology 85, 339–360 (1982). doi: 10.1017/S0031182000055323; [DOI] [PubMed] [Google Scholar]
- 27.Carlson CJ et al. , Parasite biodiversity faces extinction and redistribution in a changing climate. Sci. Adv 3, e1602422 (2017). doi: 10.1126/sciadv.1602422; [DOI] [PMC free article] [PubMed] [Google Scholar]
- 28.Gent PR et al. , The community climate system model version 4. J. Clim 24, 4973–4991 (2011). doi: 10.1175/2011JCLI4083.1 [DOI] [Google Scholar]
- 29.Angilletta MJ Jr., Estimating and comparing thermal performance curves. J. Therm. Biol 31, 541–545 (2006). doi: 10.1016/j.jtherbio.2006.06.002 [DOI] [Google Scholar]
- 30.Molnár PK, Dobson AP, Kutz SJ, Gimme shelter—The relative sensitivity of parasitic nematodes with direct and indirect life cycles to climate change. Glob. Change Biol 19, 3291–3305 (2013). doi: 10.1111/gcb.12303; [DOI] [PubMed] [Google Scholar]
- 31.Aguirre AA et al. , Pathology of fibropapillomatosis in olive ridley turtles Lepidochelys olivacea nesting in Costa Rica. J. Aquat. Anim. Health 11, 283–289 (1999). doi: [DOI] [Google Scholar]
- 32.Al-Sabi MN et al. , PCR detection of Angiostrongylus vasorum in faecal samples of dogs and foxes. Parasitol. Res 107, 135–140 (2010). doi: 10.1007/s00436-010-1847-5; [DOI] [PubMed] [Google Scholar]
- 33.Anderson T, DeJardin A, Howe DK, Dubey JP, Michalski ML, Neospora caninum antibodies detected in Midwestern white-tailed deer (Odocoileus virginianus) by Western blot and ELISA. Vet. Parasitol 145, 152–155 (2007). doi: 10.1016/j.vetpar.2006.11.012; [DOI] [PubMed] [Google Scholar]
- 34.Arjo WM, Gese EM, Bromley C, Kozlowski A, Williams ES, Serologic survey for diseases in free-ranging coyotes (Canis latrans) from two ecologically distinct areas of Utah. J. Wildl. Dis 39, 449–455 (2003). doi: 10.7589/0090-3558-39.2.449; [DOI] [PubMed] [Google Scholar]
- 35.Asmundsson IM, Mortenson JA, Hoberg EP, Muscleworms, Parelaphostrongylus andersoni (Nematoda: Protostrongylidae), discovered in Columbia white-tailed deer from Oregon and Washington: implications for biogeography and host associations. J. Wildl. Dis 44, 16–17 (2008). doi: 10.7589/0090-3558-44.1.16; [DOI] [PubMed] [Google Scholar]
- 36.Bain O, Wahl G, Renz A, Onchocerca ramachandrini n. sp. from the warthog in Cameroon. Ann. Parasitol. Hum. Comp 68, 139–143 (1993). doi: 10.1051/parasite/1993683139 [DOI] [Google Scholar]
- 37.Banks SM, Ashley DC, Parelaphostrongyliasis in white-tailed deer in Missouri. J. Wildl. Dis 36, 562–564 (2000). doi: 10.7589/0090-3558-36.3.562; [DOI] [PubMed] [Google Scholar]
- 38.Barlough JE et al. , Antibodies to marine caliciviruses in the Steller sea lion (Eumetopias jubatus Schreber). J. Wildl. Dis 23, 34–44 (1987). doi: 10.7589/0090-3558-23.1.34; [DOI] [PubMed] [Google Scholar]
- 39.Barlough JE et al. , Isolation of reptilian calicivirus Crotalus type 1 from feral pinnipeds. J. Wildl. Dis 34, 451–456 (1998). doi: 10.7589/0090-3558-34.3.451; [DOI] [PubMed] [Google Scholar]
- 40.Barrow LN et al. , Deeply conserved susceptibility in a multi-host, multi-parasite system. Ecol. Lett 22, 987–998 (2019). doi: 10.1111/ele.13263; [DOI] [PubMed] [Google Scholar]
- 41.Beck R et al. , Trichinellosis in wolves from Croatia. Vet. Parasitol 159, 308–311 (2009). doi: 10.1016/j.vetpar.2008.10.068; [DOI] [PubMed] [Google Scholar]
- 42.Beldomenico PM et al. , Internal parasites of free-ranging guanacos from Patagonia. Vet. Parasitol 118, 71–77 (2003). doi: 10.1016/j.vetpar.2003.09.008; [DOI] [PubMed] [Google Scholar]
- 43.Bender LC, Hall PB, Leptospira interrogans exposure in free-ranging elk in Washington. J. Wildl. Dis 32, 121–124 (1996). doi: 10.7589/0090-3558-32.1.121; [DOI] [PubMed] [Google Scholar]
- 44.Bender LC, Li H, Thompson BC, Morrow PC, Valdez R, Infectious disease survey of gemsbok in New Mexico. J. Wildl. Dis 39, 772–778 (2003). doi: 10.7589/0090-3558-39.4.772; [DOI] [PubMed] [Google Scholar]
- 45.Beringer J, Hansen LP, Stallknecht DE, An epizootic of hemorrhagic disease in white-tailed deer in Missouri. J. Wildl. Dis 36, 588–591 (2000). doi: 10.7589/0090-3558-36.3.588; [DOI] [PubMed] [Google Scholar]
- 46.Berón-Vera B, Crespo EA, Raga JA, Pedraza SN, Uncinaria hamiltoni (Nematoda: Ancylostomatidae) in South American sea lions, Otaria flavescens, from northern Patagonia, Argentina. J. Parasitol 90, 860–863 (2004). doi: 10.1645/GE-182R; [DOI] [PubMed] [Google Scholar]
- 47.Blanc A et al. , Serologic evidence of influenza A and B viruses in South American fur seals (Arctocephalus australis). J. Wildl. Dis 45, 519–521 (2009). doi: 10.7589/0090-3558-45.2.519; [DOI] [PubMed] [Google Scholar]
- 48.Borchers K, Frölich K, Antibodies against equine herpesviruses in free-ranging mountain zebras from Namibia. J. Wildl. Dis 33, 812–817 (1997). doi: 10.7589/0090-3558-33.4.812; [DOI] [PubMed] [Google Scholar]
- 49.Borst GH, Walvoort HC, Reijnders PJ, van der Kamp JS, Osterhaus AD, An outbreak of a herpesvirus infection in harbor seals (Phoca vitulina). J. Wildl. Dis 22, 1–6 (1986). doi: 10.7589/0090-3558-22.1.1; [DOI] [PubMed] [Google Scholar]
- 50.Burton EC, Miller DL, Styer EL, Gray MJ, Amphibian ocular malformation associated with frog virus 3. Vet. J 177, 442–444 (2008). doi: 10.1016/j.tvjl.2007.05.006; [DOI] [PubMed] [Google Scholar]
- 51.Cadavid-Sanchez IC, Amat E, Gomez-Piñerez LM, Enterobacteria isolated from synanthropic flies (Diptera, Calyptratae) in Medellín, Colombia. Caldasia 37, 319–332 (2015). doi: 10.15446/caldasia.v37n2.53594 [DOI] [Google Scholar]
- 52.Cameron SA et al. , Patterns of widespread decline in North American bumble bees. Proc. Natl. Acad. Sci. U.S.A 108, 662–667 (2011). doi: 10.1073/pnas.1014743108; [DOI] [PMC free article] [PubMed] [Google Scholar]
- 53.Candela MG et al. , Pathogens of zoonotic and biological importance in roe deer (Capreolus capreolus): Seroprevalence in an agro-system population in France. Res. Vet. Sci 96, 254–259 (2014). doi: 10.1016/j.rvsc.2014.02.003; [DOI] [PubMed] [Google Scholar]
- 54.Carpi G, Cagnacci F, Neteler M, Rizzoli A, Tick infestation on roe deer in relation to geographic and remotely sensed climatic variables in a tick-borne encephalitis endemic area. Epidemiol. Infect 136, 1416–1424 (2008). doi: 10.1017/S0950268807000039; [DOI] [PMC free article] [PubMed] [Google Scholar]
- 55.Courtenay O et al. , Is Mycobacterium bovis in the environment important for the persistence of bovine tuberculosis? Biol. Lett 2, 460–462 (2006). doi: 10.1098/rsbl.2006.0468; [DOI] [PMC free article] [PubMed] [Google Scholar]
- 56.Currylow AF, Johnson AJ, Williams RN, Evidence of ranavirus infections among sympatric larval amphibians and box turtles. J. Herpetol 48, 117–121 (2014). doi: 10.1670/12-235 [DOI] [Google Scholar]
- 57.D’Aoust-Messier AM, Echaubard P, Billy V, Lesbarrères D, Amphibian pathogens at northern latitudes: Presence of chytrid fungus and ranavirus in northeastern Canada. Dis. Aquat. Organ 113, 149–155 (2015). doi: 10.3354/dao02837; [DOI] [PubMed] [Google Scholar]
- 58.Dautel H, Dippel C, Oehme R, Hartelt K, Schettler E, Evidence for an increased geographical distribution of Dermacentor reticulatus in Germany and detection of Rickettsia sp. RpA4. Int. J. Med. Microbiol 296 (suppl. 40), 149–156 (2006). doi: 10.1016/j.ijmm.2006.01.013; [DOI] [PubMed] [Google Scholar]
- 59.Davidson WR, Crum JM, Blue JL, Sharp DW, Phillips JH, Parasites, diseases, and health status of sympatric populations of fallow deer and white-tailed deer in Kentucky. J. Wildl. Dis 21, 153–159 (1985). doi: 10.7589/0090-3558-21.2.153; [DOI] [PubMed] [Google Scholar]
- 60.de la Fuente J et al. , Evidence of Anaplasma infections in European roe deer (Capreolus capreolus) from southern Spain. Res. Vet. Sci 84, 382–386 (2008). doi: 10.1016/j.rvsc.2007.05.018; [DOI] [PubMed] [Google Scholar]
- 61.Deem SL, Noss AJ, Villarroel R, Uhart MM, Karesh WB, Disease survey of free-ranging grey brocket deer (Mazama gouazoubira) in the Gran Chaco, Bolivia. J. Wildl. Dis 40, 92–98 (2004). doi: 10.7589/0090-3558-40.1.92; [DOI] [PubMed] [Google Scholar]
- 62.Doherty-Bone TM et al. , Morbidity and mortality of the Critically Endangered Lake Oku clawed frog Xenopus longipes. Endanger. Species Res 21, 115–128 (2013). doi: 10.3354/esr00514 [DOI] [Google Scholar]
- 63.Dubey JP et al. , Biologic and molecular characteristics of Toxoplasma gondii isolates from striped skunk (Mephitis mephitis), Canada goose (Branta canadensis), black-winged lory (Eos cyanogenia), and cats (Felis catus). J. Parasitol 90, 1171–1174 (2004). doi: 10.1645/GE-340R; [DOI] [PubMed] [Google Scholar]
- 64.Dubey JP et al. , Isolation and genetic characterization of Toxoplasma gondii from raccoons (Procyon lotor), cats (Felis domesticus), striped skunk (Mephitis mephitis), black bear (Ursus americanus), and cougar (Puma concolor) from Canada. J. Parasitol 94, 42–45 (2008). doi: 10.1645/GE-1349.1; [DOI] [PubMed] [Google Scholar]
- 65.Duffus ALJ, Pauli BD, Wozney K, Brunetti CR, Berrill M, Frog virus 3-like infections in aquatic amphibian communities. J. Wildl. Dis 44, 109–120 (2008). doi: 10.7589/0090-3558-44.1.109; [DOI] [PubMed] [Google Scholar]
- 66.Durden LA, Richardson DJ, Ectoparasites of the striped skunk, Mephitis mephitis, in Connecticut, USA. Comp. Parasitol 70, 42–45 (2003). doi: 10.1654/1525-2647(2003)070[0042:EOTSSM]2.0.CO;2 [DOI] [Google Scholar]
- 67.Dyer NW, Huffman LE, Plague in free-ranging mammals in western North Dakota. J. Wildl. Dis 35, 600–602 (1999). doi: 10.7589/0090-3558-35.3.600; [DOI] [PubMed] [Google Scholar]
- 68.Epstein JH et al. , Identification of GBV-D, a novel GB-like flavivirus from old world frugivorous bats (Pteropus giganteus) in Bangladesh. PLOS Pathog 6, e1000972 (2010). doi: 10.1371/journal.ppat.1000972; [DOI] [PMC free article] [PubMed] [Google Scholar]
- 69.Farajollahi A et al. , Serologic evidence of West Nile virus infection in black bears (Ursus americanus) from New Jersey. J. Wildl. Dis 39, 894–896 (2003). doi: 10.7589/0090-3558-39.4.894; [DOI] [PubMed] [Google Scholar]
- 70.Fernández M et al. , High prevalence of haemosporidians in reed warbler Acrocephalus scirpaceus and sedge warbler Acrocephalus schoenobaenus in Spain. J. Ornithol 151, 27–32 (2010). doi: 10.1007/s10336-009-0417-z [DOI] [Google Scholar]
- 71.Ferrer ES, García-Navas V, Sanz JJ, Ortego J, Molecular characterization of avian malaria parasites in three Mediterranean blue tit (Cyanistes caeruleus) populations. Parasitol. Res 111, 2137–2142 (2012). doi: 10.1007/s00436-012-3062-z; [DOI] [PubMed] [Google Scholar]
- 72.Ferroglio E, Tolari F, Bollo E, Bassano B, Isolation of Brucella melitensis from alpine ibex. J. Wildl. Dis 34, 400–402 (1998). doi: 10.7589/0090-3558-34.2.400; [DOI] [PubMed] [Google Scholar]
- 73.Forzán MJ, Wood J, Low detection of ranavirus DNA in wild postmetamorphic green frogs, Rana (Lithobates) clamitans, despite previous or concurrent tadpole mortality. J. Wildl. Dis 49, 879–886 (2013). doi: 10.7589/2013-03-051; [DOI] [PubMed] [Google Scholar]
- 74.Fox SF, Greer AL, Torres-Cervantes R, Collins JP, First case of ranavirus-associated morbidity and mortality in natural populations of the South American frog Atelognathus patagonicus. Dis. Aquat. Organ 72, 87–92 (2006). doi: 10.3354/dao072087; [DOI] [PubMed] [Google Scholar]
- 75.Gaetano TJ et al. , Mapping correlates of parasitism in wild South African vervet monkeys (Chlorocebus aethiops). Afr. J. Wildl. Res 44, 56–70 (2014). doi: 10.3957/056.044.0105 [DOI] [Google Scholar]
- 76.Gauthier-Clerc M et al. , Serological survey of the king penguin, Aptenodytes patagonicus, in Crozet Archipelago for antibodies to infectious bursal disease, influenza A and Newcastle disease viruses. Polar Biol 25, 316–319 (2002). doi: 10.1007/s00300-001-0346-7 [DOI] [Google Scholar]
- 77.Gimeno A, Meikl M, Pitt A, Winkler M, Berninger U-G, Testing of fire salamanders around Salzburg for Batrachochytrium salamandrivorans within a school project. Eco. Mont 7, 72–76 (2015). doi: 10.1553/eco.mont-7-1s72 [DOI] [Google Scholar]
- 78.Good KM, Houser A, Arntzen L, Turnbull PC, Naturally acquired anthrax antibodies in a cheetah (Acinonyx jubatus) in Botswana. J. Wildl. Dis 44, 721–723 (2008). doi: 10.7589/0090-3558-44.3.721; [DOI] [PubMed] [Google Scholar]
- 79.Goodman RM, Miller DL, Ararso YT, Prevalence of ranavirus in Virginia turtles as detected by tail-clip sampling versus oral-cloacal swabbing. Northeast. Nat 20, 325–332 (2013). doi: 10.1656/045.020.0208 [DOI] [Google Scholar]
- 80.Gortázar C, Villafuerte R, Blanco J, Fernández-De-Luco D, Enzootic sarcoptic mange in red foxes in Spain. Z. Jagdwiss 44, 251–256 (1998). [Google Scholar]
- 81.Gray MJ, Miller DL, Hoverman JT, First report of ranavirus infecting lungless salamanders. Herpetol. Rev 40, 316 (2009). [Google Scholar]
- 82.Greer AL, Brunner JL, Collins JP, Spatial and temporal patterns of Ambystoma tigrinum virus (ATV) prevalence in tiger salamanders Ambystoma tigrinum nebulosum. Dis. Aquat. Organ 85, 1–6 (2009). doi: 10.3354/dao02061; [DOI] [PubMed] [Google Scholar]
- 83.Gresham CS, Gresham CA, Duffy MJ, Faulkner CT, Patton S, Increased prevalence of Brucella suis and pseudorabies virus antibodies in adults of an isolated feral swine population in coastal South Carolina. J. Wildl. Dis 38, 653–656 (2002). doi: 10.7589/0090-3558-38.3.653; [DOI] [PubMed] [Google Scholar]
- 84.Grimstad PR, Schmitt SM, Williams DG, Prevalence of neutralizing antibody to Jamestown Canyon virus (California group) in populations of elk and moose in northern Michigan and Ontario, Canada. J. Wildl. Dis 22, 453–458 (1986). doi: 10.7589/0090-3558-22.4.453; [DOI] [PubMed] [Google Scholar]
- 85.Guislain M-H et al. , Ecological and biological factors involved in the transmission of Echinococcus multilocularis in the French Ardennes. J. Helminthol 82, 143–151 (2008). doi: 10.1017/S0022149X08912384; [DOI] [PubMed] [Google Scholar]
- 86.Hall EM, Crespi EJ, Goldberg CS, Brunner JL, Evaluating environmental DNA-based quantification of ranavirus infection in wood frog populations. Mol. Ecol. Resour 16, 423–433 (2016). doi: 10.1111/1755-0998.12461; [DOI] [PubMed] [Google Scholar]
- 87.Hamir AN, Snyder DE, Lichtenfels JR, Cerebral larva migrans in a raccoon (Procyon lotor). Vet. Pathol 36, 618–620 (1999). doi: 10.1354/vp.36-6-618; [DOI] [PubMed] [Google Scholar]
- 88.Hammer AS, Dietz HH, Andersen TH, Nielsen L, Blixenkrone-Moeller M, Distemper virus as a cause of central nervous disease and death in badgers (Meles meles) in Denmark. Vet. Rec 154, 527–530 (2004). doi: 10.1136/vr.154.17.527; [DOI] [PubMed] [Google Scholar]
- 89.Henton MM, Zapke O, Basson PA, Streptococcus phocae infections associated with starvation in Cape fur seals. J. S. Afr. Vet. Assoc 70, 98–99 (1999). doi: 10.4102/jsava.v70i2.763; [DOI] [PubMed] [Google Scholar]
- 90.Hlinak A et al. , Serological survey of viral pathogens in bean and white-fronted geese from Germany. J. Wildl. Dis 34, 479–486 (1998). doi: 10.7589/0090-3558-34.3.479; [DOI] [PubMed] [Google Scholar]
- 91.Hoberg EP, Aubry KB, Brittell JD, Helminth parasitism in martens (Martes americana) and ermines (Mustela erminea) from Washington, with comments on the distribution of Trichinella spiralis. J. Wildl. Dis 26, 447–452 (1990). doi: 10.7589/0090-3558-26.4.447; [DOI] [PubMed] [Google Scholar]
- 92.Hoeve J, Joachim DG, Addison EM, Parasites of moose (Alces alces) from an agricultural area of eastern Ontario. J. Wildl. Dis 24, 371–374 (1988). doi: 10.7589/0090-3558-24.2.371; [DOI] [PubMed] [Google Scholar]
- 93.Hofmeyr M, Hofmeyr D, Nel L, Bingham J, A second outbreak of rabies in African wild dogs (Lycaon pictus) in Madikwe Game Reserve, South Africa, demonstrating the efficacy of vaccination against natural rabies challenge. Anim. Conserv 7, 193–198 (2004). doi: 10.1017/S1367943004001234 [DOI] [Google Scholar]
- 94.Holz PH et al. , Virus survey in populations of two subspecies of bent-winged bats (Miniopterus orianae bassanii and oceanensis) in south-eastern Australia reveals a high prevalence of diverse herpesviruses. PLOS ONE 13, e0197625 (2018). doi: 10.1371/journal.pone.0197625; [DOI] [PMC free article] [PubMed] [Google Scholar]
- 95.Hoverman JT, Gray MJ, Miller DL, Haislip NA, Widespread occurrence of ranavirus in pond-breeding amphibian populations. EcoHealth 9, 36–48 (2012). doi: 10.1007/s10393-011-0731-9; [DOI] [PubMed] [Google Scholar]
- 96.Ionita M, Varela MG, Lyons ET, Spraker TR, Tolliver SC, Hookworms (Uncinaria lucasi) and acanthocephalans (Corynosoma spp. and Bolbosoma spp.) found in dead northern fur seals (Callorhinus ursinus) on St. Paul Island, Alaska in 2007. Parasitol. Res 103, 1025–1029 (2008). doi: 10.1007/s00436-008-1087-0; [DOI] [PubMed] [Google Scholar]
- 97.Ishiwata K et al. , Gnathostomiasis in wild boars from Japan. J. Wildl. Dis 34, 155–157 (1998). doi: 10.7589/0090-3558-34.1.155; [DOI] [PubMed] [Google Scholar]
- 98.Isogai E et al. , Serological survey for Lyme disease in sika deer (Cervus nippon yesoensis) by enzyme-linked immunosorbent assay (ELISA). Microbiol. Immunol 35, 695–703 (1991). doi: 10.1111/j.1348-0421.1991.tb01603.x; [DOI] [PubMed] [Google Scholar]
- 99.Isogai E et al. , Borrelia burgdorferi sensu lato in an endemic environment: Wild sika deer (Cervus nippon yesoensis) with infected ticks and antibodies. Microbiol. Immunol 40, 13–19 (1996). doi: 10.1111/j.1348-0421.1996.tb03311.x; [DOI] [PubMed] [Google Scholar]
- 100.Ivanova K, Zehtindjiev P, Mariaux J, Georgiev BB, Genetic diversity of avian haemosporidians in Malaysia: Cytochrome b lineages of the genera Plasmodium and Haemoproteus (Haemosporida) from Selangor. Infect. Genet. Evol 31, 33–39 (2015). doi: 10.1016/j.meegid.2015.01.004; [DOI] [PubMed] [Google Scholar]
- 101.Jackson B et al. , Emerging infectious disease or evidence of endemicity? A multi-season study of beak and feather disease virus in wild red-crowned parakeets (Cyanoramphus novaezelandiae). Arch. Virol 160, 2283–2292 (2015). doi: 10.1007/s00705-015-2510-3; [DOI] [PubMed] [Google Scholar]
- 102.Jakubek E-B, Farkas R, Pálfi V, Mattsson JG, Prevalence of antibodies against Toxoplasma gondii and Neospora caninum in Hungarian red foxes (Vulpes vulpes). Vet. Parasitol 144, 39–44 (2007). doi: 10.1016/j.vetpar.2006.09.011; [DOI] [PubMed] [Google Scholar]
- 103.Jansen BD, Heffelfinger JR, Noon TH, Krausman PR, Devos JC Jr., Infectious keratoconjunctivitis in bighorn sheep, Silver Bell Mountains, Arizona, USA. J. Wildl. Dis 42, 407–411 (2006). doi: 10.7589/0090-3558-42.2.407; [DOI] [PubMed] [Google Scholar]
- 104.Jarvinen JA, Hedberg WA, Parelaphostrongylus tenuis (Nematoda) in white-tailed deer (Odocoileus virginianus) in central Iowa. J. Parasitol 79, 116–119 (1993). doi: 10.2307/3283289; [DOI] [PubMed] [Google Scholar]
- 105.Jenkins T, Owens IP, Biogeography of avian blood parasites (Leucocytozoon spp.) in two resident hosts across Europe: Phylogeographic structuring or the abundance-occupancy relationship? Mol. Ecol 20, 3910–3920 (2011). doi: 10.1111/j.1365-294X.2011.05221.x; [DOI] [PubMed] [Google Scholar]
- 106.Joly DO, Messier F, The distribution of Echinococcus granulosus in moose: Evidence for parasite-induced vulnerability to predation by wolves? Oecologia 140, 586–590 (2004). doi: 10.1007/s00442-004-1633-0; [DOI] [PubMed] [Google Scholar]
- 107.Joly DO, Messier F, Factors affecting apparent prevalence of tuberculosis and brucellosis in wood bison. J. Anim. Ecol 73, 623–631 (2004). doi: 10.1111/j.0021-8790.2004.00836.x [DOI] [Google Scholar]
- 108.Jordan HE, Hayes FA, Gastrointestinal helminths of raccoons (Procyon lotor) from Ossabaw Island, Georgia. J. Parasitol 45, 249–252 (1959). doi: 10.2307/3274491; [DOI] [PubMed] [Google Scholar]
- 109.Jori F et al. , An assessment of zoonotic and production limiting pathogens in rusa deer (Cervus timorensis rusa) from Mauritius. Transbound. Emerg. Dis 61 (suppl. 1), 31–42 (2014). doi: 10.1111/tbed.12206; [DOI] [PubMed] [Google Scholar]
- 110.Kálmán D, Egyed L, PCR detection of bovine herpesviruses from nonbovine ruminants in Hungary. J. Wildl. Dis 41, 482–488 (2005). doi: 10.7589/0090-3558-41.3.482; [DOI] [PubMed] [Google Scholar]
- 111.Kamps AJ, Dubay SA, Langenberg J, Maes RK, Evaluation of trapper-collected Nobuto filter-paper blood samples for distemper and parvovirus antibody detection in coyotes (Canis latrans) and raccoons (Procyon lotor). J. Wildl. Dis 51, 724–728 (2015). doi: 10.7589/2014-06-147; [DOI] [PubMed] [Google Scholar]
- 112.Kharchenko V, Kornyushin V, Varodi E, Malega O, Occurrence of Echinococcus multilocularis (Cestoda, Taeniidae) in red foxes (Vulpes vulpes) from Western Ukraine. Acta Parasitol. 53, 36–40 (2008). doi: 10.2478/s11686-008-0008-9 [DOI] [Google Scholar]
- 113.Kingscote BF, Bohac JG, Antibodies to bovine bacterial and viral pathogens in pronghorns in Alberta, 1983. J. Wildl. Dis 22, 511–514 (1986). doi: 10.7589/0090-3558-22.4.511; [DOI] [PubMed] [Google Scholar]
- 114.Kirkpatrick CE, Leiby DA, Abraham D, Duffy III CH, Gongylonema pulchrum Molin (Nematoda: Gongylonematidae) in black bears (Ursus americanus Pallas) from Pennsylvania. J. Wildl. Dis 22, 119–121 (1986). doi: 10.7589/0090-3558-22.1.119; [DOI] [PubMed] [Google Scholar]
- 115.Kitamura E, Yokohata Y, Suzuki M, Kamiya M, Metazoan parasites of sika deer from east Hokkaido, Japan and ecological analyses of their abomasal nematodes. J. Wildl. Dis 33, 278–284 (1997). doi: 10.7589/0090-3558-33.2.278; [DOI] [PubMed] [Google Scholar]
- 116.Kocan AA et al. , Naturally occurring hepatozoonosis in coyotes from Oklahoma. J. Wildl. Dis 35, 86–89 (1999). doi: 10.7589/0090-3558-35.1.86; [DOI] [PubMed] [Google Scholar]
- 117.Korsholm H, Olesen C, Preliminary investigations on the parasite burden and distribution of endoparasite species of muskox (Ovibos moschatus) and caribou (Rangifer tarandus groenlandicus) in West Greenland. Rangifer 13, 185–189 (1993). doi: 10.7557/2.13.4.1056 [DOI] [Google Scholar]
- 118.Laakkonen J, Sundell J, Soveri T, Lung parasites of least weasels in Finland. J. Wildl. Dis 34, 816–819 (1998). doi: 10.7589/0090-3558-34.4.816; [DOI] [PubMed] [Google Scholar]
- 119.Lainson R et al. , Amazonian visceral leishmaniasis—Distribution of the vector Lutzomyia longipalpis (Lutz & Neiva) in relation to the fox Cerdocyon thous (linn.) and the efficiency of this reservoir host as a source of infection. Mem. Inst. Oswaldo Cruz 85, 135–137 (1990). doi: 10.1590/S0074-02761990000100027; [DOI] [PubMed] [Google Scholar]
- 120.Lamontagne L, Sadi L, Joyal R, Serological evidence of bovine herpesvirus 1-related virus infection in the white-tailed deer population on Anticosti Island, Quebec. J. Wildl. Dis 25, 202–205 (1989). doi: 10.7589/0090-3558-25.2.202; [DOI] [PubMed] [Google Scholar]
- 121.Landsberg JH et al. , Co-infection by alveolate parasites and frog virus 3-like ranavirus during an amphibian larval mortality event in Florida, USA. Dis. Aquat. Organ 105, 89–99 (2013). doi: 10.3354/dao02625; [DOI] [PubMed] [Google Scholar]
- 122.Little SE, Stallknecht DE, Lockhart JM, Dawson JE, Davidson WR, Natural coinfection of a white-tailed deer (Odocoileus virginianus) population with three Ehrlichia spp. J. Parasitol 84, 897–901 (1998). doi: 10.2307/3284616; [DOI] [PubMed] [Google Scholar]
- 123.Liz JS, Sumner JW, Pfister K, Brossard M, PCR detection and serological evidence of granulocytic ehrlichial infection in roe deer (Capreolus capreolus) and chamois (Rupicapra rupicapra). J. Clin. Microbiol 40, 892–897 (2002). doi: 10.1128/JCM.40.3.892-897.2002; [DOI] [PMC free article] [PubMed] [Google Scholar]
- 124.López G, Muñoz J, Soriguer R, Figuerola J, Increased endoparasite infection in late-arriving individuals of a trans-Saharan passerine migrant bird. PLOS ONE 8, e61236 (2013). doi: 10.1371/journal.pone.0061236; [DOI] [PMC free article] [PubMed] [Google Scholar]
- 125.Losson B et al. , Prevalence of Echinococcus multilocularis in the red fox (Vulpes vulpes) in southern Belgium. Vet. Parasitol 117, 23–28 (2003). doi: 10.1016/j.vetpar.2003.08.003; [DOI] [PubMed] [Google Scholar]
- 126.Lutz HL et al. , Parasite prevalence corresponds to host life history in a diverse assemblage of afrotropical birds and haemosporidian parasites. PLOS ONE 10, e0121254 (2015). doi: 10.1371/journal.pone.0121254; [DOI] [PMC free article] [PubMed] [Google Scholar]
- 127.Magnarelli LA, Ijdo JW, Stafford III KC, Fikrig E, Infections of granulocytic ehrlichiae and Borrelia burgdorferi in white-tailed deer in Connecticut. J. Wildl. Dis 35, 266–274 (1999). doi: 10.7589/0090-3558-35.2.266; [DOI] [PubMed] [Google Scholar]
- 128.Marcogliese DJ, Fecundity of sealworm (Pseudoterranova decipiens) infecting grey seals (Halichoerus grypus) in the Gulf of St. Lawrence, Canada: Lack of density-dependent effects. Int. J. Parasitol 27, 1401–1409 (1997). doi: 10.1016/S0020-7519(97)00129-X; [DOI] [PubMed] [Google Scholar]
- 129.Martinez A, Salinas A, Martinez F, Cantu A, Miller DK, Serosurvey for selected disease agents in white-tailed deer from Mexico. J. Wildl. Dis 35, 799–803 (1999). doi: 10.7589/0090-3558-35.4.799; [DOI] [PubMed] [Google Scholar]
- 130.Marzal A, Albayrak T, Geographical variation of haemosporidian parasites in Turkish populations of Krüper’s Nuthatch Sitta krueperi. J. Ornithol 153, 1225–1231 (2012). doi: 10.1007/s10336-012-0853-z [DOI] [Google Scholar]
- 131.Marzal A, García-Longoria L, Cárdenas Callirgos JM, Sehgal RNM, Invasive avian malaria as an emerging parasitic disease in native birds of Peru. Biol. Invasions 17, 39–45 (2015). doi: 10.1007/s10530-014-0718-x [DOI] [Google Scholar]
- 132.McGee BK et al. , Possible vector dissemination by swift foxes following a plague epizootic in black-tailed prairie dogs in northwestern Texas. J. Wildl. Dis 42, 415–420 (2006). doi: 10.7589/0090-3558-42.2.415; [DOI] [PubMed] [Google Scholar]
- 133.McKEEVER S, Observations on Paragonimus kellicotti Ward from Georgia. J. Parasitol 44, 324–327 (1958). doi: 10.2307/3274599; [DOI] [PubMed] [Google Scholar]
- 134.McLean RG et al. , The role of deer as a possible reservoir host of potosi virus, a newly recognized arbovirus in the United States. J. Wildl. Dis 32, 444–452 (1996). doi: 10.7589/0090-3558-32.3.444; [DOI] [PubMed] [Google Scholar]
- 135.McMahon DP et al. , Elevated virulence of an emerging viral genotype as a driver of honeybee loss. Proc. Biol. Sci 283, 20160811 (2016). doi: 10.1098/rspb.2016.0811; [DOI] [PMC free article] [PubMed] [Google Scholar]
- 136.Measures LN, Dubey JP, Labelle P, Martineau D, Seroprevalence of Toxoplasma gondii in Canadian pinnipeds. J. Wildl. Dis 40, 294–300 (2004). doi: 10.7589/0090-3558-40.2.294; [DOI] [PubMed] [Google Scholar]
- 137.Mech LD, Tracy SP, Prevalence of giant kidney worm (Dioctophyma renale) in wild mink (Mustela vison) in Minnesota. Am. Midl. Nat 145, 206–210 (2001). doi: 10.1674/0003-0031(2001)145[0206:POGKWD]2.0.CO;2 [DOI] [Google Scholar]
- 138.Miaud C et al. , Ranavirus causes mass die-offs of alpine amphibians in the Southwestern Alps, France. J. Wildl. Dis 52, 242–252 (2016). doi: 10.7589/2015-05-113; [DOI] [PubMed] [Google Scholar]
- 139.Miller DL et al. , Pathologic findings in larval and juvenile anurans inhabiting farm ponds in Tennessee, USA. J. Wildl. Dis 45, 314–324 (2009). doi: 10.7589/0090-3558-45.2.314; [DOI] [PubMed] [Google Scholar]
- 140.Moens MA, Pérez-Tris J, Discovering potential sources of emerging pathogens: South America is a reservoir of generalist avian blood parasites. Int. J. Parasitol 46, 41–49 (2016). doi: 10.1016/j.ijpara.2015.08.001; [DOI] [PubMed] [Google Scholar]
- 141.Molnar B, Duchamp C, Möstl K, Diehl P-A, Betschart B, Comparative survey of canine parvovirus, canine distemper virus and canine enteric coronavirus infection in free-ranging wolves of central Italy and south-eastern France. Eur. J. Wildl. Res 60, 613–624 (2014). doi: 10.1007/s10344-014-0825-0; [DOI] [PMC free article] [PubMed] [Google Scholar]
- 142.Moro PL et al. , Intestinal parasites of the grey fox (Pseudalopex culpaeus) in the central Peruvian Andes. J. Helminthol 72, 87–89 (1998). doi: 10.1017/S0022149X00001048; [DOI] [PubMed] [Google Scholar]
- 143.Mulvey M, Aho JM, Lydeard C, Leberg PL, Smith MH, Comparative population genetic structure of a parasite (Fascioloides magna) and its definitive host. Evolution 45, 1628–1640 (1991). [DOI] [PubMed] [Google Scholar]
- 144.Munro R, Ross H, Cornwell C, Gilmour J, Disease conditions affecting common seals (Phoca vitulina) around the Scottish mainland, September-November 1988. Sci. Total Environ 115, 67–82 (1992). doi: 10.1016/0048-9697(92)90033-O; [DOI] [PubMed] [Google Scholar]
- 145.Burrells A et al. , Evidence of the three main clonal Toxoplasma gondii lineages from wild mammalian carnivores in the UK. Parasitology 140, 1768–1776 (2013). doi: 10.1017/S0031182013001169; [DOI] [PubMed] [Google Scholar]
- 146.Nilsson E et al. , Multiple cryptic species of sympatric generalists within the avian blood parasite Haemoproteus majoris. J. Evol. Biol 29, 1812–1826 (2016). doi: 10.1111/jeb.12911; [DOI] [PubMed] [Google Scholar]
- 147.Nyamsuren D et al. , Exposure of Mongolian gazelles (Procapra gutturosa) to foot and mouth disease virus. J. Wildl. Dis 42, 154–158 (2006). doi: 10.7589/0090-3558-42.1.154; [DOI] [PubMed] [Google Scholar]
- 148.Oates DW, Sterner MC, Steffen DJ, Meningeal worm in free-ranging deer in Nebraska. J. Wildl. Dis 35, 101–104 (1999). doi: 10.7589/0090-3558-35.1.101; [DOI] [PubMed] [Google Scholar]
- 149.Oates DW, Sterner MC, Boyd E, Meningeal worm in deer from western Nebraska. J. Wildl. Dis 36, 370–373 (2000). doi: 10.7589/0090-3558-36.2.370; [DOI] [PubMed] [Google Scholar]
- 150.Ohishi K et al. , Antibodies to human-related H3 influenza A virus in Baikal seals (Phoca sibirica) and ringed seals (Phoca hispida) in Russia. Microbiol. Immunol 48, 905–909 (2004). doi: 10.1111/j.1348-0421.2004.tb03610.x; [DOI] [PubMed] [Google Scholar]
- 151.O’Neill G, Whelan J, The occurrence of Corynosoma strumosum in the grey seal, Halichoerus grypus, caught off the Atlantic coast of Ireland. J. Helminthol 76, 231–234 (2002). doi: 10.1079/JOH10.1076/2002117; [DOI] [PubMed] [Google Scholar]
- 152.O’Toole D, Williams ES, Welch V, Nunamaker CE, Lynn C, Subepidermal vesiculobullous filarial dermatitis in free-ranging American badgers (Taxidea taxus). Vet. Pathol 30, 343–351 (1993). doi: 10.1177/030098589303000403; [DOI] [PubMed] [Google Scholar]
- 153.O’Toole D, Welch V, Williams B, Immunohistochemistry of parasitic subepidermal vesiculobullous disease in American badgers (Taxidea taxus). J. Vet. Diagn. Invest 6, 72–76 (1994). doi: 10.1177/104063879400600113; [DOI] [PubMed] [Google Scholar]
- 154.Pandey GS, Mweene A, Suzuki AK, Nambota A, Kaji T, Dermatophilosis (Cutaneous streptothricosis) in Kafue lechwe (Kobus leche kafuensis). J. Wildl. Dis 30, 586–588 (1994). doi: 10.7589/0090-3558-30.4.586; [DOI] [PubMed] [Google Scholar]
- 155.Pardal S et al. , Shorebird low spillover risk of mosquito-borne pathogens on Iberian wetlands. J. Ornithol 155, 549–554 (2014). doi: 10.1007/s10336-013-1036-2 [DOI] [Google Scholar]
- 156.Archer GA et al. , Detection of copathogens in free-ranging eastern box turtles (Terrapene carolina carolina) in Illinois and Tennessee. J. Zoo Wildl. Med 48, 1127–1134 (2017). doi: 10.1638/2017-0148R.1; [DOI] [PubMed] [Google Scholar]
- 157.Henning J, Davies P, Meers J, Seropositivity to rabbit haemorrhagic disease virus in non-target mammals during periods of viral activity in a population of wild rabbits in New Zealand. Wildl. Res 33, 305–311 (2006). doi: 10.1071/WR03061 [DOI] [Google Scholar]
- 158.Lux E, Mix HM, Zedev B, Damalinia (Tricholipeurus) zaganseeri, n. sp. (Phthiraptera: Trichodectidae), a parasite from Procapra gutturosa (Artiodactyla: Bovidae) in Mongolia. J. Med. Entomol 34, 599–604 (1997). doi: 10.1093/jmedent/34.6.599; [DOI] [PubMed] [Google Scholar]
- 159.Mannelli A, Kitron U, Jones CJ, Slajchert TL, Ixodes dammini (Acari: Ixodidae) infestation on medium-sized mammals and blue jays in northwestern Illinois. J. Med. Entomol 30, 950–952 (1993). doi: 10.1093/jmedent/30.5.950; [DOI] [PubMed] [Google Scholar]
- 160.Martinsen ES, Sidor IF, Flint S, Cooley J, Pokras MA, Documentation of malaria parasite (Plasmodium spp.) infection and associated mortality in a common loon (Gavia immer). J. Wildl. Dis 53, 859–863 (2017). doi: 10.7589/2016-08-195; [DOI] [PubMed] [Google Scholar]
- 161.Pederson JC, Jensen LA, Andersen FL, Prevalence and distribution of Elaeophora schneideri Wehr and Dikmans, 1935 in mule deer in Utah. J. Wildl. Dis 21, 66–67 (1985). doi: 10.7589/0090-3558-21.1.66; [DOI] [PubMed] [Google Scholar]
- 162.Perry BD, Nichols DK, Cullom ES, Babesia odocoilei Emerson and Wright, 1970 in white-tailed deer, Odocoileus virginianus (Zimmermann), in Virginia. J. Wildl. Dis 21, 149–152 (1985). doi: 10.7589/0090-3558-21.2.149; [DOI] [PubMed] [Google Scholar]
- 163.Peterson MJ et al. , Infectious disease survey of Rio Grande wild turkeys in the Edwards Plateau of Texas. J. Wildl. Dis 38, 826–833 (2002). doi: 10.7589/0090-3558-38.4.826; [DOI] [PubMed] [Google Scholar]
- 164.Pietrzak SM, Pung OJ, Trypanosomiasis in raccoons from Georgia. J. Wildl. Dis 34, 132–136 (1998). doi: 10.7589/0090-3558-34.1.132; [DOI] [PubMed] [Google Scholar]
- 165.Purvis JR, Peterson MJ, Dronen NO, Lichtenfels JR, Silvy NJ, Northern bobwhites as disease indicators for the endangered Attwater’s prairie chicken. J. Wildl. Dis 34, 348–354 (1998). doi: 10.7589/0090-3558-34.2.348; [DOI] [PubMed] [Google Scholar]
- 166.Pybus MJ, Survey of hepatic and pulmonary helminths of wild cervids in Alberta, Canada. J. Wildl. Dis 26, 453–459 (1990). doi: 10.7589/0090-3558-26.4.453; [DOI] [PubMed] [Google Scholar]
- 167.Ramey AM, Ely CR, Schmutz JA, Pearce JM, Heard DJ, Molecular detection of hematozoa infections in tundra swans relative to migration patterns and ecological conditions at breeding grounds. PLOS ONE 7, e45789 (2012). doi: 10.1371/journal.pone.0045789; [DOI] [PMC free article] [PubMed] [Google Scholar]
- 168.Renter DG, Sargeant JM, Hygnstorm SE, Hoffman JD, Gillespie JR, Escherichia coli O157:H7 in free-ranging deer in Nebraska. J. Wildl. Dis 37, 755–760 (2001). doi: 10.7589/0090-3558-37.4.755; [DOI] [PubMed] [Google Scholar]
- 169.Reshetnikov AN et al. , Detection of the emerging amphibian pathogens Batrachochytrium dendrobatidis and ranavirus in Russia. Dis. Aquat. Organ 110, 235–240 (2014). doi: 10.3354/dao02757; [DOI] [PubMed] [Google Scholar]
- 170.Riemann HP, Howarth JA, Ruppanner R, Franti CE,Behymer DE, Toxoplasma antibodies among bobcats and other carnivores of norther California. J. Wildl. Dis 11, 272–276 (1975). doi: 10.7589/0090-3558-11.2.272; [DOI] [PubMed] [Google Scholar]
- 171.Riemann HP, Thompson RA, Behymer DE, Ruppanner R, Franti CE, Toxoplasmosis and Q fever antibodies among wild carnivores in California. J. Wildl. Manage 42, 198–202 (1978). doi: 10.2307/3800717 [DOI] [Google Scholar]
- 172.Rijks JM et al. , Quantitative analysis of the 2002 phocine distemper epidemic in the Netherlands. Vet. Pathol 45, 516–530 (2008). doi: 10.1354/vp.45-4-516; [DOI] [PubMed] [Google Scholar]
- 173.Rothermel BB et al. , High occupancy of stream salamanders despite high ranavirus prevalence in a southern Appalachians watershed. EcoHealth 10, 184–189 (2013). doi: 10.1007/s10393-013-0843-5; [DOI] [PubMed] [Google Scholar]
- 174.Rothermel BB et al. , Disease dynamics of red-spotted newts and their anuran prey in a montane pond community. Dis. Aquat. Organ 118, 113–127 (2016). doi: 10.3354/dao02965; [DOI] [PubMed] [Google Scholar]
- 175.Ruhnke HL, Madoff S, Mycoplasma phocidae sp. nov., isolated from harbor seals (Phoca vitulina L.). Int. J. Syst. Bateriol 42, 211–214 (1992). [DOI] [PubMed] [Google Scholar]
- 176.Salkeld DJ et al. , The potential role of swift foxes (Vulpes velox) and their fleas in plague outbreaks in prairie dogs. J. Wildl. Dis 43, 425–431 (2007). doi: 10.7589/0090-3558-43.3.425; [DOI] [PubMed] [Google Scholar]
- 177.Santiago-Alarcon D, MacGregor-Fors I, Kühnert K, Segelbacher G, Schaefer HM, Avian haemosporidian parasites in an urban forest and their relationship to bird size and abundance. Urban Ecosyst. 19, 331–346 (2016). doi: 10.1007/s11252-015-0494-0 [DOI] [Google Scholar]
- 178.Sato H, Inaba T, Ihama Y, Kamiya H, Parasitological survey on wild carnivora in north-western Tohoku, Japan. J. Vet. Med. Sci 61, 1023–1026 (1999). doi: 10.1292/jvms.61.1023; [DOI] [PubMed] [Google Scholar]
- 179.Sato H, Ihama Y, Inaba T, Yagisawa M, Kamiya H, Helminth fauna of carnivores distributed in north-western Tohoku, Japan, with special reference to Mesocestoides paucitesticulus and Brachylaima tokudai. J. Vet. Med. Sci 61, 1339–1342 (1999). doi: 10.1292/jvms.61.1339; [DOI] [PubMed] [Google Scholar]
- 180.Schmid S, Fachet K, Dinkel A, Mackenstedt U, Woog F, Carrion crows (Corvus corone) of southwest Germany: Important hosts for haemosporidian parasites. Malar. J 16, 369 (2017). doi: 10.1186/s12936-017-2023-5; [DOI] [PMC free article] [PubMed] [Google Scholar]
- 181.Schock DM et al. , Amphibian chytrid fungus and ranaviruses in the Northwest Territories, Canada. Dis. Aquat. Organ 92, 231–240 (2010). doi: 10.3354/dao02134; [DOI] [PubMed] [Google Scholar]
- 182.Seesee FM, Sterner MC, Worley DE, Helminths of the coyote (Canis latrans Say) in Montana. J. Wildl. Dis 19, 54–55 (1983). doi: 10.7589/0090-3558-19.1.54; [DOI] [PubMed] [Google Scholar]
- 183.Seimon TA et al. , Avian hemosporidian parasite lineages in four species of free-ranging migratory waterbirds from Mongolia, 2008. J. Wildl. Dis 52, 682–687 (2016). doi: 10.7589/2015-11-311; [DOI] [PubMed] [Google Scholar]
- 184.Seville RS, Addison EM, Nongastrointestinal helminths in marten (Martes americana) from Ontario, Canada. J. Wildl. Dis 31, 529–533 (1995). doi: 10.7589/0090-3558-31.4.529; [DOI] [PubMed] [Google Scholar]
- 185.Silva-Iturriza A, Ketmaier V, Tiedemann R, Profound population structure in the Philippine Bulbul Hypsipetes philippinus (Pycnonotidae, Aves) is not reflected in its Haemoproteus haemosporidian parasite. Infect. Genet. Evol 12, 127–136 (2012). doi: 10.1016/j.meegid.2011.10.024; [DOI] [PubMed] [Google Scholar]
- 186.Simmons JM, Nicholson WS, Hill EP, Briggs DB, Occurrence of (Dirofilaria immitis) in gray fox (Urocyon cinereoargenteus) in Alabama and Georgia. J. Wildl. Dis 16, 225–228 (1980). doi: 10.7589/0090-3558-16.2.225; [DOI] [PubMed] [Google Scholar]
- 187.Slajchert T, Kitron UD, Jones CJ, Mannelli A, Role of the eastern chipmunk (Tamias striatus) in the epizootiology of Lyme borreliosis in northwestern Illinois, USA. J. Wildl. Dis 33, 40–46 (1997). doi: 10.7589/0090-3558-33.1.40; [DOI] [PubMed] [Google Scholar]
- 188.Snyder DE, Indirect immunofluorescent detection of oocysts of Cryptosporidium parvum in the feces of naturally infected raccoons (Procyon lotor). J. Parasitol 74, 1050–1052 (1988). doi: 10.2307/3282233; [DOI] [PubMed] [Google Scholar]
- 189.Snyder DE, Capillaria procyonis (Nematoda: Trichuroidea) eggs from the tongue of the raccoon (Procyon lotor). J. Wildl. Dis 24, 722–723 (1988). doi: 10.7589/0090-3558-24.4.722; [DOI] [PubMed] [Google Scholar]
- 190.Snyder DE, Sanderson GC, Toivio-Kinnucan M, Blagburn BL, Sarcocystis kirkpatricki n. sp. (Apicomplexa: Sarcocystidae) in muscles of raccoons (Procyon lotor) from Illinois. J. Parasitol 76, 495–500 (1990). doi: 10.2307/3282827; [DOI] [PubMed] [Google Scholar]
- 191.Sørensen KK et al. , Acute toxoplasmosis in three wild arctic foxes (Alopex lagopus) from Svalbard; one with co-infections of Salmonella Enteritidis PT1 and Yersinia pseudotuberculosis serotype 2b. Res. Vet. Sci 78, 161–167 (2005). doi: 10.1016/j.rvsc.2004.07.010; [DOI] [PubMed] [Google Scholar]
- 192.Souza MJ, Gray MJ, Colclough P, Miller DL, Prevalence of infection by Batrachochytrium dendrobatidis and ranavirus in eastern hellbenders (Cryptobranchus alleganiensis alleganiensis) in eastern Tennessee. J. Wildl. Dis 48, 560–566 (2012). doi: 10.7589/0090-3558-48.3.560; [DOI] [PubMed] [Google Scholar]
- 193.Spitzen-van der Sluijs A et al. , Course of an Isolated ranavirus outbreak in a Pelobates fuscus population in The Netherlands. J. Herpetological Med. Surg 26, 117–121 (2016). doi: 10.5818/1529-9651-26.3-4.117 [DOI] [Google Scholar]
- 194.Spraker TR, Collins JK, Adrian WJ, Olterman JH, Isolation and serologic evidence of a respiratory syncytial virus in bighorn sheep from Colorado. J. Wildl. Dis 22, 416–418 (1986). doi: 10.7589/0090-3558-22.3.416; [DOI] [PubMed] [Google Scholar]
- 195.Stallknecht DE, Davidson WR, Antibodies to bluetongue and epizootic hemorrhagic disease viruses from white-tailed deer blood samples dried on paper strips. J. Wildl. Dis 28, 306–310 (1992). doi: 10.7589/0090-3558-28.2.306; [DOI] [PubMed] [Google Scholar]
- 196.Stark T et al. , Death in the clouds: Ranavirus associated mortality in assemblage of cloud forest amphibians in Nicaragua. Acta Herpetol. 9, 125–127 (2014). doi: 10.13128/Acta_Herpetol-13516 [DOI] [Google Scholar]
- 197.Stubblefield SS, Pence DB, Warren RJ, Visceral helminth communities of sympatric mule and white-tailed deer from the Davis Mountains of Texas. J. Wildl. Dis 23, 113–120 (1987). doi: 10.7589/0090-3558-23.1.113; [DOI] [PubMed] [Google Scholar]
- 198.Stuht JN, Youatt WG, Heartworms and lung flukes from red foxes in Michigan. J. Wildl. Manage 36, 166–170 (1972). doi: 10.2307/3799205 [DOI] [Google Scholar]
- 199.Svoboda A, Marthinsen G, Turcoková L, Lifjeld JT, Johnsen A, Identification of blood parasites in old world warbler species from the Danube River Delta. Avian Dis. 53, 634–636 (2009). doi: 10.1637/8842-040409-Case.1; [DOI] [PubMed] [Google Scholar]
- 200.Synek P et al. , Haemosporidian parasites of a European passerine wintering in South Asia: Diversity, mixed infections and effect on host condition. Parasitol. Res 112, 1667–1677 (2013). doi: 10.1007/s00436-013-3323-5; [DOI] [PubMed] [Google Scholar]
- 201.Szöllosi E et al. , Determinants of distribution and prevalence of avian malaria in blue tit populations across Europe: Separating host and parasite effects. J. Evol. Biol 24, 2014–2024 (2011). doi: 10.1111/j.1420-9101.2011.02339.x; [DOI] [PubMed] [Google Scholar]
- 202.Uni S, Suzuki Y, Katsumi A, Cercopithifilaria shohoi n. sp. (Nematoda: Filarioidea) from the relict Bovidae, Capricornis crispus, in Japan. Parasite 5, 119–126 (1998). doi: 10.1051/parasite/1998052119; [DOI] [PubMed] [Google Scholar]
- 203.Urquhart K et al. , A survey of pathogens and metazoan parasites on wild sea trout (Salmo trutta) in Scottish waters. ICES J. Mar. Sci 67, 444–453 (2009). doi: 10.1093/icesjms/fsp271 [DOI] [Google Scholar]
- 204.Van Campen H et al. , Isolation of bovine viral diarrhea virus from a free-ranging mule deer in Wyoming. J. Wildl. Dis 37, 306–311 (2001). doi: 10.7589/0090-3558-37.2.306; [DOI] [PubMed] [Google Scholar]
- 205.Vaz FF et al. , Survey of pathogens in threatened wild red-tailed Amazon parrot (Amazona brasiliensis) nestlings in Rasa Island, Brazil. Braz. J. Microbiol 48, 747–753 (2017). doi: 10.1016/j.bjm.2017.03.004; [DOI] [PMC free article] [PubMed] [Google Scholar]
- 206.Ventim R et al. , Avian malaria infections in western European mosquitoes. Parasitol. Res 111, 637–645 (2012). doi: 10.1007/s00436-012-2880-3; [DOI] [PubMed] [Google Scholar]
- 207.Ventim R, Mendes L, Ramos JA, Cardoso H, Pérez-Tris J, Local haemoparasites in introduced wetland passerines. J. Ornithol 153, 1253–1259 (2012). doi: 10.1007/s10336-012-0860-0 [DOI] [Google Scholar]
- 208.Vicente J, Gortázar C, High prevalence of large spiny-tailed protostrongylid larvae in Iberian red deer. Vet. Parasitol 96, 165–170 (2001). doi: 10.1016/S0304-4017(00)00425-8; [DOI] [PubMed] [Google Scholar]
- 209.Vikøren T et al. , A severe outbreak of contagious ecthyma (orf) in a free-ranging musk ox (Ovibos moschatus) population in Norway. Vet. Microbiol 127, 10–20 (2008). doi: 10.1016/j.vetmic.2007.07.029; [DOI] [PubMed] [Google Scholar]
- 210.Warne RW, LaBumbard B, LaGrange S, Vredenburg VT, Catenazzi A, Co-infection by chytrid fungus and ranaviruses in wild and harvested frogs in the tropical Andes. PLOS ONE 11, e0145864 (2016). doi: 10.1371/journal.pone.0145864; [DOI] [PMC free article] [PubMed] [Google Scholar]
- 211.Warsame IY, Steen M, Malignant catarrhal fever in wild Swedish moose (Alces alces L). Rangifer 9, 51–57 (1989). doi: 10.7557/2.9.2.774 [DOI] [Google Scholar]
- 212.Webb PA et al. , Epizootic vesicular stomatitis in Colorado, 1982: Some observations on the possible role of wildlife populations in an enzootic maintenance cycle. J. Wildl. Dis 23, 192–198 (1987). doi: 10.7589/0090-3558-23.2.192; [DOI] [PubMed] [Google Scholar]
- 213.Whitfield SM et al. , Infection and co-infection by the amphibian chytrid fungus and ranavirus in wild Costa Rican frogs. Dis. Aquat. Organ 104, 173–178 (2013). doi: 10.3354/dao02598; [DOI] [PubMed] [Google Scholar]
- 214.Williams ES, Thorne ET, Anderson SL, Herriges JD Jr., Brucellosis in free-ranging bison (Bison bison) from Teton County, Wyoming. J. Wildl. Dis 29, 118–122 (1993). doi: 10.7589/0090-3558-29.1.118; [DOI] [PubMed] [Google Scholar]
- 215.Wood MJ et al. , The epidemiology underlying age-related avian malaria infection in a long-lived host: The mute swan Cygnus olor. J. Avian Biol 44, 347–358 (2013). doi: 10.1111/j.1600-048X.2013.00091.x [DOI] [Google Scholar]
- 216.Yagi K, Bain O, Shoho C, Onchocerca suzukii n. sp. and O. skrjabini (= O. tarsicola) from a relict bovid, Capricornis crispus, in Japan. Parasite 1, 349–356 (1994). doi: 10.1051/parasite/1994014349; [DOI] [PubMed] [Google Scholar]
- 217.Yimam AE et al. , First report of Trichinella nativa in red foxes (Vulpes vulpes schrencki) from Otaru City, Hokkaido, Japan. Parasitol. Int 50, 121–127 (2001). doi: 10.1016/S1383-5769(01)00073-3; [DOI] [PubMed] [Google Scholar]
- 218.Yohannes E, Križanauskienė A, Valcu M, Bensch S, Kempenaers B, Prevalence of malaria and related haemosporidian parasites in two shorebird species with different winter habitat distribution. J. Ornithol 150, 287–291 (2009). doi: 10.1007/s10336-008-0349-z [DOI] [Google Scholar]
- 219.Zamparo JM, Andreadis TG, Shope RE, Tirrell SJ, Serologic evidence of Jamestown Canyon virus infection in white-tailed deer populations from Connecticut. J. Wildl. Dis 33, 623–627 (1997). doi: 10.7589/0090-3558-33.3.623; [DOI] [PubMed] [Google Scholar]
- 220.Zanella G et al. , Mycobacterium bovis in wildlife in France. J. Wildl. Dis 44, 99–108 (2008). doi: 10.7589/0090-3558-44.1.99; [DOI] [PubMed] [Google Scholar]
- 221.Zehtindjiev P et al. , Occurrence of haemosporidian parasites in the paddyfield warbler, Acrocephalus agricola (Passeriformes, Sylviidae). Acta Parasitol. 54, 295–300 (2009). doi: 10.2478/s11686-009-0052-0 [DOI] [Google Scholar]
- 222.Zehtindjiev P et al. , Dynamics of parasitemia of malaria parasites in a naturally and experimentally infected migratory songbird, the great reed warbler Acrocephalus arundinaceus. Exp. Parasitol 119, 99–110 (2008). doi: 10.1016/j.exppara.2007.12.018; [DOI] [PubMed] [Google Scholar]
- 223.Cohen J, jeremy-cohen/tmh-across-systems. Github (2008); https://github.com/jeremy-cohen/tmh-across-systems. [Google Scholar]
- 224.Bensch S, Hellgren O, Pérez-Tris J, MalAvi: A public database of malaria parasites and related haemosporidians in avian hosts based on mitochondrial cytochrome b lineages. Mol. Ecol. Resour 9, 1353–1358 (2009). doi: 10.1111/j.1755-0998.2009.02692.x; [DOI] [PubMed] [Google Scholar]
- 225.Stephens PR et al. , Global mammal parasite database version 2.0. Ecology 98, 1476–1476 (2017). doi: 10.1002/ecy.1799; [DOI] [PubMed] [Google Scholar]
- 226.Lajeunesse MJ, Facilitating systematic reviews, data extraction and meta-analysis with the metagear package for R. Methods Ecol. Evol 7, 323–330 (2016). doi: 10.1111/2041-210X.12472 [DOI] [Google Scholar]
- 227.R Core Team, R: A language and environment for statistical computing (R Foundation for Statistical Computing, Vienna, Austria, 2016). [Google Scholar]
- 228.IUCN, The IUCN Red List of Threatened Species, version 2015.2 (2015); www.iucnredlist.org.
- 229.Sodhi NS et al. , Measuring the meltdown: Drivers of global amphibian extinction and decline. PLOS ONE 3, e1636 (2008). doi: 10.1371/journal.pone.0001636; [DOI] [PMC free article] [PubMed] [Google Scholar]
- 230.Hijmans RJ, raster: Geographic data analysis and modeling, R package version 2.2.31 (2014).
- 231.Sunday JM, Bates AE, Dulvy NK, Global analysis of thermal tolerance and latitude in ectotherms. Proc. R. Soc. London Ser. B 278, 1823–1830 (2011). [DOI] [PMC free article] [PubMed] [Google Scholar]
- 232.Brooks ME et al. , glmmTMB balances speed and flexibility among packages for zero-inflated generalized linear mixed modeling. R J. 9, 378–400 (2017). doi: 10.32614/RJ-2017-066 [DOI] [Google Scholar]
- 233.Barton K, MuMIn: Multi-model inference, R Package version 1.10.0 (2014).
- 234.Breheny P, Burchett W, visreg: Visualization of regression models, R package version 2 (2012).
- 235.Bjornstad O, ncf: Spatial nonparametric covariance functions (2015).
- 236.Neuwirth E, Neuwirth ME, Package “RColorBrewer,” CRAN 2011-06-17 08:34:00. Apache License 2.0 (2011).
Associated Data
This section collects any data citations, data availability statements, or supplementary materials included in this article.
Supplementary Materials
Suppl Mat
Data Availability Statement
All data and code compiled for this study are available on Github (223).