Role for Mitochondrial Oxidants as Regulators of Cellular Metabolism (original) (raw)
Abstract
Leakage of mitochondrial oxidants contributes to a variety of harmful conditions ranging from neurodegenerative diseases to cellular senescence. We describe here, however, a physiological and heretofore unrecognized role for mitochondrial oxidant release. Mitochondrial metabolism of pyruvate is demonstrated to activate the c-Jun N-terminal kinase (JNK). This metabolite-induced rise in cytosolic JNK1 activity is shown to be triggered by increased release of mitochondrial H2O2. We further demonstrate that in turn, the redox-dependent activation of JNK1 feeds back and inhibits the activity of the metabolic enzymes glycogen synthase kinase 3β and glycogen synthase. As such, these results demonstrate a novel metabolic regulatory pathway activated by mitochondrial oxidants. In addition, they suggest that although chronic oxidant production may have deleterious effects, mitochondrial oxidants can also function acutely as signaling molecules to provide communication between the mitochondria and the cytosol.
Recent evidence suggests that reactive oxygen species (ROS) may modulate a variety of signaling pathway (14, 23, 32). Studies in cultured cells have demonstrated that a variety of growth factors, including platelet-derived growth factor (PDGF), epidermal growth factor (EGF), and angiotensin II, stimulate the rapid production of ROS upon binding to their cognate receptor (5, 15, 37). Inhibiting the rise in ligand-stimulated ROS levels results in inhibition of downstream signaling. In particular, the burst of tyrosine phosphorylation stimulated by PDGF or EGF is significantly attenuated by overexpression of the peroxide-scavenging enzyme catalase (5, 37). This has led to speculation that tyrosine phosphatases, which have a reactive cysteine residue in their active sites, might be direct targets of ligand-stimulated ROS production (14). Consistent with this notion, protein tyrosine phosphatase 1B was recently shown to be reversibly inactivated by oxidation following EGF stimulation (25).
Although the enzymatic source of ligand-stimulated ROS production is unclear, evidence suggests a regulatory role for the small GTPases. Expression of constitutively active Rac1 mutants produce an increase in ROS levels in fibroblasts (19–21, 36, 38). Similarly, dominant negative forms of Rac can inhibit ligand-stimulated ROS production in cells (36, 38). Evidence also suggests that the ability of Rac proteins to contribute to Ras-mediated cell transformation appears to be linked in part to their ability to produce superoxide anions (19, 20). In phagocytic cells, Rac controls superoxide production via regulation of the NADPH oxidase. Although this oxidase was long considered to be expressed exclusively in neutrophils, recent reports have demonstrated that nonphagocytic cells have a homologous system (7, 35).
In contrast to the cytosolic, ligand-stimulated production of oxidants, in many cells the mitochondria constitute the primary source of ROS production. It has been appreciated for some time that mitochondria produce oxidants at a rate that exceeds their scavenging capacity. Estimates from isolated mitochondria suggest that approximately 1 to 3% of the O2 consumed is incompletely metabolized and thereby diverted into O2− generation (10, 30). A variety of evidence has implicated this continuous release of mitochondrial oxidants in the pathogenesis of both degenerative diseases and organismal aging (8, 33, 39, 41). Though mitochondria possess manganese superoxide dismutase to convert superoxide into hydrogen peroxide, the peroxide, once generated, is freely diffusible and can therefore contribute to increased levels of ROS in the cytosol. Although numerous cellular antioxidant defenses exist, given the significant toxicity of ROS, it remains unclear why cells have not evolved even more efficient strategies to limit mitochondrial oxidants. Although there are many potential answers to this question, we have concentrated on the hypothesis that in addition to their harmful effects, mitochondrial oxidants may also function physiologically as signaling molecules that regulate aerobic metabolism.
MATERIALS AND METHODS
Cell lines and transfections.
HeLa cells were obtained from the American Type Culture Collection (ATCC) and maintained in Dulbecco's modified Eagle's medium supplemented with 10% fetal calf serum. To obtain cells devoid of respiration-competent mitochondria, HeLa cells were grown in the presence of ethidium bromide (400 ng/ml) for 7 days. At the end of this period of time, Western blot analysis demonstrated a >90% reduction in expression of the mitochondrially encoded gene product COX II. Human umbilical endothelial cells (HUVEC) were obtained from Clonetics (Walkersville, Md.), while IMR-90 primary human fibroblasts, HEK-293 embryonic kidney cells, and 3T3 mouse fibroblasts were obtained from the ATCC (Rockville, Md.). Primary cultures of neonatal myocytes were prepared as previously described (31).
For the construction of inducible cell lines, a HeLa cell line (Clontech) expressing high levels of a tetracycline-inducible transactivator was used as a parental line. Following transfection and selection in hygromycin (250 μg/ml) single colonies were amplified and screened for inducible protein expression. Stable expression of glutathione _S_-transferase–Pi (GSTpi) in HeLa cells was obtained by transfection of pcDNA-GSTpi (a gift of Ze'ev Ronai) followed by selection in G418 and isolation by limiting dilutions. For transient expression of GSTpi, cells were cotransfected with an epitope form of c-Jun N-terminal kinase (JNK), HA-JNK. Cells were analyzed 40 h after transfection with Lipofectamine (Gibco-BRL) using 2.5 μg of DNA consisting of the indicated concentration of GSTpi, 0.5 μg of HA-JNK, and the balance with empty vector DNA. Where indicated, cells were incubated with extracellular catalase (5,000 U/ml) for 20 h prior to stimulation with pyruvate.
In vitro kinase and enzyme activity assays.
For analysis of JNK1 and glycogen synthase kinase 3 (GSK-3) activity, following stimulation with pyruvate (100 mM, except where noted), interleukin-1β (IL-1β; 10 ng/ml), or mitochondrial inhibitors, HeLa cells were washed with phosphate-buffered saline and then scraped into kinase extraction buffer (20 mM Tris-HCl [pH 7.6], 250 mM NaCl, 3 mM EDTA, 3 mM EGTA, 0.5% [vol/vol] NP-40, 1 mM dithiothreitol [DTT], 50 mM β-glycerophosphate, 20 μg of aprotinin per ml, 20 μg of leupeptin per ml, and 1 mM Na3 VO4). JNK1 or GSK-3β was immunoprecipitated from 30 or 10 μg of protein lysate, respectively, with anti-JNK1 (Santa Cruz) or anti-GSK-3β (Transduction Laboratories) antibodies, respectively. The immune complex was recovered by centrifugation, the supernatant was removed, and the complex was washed once with kinase extraction buffer and twice with reaction buffer. For JNK1 activity, immunoprecipitates were assayed in a final volume of 30 μl containing 50 mM HEPES (pH 7.4), 10 mM MgCl2, 10 mM MnCl2, 1 mM DTT, 2 μg of GST-ATF2Δ, and 10 μM [γ-32P]ATP (10 μCi). After incubation for 30 min at 30°C, the reaction was terminated with 6 μl of 6× Laemmli buffer, heated at 100°C for 3 min, and subjected to sodium dodecyl sulfate-polyacrylamide gel electrophoresis on 12% acrylamide gels. All results of JNK1 assays presented are representative of at least three similar experiments. Fold activity was determined by phosphoimager analysis (Molecular Dynamics). GSK-3β activity in immunoprecipitates was assayed in a final volume of 20 μl containing 25 mM β-glycerophosphate (pH 7.4), 100 mM NaCl, 0.5 mM benzamidine, 0.05 mM Na3VO4, 0.5 mM DTT, 10 mM MgCl2, 50 μM phospho-GS peptide substrate (Upstate Biotechnology), and 50 μM [γ-32P]ATP (10 μCi). After incubation for 30 min at 30°C, the reaction was terminated with 15 μl of 75 mM phosphoric acid and centrifuged for 3 min, and 25 μl of the supernatant was spotted onto phosphocellulose units (Pierce). After washing in phosphoric acid, phosphate incorporation was determined by liquid scintillation counting. GSK-3β activity represents the mean ± standard error of three independent experiments, each performed in triplicate.
The activity of ribosomal S6 kinase (RSK) proteins, p70 S6 kinase (p70S6K), and protein kinase B (AKT) proteins was determined by immune complex in vitro kinase assays using antibodies directed against RSK 1, 2, and 3, p70S6K, and AKT1 (Santa Cruz). Peptide substrates for RSK and p70S6K proteins (15 μg) and AKT (20 μg) were also obtained from Santa Cruz. Enzyme activity was assessed 1.5 h after pyruvate stimulation or 20 min after antimycin challenge. RSK3 phosphorylation of GSK-3 was assayed by an in vitro kinase reaction using a GSK fusion protein (New England Biolabs) as the substrate and the reaction conditions specified by the manufacturer.
Glycogen synthase activity was assayed as incorporation of [14C]glucose derived from uridine-5′-diphosphate[U-14C]glucose into glycogen (17). Results were expressed as fractional activities obtained in the absence or presence of 10 mM glucose 6-phosphate for 30 min at 30°C.
Fluorescence measurements.
Levels of mitochondrial oxidants were determined by dihydrorhodamine123 (DHR123; Molecular Probes) fluorescence as previously described (11, 24). Where indicated, cells were pretreated for 15 min with rotenone (100 μM), thenoyltrifluoroacetone (TTFA; 100 μM), or antimycin A (100 μM). Levels of cytosolic ROS were determined by loading cells with dichlorodihydrofluorescein diacetate (DCFDA; Molecular Probes) as previously described (37). In both cases, fluorescence was quantified from 50 to 100 random cells obtained from six separate fields and expressed as the relative fluorescence (mean ± standard deviation) compared to the basal state. Levels of intracellular ATP were assessed by the luciferin-luciferase bioluminescence assay using the ATP determination kit (Molecular Probes). Intracellular pH was assessed by loading cells with the fluorescent indicator 2′,7′-bis-(2-carboxyethyl)-5-(and 6)-carboxyfluorescein and assessing the ratio of emission intensity following excitation at 520 and 488 nm.
In vivo enzyme assays.
To determine whether pyruvate stimulated JNK activity in vivo, neonatal rats were given intraperitoneal injections of pyruvate. One hour after injection, livers were isolated and subsequently homogenized in 1 ml of kinase extraction buffer. Following brief centrifugation (10,000 × g for 10 min), 150 μg of protein extract was used to assess JNK1 activity. Corresponding levels of serum pyruvate were measured by the addition of lactate dehydrogenase, and the conversion of NADH to NAD was assessed at 340 nm (pyruvate diagnostic kit; Sigma).
RESULTS
Pyruvate stimulates JNK1 activity.
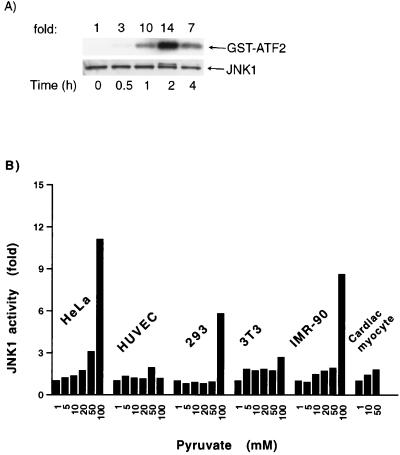
Previous reports have demonstrated that the addition of extracellular pyruvate, a three-carbon metabolite of glucose, stimulates cellular respiration (9, 16). We therefore treated HeLa cells with pyruvate as a means to acutely increase metabolic supply. To understand whether the addition of pyruvate in turn stimulated a cytosolic signaling cascade, we measured the activity of a variety of mitogen-activated protein kinase (MAPK) family members. Levels of JNK2 and p38 activity were unchanged, while ERK activity demonstrated a small increase following pyruvate addition (data not shown). In contrast, as demonstrated in Fig. 1A, the activity of JNK1 was potently activated by pyruvate. In the medium used to culture HeLa cells, pyruvate is normally present at a concentration of 1 mM. As demonstrated in Fig. 1B, increasing pyruvate concentrations in the 5 to 100 mM range resulted in an increase in JNK1 activity in a wide variety of different cell types.
FIG. 1.
Pyruvate stimulates an increase in cytosolic JNK1 activity. (A) Time course of JNK1 activity in HeLa cells following pyruvate (100 mM) stimulation. Activity was assessed in 30 μg of protein extract by immunocomplex kinase assays using GST-ATF2 as a substrate. Lysates were also probed by Western blot analysis for JNK1 protein levels. (B) Levels of JNK1 activity 1 h after pyruvate addition in various cell types. The normal concentration of pyruvate in basal medium was 1 mM.
Mitochondrial oxidants as mediators of JNK1 activation.
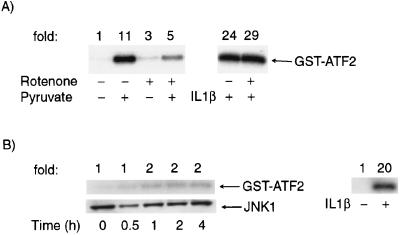
It is conceivable that the pyruvate-induced activation of JNK1 resulted from a secondary effect on overall energy metabolism. However, direct measurement of intracellular ATP 1 h after treatment with the highest concentration of pyruvate revealed that in HeLa cells, ATP levels were maintained at 95% ± 4% of control levels. Similarly, we could detect no change in intracellular pH following pyruvate administration (data not shown). Nonetheless, when compared to other known activators of JNK1, the increase in JNK1 activity by pyruvate was relatively slow, peaking roughly 1 to 2 h following metabolite addition. The delay in pyruvate-induced activation of JNK1 suggested that this activation indeed may not be a direct effect, but instead may require the prior mitochondrion-dependent metabolism of pyruvate. Therefore, to further understand the role of pyruvate metabolism in pyruvate-induced JNK1 activation, we treated cells with rotenone, a specific inhibitor of mitochondrial respiration. As shown in Fig. 2A, levels of pyruvate-induced JNK1 were reduced in the presence of rotenone, while the activation of JNK1 by other activators, such as IL-1β, was unaffected. To further define the requirement for mitochondrion-dependent pyruvate metabolism for the observed activation of JNK1, we depleted HeLa cells of respiration-competent mitochondria by long-term culturing in ethidium bromide. As demonstrated in Fig. 2B, pyruvate addition, up to 100 mM, was incapable of stimulating JNK1 in such cells, while the activation of IL-1β was essentially unaffected.
FIG. 2.
Role of the mitochondria in pyruvate-stimulated JNK1 activity. (A) Peak levels of pyruvate (100 mM) and IL-1β (10 ng/ml) stimulated JNK1 activity in cells pretreated (1 h, 25 μM) with rotenone, a specific mitochondrial complex I inhibitor. (B) Lack of pyruvate-induced JNK1 activity but preservation of IL-1β-stimulated JNK1 activity in HeLa cells depleted of mitochondria by treatment with ethidium bromide (400 ng/ml) for 7 days.
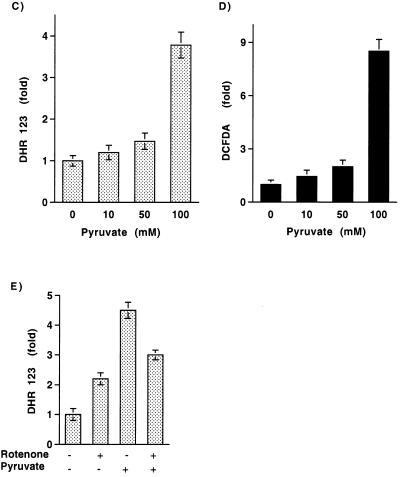
We next sought to understand whether the pyruvate-induced rise in JNK1 activity was secondary to an increase in mitochondrial oxidants. To assess the level of mitochondrial ROS, cells were loaded with DHR123. The intensity of DHR123 fluorescence has been used as a measure of mitochondrial H2O2 levels (11, 24). It is important to note that DHR123 is not an unambiguous measure of mitochondrial oxidants since this probe can presumably also be oxidized by peroxide produced by other intracellular oxidases and the organic cation generated can subsequently accumulate in the mitochondria. As demonstrated in Fig. 3A and B, the addition of pyruvate increased the level of DHR123 fluorescence. Consistent with the kinetics of JNK1 activation, levels of DHR123 fluorescence rose over the first 2 h after pyruvate addition. The dose response for mitochondrial oxidant levels as assessed by DHR123 fluorescence was similar to that observed for JNK1 activation (Fig. 3C). Similarly, measurements of cytosolic ROS levels with the peroxide-sensitive fluorophore DCFDA demonstrated that cytosolic peroxide levels rose after pyruvate addition (Fig. 3D). The addition of rotenone, in accord with its effects on JNK1 activity, produced a small increase in the basal level of mitochondrial oxidants. This is consistent with previous observations that complex I is a known, albeit relatively minor, site for mitochondrial ROS production (22). Perhaps more important than its modest effects on basal ROS levels, rotenone inhibited the pyruvate-induced rise in DHR123 fluorescence (Fig. 3E). These results demonstrate that consistent with its known effects in stimulating O2 consumption, pyruvate metabolism induces a rise in both mitochondrial and cytosolic oxidant levels.
FIG. 3.
Pyruvate addition stimulates the release of mitochondrial oxidants. Confocal image of DHR123 fluorescence (A) under basal conditions and (B) 2 h following 100 mM pyruvate addition. Dose-response of (C) pyruvate-induced DHR123 fluorescence and (D) DCFDA fluorescence. (E) Quantitation of DHR123 fluorescence under basal conditions and 2 h following pyruvate addition in the presence (25 μM for 1 h) and absence of rotenone.
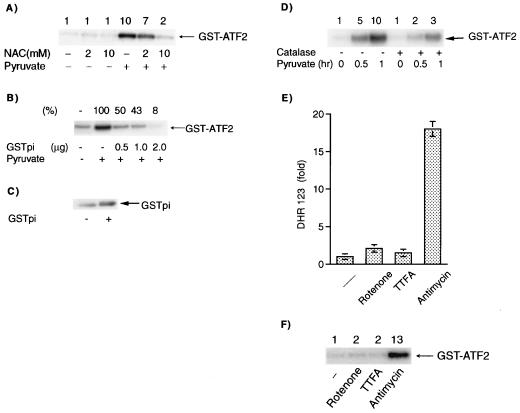
In an effort to further understand the role of mitochondrial oxidants in pyruvate-induced JNK activation, we treated cells with the peroxide-scavenging antioxidant _N_-acetylcysteine (NAC). As demonstrated in Fig. 4A, NAC treatment resulted in a concentration-dependent inhibition of metabolite-induced JNK1 activity. To further explore this notion, we transfected cells with an expression vector containing GSTpi. This cytosolic antioxidant protein has recently been demonstrated to form a molecular complex with JNK, and overexpression of GSTpi has been demonstrated to reduce oxidant-stimulated MKK4/SEK1 and JNK activity (1). As demonstrated in Fig. 4B and C, consistent with these previous results, transient expression of GSTpi significantly attenuated JNK activation by pyruvate. Previous studies have also demonstrated that extracellular administration of catalase can also inhibit peroxide-sensitive signaling pathways (13, 27, 37). In some cells, this is because catalase is apparently internalized (37), while in other cells, extracellular catalase may act as a sink for the freely diffusible peroxide that is formed intracellularly. As demonstrated in Fig. 4D, treatment of cells with extracellular catalase blocks pyruvate-induced JNK1 activation, again supporting a role for peroxide in this pathway.
FIG. 4.
Role of mitochondrial oxidants in the activation of JNK1. (A) Inhibitory effect of the peroxide-scavenging agent NAC on JNK1 activity. Where indicated, cells were incubated with NAC for 15 h prior to pyruvate stimulation. (B) Effects of increasing amounts of GSTpi expression on pyruvate-stimulated JNK1 activity. (C) Corresponding level of GSTpi protein expression in total cellular lysate in control transfected (−) or GSTpi-transfected (2 μg) cells. The amount of GSTpi in transfected cells is underestimated in this blot since transfection efficiency was approximately 20%. (D) Exogenous catalase blocks pyruvate-induced JNK1 activation. (E) Levels of DHR123 fluorescence 15 min after treatment with various mitochondrial respiratory inhibitors and (F) the corresponding levels of JNK1 activity.
To further underscore the relationship between the release of mitochondrial oxidants and cytosolic JNK1 activity, we made use of specific mitochondrial respiratory inhibitors as a direct method to increase mitochondrial oxidant release. As demonstrated in Fig. 4E, treatment with a complex I inhibitor (rotenone) or a complex II inhibitor (TTFA) produced a very modest increase in the basal level of DHR123 fluorescence. In contrast, antimycin A, an inhibitor of complex III function, resulted in a significant increase in mitochondrial ROS levels. Correspondingly, as demonstrated in Fig. 4F, although rotenone and TTFA had only modest effects, antimycin A significantly increased JNK1 activity.
Redox and JNK-dependent regulation of GSK-3.
If the activation of JNK1 by mitochondrial ROS provides a regulatory function, we reasoned that JNK1 should in turn affect the activity of enzymes regulating the flow of metabolites into the mitochondria. Previous studies have demonstrated that insulin stimulation of skeletal muscle (28) or glucose stimulation of hepatocytes (3) leads to activation of JNK and a fall in GSK activity. Although both insulin or glucose stimulate a host of other intracellular kinases, in these two previous studies, the activation of JNK appeared to be the most likely candidate to mediate the phosphorylation-dependent fall in GSK-3 activity. GSK is a well-characterized and pivotal enzyme involved in glycogen metabolism. A reduction in GSK-3 activity would favor increased conversion of glucose to glycogen and hence divert the flow of metabolites away from the mitochondria. In the setting of high pyruvate levels, a fall in GSK-3 activity would make physiological sense, since this represents a condition in which the further metabolism of glucose is unnecessary. Nonetheless, neither the effects of pyruvate on GSK-3 activity nor the role of intracellular oxidants on GSK-3 activity has been explored.
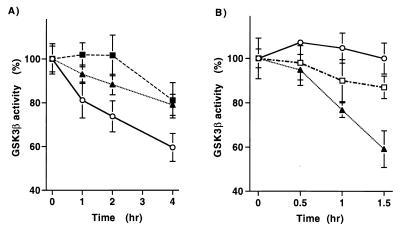
As demonstrated in Fig. 5A, pyruvate addition caused a significant fall in GSK-3β activity. The ability of pyruvate to inhibit GSK-3β activity is, however, dependent on intracellular oxidant levels. In accordance with its effects on JNK1 activity, cells incubated with increasing concentrations of the peroxide scavenger NAC demonstrated a blunted fall in GSK-3β activity following pyruvate addition (Fig. 5A). Interestingly, the effects of direct mitochondrial oxidative stress on GSK-3β activity are qualitatively similar to those induced by metabolite addition. As demonstrated in Fig. 5B, incubation with antimycin A led to a significant reduction in GSK-3β activity, while similar treatment with rotenone had only a modest effect. The reduction in GSK-3β activity following direct mitochondrial oxidative stress is, however, quicker than what is seen following pyruvate addition. These differences in kinetics are nonetheless consistent with the differences in kinetics of ROS generation and subsequent JNK1 activation that are observed following direct oxidative stress versus metabolite addition.
FIG. 5.
Redox-dependent activation of GSK-3β. (A) Levels of GSK-3β activity following pyruvate addition in the presence and absence of the peroxide scavenger NAC (circles, pyruvate only; triangles, pyruvate with 2 mM NAC; squares, pyruvate with 10 mM NAC). (B) GSK-3β activity following treatment with 25 μM antimycin A (triangles), 25 μM rotenone (squares), or vehicle only (circles).
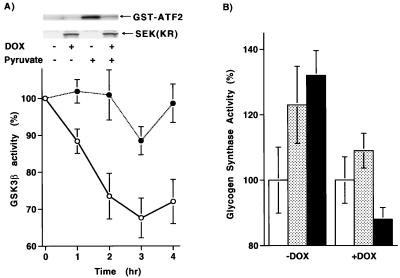
To further assess the role of JNK in regulating GSK-3β activity, we expressed a dominant negative form of SEK1 (MKK4), a proximate upstream JNK activator, under the control of a tetracycline-dependent promoter. Addition of doxycycline induced the dominant negative SEK1 gene product, and pyruvate-induced JNK1 activity was subsequently inhibited (Fig. 6A, inset). As demonstrated in Fig. 6A, induction of the dominant negative SEK1 isoform inhibited the pyruvate-induced fall in GSK-3β activity, demonstrating a requirement for JNK activation in this process. The fall in GSK-3β activity resulted in a subsequent change in cytosolic metabolism. As shown in Fig. 6B, pyruvate addition or antimycin treatment resulted in a rise in glycogen synthase activity. The rise in glycogen synthase activity induced by these agents was, however, inhibited in cells expressing a dominant negative SEK1 isoform.
FIG. 6.
Role for JNK1 in cytosolic metabolism. (A) Levels of GSK-3β activity in a HeLa cell line expressing a tetracycline-inducible dominant negative SEK1 isoform. Activity following pyruvate addition was assessed in the presence (solid circles) or absence (open circles) of doxycycline (DOX, 1 μg/ml). (Inset) Levels of expression of the dominant negative SEK1 isoform and the corresponding JNK1 activity in the presence and absence of doxycycline. (B) Glycogen synthase activity following pyruvate treatment (stippled bar), antimycin treatment (shaded bar), or under basal conditions (open bar). Activity was assessed in cells expressing a doxycycline (DOX)-inducible form of a dominant negative SEK1 isoform.
In vivo activation of JNK1.
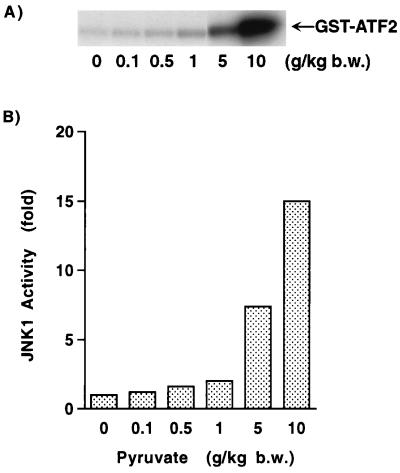
To further extend and confirm the physiological significance of these results, we assessed the ability of pyruvate to stimulate JNK activity in vivo. Neonatal rats were given a bolus of pyruvate, and 1 h later, levels of JNK1 activity were determined in liver extracts. As shown in Fig. 7A, pyruvate addition resulted in a significant increase in JNK1 activity. A dose-response curve of pyruvate concentration and JNK1 activity demonstrated that similar to what was noted in vitro, pyruvate stimulated JNK1 activity over a wide range of concentrations (Fig. 7B). Analysis of serum levels of pyruvate in neonatal rats revealed that baseline levels of pyruvate were 0.30 ± 0.05 mM. At the time of sacrifice, following the largest dose of pyruvate, serum levels rose approximately sixfold to 1.84 ± 0.02 mM.
FIG. 7.
In vivo assessment of JNK1 activity. (A) JNK1 activity in rat liver homogenates 1 h following injection of the indicated amount of pyruvate. (B) In vivo dose-response of JNK1 activity following pyruvate. b.w., body weight.
A role for RSK3.
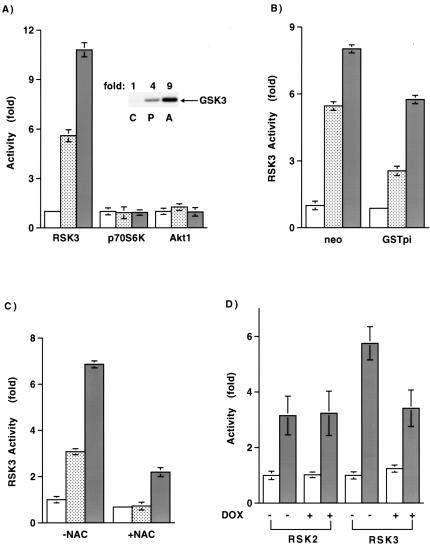
We next sought to further characterize the pathway leading from JNK activation to the fall in GSK-3β activity. Based on the above results, the kinase that regulates GSK-3β should be activated by agents such as pyruvate and antimycin, and this activation should be redox and JNK dependent. Using purified proteins, we could not, however, demonstrate direct phosphorylation of GSK-3β by activated JNK (data not shown). Previous studies have demonstrated that GSK-3 is phosphorylated and hence inactivated by the RSK, p70S6K, and the AKT family of kinases (4). We therefore assayed these kinases following treatment with pyruvate or direct mitochondrial oxidant stimulation by antimycin. As shown in Fig. 8A, neither p70S6K nor AKT kinase activity was significantly increased following pyruvate or antimycin treatment. Interestingly, both p70S6K and AKT are stimulated by exogenous hydrogen peroxide (6, 40), suggesting that the source and subcellular localization of oxidant production may be critical to understanding the specificity of the observed response. In contrast to the lack of effect on p70S6K and AKT, both pyruvate and antimycin led to a significant increase in RSK activity. Although the activity of all three RSK isoforms increased following stimulation with pyruvate or antimycin, we observed the largest increase with RSK3. In general, pyruvate addition led to a three- to sixfold increase in RSK3 activity, while antimycin resulted in a 6- to 10-fold increase. Consistent with a direct involvement, activated RSK3 could, in an in vitro kinase assay, phosphorylate a GSK-3 fusion protein (Fig. 8A, inset). Activation of RSK3 by pyruvate and antimycin was also sensitive to the cellular redox state. As noted in Fig. 8B and C, activation of RSK3 by these agents was inhibited either by stable expression of GSTpi or by pretreatment with NAC. Consistent with a requirement for JNK in this pathway, oxidant-stimulated RSK3 activation but not the activation of RSK2 was inhibited by expression of a dominant negative isoform of SEK1 (Fig. 8D). The latter results are consistent with past studies demonstrating that, in contrast to RSK1 and -2, whose activation appears primarily dependent on ERK activity (4), RSK3 is less dependent on ERK activity (42) and can instead be directly activated by JNK (28).
FIG. 8.
Activation of RSK3 by mitochondrial oxidants. (A) Assessment of RSK3, p70S6K, and AKT1 activity under basal conditions or following pyruvate stimulation or antimycin treatment. (Inset) In vitro phosphorylation of a GSK fusion protein using immunoprecipitated RSK3 from control (C), pyruvate (P)-, or antimycin (A)-stimulated lysate. (B) Basal and stimulated levels of RSK3 activity in cells stably expressing an approximately twofold increase in GSTpi or in control (neo)-transfected cells. (C) Levels of RSK3 activity with or without overnight pretreatment with 20 mM NAC. RSK3 activity was assessed under basal conditions (open bar) or 90 min after 100 mM pyruvate (stippled bar) or 25 μM antimycin (shaded bar) treatment. (D) Levels of RSK2 or RSK3 activity under basal conditions or after increased mitochondrial oxidant release induced by antimycin treatment. Activity was assessed in the absence (−) or presence (+) of a dominant negative SEK1 isoform.
DISCUSSION
Our results demonstrate that an increase in metabolite supply, in this case in the form of pyruvate, is capable of activating JNK1. This is not a direct effect of pyruvate, but instead requires the mitochondrion-dependent metabolism of this substrate. An increase in mitochondrial ROS develops as a consequence of the increase in metabolism, and the subsequent generation of H2O2 is essential for the activation of JNK1. Not unexpectedly, pyruvate causes a fall in GSK-3β activity. Interestingly, this reduction in GSK-3β activity requires the redox-dependent activation of JNK1 and appears to proceed through RSK3 activation. As such, these results describe the outline of the novel regulatory loop depicted in Fig. 9.
FIG. 9.
Model for mitochondrial oxidants as regulators of cellular metabolism. As described, an increase in metabolite flow to the mitochondria results in an increase in O2 consumption with the subsequent increased release of ROS into the cytosol. This increased ROS level is sensed by the cytosol, resulting in the activation of JNK1. In turn, JNK1 inhibits the activity of GSK-3β, most likely through a pathway involving RSK3. The resulting change in GSK-3 activity leads to augmented glycogen synthase (GS) activity. Increased glycogen synthase activity results in an increased conversion of glucose to glycogen, with a subsequent reduction in metabolic substrate and hence a fall in mitochondrial oxidants. In addition to the effects of peroxide on JNK activity, peroxide can also result in the decarboxylation of pyruvate and thereby reduce mitochondrial metabolism, represented as the flow of electrons (e−) through complexes I through IV. CoA, coenzyme A; CoQ, coenzyme Q; MnSOD, manganese superoxide dismutase.
We observed an increase in JNK1 activity in a variety of different cell types over a range of pyruvate concentrations. The largest increase in JNK1 activity came at a high pyruvate concentration, suggesting that the pathways described here may primarily operate in the setting of a sudden, large increase in metabolic supply. Nonetheless, it is important to note that cells in culture, particularly transformed cells, have an increased rate of anaerobic glycolysis. As such, the percentage of pyruvate entering the mitochondria may be significantly reduced in cultured cells. It should also be noted that it has been known for many years that pyruvate can scavenge peroxide directly, resulting in the oxidative decarboxylation of pyruvate (26). In light of the results presented here, it is tempting to speculate that this property of pyruvate has a homeostatic effect. In particular, small increases in pyruvate would cause increases in mitochondrial peroxide generation that in turn could be scavenged by cytosolic pyruvate. In the process of scavenging hydrogen peroxide, pyruvate is decarboxylated to lactate and hence diverted away from aerobic metabolism and further ROS generation. It is possible that the scavenging and decarboxylation of pyruvate help regulates metabolic flux under basal conditions, while the pathway described in this paper may primarily operate following a large metabolic load. Under such conditions, the ROS generated by pyruvate would exceed the scavenging capacity of pyruvate. This is consistent with our observations that under conditions in which pyruvate stimulated JNK1 activity, both mitochondrial and cytosolic ROS levels rose.
The in vivo activation of JNK1 by pyruvate occurred with an approximately sixfold rise in serum pyruvate levels. Although this represents a significant rise in pyruvate levels, recent evidence suggests that vigorous exercise can produce a similar three- to fivefold elevation in human subjects (12). Similarly, in preliminary studies in our laboratory, pyruvate levels rose approximately threefold 1 h after eating a large slice of chocolate cake (unpublished observations). As such, the activation of JNK1 by pyruvate occurs at apparently high but physiologically achievable doses of serum pyruvate.
In the process of review of the manuscript, a report appeared suggesting that the increase in mitochondrial ROS induced by elevated glucose levels may contribute to many of the pathological changes observed in diabetes (29). In particular, elevated mitochondrial ROS appeared to contribute to glucose-stimulated activation of protein kinase C, sorbitol accumulation, and the activation of NF-κB. Inhibition of each of these pathways appears in previous animal studies to provide benefits from some of the complications of diabetes. Given these recent results as well as the data presented here, it is tempting to speculate that the homeostatic regulation provided by mitochondrial oxidants may be perturbed in certain disease states such as diabetes. Under these conditions the normal negative feedback provided by mitochondrial oxidants may not be present or as robust. In this setting, high levels of metabolic substrate such as glucose or pyruvate would not be appropriately channeled into glycogen. Consistent with this notion, glycogen synthesis activity is known to be impaired in type II diabetics (18). Direct scavenging of mitochondrial oxidants or augmenting the activation of JNK1 may therefore be one strategy to prevent these perturbations. In this regard, the compound RO 31-8220 has been recently shown to activate JNK and increase cellular glycogen synthase activity (34). Interestingly, preliminary evidence suggests that in vivo administration of this compound appears to reverse some of the metabolic abnormalities seen in the type II diabetic Goto-Kakizaki rats (34).
A growing body of literature suggests that oxidants function as signaling molecules (14, 23, 32). Many ligands appear to stimulate cytosolic oxidant production, and this ligand-activated change in oxidant production appears to affect a variety of downstream pathways. In contrast to the growing appreciation that oxidants generated in the cytosol contribute to signaling pathways, the continuous release of mitochondrial oxidants has been generally regarded solely as a deleterious byproduct of aerobic metabolism. Nonetheless, oxidants are also employed as signaling molecules in plants (2), suggesting that this represents an evolutionarily conserved method of signal transduction. The ancient incorporation of mitochondria into eukaryotic cells undoubtably required that the cell cytosol coordinate metabolite flow and metabolic rates with these newly acquired energy-producing organelles. Our results suggest that one means by which the mitochondria and the cytoplasm communicate is by the release of the small diffusible molecule hydrogen peroxide.
REFERENCES
- 1.Adler V, Yin Z, Fuchs S Y, Benezra M, Rosario L, Tew K D, Pincus M R, Sardana M, Henderson C J, Wolf C R, Davis R J, Ronai Z. Regulation of JNK signaling by GSTp. EMBO J. 1999;18:1321–1334. doi: 10.1093/emboj/18.5.1321. [DOI] [PMC free article] [PubMed] [Google Scholar]
- 2.Alvarez M E, Pennell R I, Meijer P J, Ishikawa A, Dixon R A, Lamb C. Reactive oxygen intermediates mediate a systemic signal network in the establishment of plant immunity. Cell. 1998;92:773–784. doi: 10.1016/s0092-8674(00)81405-1. [DOI] [PubMed] [Google Scholar]
- 3.Auer K L, Contessa J, Brenz-Verca S, Pirola L, Rusconi S, Cooper G, Abo A, Wymann M P, Davis R J, Birrer M, Dent P. The Ras/Rac1/Cdc42/SEK/JNK/c-Jun cascade is a key pathway by which agonists stimulate DNA synthesis in primary cultures of rat hepatocytes. Mol Biol Cell. 1998;9:561–573. doi: 10.1091/mbc.9.3.561. [DOI] [PMC free article] [PubMed] [Google Scholar]
- 4.Avruch J. Insulin signal transduction through protein kinase cascades. Mol Cell Biochem. 1998;182:31–48. [PubMed] [Google Scholar]
- 5.Bae Y S, Kang S W, Seo M S, Baines I C, Tekle E, Chock P B, Rhee S G. Epidermal growth factor (EGF)-induced generation of hydrogen peroxide. Role in EGF receptor-mediated tyrosine phosphorylation. J Biol Chem. 1997;272:217–221. [PubMed] [Google Scholar]
- 6.Bae G U, Seo D W, Kwon H K, Lee H Y, Hong S, Lee Z W, Ha K S, Lee H W, Han J W. Hydrogen peroxide activates p70(S6k) signaling pathway. J Biol Chem. 1999;274:32596–32602. doi: 10.1074/jbc.274.46.32596. [DOI] [PubMed] [Google Scholar]
- 7.Banfi B, Maturana A, Jaconi S, Arnaudeau S, Laforge T, Sinha B, Ligeti E, Demaurex N, Krause K H. A mammalian H+ channel generated through alternative splicing of the NADPH oxidase homolog NOH-1. Science. 2000;287:138–142. doi: 10.1126/science.287.5450.138. [DOI] [PubMed] [Google Scholar]
- 8.Beckman K B, Ames B N. The free radical theory of aging matures. Physiol Rev. 1998;78:547–581. doi: 10.1152/physrev.1998.78.2.547. [DOI] [PubMed] [Google Scholar]
- 9.Biaglow J E, Cerniglia G, Tuttle S, Bakanauskas V, Stevens C, McKenna G. Effect of oncogene transformation of rat embryo cells on cellular oxygen consumption and glycolysis. Biochem Biophys Res Commun. 1997;235:739–742. doi: 10.1006/bbrc.1997.6835. [DOI] [PubMed] [Google Scholar]
- 10.Boveris A, Chance B. The mitochondrial generation of hydrogen peroxide: general properties and effect of hyperbaric oxygen. Biochem J. 1973;134:707–716. doi: 10.1042/bj1340707. [DOI] [PMC free article] [PubMed] [Google Scholar]
- 11.Cai J, Jones D P. Superoxide in apoptosis: mitochondrial generation triggered by cytochrome c loss. J Biol Chem. 1998;273:11401–11404. doi: 10.1074/jbc.273.19.11401. [DOI] [PubMed] [Google Scholar]
- 12.Carter H, Jones A M, Doust J H. Changes in blood lactate and pyruvate concentrations and the lactate-to-pyruvate ratio during the lactate minimum speed test. J Sports Sci. 2000;18:213–225. doi: 10.1080/026404100365117. [DOI] [PubMed] [Google Scholar]
- 13.De Bleser P J, Xu G, Rombouts K, Rogiers V, Geerts A. Glutathione levels discriminate between oxidative stress and transforming growth factor-beta signaling in activated rat hepatic stellate cells. J Biol Chem. 1999;274:33881–33887. doi: 10.1074/jbc.274.48.33881. [DOI] [PubMed] [Google Scholar]
- 14.Finkel T. Oxygen radicals and signaling. Curr Opin Cell Biol. 1998;10:248–253. doi: 10.1016/s0955-0674(98)80147-6. [DOI] [PubMed] [Google Scholar]
- 15.Griendling K K, Minieri C A, Ollerenshaw J D, Alexander R W. Angiotensin II stimulates NADH and NADPH oxidase activity in cultured vascular smooth muscle cells. Circ Res. 1994;74:1141–1148. doi: 10.1161/01.res.74.6.1141. [DOI] [PubMed] [Google Scholar]
- 16.Guidarelli A, Brambilla L, Clementi E, Sciorati C, Cantoni O. Stimulation of oxygen consumption promotes mitochondrial calcium accumulation, a process associated with, and causally linked to, enhanced formation of tertbutylhydroperoxide-induced DNA single-strand breaks. Exp Cell Res. 1997;237:176–185. doi: 10.1006/excr.1997.3779. [DOI] [PubMed] [Google Scholar]
- 17.Guinovart J J, Salavert A, Massague J, Ciudad C J, Salsas E, Itarte E. Glycogen synthase: a new activity ratio assay expressing a high sensitivity to the phosphorylation state. FEBS Lett. 1979;106:284–288. doi: 10.1016/0014-5793(79)80515-3. [DOI] [PubMed] [Google Scholar]
- 18.Haring H. Pathophysiology of insulin resistance. Herz. 1995;20:5–15. [PubMed] [Google Scholar]
- 19.Irani K, Xia Y, Zweier J L, Sollott S J, Der C J, Fearon E R, Sundaresan M, Finkel T, Goldschmidt-Clermont P J. Mitogenic signaling mediated by oxidants in Ras-transformed fibroblasts. Science. 1997;275:1649–1652. doi: 10.1126/science.275.5306.1649. [DOI] [PubMed] [Google Scholar]
- 20.Joneson T, Bar-Sagi D. A Rac1 effector site controlling mitogenesis through superoxide production. J Biol Chem. 1998;273:17991–17994. doi: 10.1074/jbc.273.29.17991. [DOI] [PubMed] [Google Scholar]
- 21.Kheradmand F, Werner E, Tremble P, Symons M, Werb Z. Role of Rac1 and oxygen radicals in collagenase-1 expression induced by cell shape change. Science. 1998;280:898–902. doi: 10.1126/science.280.5365.898. [DOI] [PubMed] [Google Scholar]
- 22.Kwong L K, Sohal R S. Substrate and site specificity of hydrogen peroxide generation in mouse mitochondria. Arch Biochem Biophys. 1998;350:118–126. doi: 10.1006/abbi.1997.0489. [DOI] [PubMed] [Google Scholar]
- 23.Lander H M. An essential role for free radicals and derived species in signal transduction. FASEB J. 1997;11:118–124. [PubMed] [Google Scholar]
- 24.Lee A C, Fenster B E, Ito H, Takeda K, Bae N S, Hirai T, Yu Z X, Ferrans V J, Howard B H, Finkel T. Ras proteins induce senescence by altering the intracellular levels of reactive oxygen species. J Biol Chem. 1999;274:7936–7940. doi: 10.1074/jbc.274.12.7936. [DOI] [PubMed] [Google Scholar]
- 25.Lee S R, Kwon K S, Kim S R, Rhee S G. Reversible inactivation of protein-tyrosine phosphatase 1B in A431 cells stimulated with epidermal growth factor. J Biol Chem. 1998;273:15366–15372. doi: 10.1074/jbc.273.25.15366. [DOI] [PubMed] [Google Scholar]
- 26.Mallet R T. Pyruvate: metabolic protector of cardiac performance. Proc Soc Exp Biol Med. 2000;223:136–148. doi: 10.1046/j.1525-1373.2000.22319.x. [DOI] [PubMed] [Google Scholar]
- 27.Min D S, Kim E G, Exton J H. Involvement of tyrosine phosphorylation and protein kinase C in the activation of phospholipase D by H2O2 in Swiss 3T3 fibroblasts. J Biol Chem. 1998;273:29986–29994. doi: 10.1074/jbc.273.45.29986. [DOI] [PubMed] [Google Scholar]
- 28.Moxham C M, Tabrizchi A, Davis R J, Malbon C C. Jun N-terminal kinase mediates activation of skeletal muscle glycogen synthase by insulin in vivo. J Biol Chem. 1996;271:30765–30773. doi: 10.1074/jbc.271.48.30765. [DOI] [PubMed] [Google Scholar]
- 29.Nishikawa T, Edelstein D, Du X L, Yamagishi S, Matsumura T, Kaneda Y, Yorek M A, Beebe D, Oates P J, Hammes H P, Giardino I, Brownlee M. Normalizing mitochondrial superoxide production blocks three pathways of hyperglycaemic damage. Nature. 2000;404:787–790. doi: 10.1038/35008121. [DOI] [PubMed] [Google Scholar]
- 30.Nohl H, Hegner D. Do mitochondria produce oxygen radicals in vivo? Eur J Biochem. 1978;82:563–567. doi: 10.1111/j.1432-1033.1978.tb12051.x. [DOI] [PubMed] [Google Scholar]
- 31.Pracyk J B, Tanaka K, Hegland D D, Kim K S, Sethi R, Rovira I I, Blazina D R, Lee L, Bruder J T, Kovesdi I, Goldschmidt-Clermont P J, Irani K, Finkel T. A requirement for the rac1 GTPase in the signal transduction pathway leading to cardiac myocyte hypertrophy. J Clin Investig. 1998;102:929–937. doi: 10.1172/JCI2552. [DOI] [PMC free article] [PubMed] [Google Scholar]
- 32.Rhee S G. Redox signaling: hydrogen peroxide as intracellular messenger. Exp Mol Med. 1999;31:53–59. doi: 10.1038/emm.1999.9. [DOI] [PubMed] [Google Scholar]
- 33.Sohal R S, Weindruch R. Oxidative stress, caloric restriction, and aging. Science. 1996;273:59–63. doi: 10.1126/science.273.5271.59. [DOI] [PMC free article] [PubMed] [Google Scholar]
- 34.Standaert M L, Bandyopadhyay G, Antwi E K, Farese R V. RO 31-8220 activates c-Jun N-terminal kinase and glycogen synthase in rat adipocytes and L6 myotubes: comparison to actions of insulin. Endocrinology. 1999;140:2145–2151. doi: 10.1210/endo.140.5.6699. [DOI] [PubMed] [Google Scholar]
- 35.Suh Y A, Arnold R S, Lassegue B, Shi J, Xu X, Sorescu D, Chung A B, Griendling K K, Lambeth J D. Cell transformation by the superoxide-generating oxidase Mox1. Nature. 1999;401:79–82. doi: 10.1038/43459. [DOI] [PubMed] [Google Scholar]
- 36.Sulciner D J, Irani K, Yu Z X, Ferrans V J, Goldschmidt-Clermont P, Finkel T. rac1 regulates a cytokine-stimulated, redox-dependent pathway necessary for NF-kappaB activation. Mol Cell Biol. 1996;16:7115–7121. doi: 10.1128/mcb.16.12.7115. [DOI] [PMC free article] [PubMed] [Google Scholar]
- 37.Sundaresan M, Yu Z X, Ferrans V J, Irani K, Finkel T. Requirement for generation of H2O2 for platelet-derived growth factor signal transduction. Science. 1995;270:296–299. doi: 10.1126/science.270.5234.296. [DOI] [PubMed] [Google Scholar]
- 38.Sundaresan M, Yu Z X, Ferrans V J, Sulciner D J, Gutkind J S, Irani K, Goldschmidt-Clermont P J, Finkel T. Regulation of reactive-oxygen-species generation in fibroblasts by Rac1. Biochem J. 1996;318(Pt. 2):379–382. doi: 10.1042/bj3180379. [DOI] [PMC free article] [PubMed] [Google Scholar]
- 39.Trotti D, Danbolt N C, Volterra A. Glutamate transporters are oxidant-vulnerable: a molecular link between oxidative and excitotoxic neurodegeneration? Trends Pharmacol Sci. 1998;19:328–334. doi: 10.1016/s0165-6147(98)01230-9. [DOI] [PubMed] [Google Scholar]
- 40.Ushio-Fukai M, Alexander R W, Akers M, Yin Q, Fujio Y, Walsh K, Griendling K K. Reactive oxygen species mediate the activation of Akt/protein kinase B by angiotensin II in vascular smooth muscle cells. J Biol Chem. 1999;274:22699–22704. doi: 10.1074/jbc.274.32.22699. [DOI] [PubMed] [Google Scholar]
- 41.Wallace D C, Melov S. Radicals r'aging. Nat Genet. 1998;19:105–106. doi: 10.1038/448. [DOI] [PubMed] [Google Scholar]
- 42.Zhao Y, Bjorbaek C, Weremowicz S, Morton C C, Moller D E. RSK3 encodes a novel pp90rsk isoform with a unique N-terminal sequence: growth factor-stimulated kinase function and nuclear translocation. Mol Cell Biol. 1995;15:4353–4363. doi: 10.1128/mcb.15.8.4353. [DOI] [PMC free article] [PubMed] [Google Scholar]
