Physical properties of the cytoplasm modulate the rates of microtubule polymerization and depolymerization (original) (raw)
. Author manuscript; available in PMC: 2023 Feb 28.
Abstract
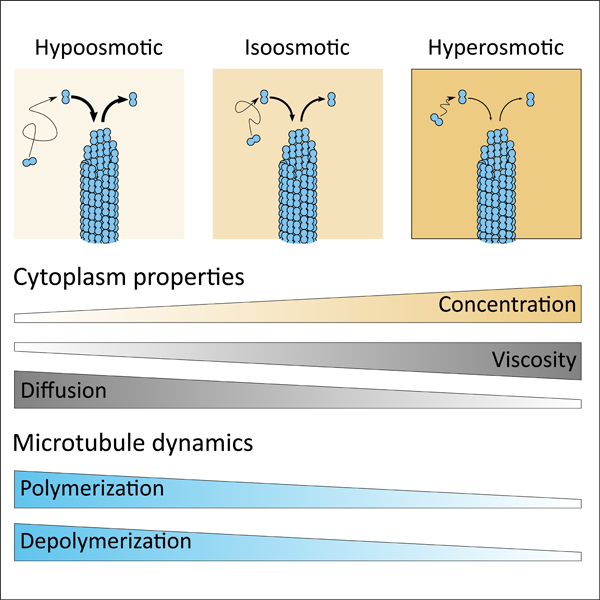
The cytoplasm is a crowded, visco-elastic environment whose physical properties change according to physiological or developmental states. How the physical properties of the cytoplasm impact cellular functions in vivo remain poorly understood. Here, we probed the effects of cytoplasmic concentration on microtubules by applying osmotic shifts to fission yeast, moss, and mammalian cells. We show that both the rates of microtubule polymerization and depolymerization scale linearly and inversely with cytoplasmic concentration; an increase in cytoplasmic concentration decreases the rates of microtubule polymerization and depolymerization proportionally, while a decrease in cytoplasmic concentration leads to the opposite. Numerous lines of evidence indicate that these effects are due to changes in cytoplasmic viscosity rather than cellular stress responses or macromolecular crowding per se. We reconstituted these effects on microtubules in vitro by tuning viscosity. Our findings indicate that, even in normal conditions, the viscosity of cytoplasm modulates the reactions underlying microtubule dynamic behaviors.
Keywords: Cytoskeleton dynamics, microtubules, cytoplasm, crowding, viscosity, diffusion, density, rheology, mitosis, fission yeast Schizosaccharomyces pombe
Graphical Abstract
eTOC
How dynamic cellular processes operate in the complex environment of the cytoplasm remains poorly understood. Molines et al. show that the cytoplasm physically dampens microtubule assembly and disassembly through its viscous properties. These findings demonstrate the importance of cytoplasmic viscosity on biochemical reaction rates within the living cell.
Introduction
Cytoplasm is composed of 100–300 mg/ml of macromolecules (proteins, nucleic acids, lipids, etc.), which occupy 10–40% of the total cellular volume (Milo and Phillips, 2015; Neurohr and Amon, 2020). These components range in size from small globular proteins to extended networks of organelles and cytoskeletal polymers. Ribosomes alone occupy ~20% of that volume (Delarue et al., 2018). Biophysical studies revealed that these constituents form a porous, visco-elastic material that allows diffusion of small molecules but impedes movement of larger particles (Luby-Phelps et al., 1986; Moeendarbary et al., 2013; Xiang et al., 2020), and molecular simulations show a high density of macromolecules jostling and colliding from diffusive motion (Mcguffee and Elcock, 2010; Yu et al., 2016).
In contrast to the density of inert materials, the density of the cytoplasm is regulated as part of cell physiology. Indeed, cytoplasmic density varies during the cell cycle, among different cell types, as a result of aging, as a response to nutritional stress, and as a response to disease (Neurohr and Amon, 2020). These density changes likely affect macromolecule concentrations and the physical properties of the cytoplasm such as its degree of crowding and/or its viscosity, which in turn will impact a broad range of cellular processes, such as protein-protein associations, phase transitions, and enzymatic fluxes. It was also recently proposed that cells can tune the viscosity of their cytoplasm to regulate diffusion-dependent processes in response to temperature (Persson et al., 2020). Thus, it is critical to understand how cellular reactions are affected by the physical properties of cytoplasm.
The most prominent physical property of cytoplasm is macromolecular crowding. There are several conceptual models used to describe the influence of macromolecular crowding on biochemical reactions. Minton and colleagues have argued that bulky macromolecules “exclude volume”, a steric effect that increases the thermodynamic activity of other proteins (Minton, 2006; Shahid et al., 2017). Consistent with this idea, bulky macromolecules often accelerate biochemical reactions in vitro. Additionally, because macromolecules are rarely inert, they interact with proteins via short-term, non-specific hydrophobic interactions that can affect the rates and equilibria of reactions (Mcguffee and Elcock, 2010). Theoretical models of macromolecular crowding can explain how crowding impedes diffusion, produces entropic forces that draw molecules together, promotes phase separation, and produces osmotic pressure within cells (Ellis, 2001; Mitchison, 2019; Shahid et al., 2017). But the models of macromolecular crowding do not always make the same predictions. For example, Mitchison used the concept of colloidal osmotic pressure to argue that cytoplasm is functionally dilute, such that a reaction like microtubule (MT) polymerization would be unaffected by steric effects in vivo (Mitchison, 2019). To distinguish between these concepts, what is needed are experiments that perturb the physical properties of cytoplasm and measure the rates of cellular reactions in vivo.
The dynamic behavior of MTs represents an attractive case with which to probe the effects of the cytoplasm on defined biochemical reactions in vivo. First, the polymerization and depolymerization of single MTs are reactions that can be quantitatively measured in living cells and in vitro using microscopy. Second, the effects of macromolecular crowding on MTs in vitro are known: MTs grow significantly faster in the presence of bulky crowders but significantly slower in the presence of small viscous agents like glycerol (Wieczorek et al., 2013). These in vitro measurements can be compared to in vivo measurements when considering mechanisms. Third, at 100 kDa in mass and 8 nm in length, the tubulin dimer represents a size range typical for soluble proteins and enzymes, while the MT diameter at around 25 nm is similar to large macromolecular complexes such as the ribosome. Finally, MT polymerization depends on tubulin concentration while MT depolymerization does not (Fygenson et al., 1994; Walker et al., 1988). Thus, changes in tubulin concentration (e.g., because of changes in cytoplasmic concentration) should impact polymerization alone, which is a testable prediction of some models. Taken together, MTs are well-suited to probe what properties of cytoplasm have the strongest impact on cellular reactions, and more generally, to inform biophysical models describing the physical properties of cytoplasm.
Fission yeast is an excellent model organism with which to study the physical regulation of MT dynamics in vivo. We can readily image the interphase MT bundles and measure the dynamic behavior of individual MTs with precision (Höög et al., 2007; Loiodice et al., 2019; Sawin and Tran, 2006). Various effects of osmotic shocks on fission yeast cells on polarized cell growth and cytoskeleton have been described (Chowdhury et al., 1992; Haupt and Ershov, 2018; Mutavchiev et al., 2016; Robertson and Hagan, 2008). Osmotic shifts create rapid changes in cellular volume, suggesting that such treatments can be used to tune cytoplasmic properties (Atilgan et al., 2015; Knapp et al., 2019).
Here, we study the effects of the physical properties of the cytoplasm on MTs dynamics by using osmotic shifts to vary cytoplasmic concentration acutely. We show that hyperosmotic shifts, which increase cytoplasmic concentration, lead to dampening and “freezing” of MT polymerization and depolymerization. Conversely, hypoosmotic shifts, which decrease cytoplasmic concentration, lead to increased rates of MT polymerization and depolymerization. The observed proportionate changes to MT rates, which were independent of the osmotic stress response and key MT regulators, correlated with global changes in cytoplasmic physical properties and were recapitulated in vitro through modulation of viscosity. These findings demonstrate that the cytoplasm modulates MT dynamics through viscous effects even at normal concentrations of cytoplasm.
Results
Osmotic shifts modulate microtubule dynamics in cells.
The density of cellular components can be experimentally manipulated by varying the osmotic environment using osmotic agents such as sorbitol (Knapp et al., 2019) which does not enter cells (Watari et al., 2004; Wood et al., 1968). An acute increase in the external osmolarity leads to a corresponding increase in intracellular osmolarity (Beauzamy et al., 2014). We manipulated live fission yeast cells by adding sorbitol to the growth medium, which led to an acute decrease in cell volume in a dose-dependent, reversible manner (Fig. 1 A and B) (Sup. Fig. 1 and Sup. Fig. 2) (Atilgan et al., 2015; Knapp et al., 2019). For instance, cell volume decreased by up to 50% with 1.5 M sorbitol added to rich media, without loss in cell viability (Sup. Fig. 1). This volume decreased presumably occurred through water loss to cause a corresponding increase in macromolecule concentration (Beauzamy et al., 2014). Indeed, we confirmed the increase in macromolecules concentration by measuring fluorescence intensity of GFP-labeled tubulin and a ribosomal protein Rps802 in sorbitol treated cells as well as by refractive index measurements (Sup. Fig. 1). Hence, hyperosmotic shocks can be used to acutely manipulate the intracellular concentration of macromolecules.
Figure 1: MT growth and shrinkage rates decrease upon hyperosmotic shock in yeast cells.
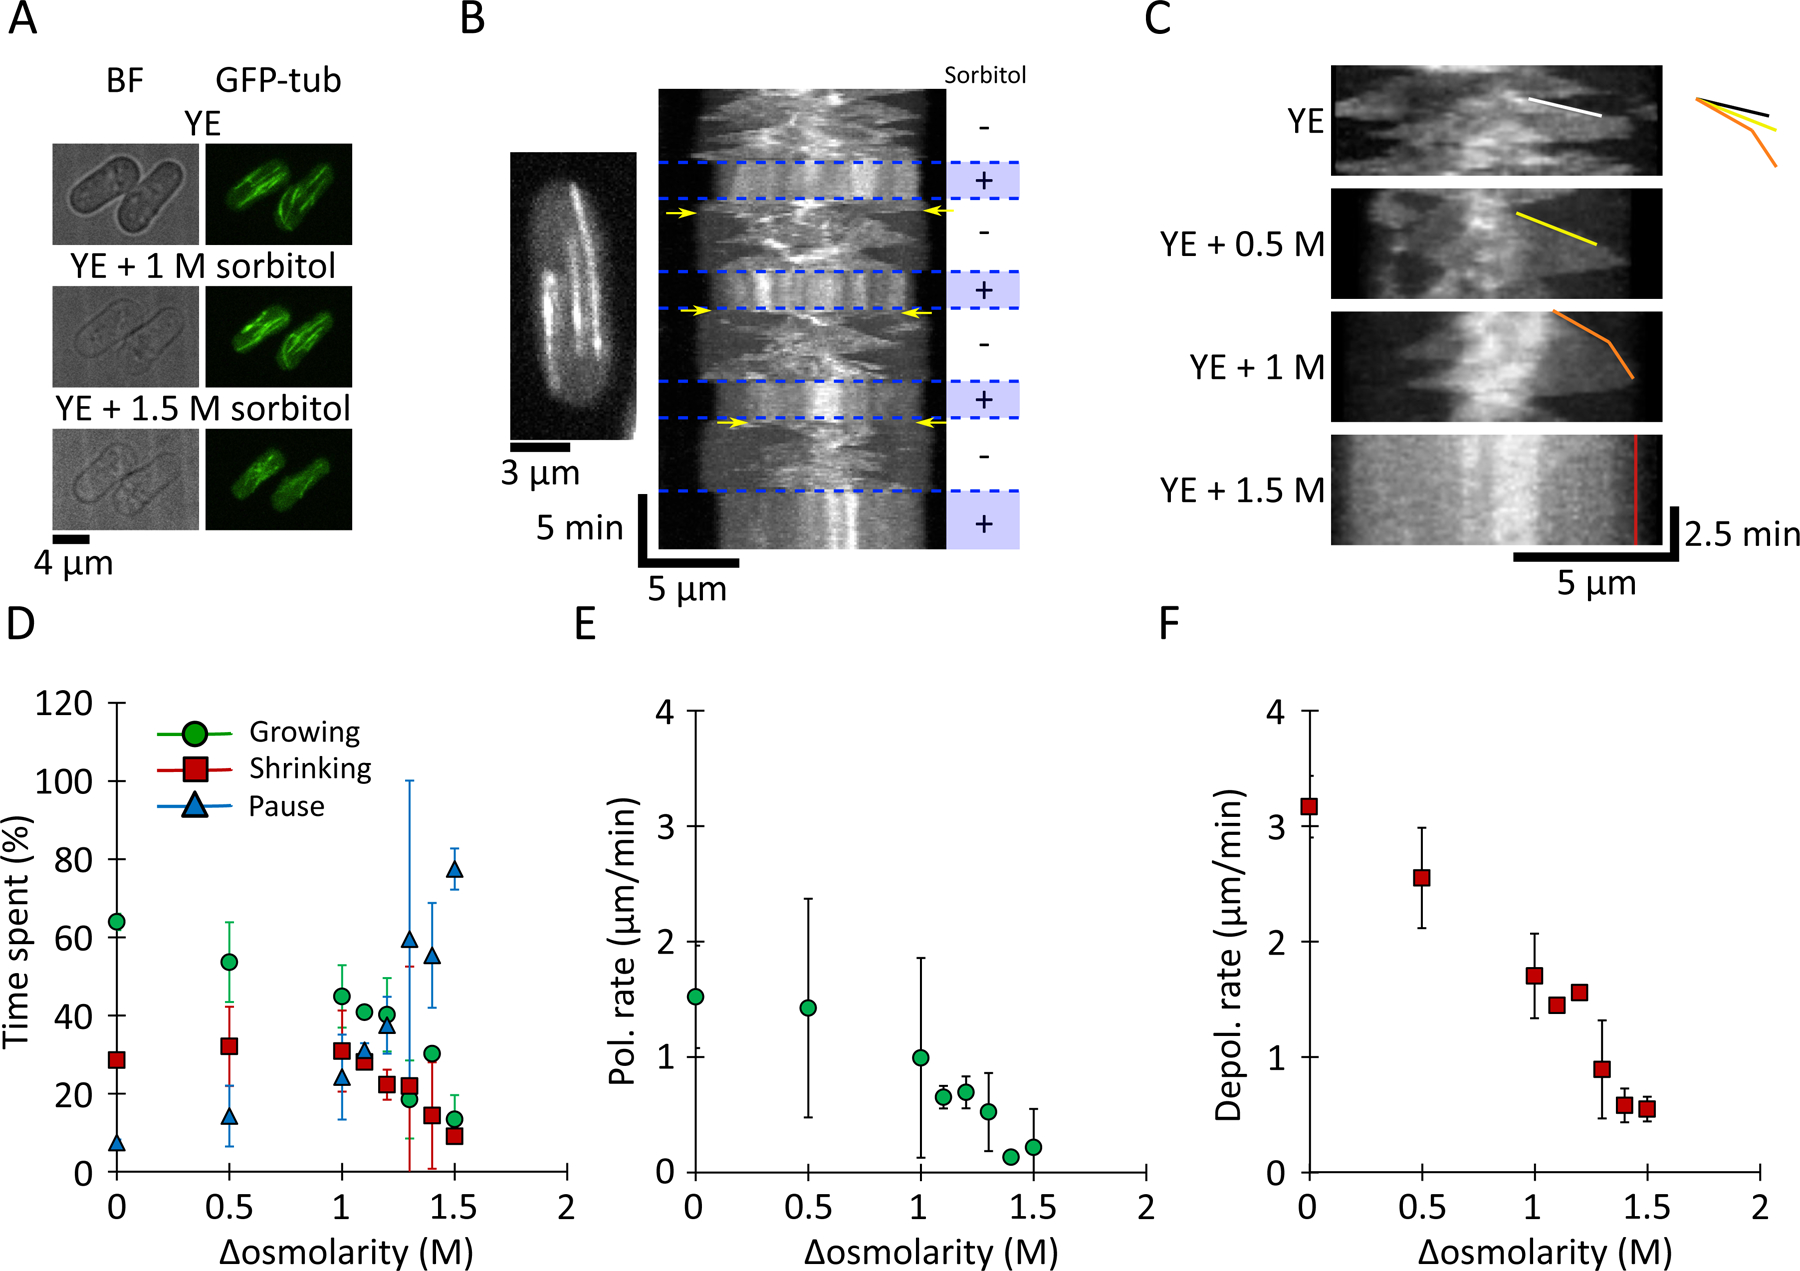
(A) Brightfield (BF; left) and fluorescence (right) images of interphase MT bundles in two fission yeast cells expressing GFP-tubulin (GFP-tub) upon sequential treatment with YE (medium alone), YE + 1 M sorbitol, and YE + 1.5 M sorbitol.
(B) MT dynamics in a cell treated with oscillations of YE (5 min) and YE + 1.5 M sorbitol (3 min). In the kymograph, this representative cell is expressing GFP-tubulin; the cell image has been collapsed onto a line. MTs exhibit decreased dynamics acutely in 1.5 M sorbitol. Upon sorbitol washout, MTs first depolymerize (yellow arrows) and then resume dynamic behaviors.
(C) Kymographs of MTs in yeast cells at the indicated sorbitol concentrations. Lines highlight tracks of single growing MT plus-ends. Colored lines highlight growth events.
(D) Percentage of time that interphase MTs spent growing (green circles), shrinking (red squares), or paused (blue triangles) in YE and after hyperosmotic shocks (AVG +/− standard deviation). Cell and MT values of n are as in (E).
(E) MT polymerization rates (green circles) in yeast cells treated acutely with the indicated sorbitol concentrations. Values are AVG +/− standard deviation. Data come from (left to right) n = 58 / 51 / 32 / 27 / 38 / 23 / 15 / 26 cells and 118 / 99 / 60 / 65 / 72 / 34 / 22 / 44 MT, respectively, from at least 2 experiments.
(F) MT depolymerization (red squares) rates in yeast cells treated acutely with the indicated sorbitol concentrations. Values are AVG +/− standard deviation. Cell and MT values of n are as in (E).
See supplemental movies 1 and 2.
Having validated this approach to alter intracellular concentration, we applied it to cells expressing GFP-tubulin to monitor MT dynamics. Time-lapse imaging of untreated cells showed that interphase MTs were characteristically dynamic, polymerizing and depolymerizing, with little time in “pause” (Tran et al., 2001). In contrast, hyperosmotic shifts caused significant changes in the dynamic behaviors of interphase MTs, as noted previously (Robertson and Hagan, 2008; Tatebe et al., 2005). We found that in acute response to hyperosmotic shifts, the interphase MT cytoskeleton appeared to “freeze” (Fig. 1B and C), especially at high sorbitol concentrations (e.g. 1.5 M) (Fig. 1 B, C and D). In general, MTs were “paused” at various lengths and exhibited little or no polymerization or depolymerization. To determine whether the effects of the hyperosmotic shifts were reversible, we cycled the concentration of sorbitol from 0 to 1.5 M in 5 min intervals. Upon each hyperosmotic shift to 1.5 M sorbitol, most of the MTs “froze” within 30 sec (Fig. 1 B and C, Sup. Movie 1). Upon each shift back to sorbitol-free medium, all interphase MTs promptly went into catastrophe, shrank toward the middle of the cell, and then regrew, such that the normal interphase array was restored in a few minutes (< 5 min) (Fig. 1 B and Sup. Fig. 2). The prompt catastrophes suggest that the GTP cap is hydrolyzed when MTs are in the “frozen” state. This cycle of MT “freezing”, and resumption of dynamics could be induced repeatedly (Fig. 1 B and Sup. Fig. 2), demonstrating that the effects of hyperosmotic shifts were rapid and reversible.
We analyzed the dose-dependent effects of osmotic shifts on the dynamic parameters of the interphase MTs. We detected a progressive increase in the time that MTs spent in a pause state (Fig. 1 D). Without sorbitol MTs spent 7 +/− 1 % of the time in pause, while at 1 and 1.5 M sorbitol they spent 24 +/− 11 % and 77 +/− 5 % of the time in pause respectively (Fig. 1 D). Of the MTs that continued to be dynamic, their rates of polymerization and depolymerization decreased in a sorbitol dose-dependent manner (Fig. 1 C, E, and F, and Sup. Fig. 3, Sup. Movie 2). Importantly, sorbitol’s effects on MT polymerization and depolymerization were equivalent in magnitude, a point to which we will return later. For instance, at 1.5 M sorbitol, polymerization and depolymerization rates decreased by −79 +/− 2 % and 80 +/− 1 %, respectively (Fig. 1 E and F). Because both polymerization and depolymerization rates were affected, we can rule out a mechanism based on changes in the concentration of tubulin, which should affect polymerization only. Treatment with high sorbitol concentration also made MTs resistant to depolymerization by cold temperature (Sup. Fig. 4), further indicating that these MTs were in a highly stabilized state.
We next asked whether hypoosmotic shifts, which dilute the cytoplasm by causing influx of water, yield opposite effects on MT dynamics. Our initial attempts to swell intact fission yeast cells with hypoosmotic shifts were not successful, perhaps because the cell wall limited the swelling. However, the cell wall can be removed enzymatically to create protoplasts, which swelled substantially in response to hypoosmotic shifts without lysing (Fig. 2 A) (Lemière and Berro, 2018). To establish a control condition for protoplasts, we determined that protoplasts produced in 0.4 M sorbitol in rich media had the same average volume as intact fission yeast cells. Shifting the protoplasts to hypoosmotic and hyperosmotic conditions (relative to the isotonic condition of 0.4 M sorbitol) led to predictable changes in cell volume over a ~2.5-fold range (Fig. 2 A). MTs were readily imaged across all volumes (Fig. 2B). In hypoosmotic shifts, MT polymerization and depolymerization rates both increased by an equivalent magnitude (Fig. 2C to 2F). For example, when cell volume swelled by 56 +/− 1 % over isotonic conditions, polymerization rates increased by 64 +/− 3 % and depolymerization rates increased by 42 +/− 1 % relative to control (Fig. 2 E and F). Conversely, hyperosmotic shifts in protoplasts decreased the rates of MT polymerization and depolymerization, also with equivalent magnitudes, similar to what was observed in intact fission yeast cells (Fig. 2 C to F). This result implies that the properties of the cytoplasm dampen the rates of MT polymerization and depolymerization.
Figure 2: MT growth and shrinkage rates scale with cell volume in yeast protoplasts.
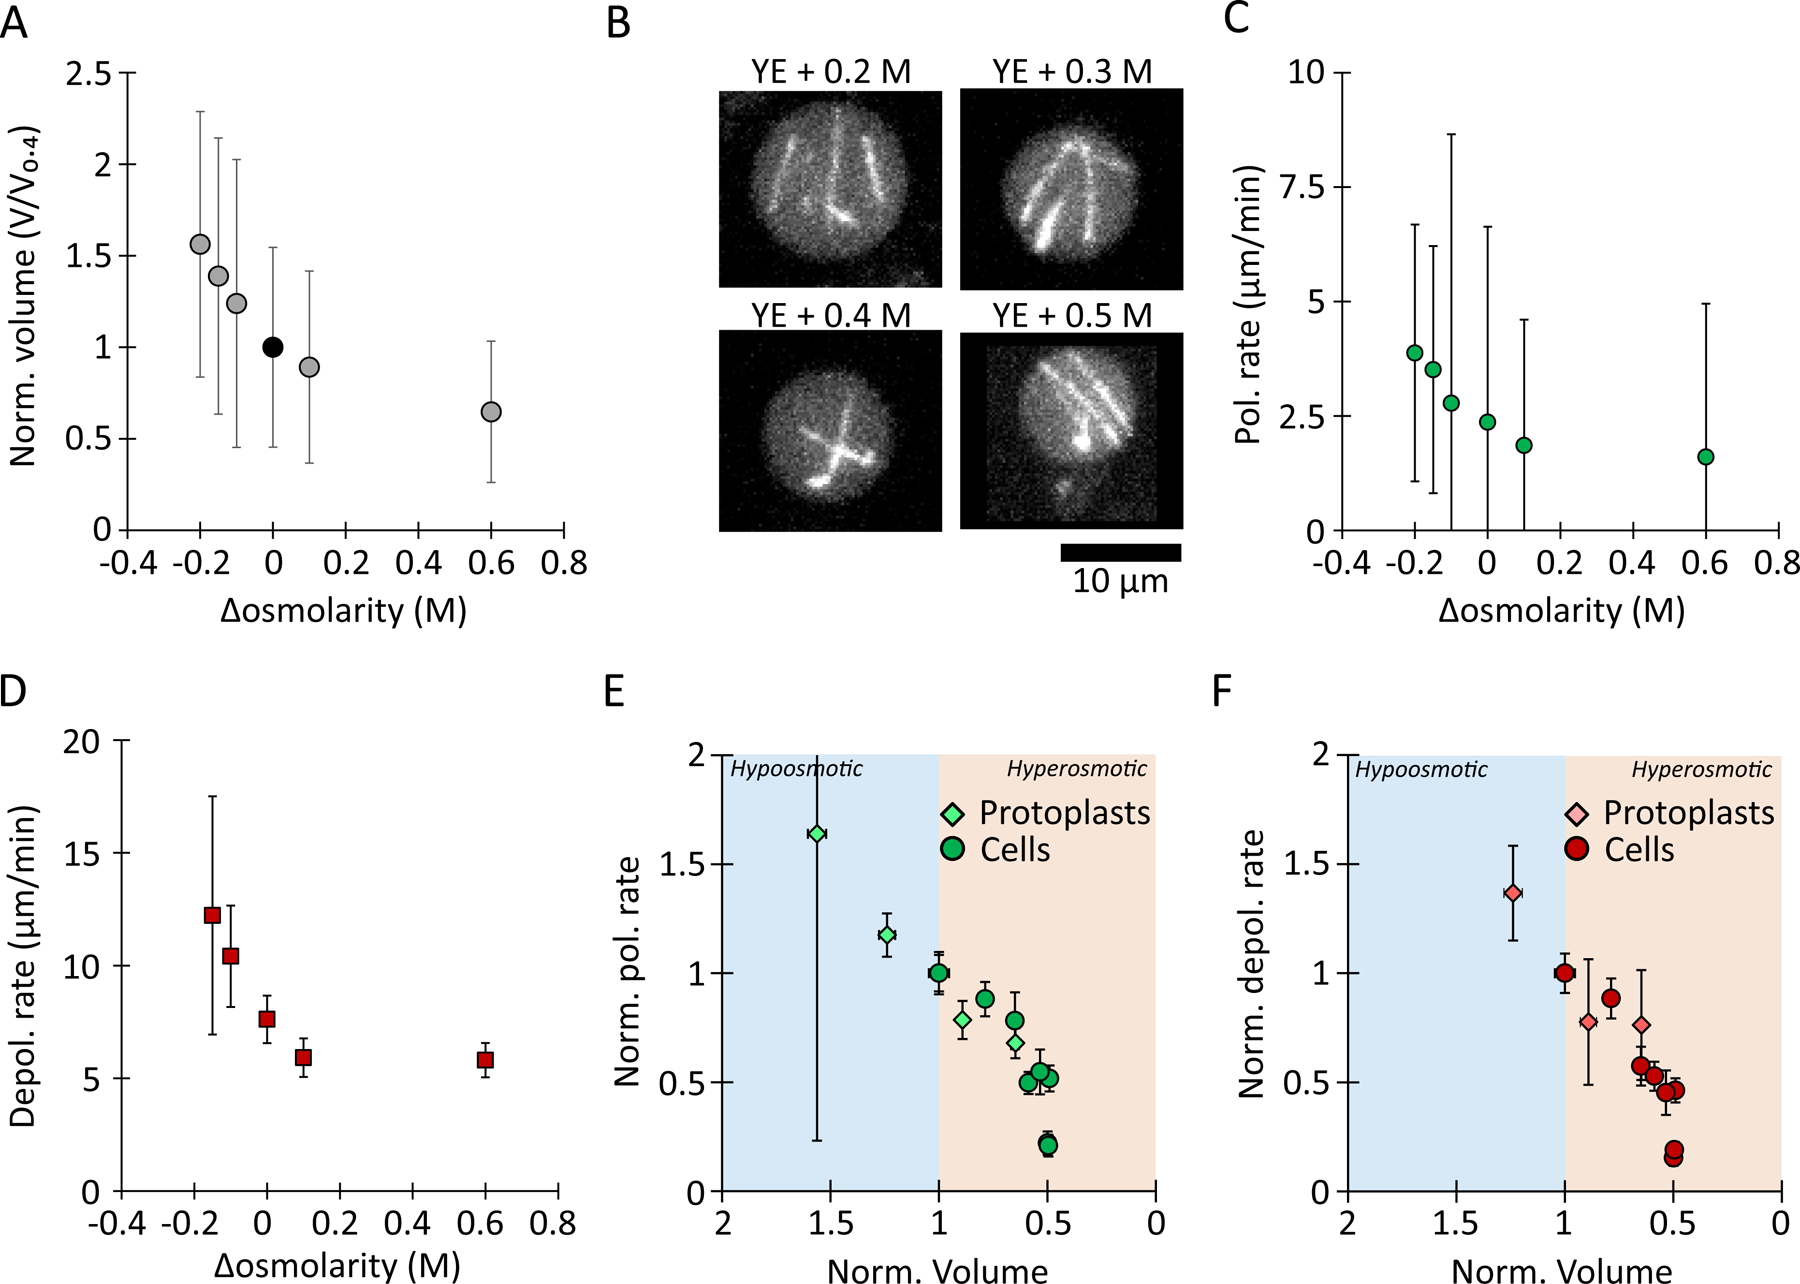
(A) Normalized protoplast volume. Data were normalized to osmolarity conditions of YE + 0.4 M sorbitol, in which the average volume distribution of protoplasts matched that of intact cells (AVG +/− standard deviation). Data come from at least two experiments; (left to right) n = 18 / 45 / 109 / 446 / 200 / 440 protoplasts.
(B) Representative images of GFP-labelled MTs in protoplasts in medium supplemented with the indicated sorbitol concentrations.
(C) MT polymerization (Pol.) and (D) depolymerization (Depol.) rates in yeasts protoplasts in medium supplemented with the indicated sorbitol concentrations. Values are AVG +/− standard deviation. Left to right, n = 10 / 13 / 64 / 29 / 28 / 25 polymerization events and n = 7 / 57 / 25 / 13 / 12 depolymerization events from three experiments.
(E) MT polymerization rate and (F) depolymerization rates, normalized to the isotonic condition for yeast cells (circles) and yeast protoplasts (diamonds), as a function of the normalized volume (see Methods). Both rates are increase in hypo-tonic conditions (blue shading) and decrease in hyper-tonic conditions (orange shading).
To evaluate whether intracellular concentration sets the rates of dynamic instability in other cell types, we performed similar osmotic shifts with the moss Physcomitrium (Physcomitrella) patens and mammalian Ptk2 cells. In both cases, we observed lower MT polymerization and depolymerization rates after hyperosmotic shifts, similar to what we observed in fission yeast (Fig. 3 and Sup. Fig. 5). In Ptk2 cells (Fig. 3, Sup. Movie 4) treated with DMEM + 0.25 M sorbitol, MT polymerization rate decreased from 4.9 +/− 1.5 μm/min to 2.4 +/− 0.8 μm/min (−48%) while depolymerization rate decreased from 12 +/− 3.4 μm/min to 6 +/− 2.5 μm/min (−50%) (mean +/− standard deviation). In moss cells (Sup. Fig. 5, sup. Movie 3) treated with BCD + 0.5 M sorbitol MT polymerization rate decreased from 5 +/− 1 μm/min to 4 +/− 0.7 μm/min (−20%) while depolymerization rate decreased from 30 +/− 19 μm/min to 22 +/− 15 μm/min (−28%) (mean +/− standard deviation). The similar effects of osmotic shifts on MT in fungal, plant and mammalian cells suggest that they arise from a conserved mechanism.
Figure 3: MT growth and shrinkage rates decrease upon hyperosmotic shock in mammalian cells.
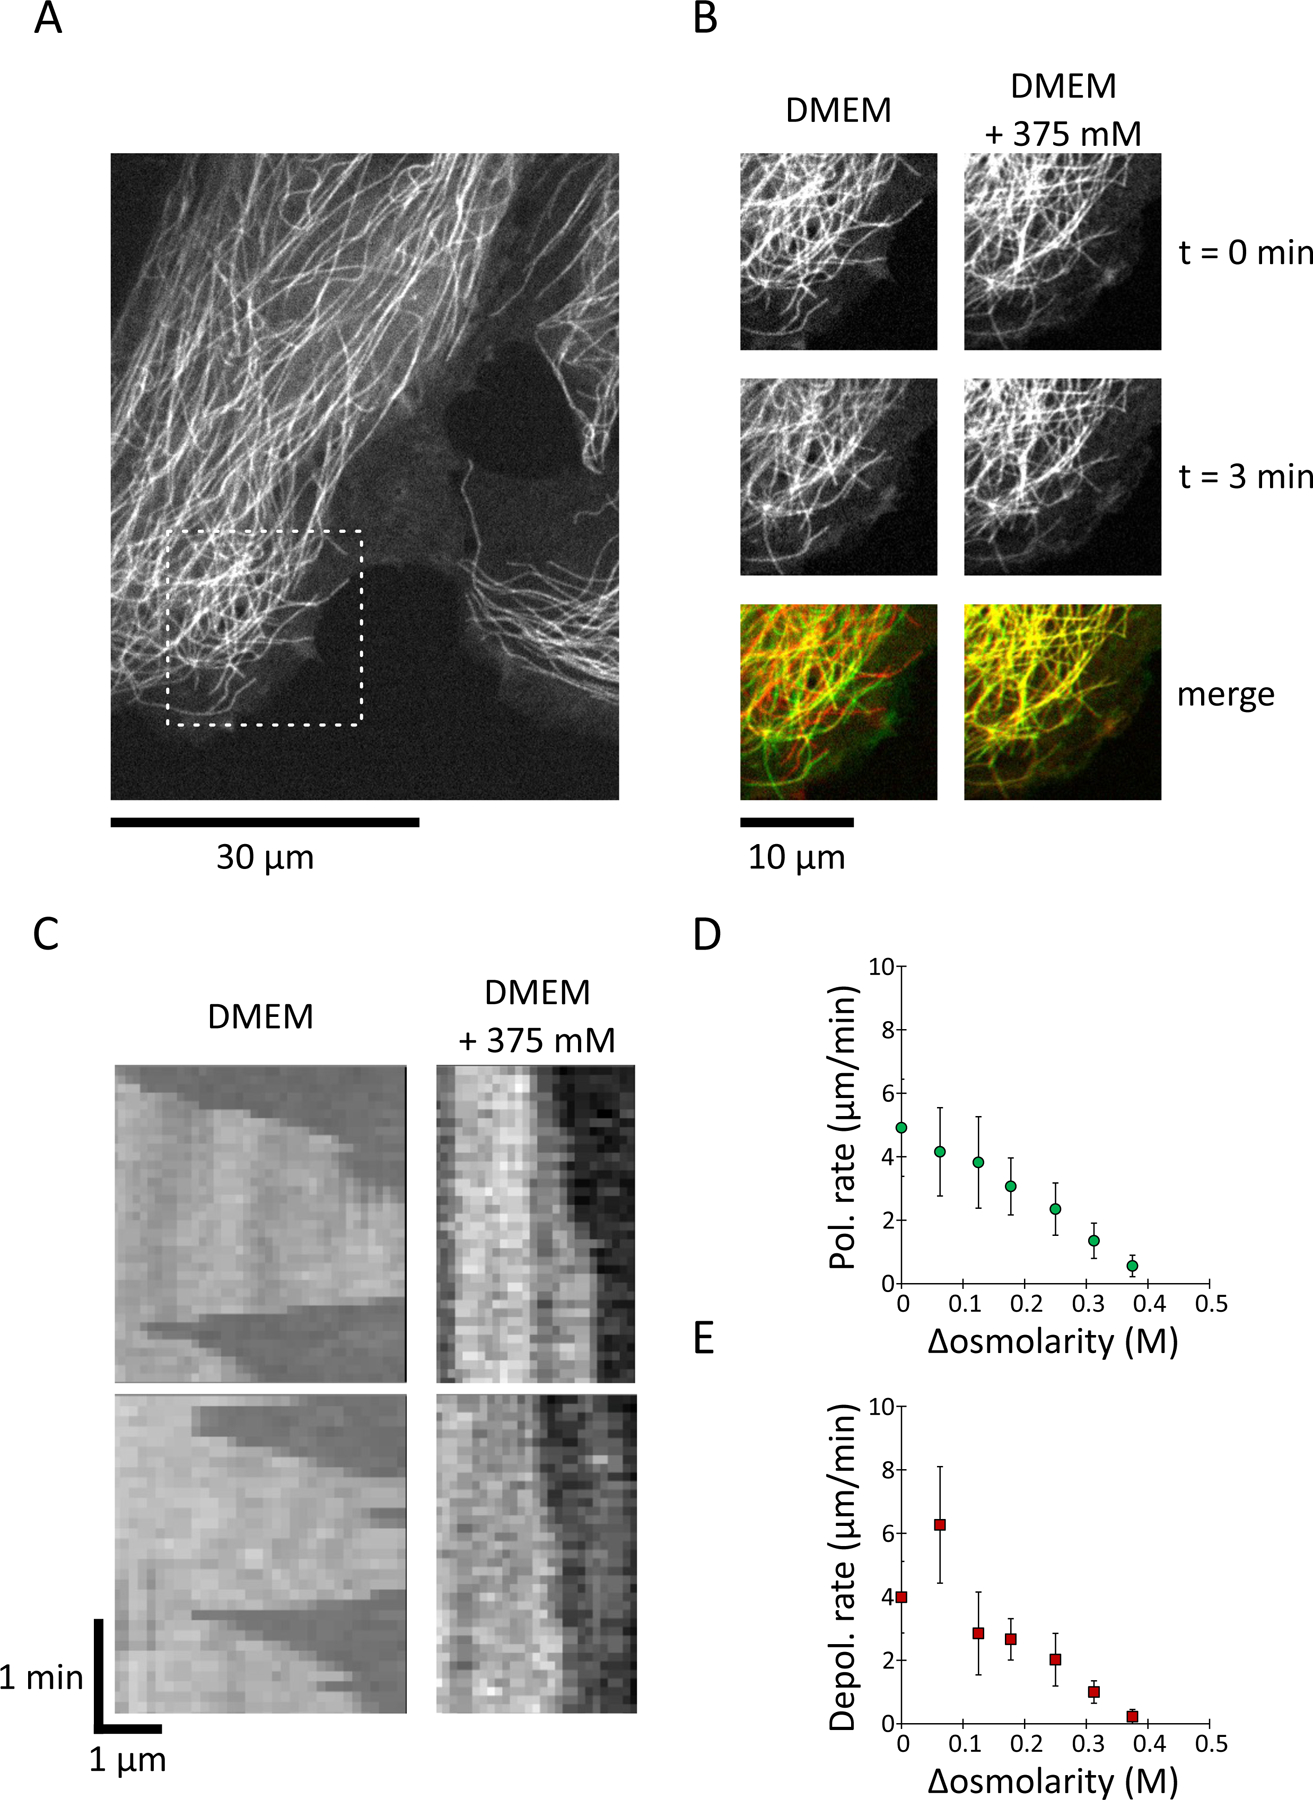
(A) Representative images of Ptk2 cells stably expressing GFP-labelled tubulin. Dashed-boxed ROI is zoomed-in in (B).
(B) Snapshots from the cell in (A) showing MT dynamics before and after an osmotic shock with DMEM/F12 media containing 375 mM of sorbitol.
(C) Kymographs of MTs in Ptk2 cells at the indicated sorbitol concentrations.
(D) MT polymerization rates (green circles) in Ptk2 cells treated acutely with the indicated sorbitol concentrations. Values are AVG +/− standard deviation. Data come from (left to right) n = 39 / 58 / 59 / 48 / 57 / 61 / 40 MT, from at least 3 cells, from at least 2 experiments.
(E) MT depolymerization rates (red squares) in Ptk2 cells treated acutely with the indicated sorbitol concentrations. Values are AVG +/− standard deviation. Data come from (left to right) n = 29 / 47 / 49 / 48 / 47 / 41 / 24 MT, from et least 3 cells, from at least 2 experiments. See supplemental movie 4.
Normalization of the MT polymerization and depolymerization rates to the isotonic conditions for both yeast cells and protoplasts revealed how changes in the concentration of the cytoplasm, above and below normal levels, caused similar, linear responses for MT polymerization and depolymerization (Fig. 2 E and F). This response suggests that the property of the cytoplasm that is changed by osmotic shocks affects both MT polymerization and depolymerization in a similar manner. Interestingly, MT dynamics decreased when cytoplasmic density and tubulin concentration increased (Fig. 1 and 2), opposite to what would be expected if crowding or tubulin concentration were responsible for the observed changes in MT dynamics as MT polymerization increases with either of these parameters (Wieczorek et al., 2013).
Effect of osmotic shifts on MT dynamics is independent of stress response and regulatory proteins at MT plus ends.
Hyperosmotic shocks could influence MTs directly, through their effect on cytoplasm physical properties (such as concentration), or indirectly, e.g., through osmotic stress response pathways. We next investigated several plausible mechanisms for these effects of the cytoplasm on MT dynamics. To distinguish between direct and indirect mechanisms, we considered two indirect mechanisms: (1) osmotic stress response pathways (such as regulation through phosphorylation), and (2) regulation by MT regulators at the MT plus end.
First, we tested whether MT stabilization is a downstream effect of an osmotic stress response pathway. Cells respond to osmotic stress by activating protein kinases that alter metabolism and gene expression. The MAP kinase Sty1 (Hog1, p38 ortholog) is a master integrator of multiple stress pathways (Perez and Cansado, 2011). However, in _sty1_Δ cells, sorbitol-mediated hyperosmotic shifts still caused a dampening of MT dynamics (Sup. Fig. 6), as previously observed (Robertson and Hagan, 2008) and in fact had slightly more severe effects than in WT cells. Other triggers of the Sty1 stress pathways, such as latrunculin A, do not produce MT “freezing” (Daga et al., 2006; Mutavchiev et al., 2016). Thus, “freezing” of the MT network is not a downstream response of Sty1-dependent stress pathways.
We next explored the role of MT regulatory proteins at MT plus ends (+TIPs), such as MT polymerases and depolymerases. +TIPs could be affected by osmotic shifts through Sty1-independent pathways that alter their activities, affinities, phosphorylation states, etc. In fission yeast, the major classes of +TIPs are represented by the EB-family protein Mal3, the XMAP215-family MT polymerase Alp14 (XMAP215) and the kinesin-8 complex Klp5/6 (Akhmanova and Steinmetz, 2010; Al-Bassam et al., 2012; Busch and Brunner, 2004; Unsworth et al., 2008). In mal3∆, alp14∆, tip1∆, and klp5∆ mutants, hyperosmotic shifts caused a dampening of MT dynamics similar to that observed in wild-type cells (Sup. Fig.7). Therefore, the dampening is not dependent on these individual +TIPs proteins. Additionally, because Mal3 is required for the recruitment of many other +TIP proteins, the mal3∆ mutant causes general disruption of the +TIP network(Akhmanova and Steinmetz, 2010) — and yet MT polymerization and depolymerization still “froze” during hyperosmotic shifts. We next asked how hyperosmotic shifts impacted the localization of +TIPs. We observed that Alp14-GFP was maintained at the MT plus ends during hyperosmotic shifts; in contrast, Mal3-GFP localization at MT plus ends decreased (Sup. Fig. 8). As Mal3 localization is dependent on the nucleotide binding state of tubulin (Guesdon et al., 2016), this loss of Mal3 may signify loss of the GTP cap during the period when MTs are “frozen” (Guesdon et al., 2016), consistent with the prompt catastrophes we observed following the reversal of hyperosmotic shifts (Fig. 1 B and Sup. Fig. 2).
Taken together, our observations in mutant cells argue that the acute effect of hyperosmotic shocks on MT dynamics observed here is not caused by indirect mechanisms such as the osmotic stress response or MT regulators. Rather, MT polymerization and depolymerization may be directly affected by the physical properties of the cytoplasm.
Cytoplasmic properties modulate the motion of nanoparticles.
To understand how cytoplasmic properties could affect a biochemical reaction like MT polymerization, we next set out to physically characterize the cytoplasm of fission yeast cells and examine how changes upon osmotic shifts affect MT dynamics. We reasoned that if the cytoplasm affects MTs through physical means, then it should also affect other intracellular components not related to MTs. First, we performed microrheology experiments to assess the effects of the cytoplasm on diffusive-like motion of nanoparticles that are the similar size scale as large macromolecules. As probes, we used genetically-encoded multimeric proteins (GEMs) which assemble into spherical nanoparticles of defined sizes (Delarue et al., 2018). We expressed GEMs tagged with the fluorescent protein Sapphire in fission yeast (Methods) and imaged them at 100 fps to analyze their motion (Fig. 4 A). We analyzed GEMs of 20 and 40 nm in diameter, which are similar in size as ribosomes and of similar scale to the diameter of the MT plus end (Delarue et al., 2018). Mean squared displacement (MSD) plots revealed that the movements of the GEMs were sub-diffusive (anomalous diffusion exponent α < 1) (Sup. Fig. 9), as observed in other cell types (Delarue et al., 2018), consistent with motion being restricted by a heterogeneous meshwork of organelles and macromolecules (Luby-Phelps et al., 1986). Their diffusive-like motion at short time scales allowed us to estimate the effective diffusion coefficient (Deff) (see Methods and Delarue et al., 2018). GEMs Deff was size-dependent: larger GEMs (40 nm, Deff = 0.33 +/− 0.14) diffused more slowly than the smaller GEMs (20 nm, Deff = 0.53 +/− 0.23) (Fig. 4 B, Sup. Movie 5), consistent with previous rheological observations in other cell types (Luby-Phelps et al., 1986; Moeendarbary et al., 2013). Thus, the cytoplasm of fission yeast appears broadly similar to cytoplasm from other eukaryotes. Interestingly, the effective diffusion coefficients of the 40-nm-GEM in fission yeast (~ 0.3 μm2/sec) is similar to what was reported in budding yeast (~ 0.3 μm2/sec) but slower than in mammalian cells (~ 0.5 μm2/sec) (Delarue et al., 2018) perhaps revealing intrinsic differences in the level of crowding or the structure of the cytoplasm among these cell types.
Figure 4: Nanoparticle’s diffusion rate scales with cytoplasm concentration.
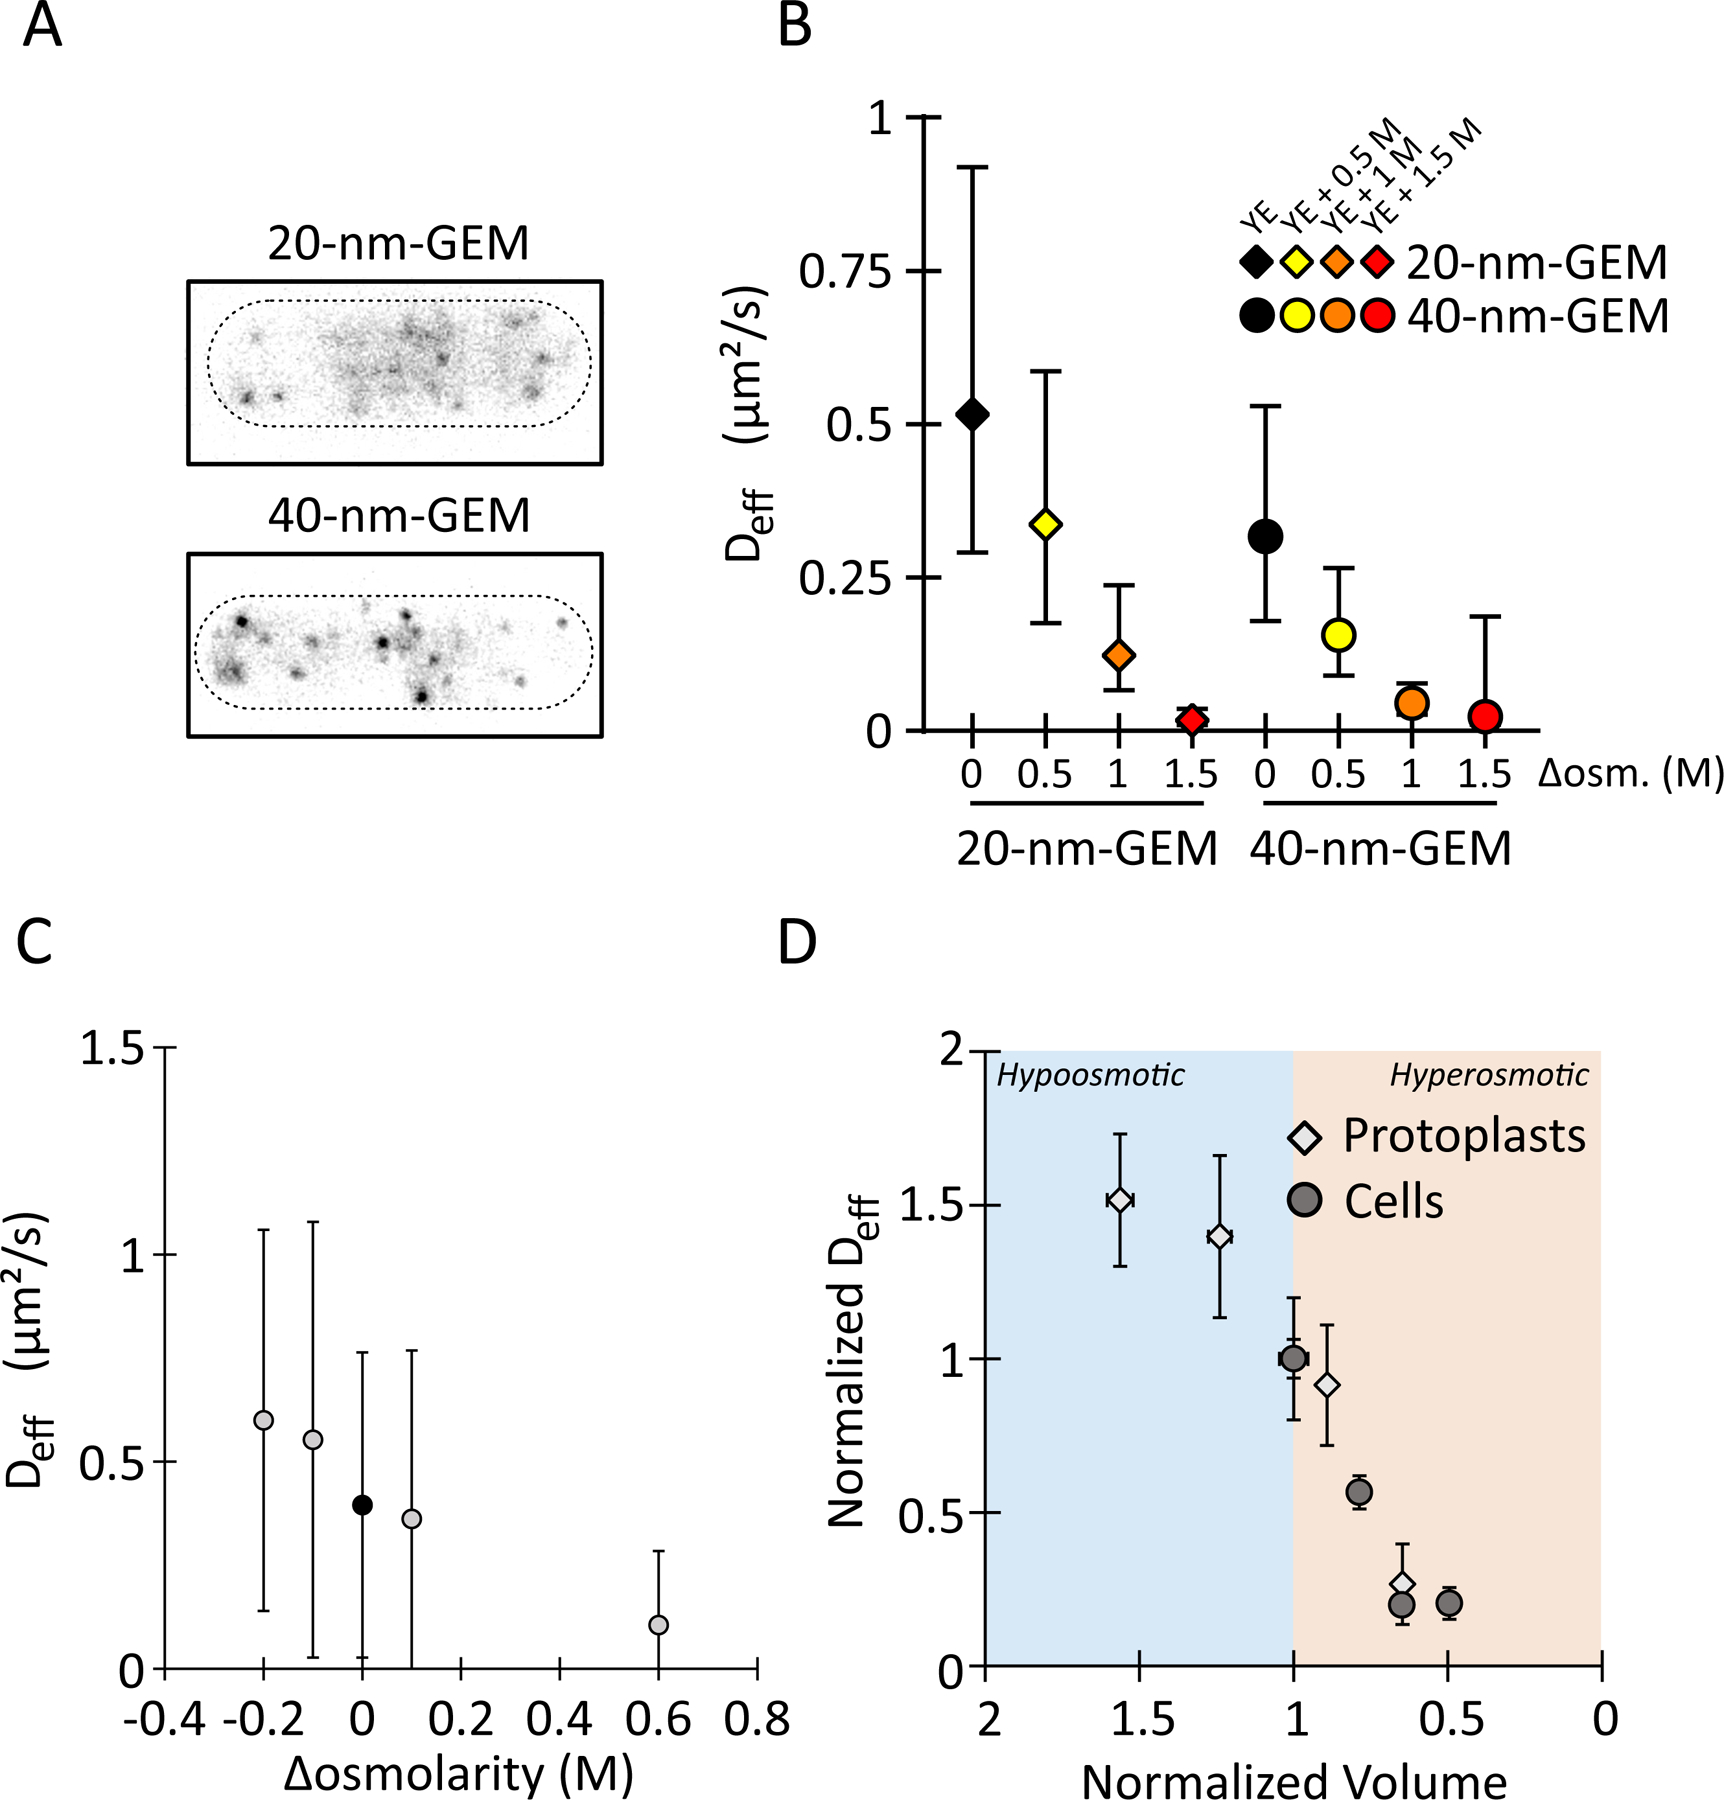
(A) Representative images of GEMs in fission yeast cells. Scale bar, 5 μm.
(B) Hyperosmotic shifts decrease the effective diffusion coefficients of GEMs of indicated sizes in yeast cells. Values are AVG +/− standard deviation. Data come from three experiments, n > 1000 trajectories, and n > 49 cells. Concentrations reflect sorbitol concentrations in the medium.
(C) Effective diffusion coefficients of 40-nm GEMs in yeast protoplasts as a function of sorbitol. AVG +/− standard deviation. Data come from at least two experiments and (left to right) n = 643 / 411 / 304 / 488 / 162 trajectories.
(H) Diffusion rate of the 40-nm GEMs in yeast cells (circles) and yeast protoplasts (diamonds) normalized to the iso-tonic condition as a function of the normalized volume (see Methods). The rate of diffusion through the cytoplasm is faster in hypo-tonic conditions (blue shading) and slower in hyper-tonic conditions (orange shading). See supplemental movie 5.
Having characterized GEMs diffusion in untreated cells, we then measured the impact of osmotic shifts on the diffusion of the two different sized particles. As expected, the impact was size-dependent. At 1 M sorbitol, 40-nm GEMs were effectively immobile, while 20-nm GEMs still diffused detectably (Fig. 4 B). At 1.5 M sorbitol, GEMs of both sizes were effectively immobile (Fig. 4 B).
To compare effects of hypoosmotic and hyperosmotic shifts, we next analyzed GEMs in protoplasts. To establish the baseline osmolarity, we confirmed that at 0.4 M sorbitol, Deff values for GEMs in protoplasts were similar to those in cells with intact cell walls (Fig. 4 C), indicating that this sorbitol concentration is the isotonic point, consistent with volume measurements. Hypoosmotic shifts increased Deff, while hyperosmotic shifts decreased Deff (Fig. 4 C). Despite the potential complexity of the cytoplasm, these GEMs data showed that the diffusion of GEMs scaled inversely with cytoplasm concentration (Fig. 4C). Comparison of GEMs Deff and MT rates data (Fig. 2E-F and Fig. 4C) showed the same general trend that they all scaled inversely with cytoplasmic concentration. These observations in yeast cells and protoplasts suggest that the physical properties of cytoplasm change with cytoplasm concentration in ways that alter the diffusion of spherical particles such as GEMs as well as MT dynamics.
Microtubule dynamics scale with tubulin diffusion in cells.
We next directly assessed the effects of osmotic shifts on the diffusion of soluble αβ-tubulin. We measured the diffusion of soluble tubulin by fluorescence loss in photobleaching (FLIP) experiments. In FLIP, the fluorescence intensity in a whole cell is measured while a small region of the cytoplasm is repeatedly photobleached. The rate at which whole-cell fluorescence decreases over time can be used to estimate the diffusion coefficient of a fluorescent protein (Fig. 5 A) (Ishikawa-Ankerhold et al., 2012). As a probe for soluble α/β-tubulin dimers, we used Atb2-GFP (α-tubulin 2) expressed from the native chromosomal locus (Sato et al., 2009). To prevent MT polymers from confounding the measurement, cells were treated with the MT inhibitor methyl benzimidazol-2-yl-carbamate (MBC) to depolymerize MTs (Fig. 5 B). To estimate the tubulin diffusion coefficient from the continuous loss of fluorescence, we designed a 1D stochastic model of tubulin diffusion that assumes a single diffusing species (Methods). Comparison of the model predictions with our experimental data (Fig. 5 B) yielded an estimated diffusion coefficient of GFP-tubulin of D = 7 μm2 s−1 in control cells, which is very close to the value of ~6 μm2 s−1 obtained in pioneering experiments in sea urchin (Salmon et al., 1984) and in PTK2 cells (Wang et al., 2004). In cells treated with hyperosmotic shifts, the estimated diffusion coefficient of soluble tubulin decreased to D = 4 μm2 s−1 at 1 M sorbitol and D = 1.5 μm2 s−1 at 1.5 M sorbitol (Fig. 5 C). A linear relationship emerged, where both the MT polymerization and depolymerization rates correlate linearly with the tubulin diffusion coefficient (Fig. 5 D). Taken together, these data suggest that tubulin diffusion is modulated by the physical properties of cytoplasm and is likely to contribute to the observed changes in MT polymerization and depolymerization rates upon osmotic shifts.
Figure 5: Hyperosmotic shifts decrease the diffusion rate of soluble tubulin.
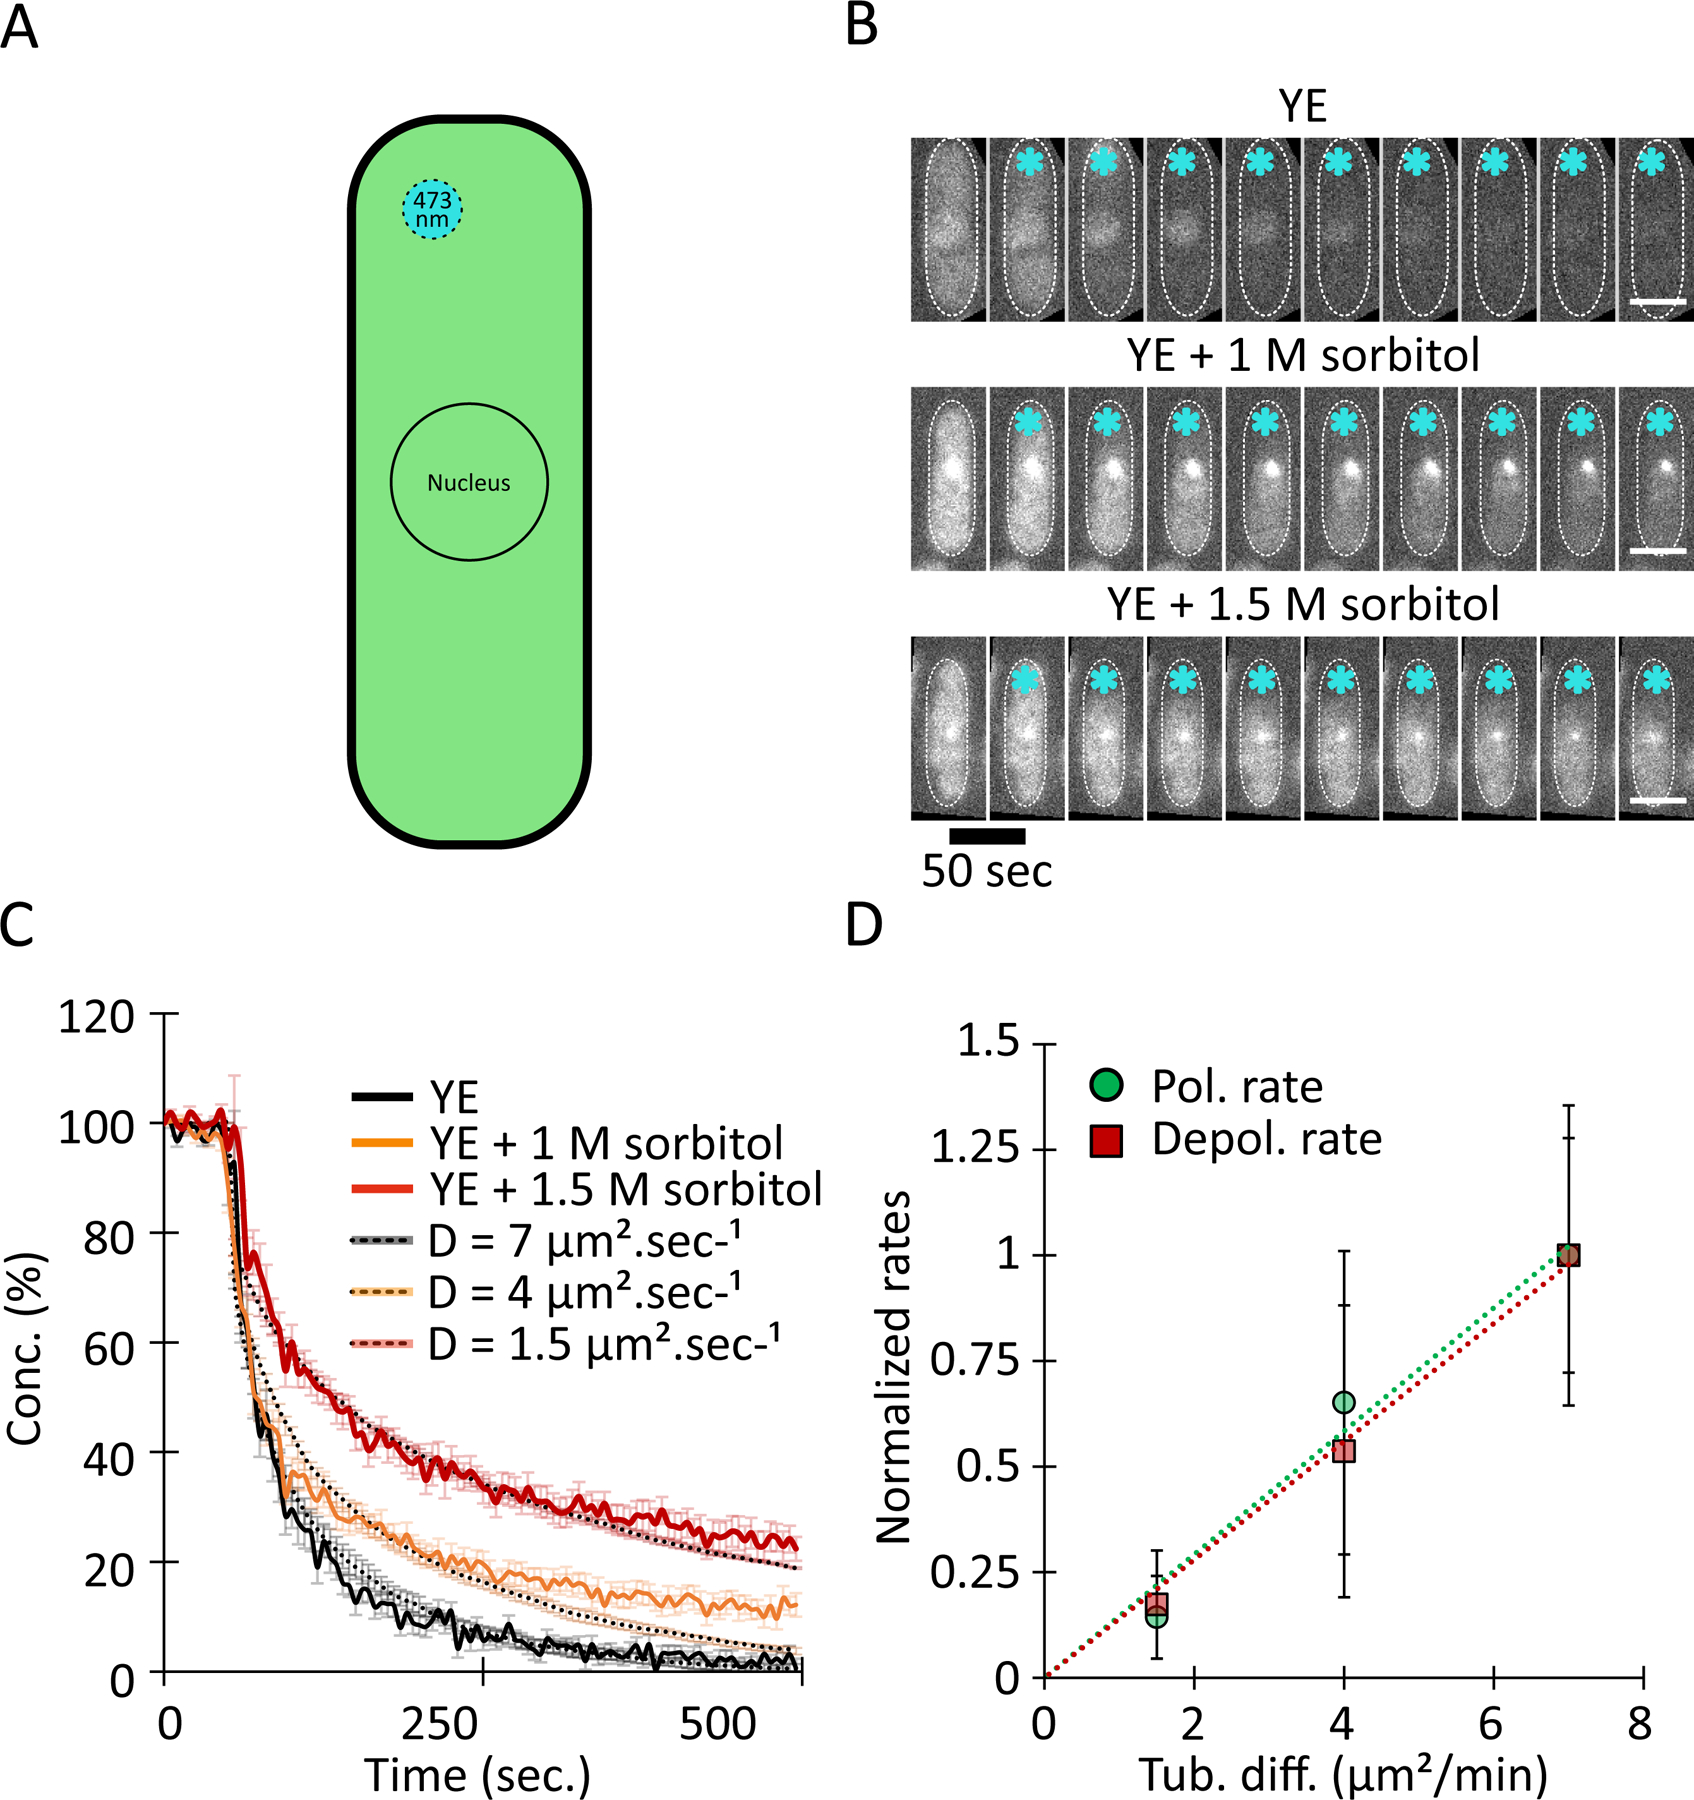
(A) To measure the diffusion of soluble GFP-tubulin, we used FLIP. Cells were exposed repeatedly to a focused laser beam (~1 μm) near one cell tip and GFP fluorescence intensity was measured (see Methods).
(B) Fluorescence decay of cells expressing GFP-tubulin in a representative FLIP experiment after hyperosmotic shock at the indicated sorbitol conditions. Interphase cells in which MTs were depolymerized with 25 μg/ml methyl benzimidazol-2-yl-carbamate (MBC) were photobleached using a focused laser (blue stars). Scale bars, 4 µm.
(C) Loss of fluorescence intensity in cells from three osmotic conditions and the corresponding tubulin diffusion rate. Values (AVG +/− standard deviation) were normalized to initial intensity and expressed as concentrations (%). Data are n = 46 / 29 / 29 cells, for YE alone, YE + 1 M sorbitol, and YE + 1.5 M sorbitol, respectively, from three independent experiments. Dashed lines denote predictions from simulations of a 1D model (see Methods) for various values of diffusion; these predictions were used to estimated diffusion rates from our experimental data. Simulation values are AVG +/− standard deviation for 5 simulations.
(D) Rates of MT polymerization and depolymerization in yeast cells as a function of tubulin diffusion rate. Data come from Figures 1 and 4. Correlations between diffusion and polymerization rate (P = 0.008) and depolymerization rate (P = 0.001) are significant according to Pearson’s correlation test.
Cytoplasm viscosity increases in hyperosmotic shifts.
In the ideal models of diffusion, namely the purely Brownian motion of a spherical particle in solution, the diffusion coefficient scales (1) linearly with the temperature, (2) inversely with the radius of the particle, and (3) the dynamic viscosity of the solution (Einstein, 1905). Because intracellular diffusion is complex and potentially driven by active processes, we sought to test whether viscosity of the cytoplasm changes with its concentration. We estimated fluid-phase viscosity of the fission yeast cytoplasm using time-resolved Fluorescence Anisotropy Imaging (tr-FAIM) (Siegel et al., 2003). This method measures the Brownian rotational movement of a fluorescent dye (fluorescein) in the cytoplasm of living cells, assessing viscosity at the Ångström size scale of the dye (see Methods; Fig. 6). Higher viscosity leads to lower rotation rate of the dye and a slower depolarization (Fig. 6 B). Fitting and extraction of the rate constants (Fig. 6 C) and comparison to the calibration curve (Fig. 6 D) yielded an effective viscosity value at 22°C of 5 +/− 1.2 cP (Fig. 6 E) which is in line with the broad range of previous viscosity measurements for eukaryotic cytoplasm (range from 1 to 50 cP) (Obodovskiy, 2019). This value suggests that at 22°C the fission yeast cytoplasm has an effective viscosity similar to that of 43% (v/v) glycerol in water. For cells treated with 1.5 M sorbitol, the effective viscosity of the cytoplasm was 9.8 +/− 2 cP (Fig. 6 E), corresponding to 54 % (v/v) glycerol in water at 22°C. Thus, the effective viscosity of the cytoplasm increases with its concentration upon a hyperosmotic shift, qualitatively consistent with the effects on translational diffusion rates of GEMs and tubulin dimers.
Figure 6: Hyperosmotic shocks increases the viscosity of the cytoplasm in yeast.
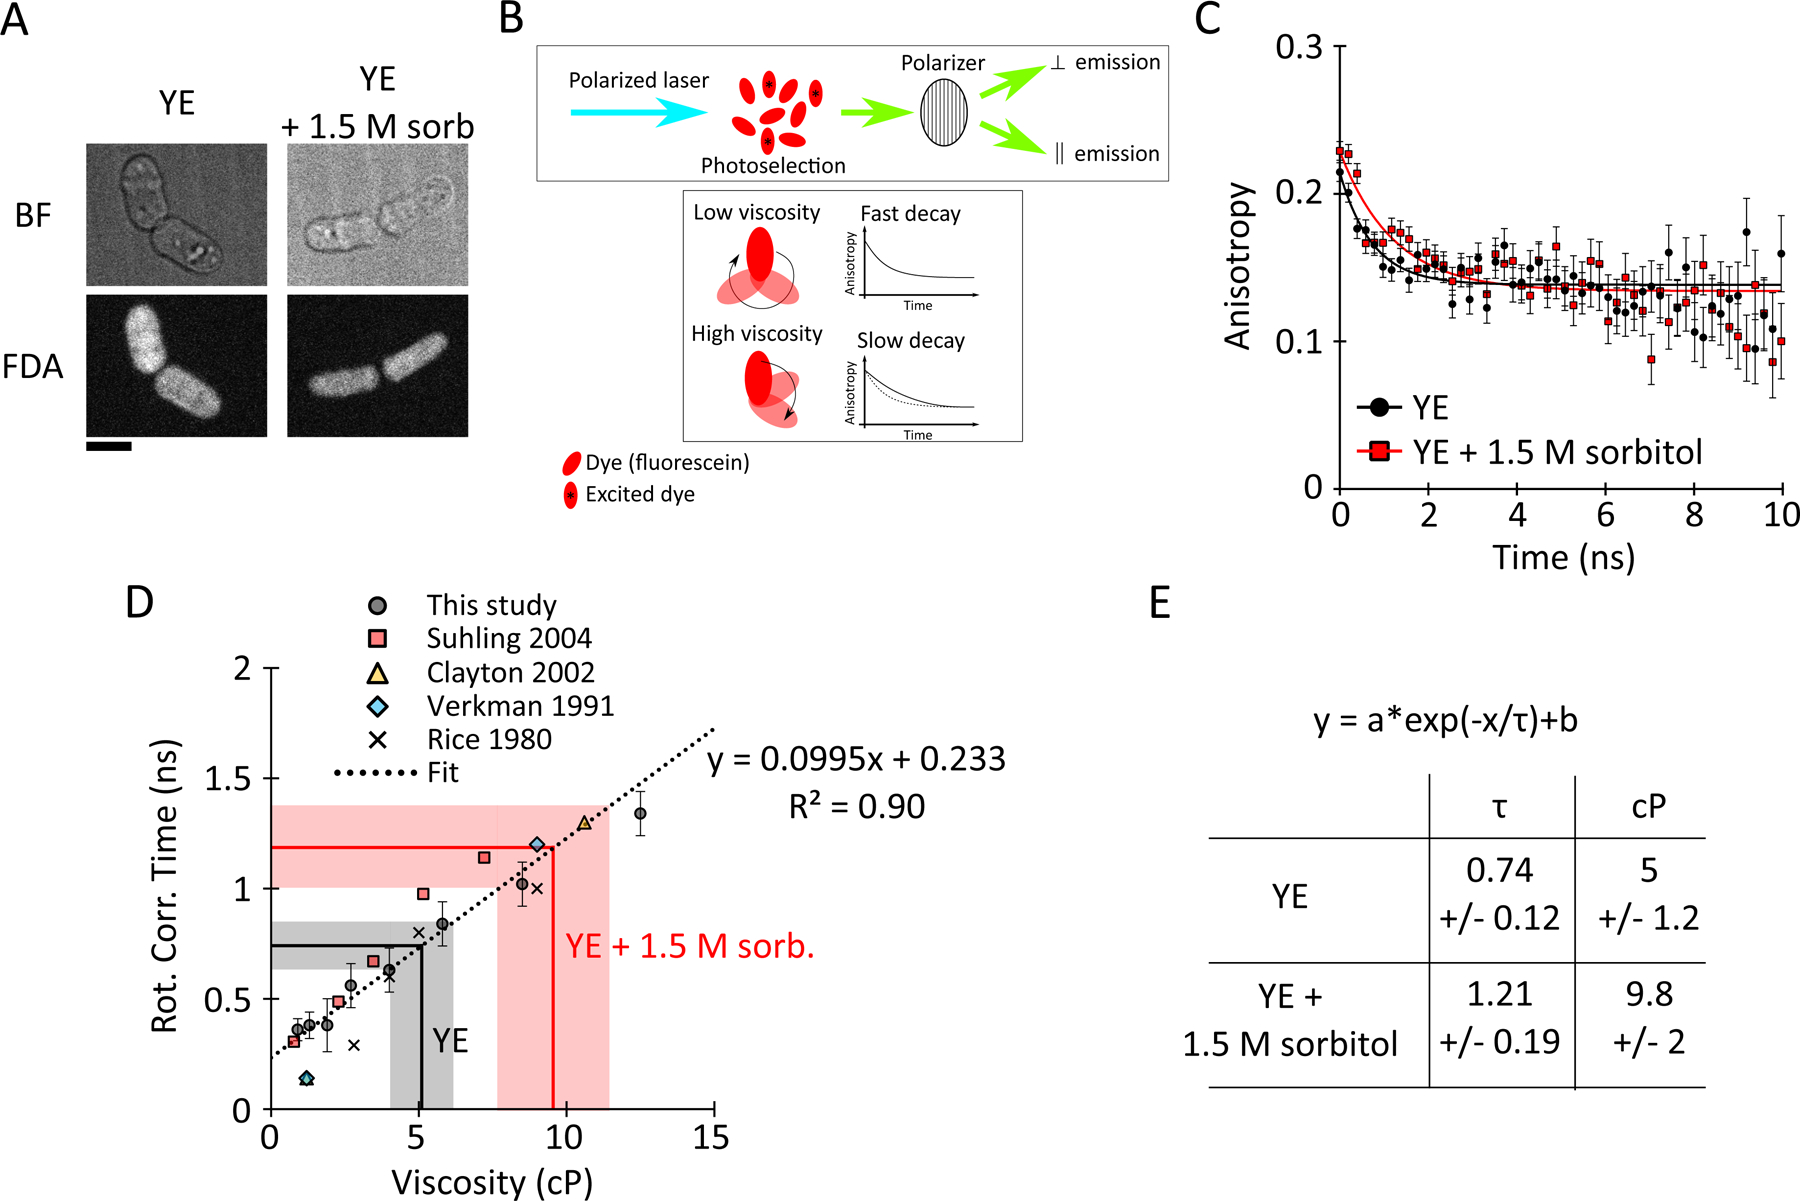
(A) Image of cells labelled with 100 μM fluorescein diacetate (FDA) in YE and YE + 1.5 M sorbitol. Bar = 5 μm.
(B) Schematic illustrating the principle of the time-resolved fluorescence anisotropy imaging (TR-FAIM) experiment.
(C) Anisotropy decay of fluorescence in wildtype fission yeast cells in YE media (black circles) and YE + 1.5 M sorbitol (red squares) (AVG +/− standard deviation). The black and red plain lines represent the best fits. Differences are significant according to a F-test, p-value = 0.0003.
(D) Calibration plot of fluorescein rotational correlation time in solution of different viscosity. Data from this study (black circles) and others were used. The linear regression represents the best fit. The equation was used to convert the rotational correlation time from the fits in (B) to viscosity estimates.
(E) Summary of the viscosity values obtained in yeast cell in YE and YE + 1.5 M sorbitol.
Viscosity is sufficient to explain the effects of cytoplasmic concentration.
In order to isolate the effects of viscosity on MT dynamics, we reconstituted MT dynamics in vitro in the presence of glycerol using a well-established assay (Gell et al., 2011) (Fig. 7 A). Glycerol is a small molecule that increases viscosity in the solution without significant crowding effects. Although glycerol has been long known to stabilize MTs in bulk (Keats, 1980), its inhibitory effects on the growth rate of individual MTs in vitro was only recently shown (Wieczorek et al., 2013). The effect of glycerol on MT depolymerization however has not been analyzed. We took advantage of Interference Reflection Microscopy (IRM) (Mahamdeh and Howard, 2019) to image MTs at 0.5 fps for extended periods, allowing a more accurate quantification of depolymerization rates as compared to imaging fluorescently-labeled MTs. A range of glycerol concentrations was added to the reconstitutions to produce viscosities from 0.9 to 1.9 cP. MT polymerization rates decreased linearly in a dose-dependent manner with increasing viscosity, similar to what was previously shown (Wieczorek et al., 2013) (Fig. 7C). Strikingly, MT depolymerization rates also decreased with glycerol addition (Fig. 7D, Sup. Movie 6). As high glycerol concentrations (>20%) suppressed catastrophe under these conditions, we further probed the effect of glycerol on MT depolymerization using a buffer exchange system to induce catastrophe by removing free tubulin (see Methods). These recapitulated the inhibitory effects of glycerol on MT depolymerization rates, and showed that at high 30–40% glycerol concentrations, MTs depolymerization was largely abolished (Sup. Fig. 10, Sup. Movie 7), reminiscent of the frozen MTs observed in cells. Thus, the influence of cytoplasmic properties on MT polymerization and depolymerization rates observed in vivo was reproduced in vitro by modulating a single parameter, viscosity.
Figure 7: Increasing viscosity dampens rates of MT polymerization and depolymerization similarly.
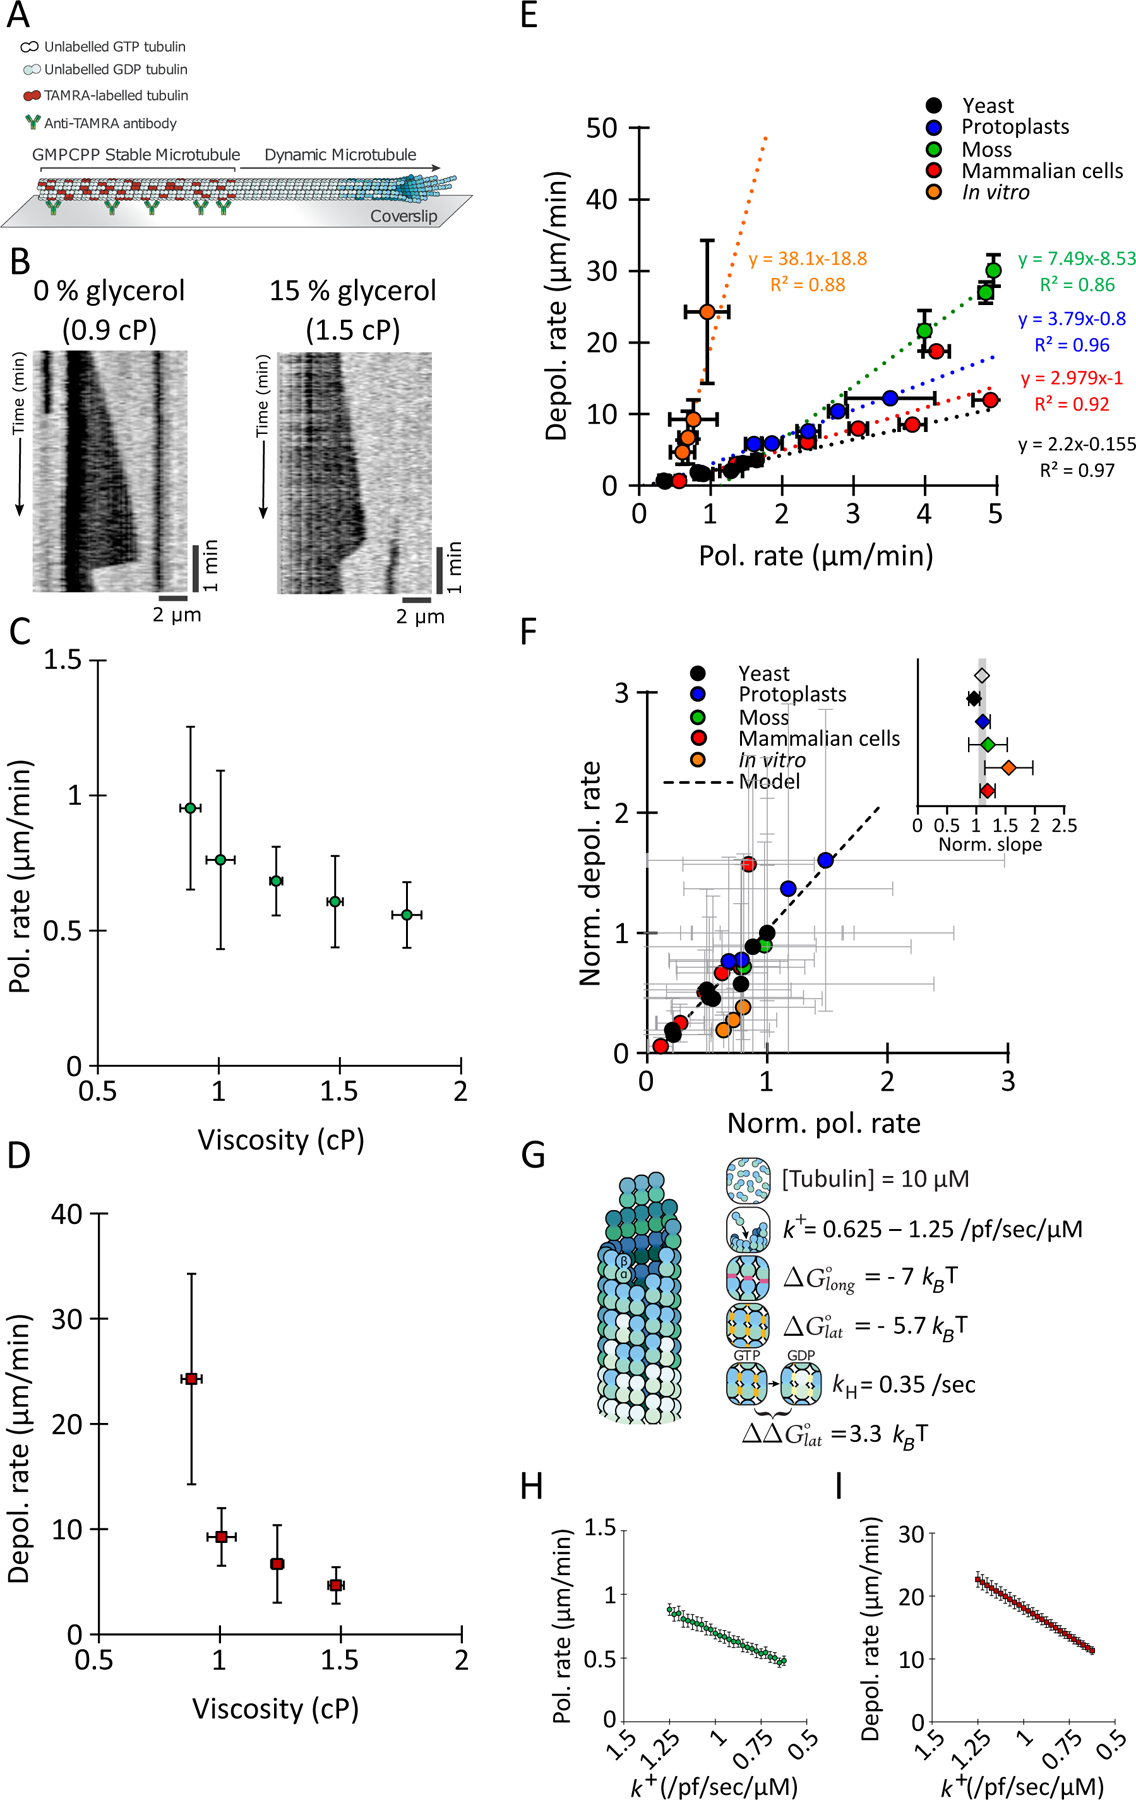
(A) Schematic of the in vitro reconstituted system for MT dynamics measurement.
(B) Representative kymographs of MT grown in BRB80 and BRB80 + 15 % glycerol to increase the viscosity. Polymerization and depolymerization rates are slower at higher viscosity.
(C) MT polymerization rates (green circles) and (D) MT depolymerization rates (red squares) were measured in MTs in solutions of varying viscosity. Data represent 3 repetitions with n ≥ 70 MTs per condition.
(E) Scatter plot of the observed depolymerization rates versus the observed polymerization rates for the experiments in this study (yeast cells (black circles), yeast protoplasts (blue circles), moss (green circles), ptk2 cells (red circles), in vitro (orange circles)). Each model presents a certain ratio (the slope of the regression) of depolymerization rate to polymerization rate, but this ratio (the slope) is conserved when viscosity is increased in vitro and when cytoplasm concentration is manipulated by osmotic shocks (yeast, protoplasts, moss and Ptk2 cells) in vivo. AVG +/− SEM (for some data points the error bars are smaller than the point).
(F) Cytoplasm and viscosity have similar effects of MT polymerization and depolarization rates. Graph shows the relationship between normalized depolymerization rates and normalized polymerization rates for all the experimental conditions and for the model (described in C). AVG +/− propagated error. All the systems (yeast, protoplast, moss, Ptk2, and in vitro) have the same slope than the model (see Methods). The inlet shows the slope obtained from each dataset (AVG +/− STD) and the slope from the model as a greyed area.
(G) Schematic of the parameters used to model MT dynamic instability. Changing the association rate constant k+ was used to model the effect of viscosity. For more details see Methods.
(H) Polymerization rate (apparent on-rate) and (I) depolymerization rate (apparent off-rate) as a function of the association rate constant in the model. Note that the x-axis are inverted.
See supplemental movies 6 and 7.
To compare these in vitro results with the in vivo findings quantitatively, we plotted depolymerization rate as a function of polymerization rate for all the conditions we studied (Fig. 7 E). Our in vivo and in vitro experiments paint a consistent picture: rates of MT polymerization and depolymerization are linearly correlated, indicating a conserved ratio of polymerization to depolymerization (Fig. 7 E). The ratio is different in each experimental case, presumably due to the specific conditions of each case (active cytoplasm vs in vitro reconstruction, presence of MAPs, tubulin isoform properties, tubulin concentration, temperature, etc.). Nonetheless, the ratio is maintained when MT dynamics are perturbed, either by changes in cytoplasm concentration in vivo or changes in viscosity in vitro. By normalizing the rates from each model to the value in the unperturbed condition, all of the data from in vivo and in vitro experiments strikingly collapsed onto the same slope (Fig. 7 F). This relationship shows that viscosity and the concentration of the cytoplasm affect a fundamental, conserved property of MT polymerization and depolymerization in a similar manner.
Using a 6 parameters model for MT dynamic instability (Fig. 7 G) (Hsu et al., 2020) that reproduces the core behaviors of polymerization, catastrophe, and depolymerization (Odde, 1997), we could reproduce these data by modulating the tubulin association rate constant k + as a proxy for the effect of viscosity. Indeed, k + describes the rate at which intermediate complexes form, and viscosity, by limiting molecular motion, should reduce it. All other parameters, notably the ΔG’s of tubulin-tubulin bonds, remained constant. The model predicts that polymerization rates decrease in a linear manner with decreasing k+, as expected from fewer binding events (Fig. 7 H). Notably, the model also predicts that depolymerization rates also scale linearly with k + (Fig. 7 I), because when association rate constants change, dissociation rate constants must also change if the bond energies (ΔGlong and ΔGlat) are to remain constant (Drenckhahn and Pollard, 1986). In other words, the model predicts that both rates scale linearly with the association rate constant, explaining the collapse of the normalized data on a single slope (Fig. 7 F). Thus, this initial model shows how an increase in viscosity that causes slower molecular motion can decrease both polymerization and depolymerization rates proportionally without affecting the bond energies. Thus, MT dynamic instability in the cytoplasm is modulated by a single master variable, which is viscosity.
Hyperosmotic shift dampens mitotic spindle elongation and DNA segregation.
As a demonstration that this regulation by cytoplasmic properties affects a MT-dependent process in vivo, we determined how osmotic shifts affect the functioning of the mitotic spindle during anaphase. The fission yeast anaphase spindle is inside he nucleus and is composed of a single MT bundle that elongates by MT polymerization and sliding to move the chromosomes apart (Krüger et al., 2019). We imaged mitotic cells expressing GFP- tubulin and mCherry-histone during oscillatory hyperosmotic shocks of 1 M or 1.5 M sorbitol (similar to Figure 1B). These conditions have been shown to reduce GEMs diffusion in the nucleoplasm to a similar extent as they do in the cytoplasm (Lemière et al., 2021). During each 5 min period of sorbitol treatment, the rates of spindle elongation abruptly decreased; elongation rate decreased by around half in the 1 M sorbitol shift and completely stopped at 1.5 M sorbitol (Sup. Fig. 11, Sup. Movie 8). Remarkably, upon each shift back to normal media, the spindle promptly resumed elongating at similar rates before the shift, without apparent MT loss or change in spindle organization; despite intermittent pauses, the vast majority of these cells completed anaphase successfully. For the 1.5 M shifts, the duration of mitosis increased roughly by the time the spindle was frozen. These effects on anaphase B rates may reflect the effects of varying cytoplasmic viscosity on MT dynamics, motor function and possible drag forces in moving the micron-scale nuclei through the cytoplasm. Our findings illustrate how cytoplasmic properties dictate the rate of biological processes.
Discussion
Here we used MT dynamics as a model reaction for studying how the physical properties of cytoplasm influence biochemical reactions. During hyperosmotic shifts that increase cytoplasmic concentration, MTs polymerized and depolymerized more slowly and paused more frequently (Fig. 1). Conversely, in hypoosmotic conditions, which decreases cytoplasmic concentration, MT polymerization and depolymerization rates sped up as much as 50% (Fig. 2). We provide numerous lines of evidence to indicate that these effects act directly via the physical properties of the cytoplasm, as opposed to indirect mechanism via osmotic stress pathways or MT regulatory proteins (Sup. Fig. 6 and 7). The effects were rapid (Fig. 1), reversible (Sup. Fig. 2) and scaled linearly with the concentration of cytoplasm in hypo- and hyperosmotic shocks (Fig. 2), strongly indicative of a physical response. The effects on MTs scaled with effects on the diffusive motion of GEMs and tubulin dimers (Fig. 4 and 5). A significant implication is that cytoplasm properties, such as its viscosity, set the rates of MT polymerization and depolymerization at physiological conditions. Additionally, using osmotic shocks on Ptk2 cells (Fig. 3) and on moss cells (Sup. Fig. 5) we obtain similar results suggesting that the effect of the cytoplasm concentration on MT dynamics is conserved across eukaryotes. Furthermore, we can reproduce the effect of cytoplasm concentration on MTs grown in vitro by increasing the viscosity of the buffer (Fig. 7). Our findings further indicate that the predominant impact of cytoplasmic concentration on MTs is through its viscosity, rather than effects of macromolecular crowding or changes in tubulin concentration. Indeed, these findings provide one of the first demonstrations how the viscosity of the cytoplasm impacts an endogenous intracellular reaction.
Viscosity is likely to impact a multitude of biochemical reactions and multi-scale conformational dynamics that drive the polymerization and depolymerization of MTs (Brouhard and Rice, 2018). For MT polymerization, viscosity may inhibit diffusive arrival and positioning of a curved, GTP-tubulin dimer to the end of a protofilament (Fig. 5). Viscosity may affect the subsequent steps in which tubulin dimers straighten and form bonds between the full complement of neighboring dimers, as well as changes in proto-filament conformation during assembly of the MT lattice. For MT depolymerization, viscosity may affect the large conformational changes in protofilaments as they peel away from the MT end to form curved structures. These structural transitions, which involve significant changes in tertiary and quaternary structure (Brouhard and Rice, 2018), are influenced by solvent interactions and hence potentially by changes in viscosity. These transitions may be affected differently by different agents depending on their size scale (Sozański et al., 2015; Wieczorek et al., 2013). Additional studies will be needed to determine what are specific rate-limiting reactions of MT dynamics and organization responsible for these effects of viscosity.
In summary, we use MT dynamics as an example to study how the physical properties of cytoplasm affect biochemical reactions in vivo and discovered that viscosity plays a key role. This works highlights the impact of cytoplasmic viscosity on the rates of intracellular reactions and may generalize to diverse processes including kinesin function (Sozański et al., 2015), actin polymerization (Drenckhahn and Pollard, 1986), the assembly of multi-subunit complexes such as protein aggregation or amyloid formation (Munishkina et al., 2004), and the folding of proteins and RNA (Dupuis et al., 2018; Hagen, 2010; Pradeep and Udgaonkar, 2006) as well as signaling (Miermont et al., 2013). The density and other properties of the cytoplasm are known to vary during the cell cycle, in development, aging and diseases (Neurohr and Amon, 2020). Recent findings in budding yeast suggest that cytoplasmic viscosity itself may be actively regulated through regulation of metabolites such as trehalose and glycogen, for instance in response to environmental conditions such as temperature changes (Persson et al., 2020). The dynamic of the cytoskeleton may also contribute to regulation of the cytoplasm properties (Charras et al., 2009; Fakhri et al., 2014; Guo et al., 2018), setting up a potential feedback loop. Therefore, it will be important to consider how physiological changes in cytoplasmic properties globally cross-talk with cytoskeletal elements, metabolism and the many other cellular reactions in the living cell.
STAR METHODS
RESOURCE AVAILABILITY
Lead contact
Further information and requests for resources and reagents should be directed to and will be fulfilled by the lead contact, Fred Chang (fred.chang@ucsf.edu).
Materials availability
Yeast strains generated in this study are available upon request.
Data and code availability
Data generated in this study are available upon request.
EXPERIMENTAL MODEL AND SUBJECT DETAILS
Fission yeast.
Standard methods for growing and genetically manipulating Schizosaccharomyces pombe were used (Moreno et al., 1991). For most experiments, cells were grown overnight in Yeast Extract (YE5S) medium (here called YE) with shaking at 30 °C to exponential phase (OD600 between 0.2 – 0.8). See Sup. Table. for reagents and strains details.
Physcomitrium (Physcomitrella) patens.
Moss cells were grown as described previously (Yamada et al., 2016). Caulonemal cells were mounted in microfluidic devices at room temperature as described previously (Kozgunova and Goshima, 2019).
Mammalian cells.
PTK2 cells stably expressing GFP-tubulin were grown in DMEM/F12 medium supplemented with 10% fetal bovine serum (FBS) and 1% antibiotic-antimycotic (Thermofisher #15240062) (10% DMEM/F12) with 5% CO2. The day before experiments, cells were plated in 35 mm glass bottom dish (Ibidi #81218), incubated in 2 ml of medium and left overnight at 37 °C and 5% CO2 to allow them to spread properly.
METHOD DETAILS
Yeast strain construction
Cassettes for expressing GEMs (20 nm, AqLs-Sapphire; 40 nm, PfV-Sapphire), were cloned into the fission yeast pREP41X expression vector from pRS306 budding yeast expression vectors (Delarue et al., 2018). Briefly, GEMs expression cassettes were amplified via PCR and inserted into pREP41X via Gibson assembly at the XhoI site. The primers used for PCR are described in the supplementary table.
Protoplast preparation
S. pombe cells were grown in YE5S liquid culture at 30 °C to exponential phase, harvested, and washed with SCS buffer (20 mM citrate buffer, 1 M D-sorbitol, pH 5.8), then resuspended in SCS buffer supplemented with 0.1 g/mL Lallzyme (Lallemand, Montreal, Canada) (Flor-Parra et al., 2014). Cells were digested for 10 min at 37 °C with gentle shaking in the dark. The resulting protoplasts were gently washed twice in YE5S medium with 0.2–1 M D-sorbitol, using gentle centrifugation (2 min at 0.4 rcf).
Imaging of fission yeast
S. pombe cells and protoplasts were imaged in commercial microchannels (Ibidi μ-slide VI 0.4 slides; Ibidi 80606, Ibiditreat #1.5). Channels were pre-treated with 50 μl of 100 μg/ml lectin solution for 5 min at room temperature. The lectin solution was removed by pipetting and 50 μl of cell culture were introduced. After incubation for 3 to 10 minutes to allow cells to adhere to the lectin, the cells were washed with YE5S. For hyper-osmotic shocks, the medium was manually removed from the channel via pipetting and quickly replaced with hyper-osmotic media as indicated.
Microtubule dynamics.
Yeast cells expressing GFP-tubulin (see Table) were observed with a 488 nm excitation laser at 100 ms of exposure per z-slice (1 μm spacing, 7 slices) at 0.1 Hz, with a 60x objective (CFI Plan Apochromat VC 60XC WI) on a Nikon TI-E equipped with a spinning-disk confocal head (CSU10, Yokogawa) and an EM-CCD camera (Hammamatsu C9100–13). MTs in protoplasts were imaged with similar settings but the number of z-slices was changed according to protoplasts diameter.
Spindle elongation.
Yeast cells expressing GFP-tubulin and mCh-histones were observed with 488 nm and 561 nm excitation lasers at 100 ms of exposure per z-slice per channel (1 μm spacing, 7 slices) at 0.017 Hz, with a 60x objective (CFI Plan Apochromat VC 60XC WI) on a Nikon TI-E equipped with a spinning-disk confocal head (CSU10, Yokogawa) and an EM-CCD camera (Hammamatsu C9100–13).
Intracellular density.
Intracellular density was measured using a refractive index mismatch approach (Bateman et al., 1966; Marquis, 1973; Odermatt et al., 2021; Wlodarski et al., 2020). Cells from 1 ml of exponentially growing culture were pelleted by centrifugation (10 000 g, 2 minutes) then resuspended in 1 mL of YE or YE + 1.5 M sorbitol containing various amount of BSA. Immediately after resuspension, the sample was split in two cuvettes and OD 600 was measured. Blanked were measured before on YE or YE + 1.5M sorbitol. In YE + 1.5 M sorbitol, we could not produce solutions containing more than 150 mg of BSA per milliliter due to solubility concerns. The OD readout was normalized to YE or YE + 1.5 M sorbitol without BSA. The projection of the linear fits onto the x-axis gives an estimate of the intracellular density for each condition.
Protoplast volume.
Protoplasts were resuspended in YE5S medium with 0.2–1 M D-sorbitol, then imaged with a 561 nm excitation laser (mCherry-Psy1) at 100 ms of exposure per z-slice (0.5 μm spacing), with the 60x objective, microscope, and camera used for MT dynamics.
GEMs diffusion.
Yeast cells were imaged with a 60x TIRF objective (Nikon, MRD01691) on a Nikon TI-E equipped with a Nikon TIRF system and a SCMOS camera (Andor, Ixon Ultra 888). Protoplasts were imaged on a Nikon TI-2 equipped with a Diskovery Multi-modal imaging system from Andor and a SCMOS camera (Andor, Ixon Ultra 888) using a 60x TIRF objective (Nikon, MRD01691). Cells were imaged at 100 Hz, in TIRF, for 10 s with a 488 nm excitation laser.
Tubulin diffusion.
Cells were imaged at 0.2 Hz, with a 60x TIRF objective (Nikon, MRD01691) on a Nikon TI-2 equipped with a Diskovery Multi-modal imaging system from Andor and a SCMOS camera (Andor, Ixon Ultra 888). Cells were imaged using spinning disk with pinhole of 100 μm. Cells were imaged at 488 nm laser excitation; the bleaching laser was a 473 nm laser controlled by a UGA-42 Firefly (Rapp OptoElectronic).
FDA labeling.
Cells were labeled with 100 μM fluorescein diacetate (Sigma, F7378) for 30 min at room temp with agitation. Yeast cells expressing GFP-tubulin (see Table) were observed with a 488 nm excitation laser at 100 ms, with a 60x objective (CFI Plan Apochromat VC 60XC WI) on a Nikon TI-E equipped with a spinning-disk confocal head (CSU10, Yokogawa) and an EM-CCD camera (Hammamatsu C9100–13).
Osmotic shock experiments
Hyperosmotic shifts.
Cells were grown in rich YE5S medium, mounted into microchannels, and then treated with YE5S containing various concentrations of sorbitol while on the microscope stage at room temperature. Loss of water after the switch of medium is almost instantaneous (<30 s). To minimize adaptation responses (Tatebe et al., 2005), imaging was initiated as soon as possible (<1 min) after adding sorbitol.
Osmotic oscillations.
Cells were introduced into a microfluidic system (Cell Asics) as described in (Knapp et al., 2019) then the media in the chamber was oscillated; YE for 5 minutes then YE with 1.5 M sorbitol for 3 or 5 minutes. During the oscillations cells were imaged for MT dynamic measurement as described above.
Cold treatment.
Yeast cells expressing GFP-tubulin were pelleted gently and resuspended in YE containing 0, 0.5, 1, or 1.5 M sorbitol. Each culture was split into two tubes; one was incubated for 5 min at room temperature and the other was incubated on ice for 5 min. Cells were fixed by adding 16% paraformaldehyde to the medium for a final concentration of 4%. Cell were then imaged in lectin-treated Ibidi chambers.
Osmotic shifts of protoplasts.
After cell-wall digestion, protoplasts were gently washed twice in YE5S with 0.4 M D-sorbitol using gentle centrifugation (2 min at 0.4 rcf), then placed in the Ibidi chamber for imaging. Medium was exchanged manually with hypo- or hyper-tonic medium right before imaging. YE + 0.4 M sorbitol was close to isotonic conditions, as determined by comparing volumes and GEMs dynamics to yeast cells. Thus, protoplasts resuspended in YE + 0.2, 0.25, or 0.3 M sorbitol were in hypo-tonic conditions, while protoplasts in YE + 0.5 or 1 M sorbitol were in hyper-tonic conditions.
Measurements of MT dynamic parameters and cell volume in yeast and protoplasts
MT dynamics.
Measurements of MT dynamic parameters were obtained using analyses of kymographs of GFP-tubulin expressing cells. Images of individual cells were cropped and multiple MT bundles per cell were selected from maximum intensity projection of the z-stack. Kymographs were made and analyzed with the KymoToolBox plugin of ImageJ (Schneider et al., 2012).
Volume.
The effects of sorbitol on cell volume were determined from the change in cell width measured from brightfield images at the cell midplane. This calculation was established previously and is based on the isotropic mechanics of the cell-wall and the rod shape of the cell. (Atilgan et al., 2015). Protoplast volume was measured in 3D from Z-stack fluorescence images of cells expressing markers for the plasma membrane (mCherry-Psy1) using LimeSeg, a Fiji pulg-in (Machado et al., 2019; Schindelin et al., 2012).
Spindle elongation.
Spindle length was manually measured on maximum intensity projections using the tubulin signal. Spindles were of various length at the beginning of the experiment so only spindle shorter than 2.5 μm at the starts of the experiments were analyzed. Spindle length was normalized to the first time point for each spindle. Instantaneous elongation rate was measured for each spindle and then averaged.
Mal3 and Alp14 localization.
Fluorescence intensity of Mal3-GFP and Alp14-GFP were measured on sum z-projection. The average intensity along the last 0.5 μm of the MTs was measured averaging over 3 pixels wide. The intensity of the GFP signal was normalized to the intensity of the tubulin-mCherry. Datasets were compared using Mann-Whitney u-test, for Alp14 the difference is non-significant with p-value = 0.11 and for Mal3 the difference is significant with p-value < 0.001.
FLIP experiments
Cells expressing GFP-tubulin were mounted in microchannels and treated with 25 μg/ml methyl benzimidazol-2-yl-carbamate (MBC) for >1 min to depolymerize MTs. Cells were then subjected to repeated photobleaching with a focused 473 nm laser in a 1-μm region near the cell tip using a UGA-42 Firefly system from RapOpto. Cells of similar size (~ 12 μm long) were photobleached in order to reduce variability in the resulting data. Fluorescence decrease was followed in the half of the cell submitted to the bleaching sequence to avoid the effects of diffusion around/through the nucleus. Fluorescence decrease curves were normalized and aligned to the time point preceding the activation of the bleach sequence.
A calibrated 1D Brownian model of diffusion was used to simulate the fluorescence decrease in a 6 μm tube (half of a cell 12 μm in length). Bleaching rate, region size, and position were matched to the experimental setup. Particles positions were updated every 0.01 s. The decrease in the number of unbleached particles in the model was read out every 5 s (matching the imaging frequency) and normalized to the total number of particles. The insensitivity of the model to the total number of particles and to the time interval used was established by changing these parameters across three orders of magnitude, without significant effect on the outputs. Plots of fluorescence decrease for various diffusion rates in the model were compared to the experimentally measured values to obtain the estimated tubulin diffusion rates.
Microrheology with GEMs nanoparticles.
GEM fusion proteins were expressed from pREP41X-based expression vectors from the thiamine-regulated nmt1* promoter (Maundrell, 1990). Transformants containing these plasmids were maintained on EMM-leu medium. The day before imaging, cells were inoculated in EMM-leu medium containing 0.05 µg/mL thiamine to allow a low level of construct expression. These conditions generally produced a few tens of GEM nanoparticles per cell. Overexpression of the GEMs commonly produced cells with single, bright, non-motile aggregates. Cells expressing GEMs were selected for sparse numbers of labeled motile nanoparticles and imaged at 100 Hz intervals. Individual cells were cropped for analysis. Nanoparticles in each cell were tracked using the MOSAIC plugin (Fiji ImageJ), and the effective diffusion rate was determined from mean squared displacement (MSD) plots as previously (Delarue et al., 2018). Briefly, tracks shorter than 10 timepoints were excluded from the MSD analysis. The following fit was used on the first 100 ms to extract the diffusion value for trajectories longer than 10 timepoints: MSD = 4Dt. The following parameters were used for the 2D Brownian dynamics tracking in MOSAIC: radius = 3, cutoff = 0, per/abs = 0.2–0.3, link = 1, and displacement = 6.
MT dynamics in moss cells
Osmotic shocks.
For osmotic shock, observation medium was removed manually via aspiration with a syringe, and medium with sorbitol was subsequently introduced with a syringe.
Microtubule dynamics.
Cells were imaged on a Nikon TI-E TIRF system with a 60x TIRF objective (Nikon, MRD01691) and a SCMOS camera (Andor, Ixon Ultra 888). MT dynamic parameters were obtained using kymographs. Kymographs were made and analyzed with the KymoToolBox plugin of ImageJ.
Analysis.
Measurements of MT dynamic parameters were obtained using kymographs of PTK2 cells stably expressing GFP-tubulin. Region of interest (ROIs) of individual cells were cropped and multiple MTs per ROI were selected. Kymographs were made and analyzed with the KymographBuilder plugin of ImageJ.
MT dynamics in mammalian cells
Osmotic shocks.
The media contained in the 35 mm glass bottom dish was manually replaced by 2 ml of 10% DMEM/F12 prewarmed to 37 °C containing various concentrations of sorbitol while on the microscope stage controlled with the Chamlide TC incubator (kept at 37 °C and 5% CO2). Loss of water after the switch of medium is almost instantaneous (<30 s). To minimize adaptation responses, imaging was initiated 3 minutes before the switch of medium and continued for 4 minutes after adding sorbitol.
Microtubule dynamics.
PTK2 cells stably expressing GFP-tubulin plated in 35 mm glass bottom dish were observed with a 488 nm excitation laser at 200 ms of exposure at 0.2 Hz with a 60x objective (Plan Apo VC 60x/1.40 oil) in a Nikon TI-E equipped with a spinning disk confocal head (CSU-X1, Yokogawa) and a CCD camera (QImaging Retiga R3). The cell culture conditions on the microscope stage were controlled with the Chamlide TC incubator (kept at 37 °C and 5% CO2).
Analysis.
Measurements of MT dynamic parameters were obtained using kymographs of PTK2 cells stably expressing GFP-tubulin. Region of interest (ROIs) of individual cells were cropped and multiple MTs per ROI were selected. Kymographs were made and analyzed with the KymographBuilder plugin of ImageJ.
MT dynamics in vitro
Tubulin preparation.
Tubulin was purified from juvenile bovine brains via cycles of polymerization and depolymerization, as described previously (Ashford and Hyman, 2006). GMPCPP-stabilized MT seeds were prepared by polymerizing a 1:4 molar ratio of tetramethylrhodamine (TAMRA, ThermoFisher Scientific) labeled:unlabeled tubulin (Hyman, 1991) in the presence of GMPCPP (Jena Biosciences) in two cycles, as described previously (Gell et al., 2011).
MT reconstitution assay.
Dynamic MTs were imaged in a reconstitution assay from surface-bound, stabilized MT seeds (Gell et al., 2011). Cover glass was cleaned, as previously described (Helenius et al., 2006). Two silanized cover glasses (22 × 22 mm and 18 × 18 mm) were separated by multiple strips of double-sided tape on custom-machined mounts to create channels for solution exchange. Channels were prepared for experiments by flowing in anti-TAMRA antibodies (ThermoFisher Scientific) and blocking with 1% Pluronic F-127 for 20 min. Channels were rinsed three times with BRB80 before flowing in seeds and placing the chamber on the microscope stage, where the objective was heated to 32 °C with a CU-501 Chamlide lens warmer (Live Cell Instrument).
Dynamic MTs were grown from GMPCPP seeds by filling the channel with 10 µM tubulin in reaction buffer: BRB80 (80 mM PIPES-KOH [pH 6.9], 1 mM EGTA, 1 mM MgCl2) plus 1 mM GTP, 0.1 mg/mL bovine serum albumin, 10 mM dithiothreitol, 250 nM glucose oxidase, 64 nM catalase, and 40 mM D-glucose. Reaction buffer was prepared on ice before being flowed into the channel with a piece of filter paper. A 60% (v/v) glycerol stock solution in BRB80 was added to the indicated final concentrations. For consistency, a large aliquot of tubulin was thawed on the day of each experiment, sub-aliquoted, and stored in liquid nitrogen. A separate sub-aliquot was thawed for each individual experiment. Glycerol concentrations from 0–15% (v/v) were tested. We note that the effects of glycerol concentrations ≥20% were not measurable as no depolymerization events were observed because of the high levels of spontaneous nucleation and inhibition of catastrophes at those glycerol concentrations.
For the buffer exchange, microtubules were grown from 10 µM tubulin in BRB80 buffer with 10% glycerol at 32 °C for at a few minutes. Then, the buffer was manually exchange using a pipette and a piece of filter paper. The buffer exchange happened quickly < 1 minute. The final buffer contained 0 μM tubulin and various amount of glycerol.
Interference reflection microscopy.
Dynamic label-free MTs were imaged with interference reflection microscopy (IRM) as described previously (Mahamdeh and Howard, 2019).
MT dynamics.
MT dynamics was analyzed using kymographs as described above.
Viscosity measurements in vitro.
Viscosities of glycerol solutions were measured using an mVROC Viscometer (Rheosense) at room temperature (23°C as measured by the viscometer). Measurements were made at a flow rate of 1000 µl/min for 5 sec for three replicates of each solution. Using the expected values of viscosity for similar water-glycerol mixtures (http://www.met.reading.ac.uk/~sws04cdw/viscosity_calc.html) at 23°C and 32°C, we extrapolated the viscosity of the buffers at 32°C from the measurements at 23°C.
Cytoplasmic viscosity measurements
FDA labeling.
Wild-type fission yeast cells were grown in YE overnight at room temperature with agitation to below saturation. Cells were labeled with 100 μM fluorescein diacetate (Sigma, F7378) for 30 min at room temperature with agitation.
Time-resolved fluorescence anisotropy.
Cells were imaged in a Ibidi μ-slide VI 0.4 (Ibidi 80606, Ibiditreat #1.5) treated with lectin on an inverted TCS-SP2 microscope (Leica Microsystems, Germany) while the time- and polarization-resolved intensity decay was measured on SPC-150 TCSPC boards (Becker & Hickl, Germany). The emission was split using a polarizing beam splitter. Fluorescein diacetate (FDA) was excited using a picosecond-pulsed (90 ps optical pulse width, 20 MHz repetition rate) 467 nm diode laser (Hamamatsu, Japan) through a 63X 1.2 NA water objective, with a 485 nm dichroic mirror and a 500 nm long pass filter. All measurements were performed at room temperature (22°C).
Parallel (I∥) and perpendicular (I⊥) intensity decays were used to calculate the anisotropy decay, according to
rt=It||−G∗It⊥/It||+z∗G∗It⊥
where z = 1 to account for the depolarization of the high NA objective and G was 0.96. Z was determined by comparing the calculated total intensity decay
of fluorescein measured on the 63x objective and measured on a 5x objective, altering the value of z between 2 and 1 until the lifetime was an exact match (Suhling et al., 2014). G is a correction factor to account for the sensitivity of the two detectors and is calculated by taking the tail value of
after tail-matching of the parallel and perpendicular decays by adjustment of the polarizing beam splitter.
Parallel and perpendicular intensity decays were summed over six measurements (3 measurements x 2 biological repeats) to obtain high photon counts, after ensuring negligible variation between measurements and repeats. The resulting time-resolved anisotropy decay was fit to a monoexponentially decaying model according to
where θ is the rotational correlation time, A is the amplitude of the decay (in terms of the anisotropy decay, this value is equal to r0-r∞), and y0 is the level to which the anisotropy decays (properly known as r∞). The rotational correlation time was converted into a viscosity value in cP using a calibration plot in the relevant viscosity region.
Fluorescein calibration curve.
Methanol solutions containing various amounts of glycerol (0–40%) were prepared. Solution viscosities at room temperature (22 °C) were established previously using a rheometric expansion system rheometer (ARES) (Kuimova et al., 2008) (Steinmark et al., 2020). Fluorescein (10 μM) was added to the solutions and fluorescence was measured at room temperature to extract the rotational correlation times as described above. Note that the calibration was carried out on a 5x air objective; thus, z was taken as 2. Data from the literature (Clayton et al., 2002; Rice and Kenney-Wallace, 1980; Suhling et al., 2004; Verkman et al., 1991) were include in the calibration.
Anisotropy decay.
Anisotropy data were fitted using GraphPad Prism. Fits used 1/STD2 weighting and were limited to the first 10 ns of recording. Best-fit values for each parameter and condition were obtained with a F-test. Best fits were different with p-value = 0.0003.
Normalizations
MT dynamics versus cellular volume.
MT dynamics and cell volume in yeast were normalized to the YE condition (no sorbitol). In protoplasts MT dynamics and volume were normalized to the 0.4 M sorbitol condition.
GEMs diffusion versus volume.
Diffusion values and volumes were normalized to the YE (no sorbitol condition) for yeast and to the 0.4 M sorbitol condition for protoplasts.
Polymerization rate versus depolymerization rate.
For yeast, data rates were normalized to the YE (no sorbitol) condition. For protoplasts, data were normalized to the 0.4 M sorbitol condition. For moss, data were normalized to the BCD (no sorbitol) condition. For in vitro, data were normalized to the BRB 80 (no glycerol) condition. For the model, data were normalized to the k+= 1.25 /pf/μM condition. A linear fit on the normalized data from the model gives a slope of 1.1 +/− 0.2. Normalized data from all the other systems (yeast cells, yeast protoplasts, moss cells, in vitro) collapse on the same slope according to a F-test. P values were 0.2, 0.9, 0.8, and 0.38 for yeast cells, yeast protoplasts, moss cells and in vitro respectively.
Supplementary Material
Supplemental figures
Supplemental Movie 1
Supplemental movie 1: Fission yeast cells expressing GFP-labelled tubulin. Related to figure 1. Cells were subjected to oscillatory hyper-osmotic shifts of 1.5 M sorbitol. Microtubule dynamics stops in YE + 1.5 M sorbitol then restarts. See Figure 1 B.
Supplemental Movie 2
Supplemental movie 2: Fission yeast cells expressing GFP-labelled tubulin. Related to figure 2. Cells were imaged immediately after an acute hyper-osmotic shift. Microtubule dynamics is decreased in YE + 0.5 and + 1 M sorbitol and abolished in YE + 1.5 M sorbitol. See Figure 1 C to F.
Supplemental Movie 3
Supplemental movie 3: Ptk2 cells expressing GFP-labelled tubulin. Related to figure 3. Cells were imaged before and after a hyper-osmotic shock of 375 mM of sorbitol. Microtubule dynamics is drastically reduced in presence of + 375 mM sorbitol. See figure 3.
Supplemental Movie 4
Supplemental movie 4: Fission yeast cells expressing the 40-nm-GEM nanoparticle. Related to figure 4. Cells were imaged immediately after an acute hyper-osmotic shift. GEMs motion is decreased in YE + 0.5 and + 1 M sorbitol and almost abolished in YE + 1.5 M sorbitol. See figure 4.
Supplemental Movie 5
Supplemental movie 5: Microtubule dynamics in vitro in buffer of various viscosity. Related to figure 7. Viscosity is increased using glycerol. Microtubule dynamics decreases with the increase in viscosity caused by the addition of glycerol. See figure 7.
Supplemental Movie 6
Supplemental movie 6: Microtubule dynamics in vitro before and after a buffer exchange removing free tubulin and increasing viscosity with glycerol. Related to figure 7. Microtubules depolymerize rapidly in absence of free tubulin in low viscosity/glycerol condition but depolymerization is slower in high viscosity/glycerol conditions. See supplemental figure X.
Supplemental Movie 7
Supplemental movie 7: Fission yeast cells expressing GFP-labelled tubulin and mCherry-labelled histones. Related to supplemental figure 1. Cells were subjected to oscillatory hyper-osmotic shifts of 1.5 M sorbitol. Spindle elongation and DNA segregation is almost stopped during the oscillation with 1.5 M sorbitol. See supplemental figure 11.
KEY RESOURCE TABLE.
| REAGENT OR RESOURCE | SOURCE | IDENTIFIER |
|---|---|---|
| Experimental models: S. pombe strains | ||
| h- wt 972 | Chang lab collection | FC15 |
| h+ GFP-atb2:kanMX ade6- leu1–32 ura4-D18 | Chang lab collection | FC2861 |
| h+ sty1::ura4+ GFP-atb2:kanMX | this manuscript | AM23 / FC3283 |
| h- mal3::natMX leu1–32::SV40-GFP-atb2[LEU1+] ade6- leu1- ura4- | Chang lab collection | FC2343 |
| h+ alp14::NatMX leu1–32::SV40-GFP-atb2[LEU1+] leu1- ura4- | Chang lab collection | FC2357 |
| h-rps802-GFP::kanR leu1–32 ura4-D18 ade6–216 | Knapp et al., 2019 | FC3208 |
| alp14-GFP-kan atb2-mCh::hph | this manuscript | AM53 / FC3284 |
| mal3-GFP:kanMX atb2-mCh::hph | this manuscript | AM57 / FC3285 |
| pREP41X_AqLs:Sapphire | this manuscript | AM35 / FC3286 |
| pREP41X_PfV:Sapphire | this manuscript | AM38 / FC3287 |
| h- ade6<<mCherry-psy1 ish1-GFP:kanMX gpd1::hphMX6 ura4-D18 ade6 | this manuscript | JL160 / FC3290 |
| h- pREp41X-Pfv-Sapphire ade6-M216 leu1–32 ura4D18 his3-D1 | this manuscript | JL110 / FC3289 |
| tip1::KanMX leu1–32::pSV40-GFP-atb2(leu1+) | this manuscript | AM94 / FC3325 |
| klp5::ura+ GFP-atb2:kanMX | this manuscript | AM92 / FC3326 |
| h+ hta1-mCherry:kanMX GFP-atb2:kanMX ade6- leu1–32 ura4- his+ | this manuscript | AM2 / FC2859 |
| Experimental model: Physcomitrella patens line | ||
| EB1-Citrine mCherry-tubulin | Kosetsu et al., 2013 | GPH0379#2 |
| CHEMICALS | ||
| YES 225 | Sunrise Science Products | 2011–500 |
| Edinburgh Minimal Media (EMM) | MP Biomedicals | 4110–032 |
| Agar | Difco | 281210 |
| D-sorbitol | Sigma | S1876 |
| Adenine | Sigma | A9126 |
| Leucine | Sigma | L8000 |
| Histidine | Sigma | H8000 |
| Uracil | Sigma | U0750 |
| Carbendazim | Sigma | 378674–100G |
| Lectin | Sigma | L1395 |
| Fluorescein Diacetate | Sigma | F7378 |
| Lallzyme MMX | Scott laboratories | 016207 |
| Bovine Serum Albumin | Fisher scientific | 9048–46-8 |
| Paraformaldehyde | ThermoFisher | 28906 |
| Softwares | ||
| FIJI | Schindelin et al., 2012 | https://imagej.net/contribute/fiji |
| ImageJ | Schneider et al., 2012 | https://imagej.nih.gov/ij/ |
| MOSAIC for imageJ | Sbalzarini et al., 2005 | https://imagej.net/plugins/mosaicsuite |
| LimeSeg | Machado et al., 2019 | https://imagej.net/plugins/limeseg |
| Matlab | Mathworks® | https://www.mathworks.com/ |
| Micromanager | Edelstein et al., 2010 | https://micromanager.org/Citing_Micro-Manager |
Highlights.
- Osmotic shifts modulate microtubule assembly and disassembly proportionally in cells.
- Effects correlate with changes in cytoplasmic concentration, viscosity and diffusion.
- Effects are conserved across eukaryotes (yeast, plants, mammalian cells).
- Cytoplasmic dampening of microtubules is recapitulated by a viscous agent in vitro.
Acknowledgments
We thank members of the Chang lab, and Sophie Dumont and her lab for fruitful discussions. We are grateful to Dr. Rikki Garner for countless discussions and her help setting up the stochastic model of diffusion, and to Dr. Fabrice Cordelières for the KymoToolBox ImageJ plug-in. We thank Sherman Foo and the Oliferenko lab for reagents and technical support. We are grateful to Steve Ross and Nikon for microscope support at MBL, and to the MBL communities from the Physical Biology of the Cell Course, the Physiology Course and the Whitman Investigator Program for support and advice. Emilie Steinmark would like to thank King’s College London for her LIDo (London Interdisciplinary Doctoral programme) iCASE PhD studentship.
Funding
This work was supported by a grant to F.C (NIH R01GM115185), to L.J.H. (American Cancer Society, Pershing Square Sohn Cancer Award, Chan Zuckerberg Initiative, NIH R01 GM132447 and R37 CA240765) and, to G.G. (JSPS KAKENHI 17H06471 and 18KK0202)
Footnotes
Publisher's Disclaimer: This is a PDF file of an unedited manuscript that has been accepted for publication. As a service to our customers we are providing this early version of the manuscript. The manuscript will undergo copyediting, typesetting, and review of the resulting proof before it is published in its final form. Please note that during the production process errors may be discovered which could affect the content, and all legal disclaimers that apply to the journal pertain.
Declaration of Interests
The authors declare no competing interests.
Inclusion and Diversity
One or more of the authors of this paper self-identifies as a member of the LGBTQ+ community.
Supplemental Information
Refers to the webpage for description and access to the supplemental material.
References
- Akhmanova A, and Steinmetz MO (2010). Microtubule +TIPs at a glance. J. Cell Sci 123, 3415–3419. [DOI] [PubMed] [Google Scholar]
- Al-Bassam J, Kim H, Flor-Parra I, Lal N, Velji H, and Chang F (2012). Fission yeast Alp14 is a dose-dependent plus end-tracking microtubule polymerase. Mol. Biol. Cell 23, 2878–2890. [DOI] [PMC free article] [PubMed] [Google Scholar]
- Ashford AJ, and Hyman AA (2006). Preparation of tubulin from porcine brain. In Cell Biology, Four-Volume Set, (Elsevier Inc.), pp. 155–160. [Google Scholar]
- Atilgan E, Magidson V, Khodjakov A, and Chang F (2015). Morphogenesis of the fission yeast cell through cell wall expansion. Curr. Biol 25, 2150–2157. [DOI] [PMC free article] [PubMed] [Google Scholar]
- Bateman JB, Wagman J, and Carstensen EL (1966). Refraction and absorption of light in bacterial suspensions. Kolloid-Zeitschrift Zeitschrift Für Polym 208. [Google Scholar]
- Beauzamy L, Nakayama N, and Boudaoud A (2014). Flowers under pressure: Ins and outs of turgor regulation in development. Ann. Bot 114, 1517–1533. [DOI] [PMC free article] [PubMed] [Google Scholar]
- Brouhard GJ, and Rice LM (2018). Microtubule dynamics: An interplay of biochemistry and mechanics. Nat. Rev. Mol. Cell Biol 19, 451–463. [DOI] [PMC free article] [PubMed] [Google Scholar]
- Busch KE, and Brunner D (2004). The microtubule plus end-tracking proteins mal3p and tip1p cooperate for cell-end targeting of interphase microtubules. Curr. Biol 14, 548–559. [DOI] [PubMed] [Google Scholar]
- Charras GT, Mitchison TJ, and Mahadevan L (2009). Animal cell hydraulics. J. Cell Sci 122, 3233–3241. [DOI] [PMC free article] [PubMed] [Google Scholar]
- Chowdhury S, Smith KW, and Gustin MC (1992). Osmotic stress and the yeast cytoskeleton: phenotype-specific suppression of an actin mutation. J. Cell Biol 118, 561–571. [DOI] [PMC free article] [PubMed] [Google Scholar]
- Clayton AHA, Hanley QS, Arndt-Jovin DJ, Subramaniam V, and Jovin TM (2002). Dynamic fluorescence anisotropy imaging microscopy in the frequency domain (rFLIM). Biophys. J 83, 1631–1649. [DOI] [PMC free article] [PubMed] [Google Scholar]
- Daga RR, Yonetani A, and Chang F (2006). Asymmetric Microtubule Pushing Forces in Nuclear Centering. Curr. Biol 16, 1544–1550. [DOI] [PubMed] [Google Scholar]
- Delarue M, Brittingham GP, Pfeffer S, Surovtsev IV, Pinglay S, Kennedy KJ, Schaffer M, Gutierrez JI, Sang D, Poterewicz G, et al. (2018). mTORC1 Controls Phase Separation and the Biophysical Properties of the Cytoplasm by Tuning Crowding. Cell 174, 338–349.e20. [DOI] [PMC free article] [PubMed] [Google Scholar]
- Drenckhahn D, and Pollard TD (1986). Elongation of actin filaments is a diffusion-limited reaction at the barbed end and is accelerated by inert macromolecules. J. Biol. Chem 261, 12754–12758. [PubMed] [Google Scholar]
- Dupuis NF, Holmstrom ED, and Nesbitt DJ (2018). Tests of Kramers’ Theory at the Single-Molecule Level: Evidence for Folding of an Isolated RNA Tertiary Interaction at the Viscous Speed Limit. J. Phys. Chem. B 122, 8796–8804. [DOI] [PubMed] [Google Scholar]
- Einstein A (1905). Über die von der molekularkinetischen Theorie der Wärme geforderte Bewegung von in ruhenden Flüssigkeiten suspendierten Teilchen. Ann. Phys
- Ellis JR (2001). Macromolecular crowding: obvious but underappreciated. Trends Biochem. Sci 26, 597–604. [DOI] [PubMed] [Google Scholar]
- Fakhri N, Wessel AD, Willms C, Pasquali M, Klopfenstein DR, MacKintosh FC, and Schmidt CF (2014). High-resolution mapping of intracellular fluctuations using carbon nanotubes. Science (80-. ) 344, 1031–1035. [DOI] [PubMed] [Google Scholar]
- Flor-Parra I, Zhurinsky J, Bernal M, Gallardo P, and Daga RR (2014). A Lallzyme MMX-based rapid method for fission yeast protoplast preparation. Yeast 31, 61–66. [DOI] [PubMed] [Google Scholar]
- Fygenson DK, Braun E, and Libchaber A (1994). Phase diagram of microtubules. Phys. Rev. E [DOI] [PubMed]
- Gell C, Friel CT, Borgonovo B, Drechsel DN, Hyman AA, and Howard J (2011). Purification of tubulin from porcine brain. Methods Mol. Biol 777, 15–28. [DOI] [PubMed] [Google Scholar]
- Guesdon A, Bazile F, Buey RM, Mohan R, Monier S, García RR, Angevin M, Heichette C, Wieneke R, Tampé R, et al. (2016). EB1 interacts with outwardly curved and straight regions of the microtubule lattice. Nat. Cell Biol 18, 1102–1108. [DOI] [PubMed] [Google Scholar]
- Guo Y, Li D, Zhang S, Yang Y, Liu JJ, Wang X, Liu C, Milkie DE, Moore RP, Tulu US, et al. (2018). Visualizing Intracellular Organelle and Cytoskeletal Interactions at Nanoscale Resolution on Millisecond Timescales. Cell 175. [DOI] [PubMed] [Google Scholar]
- Hagen SJ (2010). Solvent Viscosity and Friction in Protein Folding Dynamics. Curr. Protein Pept. Sci 999, 1–11. [DOI] [PubMed] [Google Scholar]
- Haupt A, and Ershov D (2018). A Positive Feedback between Growth and Polarity Provides Directional Persistency and Flexibility to the Process of Tip Growth. Curr. Biol 28, 3342–3351.e3. [DOI] [PubMed] [Google Scholar]
- Helenius J, Brouhard G, Kalaidzidis Y, Diez S, and Howard J (2006). The depolymerizing kinesin MCAK uses lattice diffusion to rapidly target microtubule ends. Nature 441, 115–119. [DOI] [PubMed] [Google Scholar]
- Höög JL, Schwartz C, Noon AT, O’Toole ET, Mastronarde DN, McIntosh JR, and Antony C (2007). Organization of Interphase Microtubules in Fission Yeast Analyzed by Electron Tomography. Dev. Cell 12, 349–361. [DOI] [PubMed] [Google Scholar]
- Hyman AA (1991). Preparation of marked microtubules for the assay of the polarity of microtubule-based motors by fluorescence. In Journal of Cell Science, pp. 125–127. [DOI] [PubMed]
- Ishikawa-Ankerhold HC, Ankerhold R, and Drummen GPC (2012). Advanced fluorescence microscopy techniques-FRAP, FLIP, FLAP, FRET and FLIM. Molecules 17, 4047–4132. [DOI] [PMC free article] [PubMed] [Google Scholar]
- Knapp BD, Odermatt P, Rojas ER, Cheng W, He X, Huang KC, and Chang F (2019). Decoupling of Rates of Protein Synthesis from Cell Expansion Leads to Supergrowth. Cell Syst 9, 434–445.e6. [DOI] [PMC free article] [PubMed] [Google Scholar]
- Kozgunova E, and Goshima G (2019). A versatile microfluidic device for highly inclined thin illumination microscopy in the moss Physcomitrella patens. Sci. Rep 9, 1–8. [DOI] [PMC free article] [PubMed] [Google Scholar]
- Krüger LK, Sanchez JL, Paoletti A, and Tran PT (2019). Kinesin-6 regulates cell-size-dependent spindle elongation velocity to keep mitosis duration constant in fission yeast. Elife 8. [DOI] [PMC free article] [PubMed] [Google Scholar]
- Kuimova MK, Yahioglu G, Levitt JA, and Suhling K (2008). Molecular rotor measures viscosity of live cells via fluorescence lifetime imaging. J. Am. Chem. Soc 130, 6672–6673. [DOI] [PubMed] [Google Scholar]
- Lemière J, and Berro J (2018). Adaptation of actin dynamics and membrane tension control for yeast endocytosis. BioRxiv 342030.
- Lemière J, Real-Calderon P, Holt LJ, Fai TG, and Chang F (2021). Control of nuclear size by osmotic forces in Schizosaccharomyces pombe. BioRxiv 2021.12.05.471221 [DOI] [PMC free article] [PubMed]
- Loiodice I, Janson ME, Tavormina P, Schaub S, Bhatt D, Cochran R, Czupryna J, Fu C, and Tran PT (2019). Quantifying tubulin concentration and microtubule number throughout the fission yeast cell cycle. Biomolecules 9. [DOI] [PMC free article] [PubMed] [Google Scholar]
- Luby-Phelps K, Taylor DL, and Lanni F (1986). Probing the structure of cytoplasm. J. Cell Biol [DOI] [PMC free article] [PubMed]
- Machado S, Mercier V, and Chiaruttini N (2019). LimeSeg: A coarse-grained lipid membrane simulation for 3D image segmentation. BMC Bioinformatics 20, 2. [DOI] [PMC free article] [PubMed] [Google Scholar]
- Mahamdeh M, and Howard J (2019). Implementation of interference reflection microscopy for label-free, high-speed imaging of microtubules. J. Vis. Exp 2019. [DOI] [PMC free article] [PubMed] [Google Scholar]
- Marquis RE (1973). Immersion Refractometry of Isolated Bacterial Cell Walls [DOI] [PMC free article] [PubMed]
- Maundrell K (1990). nmt1 of fission yeast. A highly transcribed gene completely repressed by thiamine. J. Biol. Chem 265, 10857–10864. [PubMed] [Google Scholar]
- Mcguffee SR, and Elcock AH (2010). Diffusion, Crowding & Protein Stability in a Dynamic Molecular Model of the Bacterial Cytoplasm. PLoS Comput Biol 6, 1000694. [DOI] [PMC free article] [PubMed] [Google Scholar]
- Miermont A, Waharte F, Hu S, McClean MN, Bottani S, Léon S, and Hersen P (2013). Severe osmotic compression triggers a slowdown of intracellular signaling, which can be explained by molecular crowding. Proc. Natl. Acad. Sci. U. S. A 110, 5725–5730. [DOI] [PMC free article] [PubMed] [Google Scholar]
- Milo R, and Phillips R (2015). Cell Biology by the Numbers
- Minton AP (2006). How can biochemical reactions within cells differ from those in test tubes? J. Cell Sci 119, 2863–2869. [DOI] [PubMed] [Google Scholar]
- Mitchison TJ (2019). Colloid osmotic parameterization and measurement of subcellular crowding. Mol. Biol. Cell [DOI] [PMC free article] [PubMed]
- Moeendarbary E, Valon L, Fritzsche M, Harris AR, Moulding DA, Thrasher AJ, Stride E, Mahadevan L, and Charras GT (2013). The cytoplasm of living cells behaves as a poroelastic material. Nat. Mater [DOI] [PMC free article] [PubMed]
- Moreno S, Klar A, and Nurse P (1991). Molecular genetic analysis of fission yeast Schizosaccharomyces pombe. Methods Enzymol 194, 795–823. [DOI] [PubMed] [Google Scholar]
- Munishkina LA, Cooper EM, Uversky VN, and Fink AL (2004). The effect of macromolecular crowding on protein aggregation and amyloid fibril formation. In Journal of Molecular Recognition, (J Mol Recognit; ), pp. 456–464. [DOI] [PubMed] [Google Scholar]
- Mutavchiev DR, Leda M, and Sawin KE (2016). Remodeling of the Fission Yeast Cdc42 Cell-Polarity Module via the Sty1 p38 Stress-Activated Protein Kinase Pathway. Curr. Biol 26, 2921–2928. [DOI] [PMC free article] [PubMed] [Google Scholar]
- Neurohr GE, and Amon A (2020). Relevance and Regulation of Cell Density. Trends Cell Biol 30, 213–225. [DOI] [PMC free article] [PubMed] [Google Scholar]
- Obodovskiy I (2019). Basics of Biology. In Radiation, (Elsevier; ), pp. 429–445. [Google Scholar]
- Odermatt PD, Miettinen TP, Lemière J, Kang JH, Bostan E, Manalis SR, Huang KC, and Chang F (2021). Variations of intracellular density during the cell cycle arise from tip-growth regulation in fission yeast. Elife 10. [DOI] [PMC free article] [PubMed] [Google Scholar]
- Perez P, and Cansado J (2011). Cell Integrity Signaling and Response to Stress in Fission Yeast. Curr. Protein Pept. Sci 11, 680–692. [DOI] [PubMed] [Google Scholar]
- Persson LB, Ambati VS, and Brandman O (2020). Cellular Control of Viscosity Counters Changes in Temperature and Energy Availability. Cell 183, 1572–1585.e16. [DOI] [PMC free article] [PubMed] [Google Scholar]
- Pradeep L, and Udgaonkar JB (2006). Diffusional Barrier in the Unfolding of a Small Protein [DOI] [PubMed]
- Rice SA, and Kenney-Wallace GA (1980). Time-resolved fluorescence depolarization studies of rotational relaxation in viscous media. Chem. Phys 47, 161–170. [Google Scholar]
- Robertson AM, and Hagan IM (2008). Stress-regulated kinase pathways in the recovery tip growth and microtubule dynamics following osmotic stress in S. pombe. J. Cell Sci 121, 4055–4068. [DOI] [PubMed] [Google Scholar]
- Salmon ED, Saxton WM, Leslie RJ, Karow ML, and McIntosh JR (1984). Diffusion coefficient of fluorescein-labeled tubulin in the cytoplasm of embryonic cells of a sea urchin: Video image analysis of fluorescence redistribution after photobleaching. J. Cell Biol 99, 2157–2164. [DOI] [PMC free article] [PubMed] [Google Scholar]
- Sato M, Toya M, and Toda T (2009). Visualization of fluorescence-tagged proteins in fission yeast: The analysis of mitotic spindle dynamics using GFP-tubulin under the native promoter. Methods Mol. Biol 545, 185–203. [DOI] [PubMed] [Google Scholar]
- Sawin KE, and Tran PT (2006). Cytoplasmic microtubule organization in fission yeast. Yeast 23, 1001–1014. [DOI] [PMC free article] [PubMed] [Google Scholar]
- Schindelin J, Arganda-Carreras I, Frise E, Kaynig V, Longair M, Pietzsch T, Preibisch S, Rueden C, Saalfeld S, Schmid B, et al. (2012). Fiji: An open-source platform for biological-image analysis. Nat. Methods 9, 676–682. [DOI] [PMC free article] [PubMed] [Google Scholar]
- Schneider CA, Rasband WS, and Eliceiri KW (2012). NIH Image to ImageJ: 25 years of image analysis. Nat. Methods 9, 671–675. [DOI] [PMC free article] [PubMed] [Google Scholar]
- Shahid S, Hassan MI, Islam A, and Ahmad F (2017). Size-dependent studies of macromolecular crowding on the thermodynamic stability, structure and functional activity of proteins: in vitro and in silico approaches. Biochim. Biophys. Acta - Gen. Subj 1861, 178–197. [DOI] [PubMed] [Google Scholar]
- Siegel J, Suhling K, Lévêque-Fort S, Webb SED, Davis DM, Phillips D, Sabharwal Y, and French PMW (2003). Wide-field time-resolved fluorescence anisotropy imaging (TR-FAIM): Imaging the rotational mobility of a fluorophore. Rev. Sci. Instrum 74, 182–192. [Google Scholar]
- Sozański K, Ruhnow F, Wis̈niewska A, Tabaka M, Diez S, and Hołyst R (2015). Small Crowders Slow Down Kinesin-1 Stepping by Hindering Motor Domain Diffusion. Phys. Rev. Lett 115. [DOI] [PubMed] [Google Scholar]
- Steinmark IE, Chung P, Ziolek RM, Cornell B, Smith P, Levitt JA, Tregidgo C, Molteni C, Yahioglu G, Lorenz CD, et al. (2020). Time-Resolved Fluorescence Anisotropy of a Molecular Rotor Resolves Microscopic Viscosity Parameters in Complex Environments. Small 16, 1907139. [DOI] [PubMed] [Google Scholar]
- Suhling K, Siegel J, Lanigan PMP, Lévêque-Fort S, Webb SED, Phillips D, Davis DM, and French PMW (2004). Time-resolved fluorescence anisotropy imaging applied to live cells. Opt. Lett 29, 584. [DOI] [PubMed] [Google Scholar]
- Suhling K, Levitt J, and Chung PH (2014). Time-resolved fluorescence anisotropy imaging. Methods Mol. Biol 1076, 503–519. [DOI] [PubMed] [Google Scholar]
- Tatebe H, Shimada K, Uzawa S, Morigasaki S, and Shiozaki K (2005). Wsh3/Tea4 is a novel cell-end factor essential for bipolar distribution of tea1 and protects cell polarity under environmental stress in S. pombe. Curr. Biol 15, 1006–1015. [DOI] [PubMed] [Google Scholar]
- Tran PT, Marsh L, Doye V, Inoué S, and Chang F (2001). A mechanism for nuclear positioning in fission yeast based on microtubule pushing. J. Cell Biol 153, 397–411. [DOI] [PMC free article] [PubMed] [Google Scholar]
- Unsworth A, Masuda H, Dhut S, and Toda T (2008). Fission Yeast Kinesin-8 Klp5 and Klp6 Are Interdependent for Mitotic Nuclear Retention and Required for Proper Microtubule Dynamics. Mol. Biol. Cell 19, 5104. [DOI] [PMC free article] [PubMed] [Google Scholar]
- Verkman AS, Armijo M, and Fushimi K (1991). Construction and evaluation of a frequency-domain epifluorescence microscope for lifetime and anisotropy decay measurements in subcellular domains. Biophys. Chem 40, 117–125. [DOI] [PubMed] [Google Scholar]
- Walker RA, O’Brien ET, Pryer NK, Soboeiro MF, Voter WA, Erickson HP, and Salmon ED (1988). Dynamic instability of individual microtubules analyzed by video light microscopy: rate constants and transition frequencies. J. Cell Biol 107, 1437–1448. [DOI] [PMC free article] [PubMed] [Google Scholar]
- Wang Z, Shah JV, Chen Z, Sun C-H, and Berns MW (2004). Fluorescence correlation spectroscopy investigation of a GFP mutant-enhanced cyan fluorescent protein and its tubulin fusion in living cells with two-photon excitation. J. Biomed. Opt 9, 395. [DOI] [PubMed] [Google Scholar]
- Watari J, Kobae Y, Yamaki S, Yamada K, Toyofuku K, Tabuchi T, and Shiratake K (2004). Identification of Sorbitol Transporters Expressed in the Phloem of Apple Source Leaves. Plant Cell Physiol 45, 1032–1041. [DOI] [PubMed] [Google Scholar]
- Wieczorek M, Chaaban S, and Brouhard GJ (2013). Macromolecular crowding pushes catalyzed microtubule growth to near the theoretical limit. Cell. Mol. Bioeng 6, 383–392. [Google Scholar]
- Wlodarski M, Mancini L, Raciti B, Sclavi B, Lagomarsino MC, and Cicuta P (2020). Cytosolic Crowding Drives the Dynamics of Both Genome and Cytosol in Escherichia coli Challenged with Sub-lethal Antibiotic Treatments. IScience 23. [DOI] [PMC free article] [PubMed] [Google Scholar]
- Wood RE, Wirth FP, and Morgan HE (1968). Glucose permeability of lipid bilayer membranes. BBA - Biomembr 163, 171–178. [DOI] [PubMed] [Google Scholar]
- Xiang Y, Surovtsev I, Chang Y, Govers S, Parry B, Liu J, and Jacobs-Wagner C (2020). Solvent quality and chromosome folding in Escherichia coli. BioRxiv 2020.07.09.195560 [DOI] [PubMed]
- Yamada M, Miki T, and Goshima G (2016). Imaging mitosis in the moss Physcomitrella patens. In Methods in Molecular Biology, (Humana Press Inc.), pp. 263–282. [DOI] [PubMed] [Google Scholar]
- Yu I, Mori T, Ando T, Harada R, Jung J, Sugita Y, and Feig M (2016). Biomolecular interactions modulate macromolecular structure and dynamics in atomistic model of a bacterial cytoplasm. Elife 5, 1–22. [DOI] [PMC free article] [PubMed] [Google Scholar]
Associated Data
This section collects any data citations, data availability statements, or supplementary materials included in this article.
Supplementary Materials
Supplemental figures
Supplemental Movie 1
Supplemental movie 1: Fission yeast cells expressing GFP-labelled tubulin. Related to figure 1. Cells were subjected to oscillatory hyper-osmotic shifts of 1.5 M sorbitol. Microtubule dynamics stops in YE + 1.5 M sorbitol then restarts. See Figure 1 B.
Supplemental Movie 2
Supplemental movie 2: Fission yeast cells expressing GFP-labelled tubulin. Related to figure 2. Cells were imaged immediately after an acute hyper-osmotic shift. Microtubule dynamics is decreased in YE + 0.5 and + 1 M sorbitol and abolished in YE + 1.5 M sorbitol. See Figure 1 C to F.
Supplemental Movie 3
Supplemental movie 3: Ptk2 cells expressing GFP-labelled tubulin. Related to figure 3. Cells were imaged before and after a hyper-osmotic shock of 375 mM of sorbitol. Microtubule dynamics is drastically reduced in presence of + 375 mM sorbitol. See figure 3.
Supplemental Movie 4
Supplemental movie 4: Fission yeast cells expressing the 40-nm-GEM nanoparticle. Related to figure 4. Cells were imaged immediately after an acute hyper-osmotic shift. GEMs motion is decreased in YE + 0.5 and + 1 M sorbitol and almost abolished in YE + 1.5 M sorbitol. See figure 4.
Supplemental Movie 5
Supplemental movie 5: Microtubule dynamics in vitro in buffer of various viscosity. Related to figure 7. Viscosity is increased using glycerol. Microtubule dynamics decreases with the increase in viscosity caused by the addition of glycerol. See figure 7.
Supplemental Movie 6
Supplemental movie 6: Microtubule dynamics in vitro before and after a buffer exchange removing free tubulin and increasing viscosity with glycerol. Related to figure 7. Microtubules depolymerize rapidly in absence of free tubulin in low viscosity/glycerol condition but depolymerization is slower in high viscosity/glycerol conditions. See supplemental figure X.
Supplemental Movie 7
Supplemental movie 7: Fission yeast cells expressing GFP-labelled tubulin and mCherry-labelled histones. Related to supplemental figure 1. Cells were subjected to oscillatory hyper-osmotic shifts of 1.5 M sorbitol. Spindle elongation and DNA segregation is almost stopped during the oscillation with 1.5 M sorbitol. See supplemental figure 11.
Data Availability Statement
Data generated in this study are available upon request.