MATCHTM: a tool for searching transcription factor binding sites in DNA sequences (original) (raw)
Abstract
MatchTM is a weight matrix-based tool for searching putative transcription factor binding sites in DNA sequences. MatchTM is closely interconnected and distributed together with the TRANSFAC® database. In particular, MatchTM uses the matrix library collected in TRANSFAC® and therefore provides the possibility to search for a great variety of different transcription factor binding sites. Several sets of optimised matrix cut-off values are built in the system to provide a variety of search modes of different stringency. The user may construct and save his/her specific user profiles which are selected subsets of matrices including default or user-defined cut-off values. Furthermore a number of tissue-specific profiles are provided that were compiled by the TRANSFAC® team. A public version of the MatchTM tool is available at: http://www.gene-regulation.com/pub/programs.html#match. The same program with a different web interface can be found at http://compel.bionet.nsc.ru/Match/Match.html. An advanced version of the tool called MatchTM Professional is available at http://www.biobase.de.
INTRODUCTION
Regulation of gene expression on the level of transcription is a very complex process especially in multicellular eukaryotic organisms. Each cell type or tissue, at a specific developmental stage or under influence of an extracellular signal expresses a characteristic pattern of activated transcription factors (TF). These transcription-regulating nuclear proteins bind to specific binding sites in the regulatory regions (e.g. promoters, enhancers) of the genes thus providing their activation or repression. Computational methods of predicting TF binding sites in DNA are very important for understanding the molecular mechanisms of gene regulation. We have developed a new tool called MatchTM which is a weight matrix-based tool for searching putative transcription factor binding sites in DNA sequences. MatchTM uses a library of position weight matrices (PWMs) collected in the TRANSFAC® database (1) and therefore provides the possibility to search for a great variety of different transcription factor binding sites. There are several similar software tools available on the web that use weight matrices for predicting TF binding sites. SIGNAL SCAN (2), MATRIX SEARCH (3) and TESS (see in 4) are best known. MatchTM differs from them by providing the most up-to-date library of matrices. Moreover, MatchTM uses different algorithms for calculating score by applying the so called information vector (see below). In that way it is similar to MatInspector (5), where the information vector is also used. However, MatchTM's particular strength is in the extensive use of optimised, predefined by experts, function-specific sets of matrices and other parameters of the search (see below).
ALGORITHM
MatchTM takes DNA sequences as input, searches for potential TF binding sites using a library of PWMs and outputs a list of found potential sites and a visual representation of their locations in the sequence. The search algorithm uses two score values: the matrix similarity score (MSS) and the core similarity score (CSS). These two scores measure the quality of a match between the sequence and the matrix, which ranges from 0.0 to 1.0, where 1.0 denotes an exact match. The core of each matrix is defined as the first five most conserved consecutive positions of a matrix. Both scores, MSS and CSS, are calculated using the same formula (see below). Whereas MSS is calculated using all positions of the matrix, CSS is calculated using the core positions only. Two cut-offs for two corresponding scores are defined for every matrix (pre-defined by the MatchTM team or set up by the user). The algorithm reports only those matches of a matrix that have got both scores higher than the two corresponding cut-offs. To speed up the algorithm a hash table is constructed for all pentanucleotides in the sequence under study. The core similarity score is calculated for all pentanucleotides and the program puts the corresponding values into the hash table. For each entry of the hash table with the CSS higher than the cut-off each occurrence of this pentanucleotide is looked up in the sequence and is prolonged at both ends, so that it fits the matrix length. Then the matrix similarity score is calculated. Only those matches for which the matrix similarity score is higher than a certain cut-off are given in the program output.
The matrix similarity score mSS (as well as the core similarity score) for a subsequence x of the length L is calculated in the following way:
f i,B, frequency of nucleotide B to occur at the position i of the matrix (_B_∈{A, T, G, C})
_fi_min, frequency of the nucleotide which is rarest in position i in the matrix
_fi_max, highest frequency in position i.
The information vector
describes the conservation of the positions i in a matrix (5). Multiplication of the frequencies with the information vector leads to a higher acceptance of mismatches in less conserved regions, whereas mismatches in highly conserved regions are very much discouraged. This leads to a better performance in recognition of TF binding sites if compared with methods that do not use the information vector (6).
Matrix similarity cut-off estimation
In order to find putative TF binding sites with the help of MatchTM it is very important to choose appropriate values of the cut-off for core and matrix similarity. Selection of a cut-off value largely depends on the user's objectives. We have pre-calculated three different cut-offs for each matrix presented in the TRANSFAC® database (as in 7): (i) to minimise false positive (over-prediction error) rate; (ii) to minimise false negative (under-prediction error) rate; (iii) to minimise the sum of both errors.
Cut-offs minimising false negative rate (minFN)
We used actual weight matrices to calculate the probability of nucleotides occurring at each position of the matrix. Based on these probabilities for every weight matrix, we have generated a sample of oligonucleotides and applied our algorithm to this sample without using any cut-offs. Then we set the cut-offs to a value that provides recognition of at least 90% of the generated oligonucleotides. We decided to tolerate an error rate of 10%, taking into account that the set of oligonucleotides might contain weak representatives. We call this set of cut-offs minFN cut-offs.
Cut-offs minimising false positive rate (minFP)
We have applied the algorithm described above to the sequences of the second exons (∼6×10⁶ bp) because these sequences are presumed to contain no biologically relevant TF binding sites. For every matrix the lowest cut-off for which no match is found in the set of exon sites is considered to be the minFP cut-off. When a minFP cut-off is applied for searching a DNA sequence being studied, the algorithm will find a relatively low number of matches per nucleotide. In the output the user will only find putative sites with a good similarity to the weight matrix; however, some known genomic binding sites could not be recognised. This kind of cut-off is useful, for example, for searching the most promising potential binding sites in extended genomic DNA sequences. Since the selection of background sequences can influence the cut-off selection we are going to evaluate the use of other genomic sequences of distinct function as control which may give rise to alternative minFP cut-off estimates.
Cut-offs minimising the sum of both errors (minSum)
We compute a sum of both error rates to find cut-offs that give an optimal number of false positives and false negatives. For that, we compute the number of matches found in the exon sequences for each matrix using minFN cut-offs. This number is defined as 100% of false positives. The sum of corresponding percentages for false positives and false negatives is then computed for every cut-off ranging from minFN to minFP. We refer to the cut-off that gives the minimum sum as minSum cut-off.
The algorithm of MatchTM is quite similar to that of MatInspector (5), but with some differences. First of all, the calculation of the mSS score (see Equation 1) is slightly different which makes Match more discriminative when using certain matrices. From the user perspective, the most important difference is the extensive usage of the concept of profiles. This introduces additional flexibility in parametrising the search for any specific need.
IMPLEMENTATION
The algorithm is implemented in C and the program is wrapped by a Perl script to maintain a user friendly web interface (8,9). A public version of the MatchTM tool is available at http://www.gene-regulation.com/pub/programs.html#match. The same program under a different web interface can be found at http://compel.bionet.nsc.ru/Match/Match.html. An advanced version of the tool called MatchTM Professional is available at http://www.biobase.de. It makes use of the whole TRANSFAC Professional matrix library, while the publicly available version of Match has only access to the matrices of the TRANSFAC public version. This public library is comparatively small because it does not contain most of the matrices generated by the TRANSFAC team. MatchTM Professional contains a number of tissue-specific profiles that are not included in the public version. In addition, so called ‘best_selection’ profiles are accessible only with MatchTM Professional. These profiles contain selections of the most reliable matrices and the cut-offs are optimised using well prepared sets of real binding sites from TRANSFAC (in contrast to the default profiles where cut-offs are optimised using an oligonucleotide generation approach, see minFN above). MatchTM Professional provides an additional tool for matrix construction which is not included in the public version of Match. This tool allows users to construct their own matrices from a set of aligned sequences.
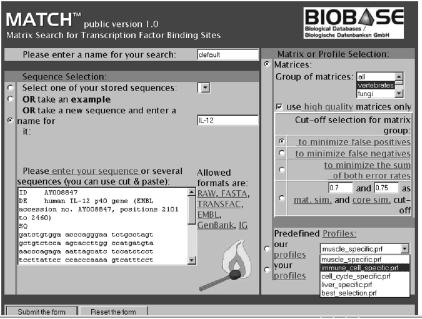
The MatchTM user interface is shown in Figure 1. It has been designed so that the user has all necessary parameters available on one screen. The left panel is used to paste the sequence (or several sequences) and to specify the name of the search. The right panel contains three major sections: matrix selection, cut-off selection and profile selection.
Figure 1.
MatchTM user interface maintained on the web at: http://www.gene-regulation.com/pub/programs.html#match. The left panel is used to paste the sequence (or several sequences) and to specify the name of the search. The right panel contains three major sections: matrix selection, cut-off selection and profile selection.
The matrix selection section provides the possibility to select the taxa (vertebrate, insects, plant, fungi or all). ‘High quality’ selection tag enables to use the high quality matrices only. These are approximately 70% of TRANSFAC® matrices that are characterised by the lowest false positive rate. We have selected these matrices using the following criteria. When using a matrix with a cut-off which allows a false negative rate of 50%, the frequency of matches found in exon2 sequences (false positive rate) must drop below 1 match per 1 kb. The choice of three cut-off sets (minFN, minFP and minSUM) is also provided in the matrix selection section. Alternatively, the user can select some uniform MSS and CSS cut-offs (e.g. 0.7 and 0.75) that will be applied to all matrices.
The profile selection section is the alternative way of defining parameters of the search. A profile is a subset of matrices with defined cut-offs. The user can choose one of the predefined profiles (created by the MatchTM team) or build his/her own profile using the associated web tool called ‘Profiler’. In the ‘Profiler’ the user can flexibly select different matrices from the whole TRANSFAC® matrix library and define cut-offs individually or simultaneously to all matrices in the selection and save the profile under a new name. The user can also modify some of the existing profiles. A number of useful predefined profiles are provided by MatchTM including a small number of best matrices called ‘best selection’ and several tissue-/cell type-specific (liver, muscle, immune-cells) or process specific (cell cycle) profiles. To build such profiles groups of transcription factors known to be active in a particular tissue or a process have been collected for each profile with the help of information from the TRANSFAC® database. Matrices linked to these transcription factors in TRANSFAC® were then retrieved. When more than one matrix was linked to a transcription factor, we chose the matrix that had the lowest false positive rate.
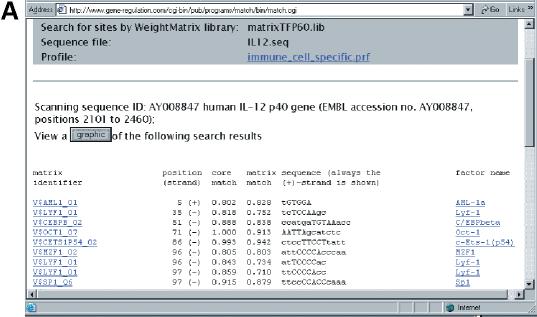
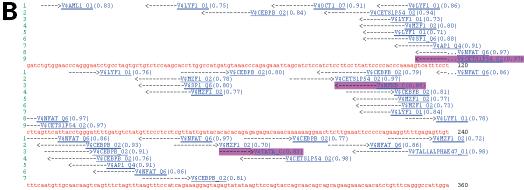
After submitting the form to the server, the MatchTM program makes the search of the TF binding sites according to the given parameters. The output of the MatchTM program is shown in Figure 2. Every match found by the program is shown in a separate line in the results table. It contains: matrix ID, position of the match, strand [(+) or (−), that indicate the matrix orientation in the match], two scores of the match, corresponding subsequence and names of transcription factors associated with the matrix. It must be mentioned that the position of the match is always given according to the (+) strand of the sequence. A simple visual representation of locations of the found matches is generated after pressing the ‘graphic’ button (Fig. 2B). Sites are shown above the sequence and the orientation of the ‘>’ sign corresponds to the (+) or (−) location of the sites. The name of the matrix is given as well. In Figure 2 we show the results of a MatchTM search in the promoter of the human gene for IL-12 using the predefined immune cell-specific profile. Three sites that are known in this promoter (see TRANSFAC® database) were found by MatchTM (shadowed in Fig. 2) along with a number of new sites. The relatively low number of known sites among numerous predicted sites can be explained first of all by the very limited knowledge obtained so far about real functional sites in genomes. Taking into account the whole complexity of regulatory functions maintained by promoters of genes that have to be encoded in their structure by a system of TF site combinations (10), we can speculate that many more TF sites will be revealed experimentally in the near future. All predictions obtained by MatchTM search can be considered as a source of well supported hypotheses for further experimental verification.
Figure 2.
MatchTM output. (A) Tabulated result page. Every match contains: matrix ID, position of the match, strand [(+) or (−)], two scores of the match, corresponding subsequence and names of transcription factors associated with the matrix. Both the matrix ID and the factor names are hyperlinked with the corresponding TRANSFAC® entries. (B) A simple visual representation of locations of the found matches. Sites are shown above the sequence and the orientation of the ‘>’ sign corresponds to the (+) or (−) location of the sites. The results of MatchTM search is shown for the promoter of human gene for IL-12 using immune cell specific profile. Three sites that are known in this promoter (see TRANSFAC® database) were found by MatchTM (shadowed in pink) along with some new sites. Here, matrix IDs are also hyperlinked with the corresponding TRANSFAC® entries.
Acknowledgments
ACKNOWLEDGEMENTS
This work was mainly funded by BIOBASE GmbH (Wolfenbüttel, Germany). Part of this work was supported by Siberian Branch of Russian Academy of Sciences and by a grant of the European Commission (BIO4-95-0226).
REFERENCES
- 1.Wingender E., Chen,X., Fricke,E., Geffers,R., Hehl,R., Liebich,I., Krull,M., Matys,V., Michael,H., Ohnhaeuser,R. et al. (2001) The TRANSFAC system on gene expression regulation. Nucleic Acids Res., 29, 281–283. [DOI] [PMC free article] [PubMed] [Google Scholar]
- 2.Prestridge D.S. (1996) SIGNAL SCAN 4.0: additional databases and sequence formats. Comput. Appl. Biosci., 12, 157–160. [DOI] [PubMed] [Google Scholar]
- 3.Chen Q.K., Hertz,G.Z. and Stormo,G.D. (1995) MATRIX SEARCH 1.0: a computer program that scans DNA sequences for transcriptional elements using a database of weight matrices. Comput. Appl. Biosci., 11, 563–566. [DOI] [PubMed] [Google Scholar]
- 4.Stoeckert C.J. Jr, Salas,F., Brunk,B. and Overton,G.C. (1999) EpoDB: a prototype database for the analysis of genes expressed during vertebrate erythropoiesis. Nucleic Acids Res., 27, 200–203. [DOI] [PMC free article] [PubMed] [Google Scholar]
- 5.Quandt K., Frech,K., Karas,H., Wingender,E. and Werner,T. (1995) MatInd and MatInspector: new fast and versatile tools for detection of consensus matches in nucleotide sequence data. Nucleic Acids Res., 23, 4878–4884. [DOI] [PMC free article] [PubMed] [Google Scholar]
- 6.Kel A., Kel-Margoulis,O., Babenko,V. and Wingender,E. (1999) Recognition of NFATp/AP-1 composite elements within genes induced upon the activation of immune cells. J. Mol. Biol., 288, 353–376. [DOI] [PubMed] [Google Scholar]
- 7.Pickert L., Reuter,I., Klawonn,F. and Wingender,E. (1998) Transcription regulatory region analysis using signal detection and fuzzy clustering. Bioinformatics, 14, 244–251. [DOI] [PubMed] [Google Scholar]
- 8.Kel A.E., Kondrakhin,Y.V., Kolpakov,Ph.A., Kel,O.V., Romashenko,A.G., Wingender,E., Milanesi,L. and Kolchanov,N.A. (1995) Computer tool FUNSITE for analysis of eukaryotic regulatory genomic sequences. Proc. Int. Conf. Intell. Syst. Mol. Biol., 3, 197–205. [PubMed] [Google Scholar]
- 9.Gößling E., Kel-Margoulis,O.V., Kel,A.E. and Wingender,E. (2001) MATCHTM—a tool for searching transcription factor binding sites in DNA sequences. Application for the analysis of human chromosomes. Proceedings of the German Conference on Bioinformatics GCB'01. Braunschweig, Germany, October 7–10, pp. 158–161. [Google Scholar]
- 10.Fessele S., Maier,H., Zischek,C., Nelson,P.J. and Werner,T. (2002) Regulatory context is a crucial part of gene function. Trends Genet., 18, 60–63. [DOI] [PubMed] [Google Scholar]


