A hypomorphic R229Q Rag2 mouse mutant recapitulates human Omenn syndrome (original) (raw)
Abstract
Rag enzymes are the main players in V(D)J recombination, the process responsible for rearrangement of TCR and Ig genes. Hypomorphic Rag mutations in humans, which maintain partial V(D)J activity, cause a peculiar SCID associated with autoimmune-like manifestations, Omenn syndrome (OS). Although a deficient ability to sustain thymopoiesis and to produce a diverse T and B cell repertoire explains the increased susceptibility to severe infections, the molecular and cellular mechanisms underlying the spectrum of clinical and immunological features of OS remain poorly defined. In order to better define the molecular and cellular pathophysiology of OS, we generated a knockin murine model carrying the Rag2 R229Q mutation previously described in several patients with OS and leaky forms of SCID. These _Rag2_R229Q/R229Q mice showed oligoclonal T cells, absence of circulating B cells, and peripheral eosinophilia. In addition, activated T cells infiltrated gut and skin, causing diarrhea, alopecia, and, in some cases, severe erythrodermia. These findings were associated with reduced thymic expression of Aire and markedly reduced numbers of naturally occurring Tregs and NKT lymphocytes. In conclusion, _Rag2_R229Q/R229Q mice mimicked most symptoms of human OS; our findings support the notion that impaired immune tolerance and defective immune regulation are involved in the pathophysiology of OS.
Introduction
Omenn syndrome (OS) is a peculiar immunodeficiency in which a defect in immune response against pathogens coexists with signs of autoimmunity (1, 2). Clinically described for the first time in 1965 (3), OS has been characterized at the clinical level as a SCID with erythrodermia, hepatosplenomegaly, failure to thrive, susceptibility to infections, diarrhea, and a fatal outcome, unless treated with bone marrow transplantation (3–6). At the laboratory level, patients manifest eosinophilia and elevated IgE despite the absence of B cells, while T cell numbers are often normal or elevated. Although these T cells are oligoclonal, show a limited TCR repertoire, and express activation markers, they are not functional, thus justifying the combined nature of the immunodeficiency (7, 8). Mutations in either Rag1 or Rag2 are found in most, but not all, OS patients. Interestingly, these mutated proteins seem to maintain partial activity, as they are able to direct some recombination events that give rise to oligoclonal T cell populations, which could be responsible for peculiar manifestations of OS. Indeed, OS patients show an autoimmune phenotype that is not present in SCID patients carrying null Rag mutations (9). Although the presence of partial recombination activity is a prerequisite for OS due to Rag defects, it is likely that environmental factors such as exposure to specific pathogens could trigger the autoimmune response, since coexistence of SCID and OS in the same family has been described previously (10, 11). In particular, patients with typical OS-type Rag mutations who received bone marrow transplants very early did not manifest OS features, while their siblings who were diagnosed later did. More recently, other genes involved in OS have been described (12, 13), including a very rare Artemis mutation (14); this finding is also compatible with the same pathogenesis, since residual Artemis activity could allow a limited number of recombination events. Although the demonstration that the basic biochemical defect of OS lies in the process of recombination, this finding leaves several open questions. In particular, it is unclear whether selection of gene segments in V-to-J recombination is skewed in OS and whether V regions are selected for rearrangement based on their locations along the chromosome or on perfect matching of their recombination signal sequences. Furthermore, it is unknown whether secondary V(D)J rearrangements occur in OS. In addition, the mechanisms accounting for target tissue infiltration by activated lymphocytes are also largely unknown. Specifically, it is unclear whether defects in negative selection in the thymus or in generation and/or function of Tregs may play a role in the pathophysiology of peripheral tissue damage. Finally, the origin of elevated serum IgE remains to be defined, considering that IgE production requires normal V(D)J recombination and class switch, while few B cells are usually detected in OS patients.
Addressing these and other similar questions is challenging in humans, in which collection of samples is limited for ethical reasons. The availability of an animal model recapitulating the pathogenesis of OS would be important for understanding the cellular mechanism of this disease and might also provide useful insights into the pathophysiology of autoimmunity in general. Therefore, through recombination in ES cells, we generated a knockin mouse bearing a mutation in the Rag2 gene, which has previously been shown to be associated with OS in several patients (10, 11, 15). This mouse showed a heritable phenotype very close to that of human OS, including development of oligoclonal and activated T cells that infiltrate target tissues causing gut and skin abnormalities.
Results
Generation of the Rag2R229Q/R229Q model.
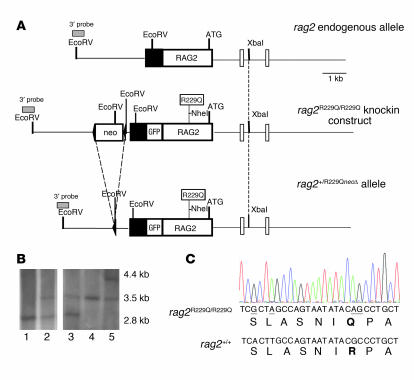
A targeting construct bearing a Rag2/enhanced GFP (Rag2/EGFP) fused gene carrying the R229Q mutation and a novel NheI site was engineered to use for homologous recombination in ES cells (see Figure 1A and Methods). EGFP was introduced as gene reporter to follow the proper expression of Rag2 during T and B cell differentiation. This construct included about 3 kb of homology both upstream and downstream of the coding region containing the introduced mutation, and a neomycin resistance gene (PGK-neor) flanked by loxP sites was cloned downstream of the untranslated region (UTR) in the 3′ homology region.
Figure 1. Generation of _Rag2_R229Q/R229Q ES cells and mice.
(A) A targeting vector was designed to replace endogenous Rag2 with the gene carrying the R229Q substitution and an NheI restriction site. GFP was fused in frame with the Rag2 neo cassette flanked by loxP sites (arrows), which was cloned downstream of the Rag2 UTR (black box). Gray boxes denote the 3′ probe used for genomic screening. (B) Southern blot analysis using the 3′ probe on EcoRV-digested genomic DNAs. Lane 1, 129Sv wild-type ES cells; lane 2, Rag2+/R229Q_neo_Δ recombinant ES cells; lane 3, heterozygous Rag2+/R229Q_neo_Δ mouse after neo excision due to Cre cross; lane 4, 129Sv Rag2+/+ mouse; lane 5, Rag2+/R229Q_neo_Δ mouse. (C) Chromatogram showing nucleotide substitutions, denoted by underline: the first 2 changes obtained the NheI restriction site, the last 2 caused the R to Q amino acid change (bold).
Targeted replacement of Rag2 with the _Rag2_-R229Q/GFP vector was performed in 129Sv ES cells. PCR and Southern blot screening revealed that 1 ES cell clone underwent the expected homologous recombination event (Figure 1B). Chimeric mice derived from ES cell clones were crossed with wild-type mice, and the heterozygous progeny was crossed with CMV-_Cre_–expressing mice in order to eliminate the neo cassette and thus obtain the founder knockin Rag2+/R229Q_neo_Δ mice. We confirmed the excision of neo by Southern blot analysis (Figure 1B). These mice were crossed to produce the homozygous _Rag2_R229Q/R229Q mice used in this study, which were screened by direct sequencing (Figure 1C). Heterozygous mice did not show any immunological defects or growth impairment (data not shown).
Analysis of the progeny obtained after breeding heterozygous Rag2+/R229Q mice showed that Rag2+/R229Q and _Rag2_R229Q/R229Q mice were viable and generated according to Mendelian inheritance. Homozygous _Rag2_R229Q/R229Q mice were fertile and were used to produce further generations, with an equal representation of male and female progeny.
Phenotypic analysis of _Rag2_R229Q/R229Q mice showed normal appearance at birth. However, at 8–10 weeks of age, 60% of the homozygous mutant mice developed substantial dorsal and facial hair loss. In addition, after an initial period of normal growth, a minority (4% of all _Rag2_R229Q/R229Q mice) started to develop severe alopecia, skin erythrodermia, and wasting syndrome due to colitis (Figure 2A).
Figure 2. Histological analysis of _Rag2_R229Q/R229Q mice.
(A) Phenotypic aspect of a 3-month-old _Rag2_R229Q/R229Q mouse, showing severe alopecia and skin erythrodermia. (B) Skin biopsy revealed marked dermal inflammation (top) composed of CD3+ lymphocytes (bottom left) and containing numerous eosinophils (bottom right). Original magnification, ×10 (top); ×20 (bottom). (C) Similarly, the gut showed dense inflammatory infiltration (left), mainly composed of CD3+ cells (right). Original magnification, ×20. (D and E) Comparison between thymic tissue from age-matched 6-week-old Rag2+/+ and _Rag2_R229Q/R229Q mice: the normal corticomedullary differentiation observed in Rag2+/+ thymus (D), as highlighted by the anti–cytokeratin 5 immunostaining (D, inset), was absent in the _Rag2_R229Q/R229Q mouse (E and inset). Original magnification, ×4 (D and E). (F) B220 immunostaining showed B follicles (b) and paracortical areas (p) in Rag2+/+ mice (left) in contrast to the abnormal architecture and severe depletion of B cells observed in _Rag2_R229Q/R229Q mice (right). Original magnification, ×4. (G) Nodal parenchyma from the _Rag2_R229Q/R229Q (left) shows admixture of histiocytes, large activated lymphoid cells (arrow), and eosinophils (arrowhead); most lymphoid cells were CD3+ lymphocytes (top right) that expressed the activation antigen CD30 (bottom right). Original magnification, ×20 (left); ×40 (right).
Histological analysis of _Rag2_R229Q/R229Q mice revealed marked infiltration by T lymphocytes and eosinophils in the skin and gut (Figure 2, B and C) that contrasted with the overall lymphoid depletion observed in the thymus, lymph nodes, and spleen. Similar to what we observed in _Rag2_–/– mice, immunostaining for cytokeratin 5, which detects medullary epithelium, revealed a diffuse network throughout thymic parenchyma with loss of corticomedullary differentiation in the thymi of _Rag2_R229Q/R229Q mice (Figure 2, D and E). Furthermore, unlike the thymic medullary region in Rag2+/+ mice, the thymi in _Rag2_R229Q/R229Q mice were defective in forming Hassall corpuscle–like clusters (data not shown) (16). Abnormal architecture was also observed in lymph nodes, which revealed severe B cell depletion as well as a lack of B follicles (Figure 2F) and were composed of a diffuse population of pale histiocytes and dendritic cells admixed with T cells and eosinophils (Figure 2G). Moreover, scattered activated CD3+ and CD30+ immunoblasts were found in these areas (Figure 2G, right panels). Spleens from _Rag2_R229Q/R229Q mice showed similar morphological alterations, with severe depletion of the white pulp and particularly of B cells (data not shown). No Peyer patches were recognized in the gut. These pathological changes were consistently detected in all _Rag2_R229Q/R229Q mice at 6–8 weeks of age, regardless of the severity of clinical manifestations; however, the T cell infiltration and peripheral eosinophilia were more severe in mice that developed erythrodermia and wasting syndrome.
T cell differentiation in Rag2R229Q/R229Q mice.
Analysis of _Rag2-_R229Q/GFP expression in thymocyte subsets revealed developmental regulation characteristic of Rag2 (17, 18) (Supplemental Figure 1; supplemental material available online with this article; doi:10.1172/JCI30928DS1).
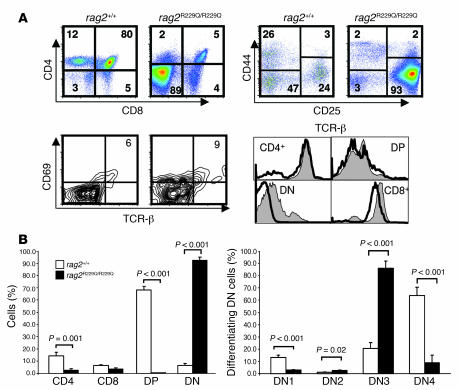
Cell recovery from _Rag2_R229Q/R229Q thymi was analogous to that of _Rag2_–/– thymi and markedly reduced compared with that of Rag2+/+ thymi (Supplemental Figure 2). Staining with CD4 and CD8 antibodies revealed a dramatic depletion of the CD4+CD8+ double-positive (DP) compartment, with relative enrichment of the CD4–CD8– double-negative (DN) subset, the predominant subset (Figure 3A).
Figure 3. Impaired T cell development and aberrant peripheral T cell activation in _Rag2_R229Q/R229Q mice.
(A) Top left: Fluorescence-activated cell sorting analysis of thymocytes from the indicated mice stained with CD4 and CD8 antibodies. Top right: CD4–CD8– cells were gated and analyzed for CD44 and CD25 expression. Bottom left: TCR-β and CD69 expression in electronically gated CD4+8+ cells. The percentage of TCR-βbrightCD69+ cells is indicated. Bottom right: Overlay of TCR-β surface expression in the indicated thymocyte subsets (gray histograms, Rag2+/+; open histograms, _Rag2_R229Q/R229Q). (B) Left: Percentage of cells during different T cell differentiation stages in the thymus. Right: Percentage of differentiating DN cells. Results are the mean and SD of 5 _Rag_2+/+ and 10 _Rag2_R229Q/R229Q mice. P values were determined by unpaired Student’s t test.
Developmental progression of DN cells is characterized by an ordered sequence of phenotypes defined by CD44 and CD25 expression: CD44+CD25– (DN1) to CD44+CD25+ (DN2), CD44–CD25+ (DN3), and CD44–CD25– (DN4). The DN3 to DN4 transition is predominantly controlled by productive rearrangement of the TCR-β locus and expression of the pre-TCR in the plasma membrane. Analysis of DN cells from _Rag2_R229Q/R229Q thymi with CD25 and CD44 antibodies revealed an almost complete arrest of thymocyte development at the DN3 stage, a hallmark of recombinase-deficient mice (Figure 3, A and B) (19). Nevertheless, a few DP cells were recovered and displayed progressive upregulation of TCR-α/β with concomitant expression of CD69, a feature of ongoing positive selection. CD4+ as well as CD8+ single-positive (SP) cells expressed high levels of TCR-α/β, which suggests that minute amounts of thymocytes were positively selected and accumulated as SP cells (Figure 3A). Moreover, γδ T cells were not detected (data not shown).
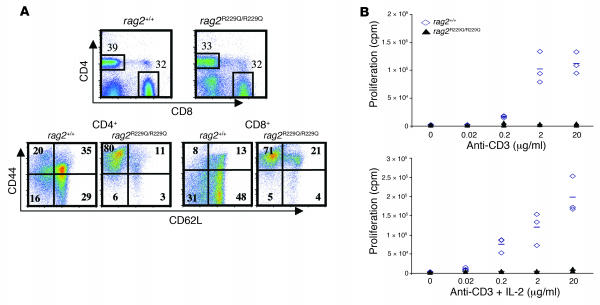
Next, we examined the T cell compartment in secondary lymphoid organs. The spleen and the mesenteric, inguinal, and cervical lymph nodes were severely reduced in size and dysmorphic, the absolute numbers of CD4 and CD8 lymphocytes and percentage of NKT cells were dramatically reduced (Supplemental Figure 2), and γδ T cells were absent. Flow cytometry analysis of lymph nodes showed a distribution of CD4+ and CD8+ T cells analogous to that of Rag2+/+ animals (Figure 4A); however, the vast majority (~80%) of cells in both subsets displayed an effector/memory-like CD44+CD62Llow phenotype (Figure 4A). Similar observations were made in the spleen (data not shown).
Figure 4. Peripheral T cells and T cell proliferation.
(A) Top: Fluorescence-activated cell sorting analysis of lymph node cells stained with CD4 and CD8 antibodies. Bottom: CD4+ and CD8+ cells from the indicated mice were analyzed for CD44 and CD62L distribution. (B) Proliferation of Rag2+/+ and _Rag2_R229Q/R229Q CD90+ cells isolated from splenocytes, plated at 2 × 10⁵ cells per well, and stimulated as indicated. Proliferation was assessed by 3H-thymidine incorporation in triplicate wells. Plotted values are cpm for each individual mouse. Bars represent the median for each group.
To assess the functional activity of peripheral T cells in _Rag2_R229Q/R229Q mice, CD90+ cells were positively selected from total splenocytes and stimulated in vitro with increasing doses of anti-CD3 mAb. Proliferative responses were absent or markedly decreased in _Rag2_R229Q/R229Q mice, and neither costimulation with CD28 (data not shown) or addition of IL-2 to the medium rescued T cell proliferation (Figure 4B). However, T cells stimulated with phorbol 12-myristate 13-acetate/iomomycin (PMA/iomomycin) showed increased intracellular production of IL-2, IFN-γ, and TNF-α in both CD4 and CD8 subsets (Supplemental Figure 3).
We analyzed T cell repertoire by investigating TCRVβ use among thymocytes and splenocytes obtained from 2 and 4 _Rag2_R229Q/R229Q mice, respectively, and the results were compared with those in Rag2+/+ mice. Figure 5A shows that in _Rag2_R229Q/R229Q mice, use of some TCRVβ family members increased in frequency within total T cells compared with that of Rag2+/+ mice, both in the thymus and in the spleen. Interestingly, while use of some TCRVβ family members, such as TCRVβ3, expanded both in the spleen and in the thymus, other members showed a different distribution in the 2 organs. The immunoscope profiles in Figure 5B demonstrate the diversity of the TCR by showing the distribution of TCR third complementarity-determining region (CDR3) length for each TCRVβ-TCRCβ rearrangement. While the Rag2+/+ mice showed a typical polyclonal distribution of CDR3 length, _Rag2_R229Q/R229Q mice presented oligoclonal patterns for most of the TCRVβ family members.
Figure 5. Immunoscope analysis of TCR repertoire.
(A) Quantitative TCRVβ repertoire determined by real-time PCR analysis on T cells from the 2 thymi and 4 spleens from _Rag2_R229Q/R229Q mice (designated as 1–4) and from 2 representative Rag2+/+ mice (designated as 1 and 2). (B) Representative immunoscope profiles of TCRVβ analysis in the thymi and spleens of the mice as in A. The x axes represent CDR3 length, and y axes represent arbitrary fluorescence intensity of the runoff products.
B cell differentiation in Rag2R229Q/R229Q mice.
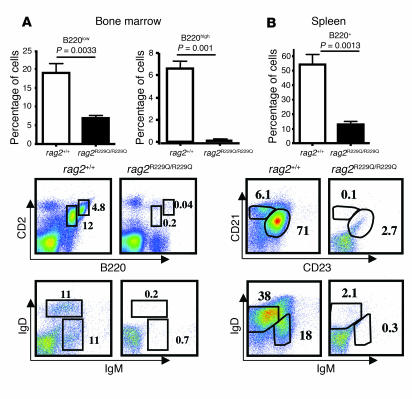
Most patients with OS show absence or severely reduced numbers of circulating B cells and profound hypogammaglobulinemia in spite of high levels of IgE. In _Rag2_R229Q/R229Q mice, the number of B220+ cells was severely reduced in both bone marrow and spleen (Figure 6, A and B), suggesting that B cell development was impaired. In the bone marrow, productive rearrangement of the IgM heavy chain locus and expression of the membrane-bound pre–B cell receptor determines the developmental transition of B cell progenitors from the pro–B cell stage to the pre–B cell stage. We analyzed pro–B cell to pre–B cell transition by staining bone marrow cells with B220 and CD2 antibodies. As shown in Figure 6A, we observed a complete absence of B220lowCD2+ pre–B cells and B220highCD2+ cells that comprised immature and mature recirculating B cells, as was observed in _Rag2_–/– mice (20). Transitional B cells migrate to the spleen through the bloodstream and start to express membrane-bound IgD. IgM and IgD staining can distinguish transitional and mature recirculating B cells. In the bone marrow of _Rag2_R229Q/R229Q mice, both these cell subsets were undetectable (Figure 6A). In the spleens of _Rag2_R229Q/R229Q mice, few mature follicular IgM+IgD+ B cells were detected, and transitional B cells were undetectable. Further staining of splenocytes for the complement receptor CD21 and the low-affinity receptor for IgE, CD23, revealed few CD21+CD23+ mature follicular B cells and a lack of CD21+CD23– marginal zone B cells (21), showing that B cell development was severely compromised in _Rag2_R229Q/R229Q mice (Figure 6B).
Figure 6. Impaired B cell development in _Rag2_R229Q/R229Q mice.
(A) Top: Relative representation and SD of B220low and B220high cells in the bone marrow of the indicated mice (n = 6). Bottom: Dot-plot analysis of bone marrow cells from the indicated mice labeled with B220 and CD2 antibodies and IgD and IgM expression of electronically gated B220+ bone marrow cells. (B) Top: Relative representation and SD of B220+ cells in the spleens of the indicated mice (n = 6). Bottom: Dot-plot analysis of B220+ splenocytes labeled with CD21 and CD23 antibodies or IgD and IgM antibodies. P values were determined by unpaired Student’s t test. Numbers indicate the percentage of cells in the indicated gates.
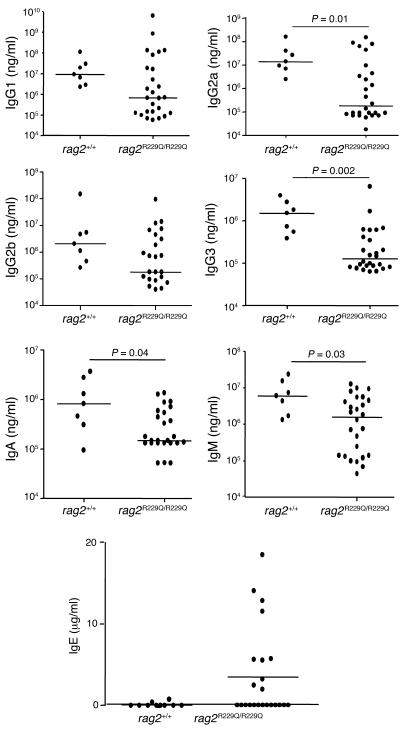
Along with the severe defect in B cell differentiation, _Rag2_R229Q/R229Q mice showed hypogammaglobulinemia, with reduced levels of all IgG subclasses as well as of IgA and IgM. Although mean IgE serum levels were comparable to those of wild-type mice, some _Rag2_R229Q/R229Q mice had markedly increased IgE (Figure 7), which correlated with more pronounced phenotypic manifestations. Despite the presence of low but detectable Ig levels, _Rag2_R229Q/R229Q mice challenged with OVA were unable to produce OVA-specific antibodies (data not shown).
Figure 7. Serum concentration of Igs.
Sera from Rag2+/+ and _Rag2_R229Q/R229Q mice were collected and their IgG1, IgG2, IgG3, IgA, and IgM were evaluated by Bioplex analysis, while ELISA assay was performed to measure IgE production. Bars represent the median for each group. P values were determined by Mann-Whitney test.
Central and peripheral tolerance in Rag2R229Q/R229Q mice.
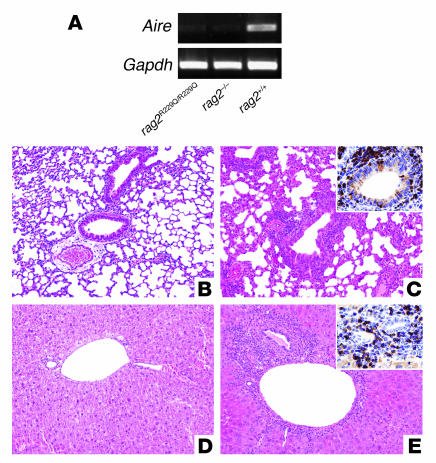
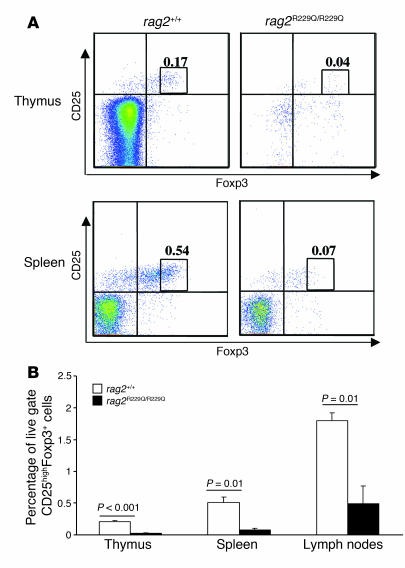
The appropriate development of the thymic epithelial component is particularly relevant for T cell homeostasis because medullary epithelium expresses tissue-specific self antigens under the control of the transcription factor autoimmune regulator (AIRE). _Rag2_R229Q/R229Q mice displayed atrophic thymi, which were macroscopically indistinguishable from those of Rag–/– mice, and did not reveal a medullary compartment in histochemical study. Analysis of Aire expression in _Rag2_R229Q/R229Q thymi revealed low levels of Aire mRNA, as observed in _Rag2_–/– mice, which are devoid of the medullary component of the organ (Figure 8A). In keeping with a possible defect in central tolerance related to reduced Aire expression, abnormal and severe lymphocyte infiltration in lungs and livers was observed in _Rag2_R229Q/R229Q mice (Figure 8, B–E). Finally, we evaluated the presence of naturally occurring Tregs (nTregs; defined here as CD25highFoxp3+) in our murine model. This subset has been shown to be crucial to prevent autoimmune manifestations (22). In order to determine whether nTregs could be reduced in _Rag2_R229Q/R229Q mice, Foxp3 expression was analyzed in thymus, spleen, and lymph nodes. The number of nTregs in all tissues examined was significantly decreased in _Rag2_R229Q/R229Q mice compared with Rag2+/+ mice (Figure 9).
Figure 8. AIRE expression analysis and cellular infiltration in target organs.
(A) Amplification of Aire cDNAs obtained from Rag2+/+, Rag2 R229Q/R229Q, and _Rag2_–/– thymic mRNAs. As an internal control, Gapdh was used. (B–E) Inflammatory infiltration in the lungs and livers of Rag2+/+ and _Rag2_R229Q/R229Q mice. Compared with the Rag2+/+ mouse (B), histological analysis of a representative 4-month-old _Rag2_R229Q/R229Q mouse revealed dense peribronchiolar and perivascular inflammatory infiltration in the lung (C) composed mainly of CD3+ lymphocytes (C, inset). Similarly, in contrast to the control mouse (D), dense inflammatory infiltration composed of CD3+ T cells was found in liver portal tracts (E and inset). Original magnification, ×10 (B–E); ×40 (insets).
Figure 9. Analysis of nTregs in _Rag2_R229Q/R229Q mice.
(A) Fluorescence-activated cell sorting analysis of thymus and spleen cells stained with CD25 and Foxp3 antibodies electronically gated on CD4+ cells. Numbers indicate the percentages of total live cells. (B) Histograms show percentage of CD25highFoxp3+ cells in thymi, spleens, and lymph nodes of Rag2+/+ and _Rag2_R229Q/R229Q mice. P values were determined by unpaired Student’s t test.
Discussion
Hypomorphic mutations in Rag1 and Rag2 genes in humans have been associated with a spectrum of clinical and immunological manifestations that range from typical and severe T–B– SCID to leaky SCID (with residual production of T cells and occasionally B cells) to OS, a disorder characterized by the presence of autologous, activated T cells that infiltrate target organs (3). The reasons underlying this variable phenotype are unclear. Along with the primary genetic defect, both genetic background and environmental factors have been postulated to play a role in the pathophysiology of the disease (23, 24). In addition, defective thymopoiesis has been shown to impair Aire expression in the thymic medulla, thus disturbing negative selection of autoreactive T cells that may escape to the periphery and damage target organs (25). In agreement with these observations, a variety of genetic defects that affect early T cell development have been recently shown to cause OS in humans (12–14). In order to develop a model that recapitulates OS and could therefore be used to better dissect the mechanisms behind the various phenotypic manifestations of the disease, we have developed a homozygous Rag2 knockin mouse carrying the R229Q mutation. We chose to investigate the effects of this mutation, as it was originally described in a patient with leaky SCID (15), and we and others subsequently found this amino acid change in several patients with OS and in infants with leaky SCID (10, 11). In this regard, the R229Q mutation offers a unique setting in which to evaluate the contributory roles of genetic background and environmental factors in determining the phenotype. Biochemical investigation of this mutant form of Rag2 has previously been shown to reduce V(D)J recombination activity by over 150-fold (10, 15).
We found that introduction of the Rag2 R229Q mutation did not affect viability and fertility in mice, but severely impaired T and B cell development and recapitulated most of the leaky features of OS. In particular, thymocyte development was predominantly arrested at the DN3 stage, during which expression of RAG is required to proceed along the differentiation pathway.
The few SP thymocytes generated in _Rag2_R229Q/R229Q mice expressed TCR-α/β at the cell surface and were exported to the periphery, where they infiltrated target organs. Interestingly, the pattern of T cell infiltration observed in _Rag2_R229Q/R229Q mice mimicked that observed in patients with OS, with preferential localization in the skin and in the gut. Furthermore, the infiltrating T lymphocytes express activation markers and are oligoclonal, suggesting selective peripheral expansion (8). Competition within an appropriate number of clonal specificities upon microbial infection could ensure self tolerance; thus the reduced diversity of the T cell repertoire in _Rag2_R229Q/R229Q mice could favor the expansion of T cell clones with inappropriate reactivity toward self-peptide/MHC complexes and development of immunopathology. In addition, because compensatory peripheral T cell expansion in lymphopenia was previously shown to produce autoimmune disease (26), the reduced thymic output in _Rag2_R229Q/R229Q mice could predispose animals to autoimmunity. A defective expression of tissue-specific self antigens controlled by AIRE contributes to the pathogenesis of autoimmune manifestations (27, 28). _Rag2_R229Q/R229Q mice have atrophic thymi and barely detectable Aire expression, suggesting a defect in negative selection of potentially self-reactive T cells (25, 29). The defective Aire expression might lead to the severe lymphocyte infiltration in target organs observed in the livers, lungs, and skin of affected mice. In _Rag2_R229Q/R229Q mice, few DP cells were detected and TCR-β chains were undetectable by intracellular staining in DN cells (data not shown), implying severe impairment of pre-TCR expression and signaling. Because signaling by the pre-TCR could influence thymic epithelium development (30), we speculate that inefficient TCR rearrangement and reduced pre-TCR signaling in _Rag2_R229Q/R229Q mice would result in impaired medullary expansion and Aire expression. We have also found that the number of nTregs was dramatically reduced in the thymi and peripheral tissues of the _Rag2_R229Q/R229Q mice, suggesting that impaired peripheral tolerance may also contribute to the development of autoimmunity in our murine model.
In contrast to the leakiness observed in the T cell compartment, B cell differentiation was more heavily affected in _Rag2_R229Q/R229Q mice, with a predominant block at the pro–B cell stage and a dearth of mature B lymphocytes both in the bone marrow and in the periphery. These findings largely overlap those reported in patients with OS (31).
The observation that the leakiness of the immunological phenotype of _Rag2_R229Q/R229Q mice was more apparent in T than in B lymphocytes, while consistent with observations in patients with OS, may reflect stronger pressure for peripheral expansion within the T lymphocyte lineage.
A remarkable finding of the present study was the variability of the phenotypic manifestations observed in _Rag2_R229Q/R229Q mice, with 60% of mice developing skin and hair abnormalities and 4% developing severe erythrodermia and weight loss. This variability mimicked that observed in humans and may be due to different factors, including variability in the genetic background.
The analysis of intracellular cytokine production after stimulation with PMA/ionomycin revealed increased production of IL-2, IFN-γ, and TNF-α, indicating Th1 profile production. These findings are in contrast with observations in OS patients. We speculate that environmental factors and antigen overload could play a role in the induction of increased IL-4 production and thereby favor IgE synthesis in patients with OS. Moreover, genetic background has been shown to influence Th1/Th2 balance and IgE serum levels (32). The _Rag2_R229Q/R229Q mice generated in our laboratory carried the hypomorphic Rag2 mutation on a mixed Sv129 × C57BL/6 genetic background. In addition, these mice were kept under specific pathogen–free conditions. Therefore, we cannot exclude a possible effect of antigen encounter on the complexity of phenotypic manifestations. Future experiments with pathogen exposure and antigen challenge will help clarify this issue. The hypothesis that infiltration of target organs by oligoclonal T cells in patients with OS could be a result of defective negative selection of autoreactive T cell clones can now be explored by crossing _Rag2_R229Q/R229Q mice with TCR transgenic mice, followed by exposure to the specific antigen.
In summary, we have shown that introduction of a homozygous Rag2 R229Q mutation in mice caused disturbed lymphoid development and phenotypic changes that largely recapitulated the spectrum of clinical manifestations associated with hypomorphic RAG mutations seen in humans with OS. Therefore, we propose this mouse model may be a useful tool to gain further insight into the pathophysiology of this complex syndrome.
Methods
Construction of Rag2-R229Q/GFP targeting vector.
QuikChange XL Site-Directed mutagenesis kit (Stratagene) was used to introduce nucleotide changes in the SalI/AseI Rag2 fragment containing the coding region (GenBank accession number AC084753). The first nucleotide exchange was GC→AG at position 841–842, which led to the R229Q amino acid change. In addition, in order to perform an easier identification of the targeted ES clones, we introduced 2 silent mutations at positions 823 (A→G) and 826 (T→A), creating a new NheI site. The mutated SalI/AseI fragment was subsequently cloned into the SacI site of the Clontech pEGFP-N1 vector and sequenced in order to verify that the RAG2 GFP fusion gene was in frame (pRAG2-EGFP-N1 construct). This step was performed according to the strategy previously described by Monroe et al. (18). A 750-bp AseI/KpnI fragment containing the 3′ UTR of Rag2 was cloned into the NotI site of the pRAG2-EGFP-N1 construct (pRAG-EGFP-UTR-N1 construct). The Rag2 coding region fused to GFP was subsequently cloned into a pPNT vector containing a floxed neo cassette. Finally, a 5′ homology fragment of 3.0 kb (ClaI/SalI) was cloned upstream the mutated _Rag2_-GFP segment, while a 2.2-kb ClaI/BamHI 3′ homology fragment was inserted downstream of the neo cassette.
Generation of Rag2R229Q/R229Q mice.
Animal experiments protocol has been approved by the Ministry of Health and Local authorities (Institutional Animal Care and Use Committee 5/2005, Milan, Italy). The Rag2 targeting vector was transfected into 129Sv ES cells according to standard electroporation procedures using 40 μg of linearized NotI plasmid, and ES clones were selected by G418/gancyclovir resistance. Targeted ES clones were screened by PCR, using a 5′ primer located upstream of the targeting vector insertion site and a 3′ primer downstream of the NheI site, and subsequently sequenced to verify the presence of nucleotide changes. Positive clones were further confirmed by Southern blot analysis using a probe located in the 3′ region (a 520-bp BamHI/EcoRV fragment) on EcoRV-digested genomic DNA. Targeted ES clones were injected in blastocysts, the resulting chimeras were bred with C57BL/6 mice, and heterozygous animals were identified with the same approach used to identify ES clones. These mice were crossed to CMV-Cre transgenic mice in order to achieve neo cassette excision. Southern blot analysis performed on EcoRV-digested genomic DNA using the previously described probe revealed neo cassette excision: the heterozygous floxed mice showed a wild-type band together with a slightly shorter band as a result of the introduction of an additional (polylinker-derived) EcoRV site during the vector construction. We intercrossed Rag2+/R229Q mice to produce homozygous knockin _Rag2_R229Q/R229Q mice.
Histology.
Mice were sacrificed at different time points after birth, and tissue samples were partially fresh-frozen in cryostat embedding medium (Bio-Optica) and partially fixed in 10% neutral-buffered formalin for both paraffin embedding and cryoprotection in 30% sucrose/PBS before freezing into cryostat embedding medium. Sections from both paraffin and frozen blocks were submitted for histological and immunohistochemical evaluation. H&E staining was used to study basic histopathological features. Frozen sections were air-dried for 18–24 hours, then fixed in acetone and used for immunohistochemistry by an indirect immunoperoxidase technique. The following primary antibodies were applied: rat anti-CD3ε (clone CT-CD3; Valter Occhiena), rat anti-CD4 (clone GK1.5; Southern Biotechnology Associates), rat anti-CD8 (clone CT-CD8a; Valter Occhiena), rat anti-B220 (clone RA3-6B2; Valter Occhiena), and goat anti-CD30 (clone TNFRSF8; R&D Systems). Immunostains on paraffin sections for CD30 and CD3 were performed upon antigen retrieval with microwave treatment in 1.0 mM EDTA buffer, pH 8.0, for 15 minutes. Primary antibodies were applied for 2 hours and followed by 30 minutes’ incubation in buffer containing the biotinylated specific secondary antibodies (Vector Laboratories). Immunolabeling was then performed by incubation for 20 minutes with streptavidin-peroxidase amplification system (BioGenex) and revealed using 3-amino-9-ethylcarbazole (Lab Vision). Slides were counterstained with hematoxylin. Images were acquired with an Olympus DP70 digital camera mounted on an Olympus BX60 microscope, using AnalySIS imaging software (version 3.2; Olympus).
Lymphocyte proliferation and intracellular cytokine staining.
CD90+ T cells were purified from splenocytes of _Rag2_R229Q/R229Q mice using anti-CD90 MACS microbeads (Miltenyi Biotec); resuspended in RPMI 1640 containing 10% heat-inactivated FCS, 2 mM glutamine and penicillin/streptomycin (100 IU/ml), and 10 μM 2-mercaptoethanol; and placed in flat-bottomed 96-well plates in the presence of surface-bound anti–mouse CD3 mAb (0.2, 2, and 20 μg/ml) alone or combined with 100 IU/ml IL-2 (Proleukin [aldesleukin]; Chiron) and 2 μg/ml anti-CD28. After 72 hours, cells were pulsed for 14–16 hours with 0.037 MBq (1 μCi) per well of [3H]-thymidine (Amersham Pharmacia Biotech). Cells were then harvested, and proliferation (in cpm) was measured in a scintillation counter. For intracellular cytokine staining, 1 × 10⁶ cells obtained from lymph nodes were stimulated for 2 hours with 1 mM ionomycin and 10–6 M PMA. After addition of 5 μg/ml brefeldin A for 2 hours, cells were stained with FITC-conjugated CD8 and PerCP-conjugated CD4 antibodies. Cells were fixed in 2% formaldehyde and, after washing in permeabilization buffer (PBS containing 2% FCS and 0.5% saponin), were stained with allophycocyanin-conjugated (APC-conjugated) anti–IFN-γ, PE-conjugated anti–IL-4, APC-conjugated anti–TNF-α, and APC-conjugated anti–IL-2 antibodies.
Fluorescence-activated cell sorting analysis and antibodies.
Single cell suspensions from thymi, bone marrow, spleens, and lymph nodes were prepared and stained with specific fluorescent-conjugated antibodies. Thymocytes were incubated with the following antibodies: APC- or PerCP-conjugated anti-CD4, PE- or CyChrome-conjugated anti-CD8, FITC-conjugated anti-CD44, PE-conjugated anti-CD25, FITC-conjugated anti-CD69, PE-conjugated anti–TCR-γ, and FITC-conjugated anti–TCR-β. Bone marrow, spleen, and lymph node cells were stained with PE-conjugated anti-B220, biotin-conjugated anti-CD43, PE-conjugated anti-IgM, FITC-conjugated anti-IgD, FITC-conjugated anti-CD21, and PE-conjugated anti-CD23. Samples stained with byotin-conjugated antibodies underwent an additional incubation with CyChrome-conjugated streptavidin. PE-conjugated anti–CD1d tetramer antibodies were kindly provided by C. Terhorst (Harvard Medical School, Boston, Massachusetts, USA). The staining with anti-Foxp3 mAbs (FJK-16s; eBioscience) was performed following the manufacturer’s instructions. All the antibodies used were from BD. At least 100,000 live cells were acquired on a FACSCalibur system (BD) and analyzed with FLOWJO software (version 4.5.4; Treestar Inc.).
Serum Ig quantification and specific antibody production.
Levels of IgG1, IgG2a, IgG2b, IgG3, IgA, and IgM were measured in sera collected from _Rag2_R229Q/R229Q mice by multiplex assay kit (Beadlyte Mouse Immunoglobulin Isotyping Kit; Upstate). Samples were prepared according to the manufacturer’s instructions. The assay was run using Bio-Plex reader (Bio-Rad). Levels of IgE were determined by ELISA assay (BD Biosciences).
To verify antigen-specific production, anesthetized mice were injected subcutaneously into footpads with 100 μg OVA (grade V; Sigma-Aldrich) mixed at a 1:1 ratio with CFA (Sigma-Aldrich). OVA-specific IgM, IgG1, IgG2a, and IgG2b levels were assessed by ELISA on serum obtained 7 days following boost, performed one month after the first immunization.
RNA extraction and RT-PCR.
Total RNA was prepared from the thymus using SV-total RNA isolation kit (Promega) followed by DNAse digestion in order to eliminate any residual DNA. Reverse transcription was performed with SuperScript II according to the manufacturer’s directions (Invitrogen). An aliquot (1 μl) of cDNA was used for the PCR reaction (30 cycles; annealing temperature, 58°C) in PerkinElmer Gene Amp9700 System to assess the expression of Aire with the following primers: forward, 5′-TGCATAGCATCCTGGACGGCTTCC-3′; reverse, 5′-CCTGGGCTGGAGACGCTCTTTGAG-3′. As an internal control, Gapdh transcript was amplified with the following oligos: forward, 5′-TGTCAGCAATGCATCCTGCA-3′; reverse, 5′-TGGATGCAGGGATGATGTTC-3′.
TCRVβ quantitative immunoscope analysis.
cDNAs were obtained from CD90+ cells isolated from thymus and spleen using positive selection (Miltenyi Biotec). TCRVβ repertoire analysis was performed as previously described (33). Briefly, cDNA was amplified with each of the 24 TCRVβ family member–specific primers together with a TCRCβ primer and a TaqMan Minor Groove Binder (MGB) Probe (Applied Biosystems) for TCRCβ. Real-time quantitative PCR was carried out on an ABI 7300 system (Applied Biosystems). PCR products were then subjected to runoff reactions using a nested fluorescent primer specific for the TCRCβ segment. The fluorescent products were separated and analyzed on a 373A sequencer (Applied Biosystems). The size and intensity of each band were analyzed by the quantitative Immunoscope approach (33, 34). The Gaussian distribution of the different CDR3 lengths was characteristic of normal TCRVβ repertoire.
Statistics.
For comparison between groups, an unpaired 2-tailed Student’s t test was used. Mann-Whitney test (nonparametric analysis) was used to evaluate the significance of Ig differences. A P value less than 0.05 was considered significant.
Supplementary Material
Supplemental data
Acknowledgments
We are grateful to the laboratory of Michel Nussenzweig, which kindly provided the BAC-containing _Rag_2 genomic region. We thank Enrica Mira Cato (Institute for Research in Biomedicine) for technical assistance. This work was supported by GATA 0203 AFM/Telethon (to A. Villa and L.D. Notarangelo); Stellar project (to P. Vezzoni), from Fondazione Cariplo (Nobel project to A. Villa, P. Vezzoni, and L.D. Notarangelo), and PRIN 2004 (to F. Facchetti). A. Casati is supported by Fondazione Stella Major.
Footnotes
Nonstandard abbreviations used: AIRE, autoimmune regulator; CDR3, third complementarity-determining region; DN, double negative; DP, double positive; EGFP, enhanced GFP; nTreg, naturally occurring Treg; OS, Omenn syndrome; SP, single positive; UTR, untranslated region.
Conflict of interest: The authors have declared that no conflict of interest exists.
Citation for this article: J. Clin. Invest. 117:1260–1269 (2007). doi:10.1172/JCI30928
See the related Commentary beginning on page 1270.
References
- 1.Honig M., Schwarz K. Omenn syndrome: a lack of tolerance on the background of deficient lymphocyte development and maturation. Curr. Opin. Rheumatol. 2006;18:383–388. doi: 10.1097/01.bor.0000231907.50290.6f. [DOI] [PubMed] [Google Scholar]
- 2.Notarangelo L.D., Gambineri E., Badolato R. Immunodeficiencies with autoimmune consequences. Adv. Immunol. . 2006;89:321–370. doi: 10.1016/S0065-2776(05)89008-X. [DOI] [PubMed] [Google Scholar]
- 3.Omenn G.S. Familial reticuloendotheliosis with eosinophilia. N. Engl. J. Med. 1965;273:427–432. doi: 10.1056/NEJM196508192730806. [DOI] [PubMed] [Google Scholar]
- 4.Santagata S., Villa A., Sobacchi C., Cortes P., Vezzoni P. The genetic and biochemical basis of Omenn syndrome. Immunol. Rev. 2000;178:64–74. doi: 10.1034/j.1600-065x.2000.17818.x. [DOI] [PubMed] [Google Scholar]
- 5.Mazzolari E., et al. Hematopoietic stem cell transplantation in Omenn syndrome: a single-center experience. Bone Marrow Transplant. 2005;36:107–114. doi: 10.1038/sj.bmt.1705017. [DOI] [PubMed] [Google Scholar]
- 6.Sobacchi C., Marrella V., Rucci F., Vezzoni P., Villa A. RAG-dependent primary immunodeficiencies. Hum. Mutat. . 2006;27:1174–1184. doi: 10.1002/humu.20408. [DOI] [PubMed] [Google Scholar]
- 7.Harville T.O., Adams D.M., Howard T.A., Ware R.E.1997Oligoclonal expansion of CD45RO+ T lymphocytes in Omenn syndrome . J. Clin. Immunol. 17322–332. [DOI] [PubMed] [Google Scholar]
- 8.Signorini S., et al. Intrathymic restriction and peripheral expansion of the T-cell repertoire in Omenn syndrome. Blood. 1999;94:3468–3478. [PubMed] [Google Scholar]
- 9.Villa A., et al. Partial V(D)J recombination activity leads to Omenn syndrome. Cell. 1998;93:885–896. doi: 10.1016/s0092-8674(00)81448-8. [DOI] [PubMed] [Google Scholar]
- 10.Corneo B., et al. Identical mutations in RAG1 or RAG2 genes leading to defective V(D)J recombinase activity can cause either T-B-severe combined immune deficiency or Omenn syndrome. Blood. . 2001;97:2772–2776. doi: 10.1182/blood.v97.9.2772. [DOI] [PubMed] [Google Scholar]
- 11.Villa A., et al. V(D)J recombination defects in lymphocytes due to RAG mutations: severe immunodeficiency with a spectrum of clinical presentations. Blood. 2001;97:81–88. doi: 10.1182/blood.v97.1.81. [DOI] [PubMed] [Google Scholar]
- 12.Giliani S., et al. Omenn syndrome in an infant with IL7RA gene mutation. J. Pediatr. 2006;148:272–274. doi: 10.1016/j.jpeds.2005.10.004. [DOI] [PubMed] [Google Scholar]
- 13.Roifman C.M., Gu Y., Cohen A.2006Mutations in the RNA component of RNase mitochondrial RNA processing might cause Omenn syndrome . J. Allergy Clin. Immunol. 117897–903. [DOI] [PubMed] [Google Scholar]
- 14.Ege M., et al. Omenn syndrome due to ARTEMIS mutations. Blood. 2005;105:4179–4186. doi: 10.1182/blood-2004-12-4861. [DOI] [PubMed] [Google Scholar]
- 15.Schwarz K., et al. Rag mutations in human B cell negative SCID. Science. 1996;274:97–99. doi: 10.1126/science.274.5284.97. [DOI] [PubMed] [Google Scholar]
- 16.Farr A., Nelson A., Truex J., Hosier S.J. Epithelial heterogeneity in the murine thymus: a cell surface glycoprotein expressed by subcapsular and medullary epithelium. J. Histochem. Cytochem. 1991;39:645–653. doi: 10.1177/39.5.2016514. [DOI] [PubMed] [Google Scholar]
- 17.Wilson A., Held W., MacDonald H.R. Two waves of recombinase gene expression in developing thymocytes. J. Exp. Med. 1994;179:1355–1360. doi: 10.1084/jem.179.4.1355. [DOI] [PMC free article] [PubMed] [Google Scholar]
- 18.Monroe R.J., et al. RAG2:GFP knockin mice reveal novel aspects of RAG2 expression in primary and peripheral lymphoid tissues. Immunity. 1999;11:201–212. doi: 10.1016/s1074-7613(00)80095-3. [DOI] [PubMed] [Google Scholar]
- 19.Shinkai Y., et al. 1992RAG-2-deficient mice lack mature lymphocytes owing to inability to initiate V(D)J rearrangemen t . Cell. 68855–867. [DOI] [PubMed] [Google Scholar]
- 20.Thevenin C., Nutt S.L., Busslinger M. Early function of Pax5 (BSAP) before the pre-B cell receptor stage of B lymphopoiesis. J. Exp. Med. 1998;188:735–744. doi: 10.1084/jem.188.4.735. [DOI] [PMC free article] [PubMed] [Google Scholar]
- 21.Oliver A.M., Martin F., Kearney J.F. IgMhighCD21high lymphocytes enriched in the splenic marginal zone generate effector cells more rapidly than the bulk of follicular B cells. . J. Immunol. 1999;162:7198–7207. [PubMed] [Google Scholar]
- 22.Sakaguchi S., et al. Foxp3+CD25+CD4+ natural regulatory T cells in dominant self-tolerance and autoimmune disease. . Immunol. Rev. 2006;212:8–27. doi: 10.1111/j.0105-2896.2006.00427.x. [DOI] [PubMed] [Google Scholar]
- 23.de Villartay J.P., et al. A novel immunodeficiency associated with hypomorphic RAG1 mutations and CMV infection. J. Clin. Invest. 2005;115:3291–3299. doi: 10.1172/JCI25178. [DOI] [PMC free article] [PubMed] [Google Scholar]
- 24.Ehl S., et al. A variant of SCID with specific immune responses and predominance of γδ T cells. J. Clin. Invest. 2005;115:3140–3148. doi: 10.1172/JCI25221. [DOI] [PMC free article] [PubMed] [Google Scholar]
- 25.Cavadini P., et al. AIRE deficiency in thymus of 2 patients with Omenn syndrome. J. Clin. Invest. 2005;115:728–732. doi: 10.1172/JCI200523087. [DOI] [PMC free article] [PubMed] [Google Scholar]
- 26.King C., Ilic A., Koelsch K., Sarvetnick N. Homeostatic expansion of T cells during immune insufficiency generates autoimmunity. Cell. 2004;16:265–277. doi: 10.1016/s0092-8674(04)00335-6. [DOI] [PubMed] [Google Scholar]
- 27.Derbinski J., Schulte A., Kyewsk B., Klein L. Promiscuous gene expression in medullary thymic epithelial cells mirrors the peripheral self. Nat. Immunol. 2001;2:1032–1039. doi: 10.1038/ni723. [DOI] [PubMed] [Google Scholar]
- 28.Anderson M.S., et al. The cellular mechanism of Aire control of T cell tolerance. Immunity. 2005;23:227–239. doi: 10.1016/j.immuni.2005.07.005. [DOI] [PubMed] [Google Scholar]
- 29.Liston A., Lesage S., Wilson J., Peltonen L., Goodnow C.C. Aire regulates negative selection of organ-specific T cells. Nat. Immunol. 2003;4:350–354. doi: 10.1038/ni906. [DOI] [PubMed] [Google Scholar]
- 30.Porcellini S., Panigada M., Grassi F. Molecular and cellular aspects of induced thymus development in recombinase-deficient mice. Eur. J. Immunol. 1999;29:2476–2483. doi: 10.1002/(SICI)1521-4141(199908)29:08<2476::AID-IMMU2476>3.0.CO;2-1. [DOI] [PubMed] [Google Scholar]
- 31.Noordzij J.G., et al. The immunophenotypic and immunogenotypic B-cell differentiation arrest in bone marrow of RAG-deficient SCID patients corresponds to residual recombination activities of mutated RAG proteins. Blood. . 2002;100:2145–2152. [PubMed] [Google Scholar]
- 32.Hosken N.A., Shibuya K., Heath A.W., Murphy K.M., O’Garra A. The effect of antigen dose on CD4+ T helper cell phenotype development in a T cell receptor-alpha beta-transgenic model. J. Exp. Med. 1995;182:1579–1584. doi: 10.1084/jem.182.5.1579. [DOI] [PMC free article] [PubMed] [Google Scholar]
- 33.Lim A., et al. Combination of MHC-peptide multimer-based T cell sorting with the Immunoscope permits sensitive ex vivo quantitation and follow-up of human CD8+ T cell immune responses. . J. Immunol. Methods. . 2002;261:177–194. doi: 10.1016/s0022-1759(02)00004-2. [DOI] [PubMed] [Google Scholar]
- 34.Pannetier C., et al. The sizes of the CDR3 hypervariable regions of the murine T-cell receptor beta chains vary as a function of the recombined germ-line segments. Proc. Natl. Acad. Sci. U. S. A. . 1993;90:4319–4323.. doi: 10.1073/pnas.90.9.4319. [DOI] [PMC free article] [PubMed] [Google Scholar]
Associated Data
This section collects any data citations, data availability statements, or supplementary materials included in this article.
Supplementary Materials
Supplemental data
