Mating type–dependent constraints on the mobility of the left arm of yeast chromosome III (original) (raw)
Abstract
Mating-type gene (MAT) switching in budding yeast exhibits donor preference. MAT a preferentially recombines with HML near the left telomere of chromosome III, whereas _MAT_α prefers HMR near the right telomere. Donor preference is controlled by the recombination enhancer (RE) located proximal to HML. To test if HML is constrained in pairing with _MAT_α, we examined live-cell mobility of LacI-GFP–bound lactose operator (lacO) arrays inserted at different chromosomal sites. Without induction of recombination, lacO sequences adjacent to HML are strongly constrained in both _MAT_α and RE-deleted MAT a strains, compared with MAT a. In contrast, chromosome movement at HMR or near a telomere of chromosome V is mating-type independent. HML is more constrained in MAT a Δre and less constrained in MAT a RE+ compared with other sites. Although HML and MAT a are not prealigned before inducing recombination, the three-dimensional configuration of MAT, HML, and HMR is mating-type dependent. These data suggest there is constitutive tethering of HML, which is relieved in MAT a cells through the action of RE.
Keywords: Saccharomyces cerevisiae; mating-type switching; donor preference; deconvolution fluorescence microscopy; chromosome dynamics
Introduction
Homothallic strains of the budding yeast Saccharomyces cerevisiae undergo mating-type switching, a site-specific recombination event initiated by a double-strand break (DSB) introduced at the mating-type gene (MAT) locus on chromosome III by the HO endonuclease. This break is repaired by gene conversion using as templates the _HML_α and HMR a donor loci located near the ends of opposite arms of chromosome III (Haber, 1998). One of the most surprising aspects of MAT switching is the phenomenon of donor preference. MAT a cells preferentially use the left-arm donor locus as a template for recombination with MAT (Klar et al., 1982), whereas the right-arm donor is the preferred locus for MAT switching in _MAT_α cells (Strathern and Herskowitz, 1979). Donor preference is independent of the sequence at the site of the donor locus, as MAT a cells prefer to use the left arm as a donor even when _HML_α is replaced by HMR a (Weiler and Broach, 1992). A similar effect is observed for recombination between two leu2 heteroalleles when one of the alleles is inserted at HML and the other is located next to MAT or on another chromosome. MAT a strains exhibit a 25–30-fold increase in recombination between these heteroalleles relative to isogenic _MAT_α cells in this assay (Wu and Haber, 1995). When HML is deleted in a MAT a strain, MAT switching occurs efficiently using HMR as a donor (Klar et al., 1982). In contrast, deletion of HMR in a _MAT_α strain does not result in an increase in HML usage as a donor. Rather, donors on the left arm of chromosome III become unusually inaccessible, resulting in a decrease in cell survival upon induction of HO (Wu et al., 1996) because the DSB, if not repaired by recombination with a donor sequence, is lethal to the cell.
Donor preference during MAT switching is controlled by the recombination enhancer (RE), a small cis-acting locus control-type region, which acts at a distance to promote recombination along the entire left arm of chromosome III. In _MAT_α cells, the Mcm1p–Matα2p repressor complex binds to and inactivates the RE (Tanaka et al., 1984; Szeto and Broach, 1997; Szeto et al., 1997; Weiss and Simpson, 1997). Loss of Matα2p binding causes _MAT_α cells to appear almost MAT a-like with respect to donor preference (Wu et al., 1998). Deletion of the RE abolishes donor preference in MAT a cells such that HML usage is reduced from 85–90% to only 10% (Wu and Haber, 1996). Thus, the left arm of chromosome III exists in a constitutively recombinationally inaccessible state against which the RE works to activate HML as a donor in MAT a cells.
Recent work by Sun et al. (2002) has demonstrated that RE-mediated donor preference during MAT switching is also regulated by the interaction of the forkhead protein Fkh1p with the RE. Donor preference in MAT a cells is significantly reduced by deletion of FKH1 or by mutation of the Fkh1p/Fkh2p-binding sites within a subdomain of the RE. The _fkh1_Δ mutation also eliminates the mating type–dependent activation of spontaneous heteroallelic leu2 recombination observed in MAT a cells, such that the frequency of Leu+ is similar in MAT a _fkh1_Δ and _MAT_α cells (Sun et al., 2002). However, the mechanism by which the RE, through interaction with this and other protein factors, controls recombination along an entire chromosome arm remains unclear.
One model to explain donor preference is that the left arm of chromosome III is stimulated for recombination in MAT a cells and as a result, HML is more able to pair frequently with MAT in these cells than is HMR. In contrast, pairing of HML with MAT may be prevented in _MAT_α cells. This region appears to be rendered inaccessible by an undefined mechanism.
Recent work from several labs in yeast, Drosophila, and mammalian cells has demonstrated that the dynamics of nuclear architecture are a key component of cellular processes such as replication and transcription (Belmont, 2001). Chromosomal loci move within the interphase nucleus, yet their motion is constrained within small territories. Centromeric and telomeric regions of S. cerevisiae chromosomes are more constrained than origins in the G1 phase, but all sites exhibit spatial constraint in S phase (Heun et al., 2001). Perhaps nuclear architecture, with respect to chromosome arrangement and dynamics, plays a role in donor preference during MAT switching in S. cerevisiae.
Here, we tested the hypothesis that donor preference reflects a mating type–specific difference in the mobility of opposite arms of chromosome III. Cytological analysis of GFP-tagged chromosomes in the nuclei of living cells was performed to visualize movement of the HML and HMR donor loci in G1, when MAT switching normally occurs. We observed rapid diffusive motion of all tagged loci, regardless of mating-type. However, this motion was constrained to small volumes within the nucleus. Interestingly, the HML locus exhibited a striking mating type–dependent difference in the frequency of allelic pairing in diploid strains. Moreover, in MAT a _/mat_Δ cells, the left arm of chromosome III is less constrained than the right arm or in _MAT_α/_mat_Δ cells. Our analysis of reΔ strains demonstrates that the increased pairing and mobility of HML in MAT a _/mat_Δ cells is dependent on the presence of the RE.
Results
Mating type–dependent motion of the left arm of chromosome III in living cells
We tested the hypothesis that donor preference during MAT switching reflects a change in the mobility or tethering of HML in MAT a versus _MAT_α cells. We used the lactose operator (lacO)/lactose repressor (LacI)-GFP system (Robinett et al., 1996; Straight et al., 1996) to fluorescently tag allelic loci adjacent to the HML locus on the left arm of chromosome III (Fig. 1 A). Because we were interested in carrying out this analysis in G1 cells (when normal MAT switching is initiated), but where there are no clear nuclear landmarks such as the mitotic spindle axis, we chose to study chromosome movements in diploids that either express only MAT a or _MAT_α. We constructed MAT a/_MAT_α diploid strains containing lacO sequence arrays inserted at allelic loci (Fig. 1 A), and then deleted one of the two MAT alleles. Chromosome movement was monitored using three-dimensional (3D) deconvolution fluorescence microscopy by measuring the distance between LacI-GFP–bound lacO arrays at 30-s intervals for 20 min. This analysis is similar to that used by Marshall et al. (1997) to determine the rate of diffusion and radius of constraint of lacO sequences located 20 kb from a centromere. By following the relative motion of two fluorescent spots, this approach eliminates uncertainties in chromosome position caused by movements or deformations of the nucleus (Marshall et al., 1997). In addition, all cells imaged were of similar size to rule out the influence of variations in cell size on distance measurements. This was achieved by restricting image collection from all strains to cells that fit within an imaging window of fixed dimensions. In these experiments HO endonuclease was not induced.
Figure 1.
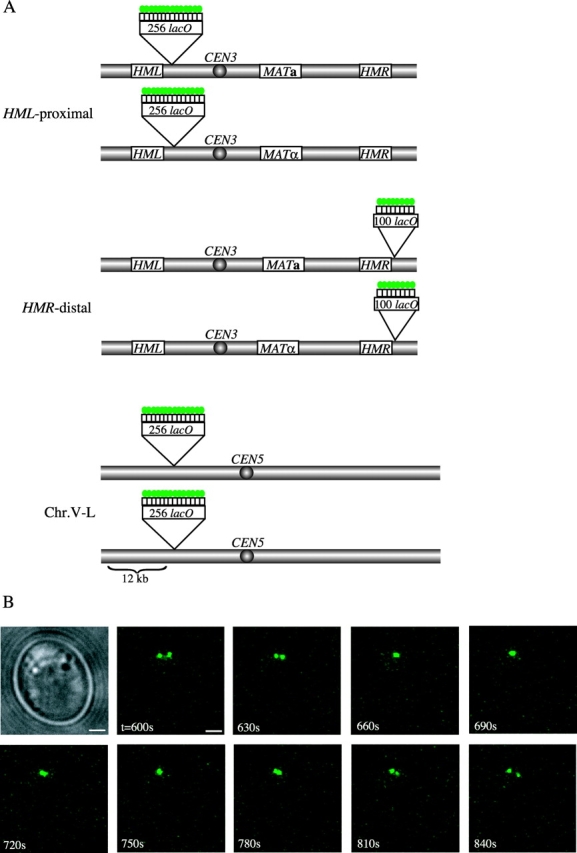
Visualization of GFP-tagged allelic loci in living diploid cells. (A) Sites of lacO array insertions on the left (_HML_-proximal) and right (_HMR_-distal) arms of chromosome III and on the left arm of chromosome V (Chr.V-L) are indicated. Pairs of tagged chromosomes represent homologues in diploid strains. Green circles represent LacI-GFP fusion proteins bound to the operator arrays. (B) Nuclei of live unbudded cells were observed at 30-s intervals for 20 min using 3D deconvolution fluorescence microscopy. Brightfield and GFP images for several consecutive time points for one MAT a _/mat_Δ cell bearing _HML_-proximal GFP tags (YDB093) are shown. Time (seconds) after the start of observation is indicated. Images are projections of 16 sections spaced 0.2 μm apart. We note that although these images are projections, the apparent convergence of the two foci from t = 660 s to t = 750 s actually represents the overlap of the foci in 3D space, whereas the projected image from t = 780 s falsely depicts the pairing of these tagged sites. The time-series plot of the distance between the foci over time for this cell is indicated by a thick red line in Fig. 2 A. Bars, 1 μm.
Several consecutive images, compressed to two dimensions, are shown for one MAT a _/mat_Δ cell in Fig. 1 B. A time-series plot of these distances in 3D reveals that the _HML_-proximal loci are not held a fixed distance apart in the nucleus (Fig. 2 A, thick red line). In fact, there is substantial movement between these tagged sites in both MAT a/_mat_Δ and _MAT_α/_mat_Δ cells (Fig. 2, A and B). To control for motion due to vibration of the microscope stage and/or camera, cells from each strain were observed after fixation. Under these conditions, the distance between loci varied <0.3 μm (approximately the resolution of our microscope system) over the length of each time course (unpublished data).
Figure 2.
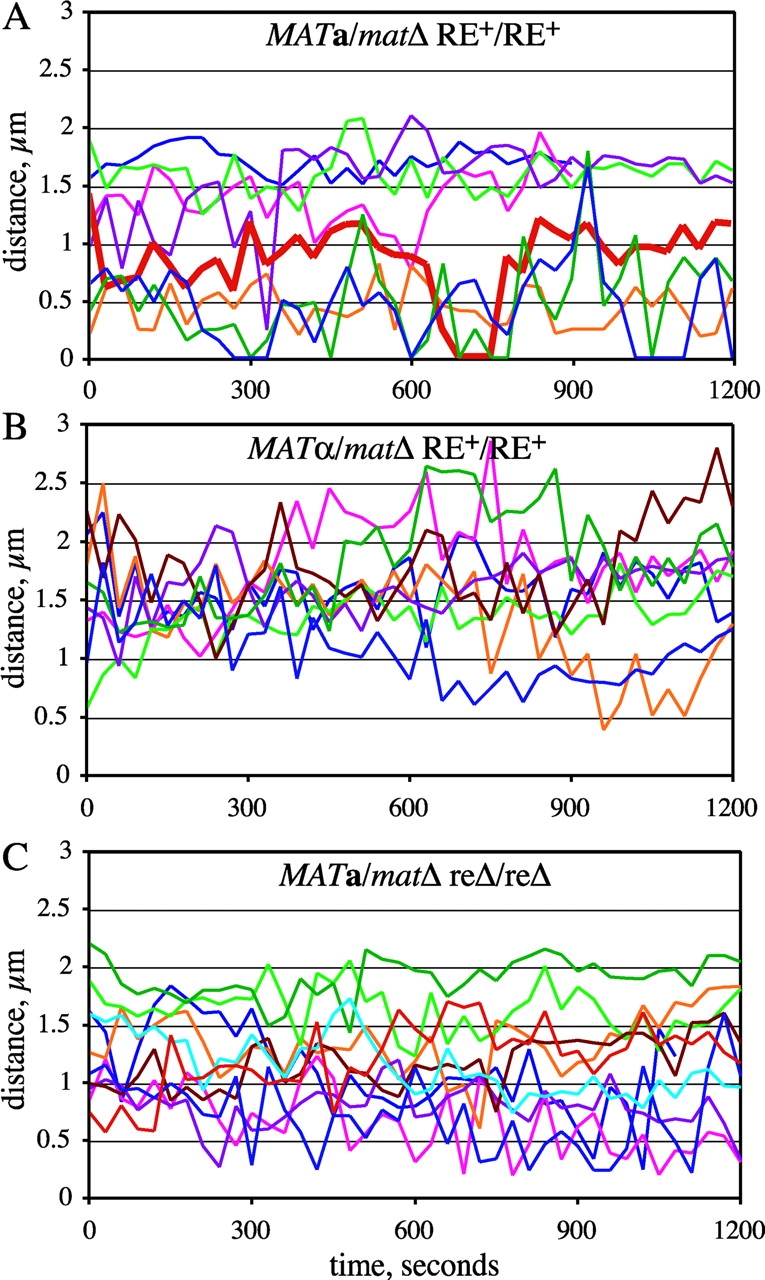
Mobility of GFP-tagged allelic loci on the left arm of chromosome III. Nuclei of live unbudded diploid cells tagged adjacent to the HML locus on the left arm of chromosome III were imaged as in Fig. 1 B. For each time point, the distance between the two GFP foci was determined from 3D images and is plotted here versus time. Each colored line represents distance data from a single cell. The thick red line in A corresponds to the images shown in Fig. 1 B. Strains used: (A) MAT a _/mat_Δ RE+/RE+ (YDB092 and YDB093); (B) _MAT_α/_mat_Δ RE+/RE+ (YDB090 and YDB091); and (C) MAT a _/mat_Δ reΔ/reΔ (YDB142 and YDB143).
Comparison of data from cells of opposite mating-types reveals a striking difference in the frequency of association between the _HML_-proximal loci. In MAT a _/mat_Δ cells, the left arms of chromosome III are within 0.5 μm 23% of the time, whereas in _MAT_α/_mat_Δ cells the two spots are rarely in close proximity and come within 0.5 μm of one another in only 1 out of 8 time courses (Fig. 2, A and B; Fig. 3 A). In fact, the tagged _HML_-proximal loci are only observed within 1 μm in <10% of the images of _MAT_α/_mat_Δ cells, compared with 50% in MAT a _/mat_Δ cells. Moreover, the two GFP foci converged at least once to a single focus during 8 out of 17 time courses with MAT a _/mat_Δ cells, but in none of the time courses with _MAT_α/_mat_Δ cells (Fig. 2, A and B). These observations support a model for donor preference in which the left arm, carrying HML, is more mobile and thus able to pair effectively with MAT in MAT a versus _MAT_α cells.
Figure 3.
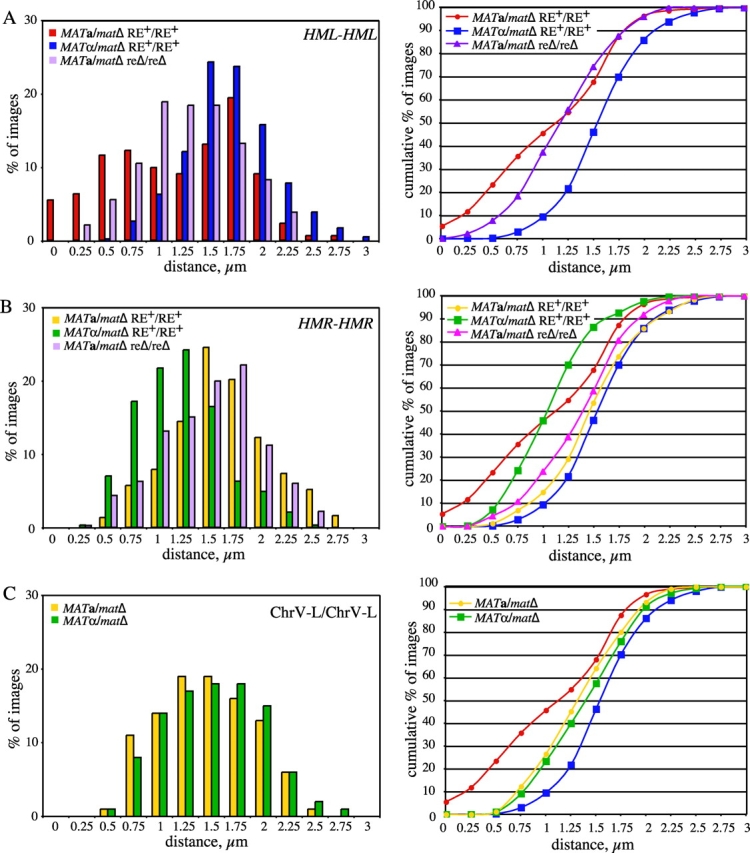
Association of allelic loci on chromosomes III and V. Nuclei of live unbudded diploid cells tagged at allelic _HML_-proximal, _HMR_-distal, or Chr.V-L loci were imaged as in Fig. 1 B, and the distance between the two GFP foci was determined from 3D images for each time point. A total of at least 328 images were obtained from 8–17 independent nuclei per strain. Distributions of distances between the foci are presented on the left. Cumulative percentage of images versus distance is plotted on the right. Data for the MAT a _/mat_Δ and _MAT_α/_mat_Δ strains tagged at _HML_-proximal loci are replotted in B and C. Strains used: (A) _HML_-proximal (from data plotted in Fig. 2, except MAT a _/mat_Δ RE+/RE+ includes data from an additional nine nuclei not shown in Fig. 2 A): MAT a _/mat_Δ RE+/RE+ (YDB092 and YDB093); _MAT_α/_mat_Δ RE+/RE+ (YDB090 and YDB091); MAT a _/mat_Δ reΔ/reΔ (YDB142 and YDB143). (B) _HMR_-distal: MAT a _/mat_Δ RE+/RE+ (YDB191); _MAT_α/_mat_Δ RE+/RE+ (YDB192 and YDB194); MAT_α//mat_Δ reΔ/reΔ (YDB248). (C) Chr.V-L: MAT a _/mat_Δ (YDB214); _MAT_α/_mat_Δ (YDB238).
The distances between LacI-GFP spots in MAT a _/mat_Δ cells appear to follow a bimodal distribution (Fig. 3 A). Approximately 50% of the images show distances that fall into an approximately normal distribution, with a mean value of 0.54 μm. The remaining 50% of the images fit into an approximately normal distribution with a mean separation of 1.61 μm. In contrast, the distance data for _MAT_α/_mat_Δ cells follow a unimodal distribution, with a mean value of 1.55 ± 0.02 μm. These differences suggest a structural distinction in the organization and/or mobility of chromosome III near the HML locus. We conclude that mating-type significantly influences the freedom of pairing between allelic sites near HML and propose that this is an important factor also in the association of HML with MAT during homothallic switching.
Mating type–dependent associations of the left arms of chromosome III in diploid cells are dependent on the RE
Previous studies have demonstrated that deletion of the RE in MAT a cells abolishes both HML donor preference in MAT switching and increases spontaneous heteroallelic recombination when one of the alleles is located on the left arm of chromosome III (Wu and Haber, 1995, 1996). To examine the potential role of the RE in the mobility of the left arm of chromosome III, we analyzed strains homozygous for a deletion of the RE by time-lapse microscopy as above. Similar to the other strains examined, the GFP-tagged loci in the reΔ strains exhibited dynamic movement throughout the time courses (Fig. 2 C). However, in contrast to observations from MAT a/_mat_Δ RE+ cells, the homologous chromosome arms are much less often close to one another in MAT a/_mat_Δ reΔ/reΔ cells (Fig. 2 C; and Fig. 3 A). In fact, the loci are observed to be within 0.5 μm in only 8% (32/406) of the images from MAT a _/mat_Δ reΔ/reΔ nuclei, compared with 23% (111/473) for the MAT a _/mat_Δ RE+ strain (Fig. 3 A). Although on average the _HML_-proximal loci in MAT a/_mat_Δ reΔ/reΔ cells are closer than in _MAT_α/_mat_Δ cells (1.17 ± 0.02 μm vs. 1.55 ± 0.02 μm, respectively; Fig. 3 A), the distribution of distances for the MAT a/_mat_Δ reΔ/reΔ cells suggests that the range of motion is relatively more limited in these cells than in _MAT_α/_mat_Δ cells. Given that nearly 60% of images contain foci between 1 μm and 1.5 μm apart (Fig. 3 A), we propose that deletion of the RE in MAT a/_mat_Δ cells results in tethering of the left arm of chromosome III. The RE is not active in _MAT_α cells, and, as expected, deletion of the RE in _MAT_α/_mat_Δ cells did not affect the behavior of the left arms of chromosome III (unpublished data). These data clearly demonstrate a role for the RE in the observed mobility of the left arm of chromosome III in MAT a _/mat_Δ cells.
Pairing between allelic sites is not a general feature of homologous chromosomal loci
_MAT_α cells preferentially use the right arm as a donor during MAT switching (Strathern and Herskowitz, 1979). MAT a cells in which HML has been deleted switch efficiently using HMR as a donor (Klar et al., 1982), suggesting that HMR a is not inaccessible in MAT a strains. We asked whether donor preference in _MAT_α cells reflects a difference in mobility or tethering of the right arm. Diploid cells of both mating-types homozygous for a lacO array insertion adjacent to the HMR locus on the right arm of chromosome III (Fig. 1 A) were imaged as described in Figs. 1 and 2. Similarly to the loci on the left arm of chromosome III, the GFP-tagged loci on the right arm were quite dynamic throughout each time course (unpublished data). Unlike the left arms of chromosome III, the tagged loci on the right arm were rarely observed in close proximity in diploid cells of either mating-type (Fig. 3 B). The right arms of chromosome III were within 0.5 μm in 7% (21/287) of images of _MAT_α/_mat_Δ nuclei and <2% (5/369) of images of MAT a _/mat_Δ nuclei (Fig. 3 B), compared with 23% for _HML_-associated cases in MAT a _/mat_Δ cells. However, there was a significant mating type–dependent difference in the mean distance between the _HMR_-distal loci. In MAT a _/mat_Δ cells, the loci on average were 1.49 ± 0.02 μm apart, whereas they were 1.06 ± 0.02 μm apart in _MAT_α/_mat_Δ cells. In addition, the range of the distance distribution in _MAT_α/_mat_Δ cells is quite narrow, with 63% of images containing foci between 0.75 and 1.25 μm apart (Fig. 3 B). This difference in proximity of the right arms may be reflected as a change in mobility of the right arm of chromosome III in _MAT_α cells, and along with the constraint of HML, could account for the preferred usage of the right arm of chromosome III during MAT switching in _MAT_α cells (Strathern and Herskowitz, 1979).
MAT a cells deleted for the RE switch efficiently using HMR on the right arm of chromosome III as a donor (Wu and Haber, 1996). To examine the possibility that deletion of the RE in MAT a/Δ cells results in a change in mobility of the right arm, we examined the relative movement of lacO arrays inserted adjacent to the HMR loci in MAT a/_mat_Δ reΔ/reΔ cells. Unlike the _HML_-adjacent GFP tag, deletion of the RE in MAT a _/mat_Δ cells does not have a profound effect on the behavior of GFP-tagged right arms of chromosome III. The distribution of distances between _HMR_-distal loci in MAT a/_mat_Δ reΔ/reΔ cells resembles that for MAT a/_mat_Δ RE+/RE+ cells (Fig. 3 B). Moreover, the right arm loci are rarely observed in close proximity in MAT a/_mat_Δ reΔ/reΔ cells and are within 0.5 μm in only 5% (17/368) of images (Fig. 3 B), similar to the results from _MAT_α/_mat_Δ and MAT a/_mat_Δ cells. These observations are consistent with donor preference data in which the right arm donor can be used both during MAT switching in haploid MAT a RE+ cells in which the left arm donor has been deleted and in MAT a reΔ cells where the left arm donor is inactivated by deletion of the RE (Wu and Haber, 1996). However, these data do not account for the relative increase in HMR usage in haploid _MAT_α cells compared with MAT a RE+ cells undergoing MAT switching. Therefore, we conclude that there is a mating type–dependent control on the mobility of allelic sites near HMR on the right arm of chromosome III, but propose that other factors, such as the constraint on HML in reΔ cells, also influence the association of HMR with MAT during homothallic switching.
To control for differences in mobility due to the position of the GFP-tagged sites along the chromosome, lacO arrays were inserted on the left arms of chromosome V in an analogous position (equivalent distance from the telomere) to that on chromosome III (Fig. 1 A). As visualized by LacI-GFP bound to these arrays, the movement and mean distance between the loci on the left arms of chromosome V resembled those of HML on the left arm of chromosome III in _MAT_α/_mat_Δ cells (Fig. 3 C). The two GFP-tagged homologous loci were rarely observed within 0.5 μm (<10% of images) in cells of either mating-type (Fig. 3 C). The mean distance between the left arms of chromosome V was similar in both MAT a _/mat_Δ (1.32 ± 0.02 μm) and _MAT_α/_mat_Δ (1.39 ± 0.02 μm) cells.
These data indicate that the high frequency of association between the left arms of chromosome III in diploid MAT a/_mat_Δ cells is not seen at other chromosomal loci, but rather is a unique mating type–dependent feature of this particular chromosomal region.
Chromosomal locus confinement is mating-type dependent
Previous studies have shown that a given chromosomal locus does not freely explore the entire space of the nucleus; rather, movement is constrained (Marshall et al., 1997; Heun et al., 2001). The relative constraint on each of the three loci examined can be determined from the mean-squared change in distance (MSD) over increasing time intervals for each pair of loci as described previously (Marshall et al., 1997). At relatively large time intervals, the curves represent the degree of confinement, which can be estimated from the height of the plateau. The height of the plateau is proportional to the radius of confinement (or inversely proportional to the degree of constraint).
The MSD curves reveal significant differences between the strains and the loci examined. Mobility of the left arm of chromosome III is relatively less constrained in MAT a/_mat_Δ versus _MAT_α/_mat_Δ cells (Fig. 4 A). However, when the RE is deleted in MAT a/_mat_Δ cells, the loci on the left arm of chromosome III become constrained to an even greater extent than in _MAT_α/_mat_Δ cells (Fig. 4 A). This is consistent with donor preference data which reveal that left arm usage during MAT switching is even lower in MAT a reΔ cells versus _MAT_α RE+ cells (Wu and Haber, 1996). The right arm of chromosome III does not show a mating type–dependent difference in the radius of confinement, and resembles the left arm of chromosome III in _MAT_α/_mat_Δ cells (Fig. 4 A). In addition, the calculated radius of confinement for the left arms of chromosome V is similar to that for chromosome III in _MAT_α/_mat_Δ cells, independent of mating-type (Fig. 4 B). Therefore, the left arms of chromosome III in MAT a/_mat_Δ cells exhibit a cell type–specific increase in mobility relative to the other GFP-tagged chromosomal regions examined. It appears that, specifically in MAT a/_mat_Δ RE+ cells, the left arm of the chromosome is less confined relative to other loci on the same chromosome and to the analogous region on a different chromosome.
Figure 4.
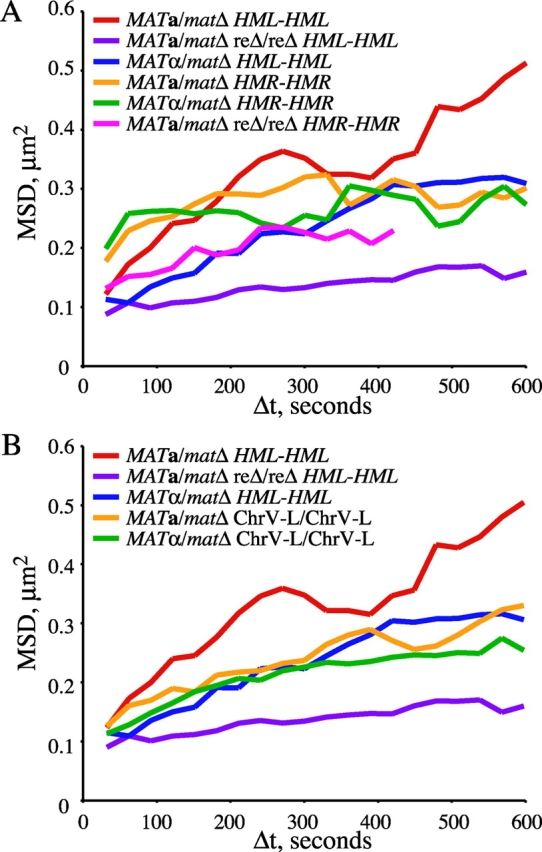
Chromosomal locus confinement is mating-type dependent. MSD values for tagged allelic loci is shown for the time intervals (Δt) indicated. The degree of constraint is proportional to the height of the plateau of the MSD curve. Strains are the same as in Fig. 3. (A) Strains tagged at allelic _HML_-proximal loci (MAT a _/mat_Δ RE+/RE+, YDB092 and YDB093; _MAT_α/_mat_Δ RE+/RE+, YDB090 and YDB091; MAT a _/mat_Δ reΔ/reΔ, YDB142 and YDB143) and _HMR_-distal loci (MAT a _/mat_Δ RE+/RE+, YDB191; _MAT_α/_mat_Δ RE+/RE+, YDB192 and YDB194; _MAT_α/_mat_Δ reΔ/reΔ, YDB248). MSD values for Δt >420 s could not be calculated from strain YDB248 distance data due to bleaching of the GFP foci at late times during the time courses. (B) Strains tagged at allelic loci on the left arm of chromosome V (MAT a _/mat_Δ, YDB214; _MAT_α/_mat_Δ, YDB238) and _HML_-proximal loci (replotted from A for comparison).
Donor loci in haploid cells are not paired with MAT before induction of a DSB
One hypothesis to explain donor preference during MAT switching is that donor loci are paired with the MAT locus before the induction of HO endonuclease. To test this, we used the lacO/LacI-GFP and tetracycline operator (tetO)/tetracycline repressor (TetR)-GFP systems (Robinett et al., 1996; Straight et al., 1996; Michaelis et al., 1997) to fluorescently tag regions of chromosome III adjacent to the HML and MAT loci, respectively (Fig. 5 A). Using fluorescence microscopy, we examined the association of the GFP-tagged loci on chromosome III to determine if these regions are paired in the absence of a DSB at MAT. In fixed haploid cells, the proportion of G1 (unbudded) cells in which the two GFP spots are seen as a single focus is only ∼12%, both in MAT a and in _MAT_α cells (Fig. 5 B). This result is similar to that reported previously (Simon et al., 2002), except that in their case, the spots were found to be overlapping in 40% of cells. After a brief HO induction (resulting in ∼60% of cells switching), the proportion of cases where GFP spots became overlapping increased to nearly 45% in MAT a cells but remained unchanged in _MAT_α cells (Fig. 5 B), which is consistent with donor preference data.
Figure 5.
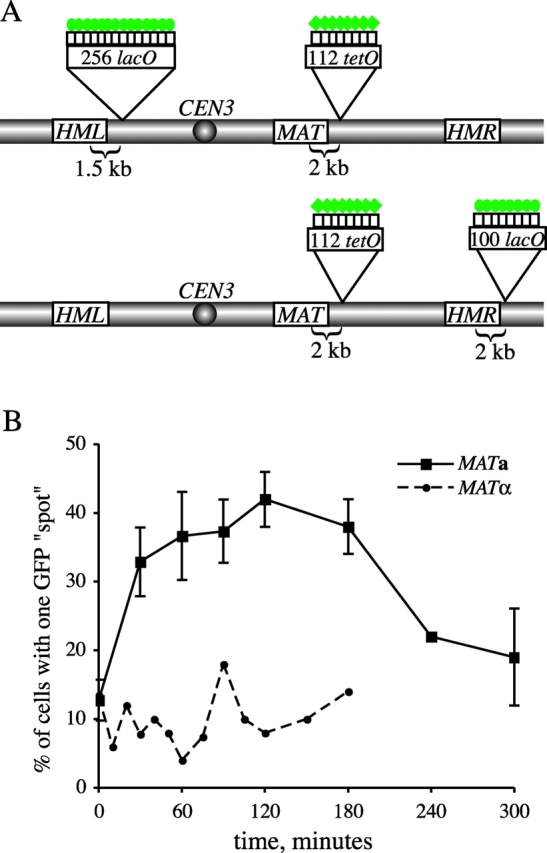
Visualization of mating-type loci before and after HO induction. (A) Sites of lacO and tetO array insertions along chromosome III are indicated. Green circles and diamonds represent LacI-GFP and TetR-GFP fusion proteins, respectively, bound to the operator arrays. (See Materials and methods for detailed descriptions of the constructs used for chromosomal integrations.) (B) Plot of cells exhibiting pairing of GFP-tagged HML and MAT loci in MAT a (YDB112, squares) versus _MAT_α (YDB111, circles) cells. HO endonuclease was induced at t = 0 min by addition of galactose to the media and turned off at t = 30 min by the addition of glucose (2% final concentration). Cells were fixed at time points indicated and scored for the appearance of one versus two GFP spots per nucleus by fluorescence microscopy. At least 50 cells of each mating-type were scored per time point. For the MAT a strain, average values from two independent experiments are plotted with standard deviation represented by error bars. The efficiency of MAT switching in this assay, as determined from mating-type tests of plated cells, was found to be ∼60%.
Distances between MAT and its two donors are mating-type dependent
Although donor loci are not paired with the MAT locus before HO induction, it is possible that donor preference is reflected in a difference in the average distance between MAT and HML in MAT a versus _MAT_α cells. To test this, we determined the 3D positioning of the GFP spots near HML and MAT in the nuclei of fixed interphase, G1 (unbudded) cells and measured the distance between these two loci using 3D deconvolution fluorescence microscopy. To rule out the influence of variations in cell size on distance measurements, all cells imaged were of similar size. This was achieved by restricting image collection from all strains to cells that fit within an imaging window of fixed dimensions. In addition, to increase the accuracy of distance measurements, cells were fixed before imaging to eliminate error due to motion of foci within the nuclei of living cells.
As above, the proportion of cells in which the two GFP spots are seen as a single focus is ∼10%, both in MAT a and in _MAT_α cells. In cells that have two visible GFP spots, the mean distance between the two GFP-tagged loci is 0.75 ± 0.04 μm and 0.89 ± 0.05 μm in MAT a and _MAT_α cells, respectively (Fig. 6 B, top). There is a higher proportion of images in which the GFP spots are within 0.5 μm of one another in MAT a cells (26%) than in _MAT_α cells (10%; Fig. 6 A). In fact, 35% of _MAT_α cells examined contained GFP spots separated by at least 1 μm, whereas this was the case in only 16% of MAT a cells. A t test of the distance data reveals that the observed difference in distance between HML and MAT in MAT a versus _MAT_α cells is statistically significant, with p-values of 0.016 (1-tailed test) and 0.03 (2-tailed test). As a control to test the effect of fixation on the relative positioning of the nuclear foci, the mean distance between the GFP-tagged loci was determined from live cells (Fig. 6 B, bottom). The relative mean distance between each pairwise combination of loci remained the same as for fixed cells, despite the overall mild decrease in distance values. This discrepancy is likely due to rapid motion of foci during imaging, as observed upon examination of individual image sections compared with images obtained by quick projections of entire stacks. Nevertheless, although donor preference is not determined by prealignment of MAT with HML, it appears that proximity between these loci or their ability to interact plays some role in donor selection during MAT switching.
Figure 6.
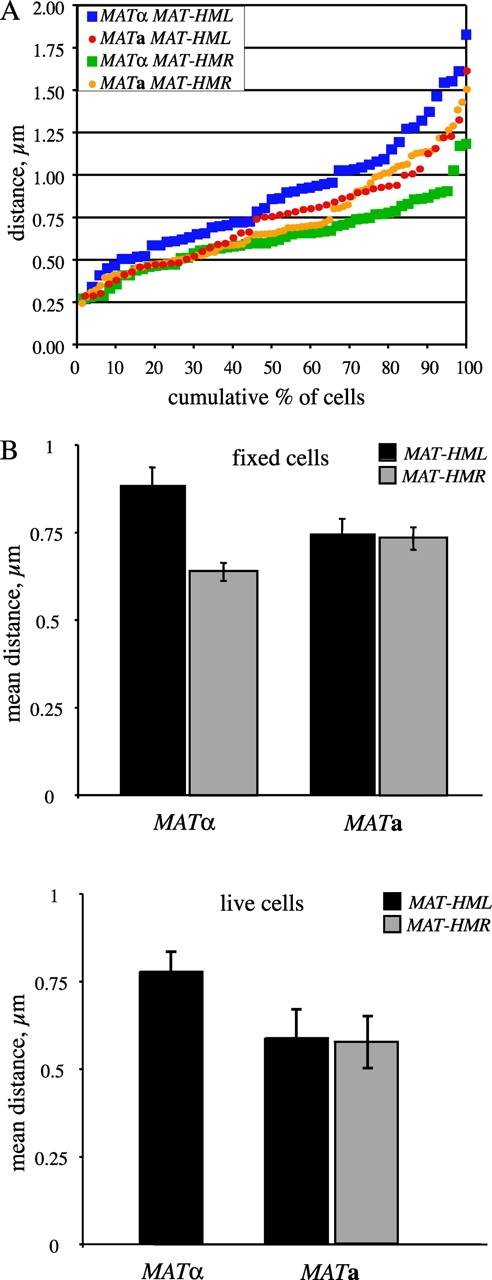
Distance between the MAT locus and the HML and HMR donor loci in haploid cells. Haploid cells bearing GFP tags adjacent to the MAT locus and either HML (YDB111, _MAT_α; YDB112, MAT a) or HMR (YDB229, _MAT_α; YDB228 and YDB239, MAT a) were grown in liquid culture to exponential phase and imaged using 3D deconvolution fluorescence microscopy. The distance between the nuclear GFP foci was calculated from at least 50 3D images per strain for each GFP-tagged locus pair (see Materials and methods for a detailed description of this analysis). (A) Distances between MAT and HML or HMR are plotted as cumulative percentages of cells with two GFP foci for MAT a (circles) and _MAT_α (squares) strains. Cells were fixed in PFA before imaging. (B) Bar graph of the mean distance between MAT and each donor locus in MAT a and _MAT_α cells. Top, fixed cells; bottom, live cells. Error bars represent standard error.
We also examined the 3D positioning of MAT and HMR, in fixed G1 (unbudded) cells, by insertion of a lacO array adjacent to the HMR locus (Fig. 5 A). HMR is not prealigned with MAT in cells of either mating-type. The mean distance between the two GFP spots varies slightly with mating-type; 0.64 ± 0.03 μm in _MAT_α cells versus 0.75 ± 0.04 μm in MAT a cells (Fig. 6 B). The GFP spots were within 0.5 μm of one another in 25% of both _MAT_α and MAT a cells (Fig. 6 A). Moreover, in at least two thirds of the cells, HMR and MAT are within 0.75 μm. These results are consistent with donor preference data, which demonstrate that in MAT a cells deleted for _HML_α (the preferred donor), cells switch efficiently using HMR a. We observed that the proportion of cells in which the two GFP spots near HMR and MAT are separated by at least 1 μm is significantly greater in MAT a cells (25%) than in _MAT_α cells (5%; Fig. 6 A). Perhaps the right arm of chromosome III is extended further in MAT a cells compared with _MAT_α cells, and thereby the proportion of cells in which the GFP-tagged loci are >1 μm apart is relatively lower in _MAT_α cells.
To extend the analysis of the relative position of MAT and its two donors, we used strains bearing LacI-GFP–bound lacO arrays of different sizes at HML and HMR loci as described previously (Fig. 5 A) and a TetR-(CFP)3–tagged MAT locus (Fig. 7, A and B). We determined the 3D configuration of the MAT, HML, and HMR loci in nuclei of fixed intact G1 (unbudded) MAT a and _MAT_α cells. There is a mating type–dependent difference in the 3D nuclear arrangement of these loci. In _MAT_α cells, the mean distance between MAT and HMR (0.58 ± 0.06 μm) is significantly shorter than that between HML and either of these loci (_HML_-MAT: 0.84 ± 0.06 μm; _HML_-HMR: 0.98 ± 0.08 μm; Fig. 7 C). This correlates with our findings in _MAT_α cells tagged at MAT and either HML or HMR described previously (Fig. 6 B), and supports a model in which HML is tethered and thereby excluded from interaction with _MAT_α. In contrast, we found MAT, HML, and HMR in MAT a cells to be equidistant (0.8 ± 0.1 μm; Fig. 7 C). It is unlikely that the mating type–dependent differences we observed between distance measurements are due to variations in the size of the fluorescent signal because data from strains in which the size of the TetR-(CFP)3 signal near the MAT locus is large correlate with data from strains in which the TetR-GFP signal is relatively smaller. Although our data do not enable us to propose a detailed configuration of the left arm of chromosome III, they do support a role for mating-type in regulating chromosome conformation.
Figure 7.
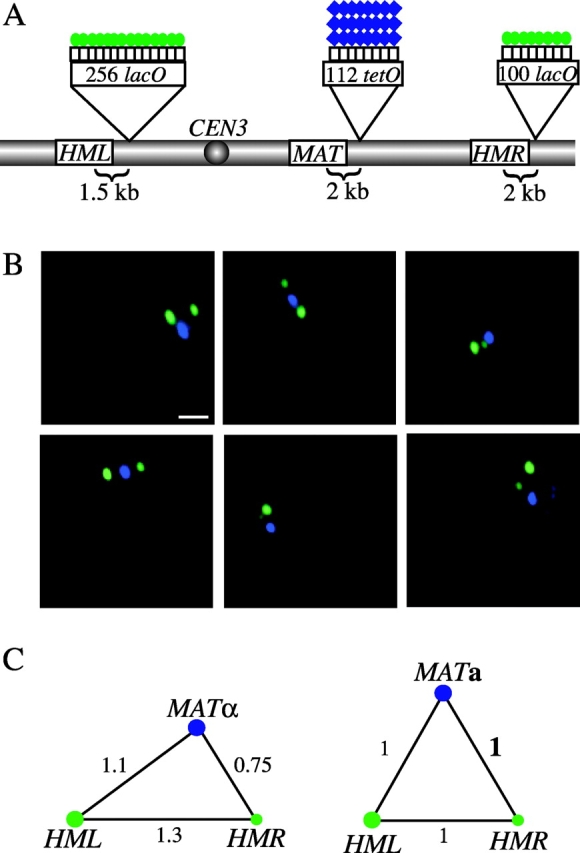
3D positioning of tagged mating-type loci by fluorescence microscopy. (A) Sites of lacO and tetO array insertions along chromosome III are indicated. Green circles and blue diamonds represent LacI-GFP and TetR-(CFP)3 fusion proteins, respectively, bound to the operator arrays. (B and C) GFP/CFP-tagged haploid cells (YDB242 and YDB243) were grown in liquid culture to exponential phase, fixed in PFA, and imaged using 3D deconvolution fluorescence microscopy. (B) Images shown are projections of 16 optical sections per wavelength spaced 0.2 μm apart. Image sections were obtained by alternate excitation with light of each wavelength and were pseudocolored (GFP, green; CFP, blue) after deconvolution. The differently sized GFP-bound arrays adjacent to the HML and HMR loci are distinguished by the relative sizes of the observed GFP (green) foci. Bar, 1 μm. (C) Diagrams of the calculated 3D configuration of tagged loci in _MAT_α (YDB242) and MAT a (YDB243) cells. Mean distance measurements for each pairwise combination of loci were calculated from 11–22 cells per mating-type and the relative positioning of the three tagged loci, represented by blue and green circles, is shown. Numbers represent mean distances between loci normalized to the distance between MAT and HMR in the MAT a strain (indicated as a bold number 1). Actual distance values are given in the text.
Discussion
We have tested the hypothesis that differences in chromosome mobility play a role in donor preference during MAT switching by examining the motion and pairing of GFP-tagged chromosome III loci in living cells. Consistent with results from Simon et al. (2002), we found that donor preference is not due to prealignment of mating-type loci because the left-arm donor HML is not paired with the MAT locus before HO induction in haploid MAT a or _MAT_α cells. However, we do find mating type–dependent differences in the 3D configuration of HML, HMR, and MAT, as well as significant differences in mating type– and RE-dependent constraints on the movement of HML. Together, these differences support the idea that donor preference during MAT switching is enforced by regulating the position and radius of confinement of HML.
In MAT a _/mat_Δ reΔ/reΔ cells, the region of the left arm containing HML is more severely constrained than either HMR or a site on chromosome V that is similarly close to its telomere; consequently, in a diploid, two lacO arrays at this position only rarely come close enough so that the two LacI-GFP spots cannot be distinguished. In contrast, in MAT a _/mat_Δ RE+/RE+ cells, the lacO arrays become exceptionally mobile, with frequent pairings of the GFP spots. In fact, the freedom of movement of the lacO arrays on the left arm of chromosome III, as determined from MSD plots (Fig. 4), is significantly greater than that observed at HMR or on chromosome V. Thus, the RE exerts a profound influence on the localization and mobility of the left arm of chromosome III. Recently, we showed that the activity of RE depends on the binding of the transcription activator Fkh1p and that an array of Fkh1p binding sites is sufficient to activate HML (Sun et al., 2002). We suggest that Fkh1p interacts with other sites on the left arm of chromosome III; these sites would act to tether the left arm, perhaps to the nuclear envelope, and constrain its movement. Fkh1p interaction with these sites would then free the left arm to be more mobile within the nucleus.
It should be noted that all chromosome regions are constrained in their motion (Marshall et al., 1997; Heun et al., 2001). The left arm of chromosome III is exceptional because it goes from being more severely constrained (in MAT a _/mat_Δ reΔ/reΔ) to becoming more mobile (in MAT a _/mat_Δ RE+/RE+) than the other loci that we and others have examined (Fig. 4). In contrast, deletion of the RE in diploid MAT a/_mat_Δ cells did not significantly affect the behavior of the GFP-tagged _HMR_-distal loci. It is important to point out that in haploid cells undergoing MAT switching, the right arm donor is used ∼90% of the time in both _MAT_α cells and MAT a reΔ cells. Interestingly, we observe a mating-type dependence in the distribution of distances between the tagged allelic loci near HMR, which would be consistent with an increased mobility of HMR to pair with MAT in _MAT_α cells (Fig. 3 B). Thus, although the primary control of MAT donor preference lies with the way RE controls the accessibility of the left-arm donor, there may also be a mating type–dependent, but RE-independent, control on the movement and/or positioning of the right arm of chromosome III.
Perhaps reflecting the changes in constraint of the left arm of chromosome III, we also find significant mating type–dependent differences in the relative positions of HML, HMR, and MAT within the nucleus (Fig. 7). This conclusion is somewhat different from that reached by Dekker et al. (2002), using a PCR-based technique to determine chromosome structure by the frequency with which various sites are close enough together to be cross-linked. In that paper, there was no apparent difference in the chromosome conformation of MAT a and _MAT_α cells, and the _MAT_-HML distance was ∼1.3–1.5 times that of MAT-HMR and HML-HMR (Dekker et al., 2002; Dekker, J., personal communication). In our case, in MAT a cells, all three loci are equidistant, and in _MAT_α, the shortest distance is between MAT and HMR and the longest is between MAT and HML. The differences between our results may be attributable to the different methods and also to the locations of the lacO and tetO arrays relative to the pairs of PCR primers used by Dekker et al. (2002). In addition, Dekker et al. (2002) examined MAT a cells that were arrested by α factor in the G1 phase whereas we used nonarrested G1 cells sampled from an exponential population.
We note one other difference between our work and that of Dekker et al. (2002). Using a direct microscopic measurement of the distances separating GFP- and CFP-tagged locations on chromosome III, we find distances that are four- to fivefold greater than those estimated by Dekker et al. (2002), who made assumptions about the length of chromosome III based on the size of a theoretical 30-nm fiber of ∼300 kb. We suggest that the yeast chromosome is likely to be more extended, so that the 100-kb distance between MAT and HMR, for example, is between 0.6 and 0.8 μm.
Nonrandom nuclear organization may account in part for the frequency of pairing of the _HML_-proximal loci in MAT a _/mat_Δ RE+/RE+ cells and the mating type–dependent differences in the configuration of MAT, HML, and HMR in haploid cells. Support for the idea that certain loci tend to be close together due to the nonrandom organization of the nucleus stems from recent advances in the visualization of chromosome dynamics and positioning in living cells. Clustering of yeast telomeres near the nuclear periphery has been correlated with telomeric end maintenance and silencing (Gasser, 2001), and in Drosophila embryos the kinetics of somatic pairing are strongly influenced by nuclear position (Fung et al., 1998). In addition, recent studies of loci found to be rearranged in malignant cells were observed to be nonrandomly close together in normal interphase mammalian cells (Marshall, 2002). It is unlikely that the observed transient associations of the left arms of chromosome III in MAT a _/mat_Δ RE+/RE+ cells represent actual recombination events, but rather, reflect a state which facilitates recombination between these loci and sites of DSBs, such as the MAT locus during MAT switching. More importantly, the data presented in this paper reveal both mating type– and RE-dependent components to nuclear organization in yeast.
Materials and methods
Yeast strains and plasmids
Yeast strains used in this paper are listed in Table I. The lacO array and LacI-GFP fusion protein have been described previously (Robinett et al., 1996; Straight et al., 1996). Derivatives of plasmids pAFS52 and pAFS59 (Straight et al., 1996) were used for chromosomal insertions of lacO arrays as follows: 1.5 kb proximal to HML (pDB042 digested with HindIII or SnaBI); 2 kb distal to HMR (pDB034-37 digested with NotI); and 12 kb from the left telomere of chromosome V (pDB065 digested with EcoRV). The LacI-GFP expression plasmid pDB030 was derived from plasmid pAFS144 (a gift from A. Straight [Harvard Medical School, Boston, MA] and A. Murray [Harvard University, Cambridge, MA]) by replacement of the HIS3 promoter with a URA3 promoter and insertion of URA3 terminator and KAN-MX2 (Wach et al., 1994) sequences 3′ to the stop codon of the LacI-GFP fusion. The tetO array and TetR-GFP fusion protein have been described previously (Michaelis et al., 1997). Chromosomal insertion of a tetO array 2 kb distal to MAT was obtained by transformation with BamHI–XbaI-digested pDB045 (derived from pXH124, a gift from X. He and P. Sorger, Massachusetts Institute of Technology, Cambridge, MA). The TetR-(CFP)3 fusion construct was derived from plasmid pRSETB-ECFP (a gift from R. Tsien, University of California, San Diego, La Jolla, CA) by tandem insertions of NheI–BglII fragments bearing the ECFP ORF into the expression plasmid pDB047. Expression of LacI-GFP and TetR-GFP was achieved from the URA3 promoter by chromosomal integration of NheI-linearized plasmid pDB030 at the HIS3 locus and EcoRV-linearized plasmid pC3524 (a gift from K. Nasmyth, Research Institute of Molecular Pathology, Vienna, Austria; Michaelis et al., 1997) at the LEU2 locus, respectively. Expression of TetR-(CFP)3 was achieved from the URA3 promoter by chromosomal integration of an Acc65I–SalI fragment of plasmid pDB075 at the ADE1 locus. Homologous integrations were confirmed by Southern blotting and/or PCR.
Table I. S. cerevisiae strains used in this paper.
| Strain | Genotype |
|---|---|
| YDB072 | ho HML_α hmlprox::lacO(256)-LEU2 MAT_α HMR_α_-B ade1 leu2 lys5 trp1 ura3-52 HIS3::URA3pro::LacI- GFP-(KAN-MX) |
| YDB076 | _ho HML_α hmlprox::lacO(256)-LEU2 MAT a HMR_α_-B ade1 ade3::GAL-HO leu2 trp1::hisG ura3-52 |
| YDB078 | YDB072 X YDB076 |
| YDB090 | Same as YDB078 except MAT_α/mat_ a ::URA3 |
| YDB091 | Same as YDB078 except MAT_α/mat_ a ::URA3 |
| YDB092 | Same as YDB078 except mat_α::URA3/MAT_ a |
| YDB093 | Same as YDB078 except mat_α::URA3/MAT_ a |
| YDB111 | ho HML_α hmlprox::lacO(256)-LEU2 MAT_α matdist::tetO(112)-NAT1 HMR a ade1 trp1 ura3 leu2::TetR- GFP-(LEU2) HIS3::URA3pro::LacI-GFP-(KAN-MX) ade3::GAL-HO |
| YDB112 | Same as YDB111 except MAT a |
| YDB140 | Same as YDB090 except re::ADE1/re::HPH1 |
| YDB141 | Same as YDB091 except re::ADE1/re::HPH1 |
| YDB142 | Same as YDB092 except re::ADE1/re::HPH1 |
| YDB143 | Same as YDB093 except re::ADE1/re::HPH1 |
| YDB181 | YDB186 X YDB187 |
| YDB182 | Same as YDB181 |
| YDB186 | _ho HML_α _MAT_α HMR_α_-B hmrdist::lacO(100)-ADE1 ade1 leu2 trp1 ura3-52 |
| YDB187 | ho HML_α MAT a HMR_α_-B hmrdist::lacO(100)-ADE1 ade1 leu2 trp1 ura3-52 ade3::GAL-HO HIS3:: URA3pro::LacI-GFP-(KAN-MX)_ |
| YDB191 | Same as YDB181 except _mat_α::URA3/MAT a |
| YDB192 | Same as YDB181 except _MAT_α/mat a::URA3 |
| YDB194 | Same as YDB182 except _MAT_α/mat a::URA3 |
| YDB205 | ho HML_α MAT a HMR_α_-B ade1 leu2 trp1:hisG ura3-52 chrV-L::lacO(256)-TRP1 HIS3::URA3pro::LacI- GFP-(KAN-MX) ade3::GAL-HO_ |
| YDB206 | _ho HML_α _MAT_α HMR_α_-B ura3 ade1 leu2 lys5 trp1 ura3-52 chrV-L::lacO(256)-TRP1 |
| YDB210 | YDB205 X YDB206 |
| YDB214 | Same as YDB210 except _mat_α::URA3/MAT a |
| YDB228 | ho hml::HMRa-URA3 MATa matdist::tetO(112)-NAT1 HMRa trp1 ura3-52 ade1 hmrdist::lacO(100)- ADE1 leu2::TetR-GFP-(LEU2) HIS3::URA3pro::LacI-GFP-(KAN-MX) ade3::GAL-HO |
| YDB229 | Same as YDB228 except _MAT_α |
| YDB238 | Same as YDB210 except _MAT_α/mat a::URA3 |
| YDB239 | Same as YDB228 (YDB229 switched to MAT a by induction of GAL-HO) |
| YDB242 | ho HML_α hmlprox::lacO(256)-LEU2 MAT_α matdist::tetO(112)-NAT1 HMR_α_-B trp1 ura3-52 hmrdist::lacO(100)-ADE1 HIS3::URA3pro::LacI-GFP-(KANMX) ade1::TetR-(ECFP)3-(HPH1) |
| YDB243 | ho HML_α hmlprox::lacO(256)-LEU2 MAT a matdist::tetO(112)-NAT1 HMR a ura3-52 trp1 hmrdist:: lacO(100)-ADE1 HIS3::URA3pro::LacI-GFP-(KAN-MX) ade1_::TetR-(ECFP)3-(HPH1) ade3::GAL-HO |
| YDB248 | Same as YDB191 except re::HPH1/re::NAT1 |
Diploid strains with haploid mating-types were obtained by deletion of either _MAT_a or _MAT_α with the URA3 gene by transformation with HindIII-digested plasmid pJH526/GRMAT1-PU3A (a gift from J. Strathern, National Cancer Institute–Frederick Cancer Research and Development Center, Frederick, MD). Deletion of the RE was obtained by transformation of strains with BamHI–SphI-digested plasmid pXWu108 (Wu and Haber, 1996), and/or a mixed PCR product obtained by amplification of the HPH1 gene from plasmid pAG32 or the NAT1 gene from plasmid pAG25 (Goldstein and McCusker, 1999) flanked by 50 bp of chromosome III–homologous sequence using the following pair of oligonucleotides: RE-MX18-S1 5′-ATCCCATTTGTATCGTATTGCAGAAAACTTCTCTACCGCGACTAGACGATGCATAGGCCACTAGTGGATCTG-3′ and RE-MX19-A1 5′-TGCCAAT-CACCTCTATTGAGTTAAATCTAACTACAAACTGAAGCAGAATGAGTCAGCTGAAGCTTCGTACGC-3′.
Fluorescence microscopy of fixed cells
To obtain accurate distance measurements between nuclear foci in intact cells, cells from exponentially growing cultures in yeast extract-peptone-dextrose (YPD, rich medium) were fixed by direct addition of PFA (2% final concentration) to 1-ml samples of cultures for 10 min at RT, pelleted, washed for 10 min in 0.1 M potassium phosphate, pH 6.6, pelleted again, and resuspended in 50 μl of fresh potassium phosphate. Fixed cells were maintained at 4°C before imaging at RT (25°C). Cell size was consistent among strains imaged, as determined by the ability of cells to fit within an imaging window of fixed dimensions.
Images of fixed cells were acquired with a CoolSnapHQ (Photometrics) camera mounted onto a DeltaVision™ (Applied Precision) optical sectioning microscope on a TE200 base (PlanApo 100X, 1.4 NA objective lens; Nikon; He et al., 2001; Muhlemann et al., 2001; Rines et al., 2002). Data sets were obtained as 16–20 optical sections per wavelength spaced 0.2 μm apart along the Z-axis using Chroma 86002 JP4 (CFP) and/or 41017 (GFP) filters. Out of focus information was removed using a constrained iterative deconvolution algorithm (Agard et al., 1989; softWoRx™; Applied Precision). Distance measurements between nuclear foci were calculated from 3D coordinates of the center of intensity of each focus using the FindPoints and Distance components of the Image Visualization Environment Priism software program (Chen et al., 1996).
For MAT switching experiments, yeast strains were cultured in YPD (rich medium) at 30°C for 10–12 h, resuspended in fresh yeast extract-peptone medium containing 2% raffinose at 1 × 10⁶ cells/ml, and grown overnight at 30°C to a density of 1–2 × 10⁷ cells/ml. A sample of uninduced cells was removed and galactose was added (2% final concentration) to the remaining culture to induce the HO endonuclease. Glucose was added (2% final concentration) to turn off expression of HO after 30 min. Samples of uninduced and induced cells were fixed in PFA. The frequency of cells with one or two visible GFP spots was scored from 50 nuclei per strain for each time point using an BX41 fluorescence microscope (UplanFl 100X, 1.3 NA objective lens; Olympus) with a Chroma 41017 (GFP Bandpass) filter.
Live-cell fluorescence microscopy
Live-cell imaging was performed using a DeltaVision™ deconvolution microscopy system as described for fixed cells as well as on an IX70 base (PlanApo 100X, 1.4 NA objective lens; Olympus) with a Quantix (Photometrics) camera and a FITC filter. Yeast strains were cultured in YPD (rich medium) to mid-log phase, resuspended in fresh medium, and spotted onto depression slides containing 1.2% agarose in synthetic complete dextrose medium supplemented with a complete mixture of amino acids, 20 μg/ml of additional adenine, and 2% dextrose as described previously (He et al., 2001; Rines et al., 2002). Data sets were acquired at RT (25°C) as 16–20 optical sections (0.2 μm apart) every 30 s for a total of 20 min per nucleus. Viability of strains under these conditions was confirmed by the cells' ability to undergo successful mitotic division. A total of at least 328 images were obtained from 8–17 independent nuclei per strain. Images were deconvolved and distance measurements obtained as described for fixed cells. MSD values were obtained from distance data using a statistics program (model 10.51 Xtra; MiniTab Inc.).
Acknowledgments
This work would not have been possible without the generosity and expert technical support of Daniel Rines and Peter Sorger. We also thank Xiangwei He, Caroline Mock-Casagrande and Melissa Moore (Brandeis University), John Sedat (University of California, San Francisco, CA), Aaron Straight, and Roger Tsien for generously providing reagents and/or technical assistance, and members of the Haber and Sedat labs for invaluable discussions.
This work was supported by National Institutes of Health grant GM20056 to J.E. Haber and the American Cancer Society – Virginia Cochary Award for Excellence in Breast Cancer Research to D.A. Bressan.
Julio Vazquez's present address is Fred Hutchinson Cancer Research Center, P.O. Box 19024, DE-512, Seattle, WA 98109-1024.
Abbreviations used in this paper: 3D, three-dimensional; DSB, double-strand break; LacI, lactose repressor; lacO, lactose operator; MAT, mating-type gene; MSD, mean-squared change in distance; RE, recombination enhancer; tetO, tetracycline operator; TetR, tetracycline repressor; YPD, yeast extract-peptone-dextrose.
References
- Agard, D.A., Y. Hiraoka, P. Shaw, and J.W. Sedat. 1989. Fluorescence microscopy in three dimensions. Methods Cell Biol. 30:353–377. [DOI] [PubMed] [Google Scholar]
- Belmont, A.S. 2001. Visualizing chromosome dynamics with GFP. Trends Cell Biol. 11:250–257. [DOI] [PubMed] [Google Scholar]
- Chen, H., D.D. Hughes, T.A. Chan, J.W. Sedat, and D.A. Agard. 1996. IVE (Image Visualization Environment): a software platform for all three-dimensional microscopy applications. J. Struct. Biol. 116:56–60. [DOI] [PubMed] [Google Scholar]
- Dekker, J., K. Rippe, M. Dekker, and N. Kleckner. 2002. Capturing chromosome conformation. Science. 295:1306–1311. [DOI] [PubMed] [Google Scholar]
- Fung, J.C., W.F. Marshall, A. Dernburg, D.A. Agard, and J.W. Sedat. 1998. Homologous chromosome pairing in Drosophila melanogaster proceeds through multiple independent initiations. J. Cell Biol. 141:5–20. [DOI] [PMC free article] [PubMed] [Google Scholar]
- Gasser, S.M. 2001. Positions of potential: nuclear organization and gene expression. Cell. 104:639–642. [DOI] [PubMed] [Google Scholar]
- Goldstein, A.L., and J.H. McCusker. 1999. Three new dominant drug resistance cassettes for gene disruption in Saccharomyces cerevisiae. Yeast. 15:1541–1553. [DOI] [PubMed] [Google Scholar]
- Haber, J.E. 1998. Mating-type gene switching in Saccharomyces cerevisiae. Annu. Rev. Genet. 32:561–599. [DOI] [PubMed] [Google Scholar]
- He, X., D.R. Rines, C.W. Espelin, and P.K. Sorger. 2001. Molecular analysis of kinetochore-microtubule attachment in budding yeast. Cell. 106:195–206. [DOI] [PubMed] [Google Scholar]
- Heun, P., T. Laroche, K. Shimada, P. Furrer, and S.M. Gasser. 2001. Chromosome dynamics in the yeast interphase nucleus. Science. 294:2181–2186. [DOI] [PubMed] [Google Scholar]
- Klar, A.J., J.B. Hicks, and J.N. Strathern. 1982. Directionality of yeast mating-type interconversion. Cell. 28:551–561. [DOI] [PubMed] [Google Scholar]
- Marshall, W.F. 2002. Order and disorder in the nucleus. Curr. Biol. 12:R185–R192. [DOI] [PubMed] [Google Scholar]
- Marshall, W.F., A. Straight, J.F. Marko, J. Swedlow, A. Dernburg, A. Belmont, A.W. Murray, D.A. Agard, and J.W. Sedat. 1997. Interphase chromosomes undergo constrained diffusional motion in living cells. Curr. Biol. 7:930–939. [DOI] [PubMed] [Google Scholar]
- Michaelis, C., R. Ciosk, and K. Nasmyth. 1997. Cohesins: chromosomal proteins that prevent premature separation of sister chromatids. Cell. 91:35–45. [DOI] [PubMed] [Google Scholar]
- Muhlemann, O., C.S. Mock-Casagrande, J. Wang, S. Li, N. Custodio, M. Carmo-Fonseca, M.F. Wilkinson, and M.J. Moore. 2001. Precursor RNAs harboring nonsense codons accumulate near the site of transcription. Mol. Cell. 8:33–43. [DOI] [PubMed] [Google Scholar]
- Rines, D.R., X. He, and P.K. Sorger. 2002. Quantitative microscopy of green fluorescent protein-labeled yeast. Methods Enzymol. 351:16–34. [DOI] [PubMed] [Google Scholar]
- Robinett, C.C., A. Straight, G. Li, C. Willhelm, G. Sudlow, A. Murray, and A.S. Belmont. 1996. In vivo localization of DNA sequences and visualization of large-scale chromatin organization using lac operator/repressor recognition. J. Cell Biol. 135:1685–1700. [DOI] [PMC free article] [PubMed] [Google Scholar]
- Simon, P., P. Houston, and J. Broach. 2002. Directional bias during mating type switching in Saccharomyces is independent of chromosomal architecture. EMBO J. 21:2282–2291. [DOI] [PMC free article] [PubMed] [Google Scholar]
- Straight, A.F., A.S. Belmont, C.C. Robinett, and A.W. Murray. 1996. GFP tagging of budding yeast chromosomes reveals that protein-protein interactions can mediate sister chromatid cohesion. Curr. Biol. 6:1599–1608. [DOI] [PubMed] [Google Scholar]
- Strathern, J.N., and I. Herskowitz. 1979. Asymmetry and directionality in production of new cell types during clonal growth: the switching pattern of homothallic yeast. Cell. 17:371–381. [DOI] [PubMed] [Google Scholar]
- Sun, K., E. Coic, Z. Zhou, P. Durrens, and J.E. Haber. 2002. Saccharomyces forkhead protein Fkh1 regulates donor preference during mating-type switching through the recombination enhancer. Genes Dev. 16:2085–2096. [DOI] [PMC free article] [PubMed] [Google Scholar]
- Szeto, L., and J.R. Broach. 1997. Role of alpha2 protein in donor locus selection during mating type interconversion. Mol. Cell. Biol. 17:751–759. [DOI] [PMC free article] [PubMed] [Google Scholar]
- Szeto, L., M.K. Fafalios, H. Zhong, A.K. Vershon, and J.R. Broach. 1997. Alpha2p controls donor preference during mating type interconversion in yeast by inactivating a recombinational enhancer of chromosome III. Genes Dev. 11:1899–1911. [DOI] [PMC free article] [PubMed] [Google Scholar]
- Tanaka, K., T. Oshima, H. Araki, S. Harashima, and Y. Oshima. 1984. Mating type control in Saccharomyces cerevisiae: a frameshift mutation at the common DNA sequence, X, of the HML alpha locus. Mol. Cell. Biol. 4:203–211. [DOI] [PMC free article] [PubMed] [Google Scholar]
- Wach, A., A. Brachat, R. Pohlmann, and P. Philippsen. 1994. New heterologous modules for classical or PCR-based gene disruptions in Saccharomyces cerevisiae. Yeast. 10:1793–1808. [DOI] [PubMed] [Google Scholar]
- Weiler, K.S., and J.R. Broach. 1992. Donor locus selection during Saccharomyces cerevisiae mating type interconversion responds to distant regulatory signals. Genetics. 132:929–942. [DOI] [PMC free article] [PubMed] [Google Scholar]
- Weiss, K., and R.T. Simpson. 1997. Cell type-specific chromatin organization of the region that governs directionality of yeast mating type switching. EMBO J. 16:4352–4360. [DOI] [PMC free article] [PubMed] [Google Scholar]
- Wu, C., K. Weiss, C. Yang, M.A. Harris, B.K. Tye, C.S. Newlon, R.T. Simpson, and J.E. Haber. 1998. Mcm1 regulates donor preference controlled by the recombination enhancer in Saccharomyces mating-type switching. Genes Dev. 12:1726–1737. [DOI] [PMC free article] [PubMed] [Google Scholar]
- Wu, X., and J.E. Haber. 1995. MATa donor preference in yeast mating-type switching: activation of a large chromosomal region for recombination. Genes Dev. 9:1922–1932. [DOI] [PubMed] [Google Scholar]
- Wu, X., and J.E. Haber. 1996. A 700 bp cis-acting region controls mating-type dependent recombination along the entire left arm of yeast chromosome III. Cell. 87:277–285. [DOI] [PubMed] [Google Scholar]
- Wu, X., J.K. Moore, and J.E. Haber. 1996. Mechanism of MAT alpha donor preference during mating-type switching of Saccharomyces cerevisiae. Mol. Cell. Biol. 16:657–668. [DOI] [PMC free article] [PubMed] [Google Scholar]