Functional association between promoter structure and transcript alternative splicing (original) (raw)
Abstract
It has been assumed that constitutive and regulated splicing of RNA polymerase II transcripts depends exclusively on signals present in the RNA molecule. Here we show that changes in promoter structure strongly affect splice site selection. We investigated the splicing of the ED I exon, which encodes a facultative type III repeat of fibronectin, whose inclusion is regulated during development and in proliferative processes. We used an alternative splicing assay combined with promoter swapping to demonstrate that the extent of ED I splicing is dependent on the promoter structure from which the transcript originated and that this regulation is independent of the promoter strength. Thus, these results provide the first evidence for coupling between alternative splicing and promoter-specific transcription, which agrees with recent cytological and biochemical evidence of coordination between splicing and transcription.
Keywords: transcription, fibronectin
Transcriptional activity by RNA polymerase II (pol II) has been shown to occur in association to 20–50 discrete regions within the cell nucleus, known as nuclear speckles. The fact that these clustered domains not only concentrate Poly(A)+-RNAs, but also small nuclear ribonucleoproteins and the nonsmall nuclear ribonucleoprotein splicing factor SC35, suggests that transcription and splicing might not be independent events, but on the contrary, highly coordinated processes both at the functional and structural levels (1).
The study of fibronectin (FN) gene transcription confirmed that pre-mRNAs are constrained from free diffusion. FN transcripts are seen accumulated in elongated tracks, spatially coincident with each allele and colocalizing with speckles. Splicing of FN pre-mRNA appears to occur directly within the track, as evidenced by the fluorescence in situ hybridization detection of intron-containing transcripts in a spatially restricted region proximal to the gene. Each track can be considered as an assembly line where transcription and splicing take place sequentially, exhibiting functional and structural association (2).
These observations raise the question whether the intimate spatial association between transcription and splicing also implies influence of one process over the other. Misteli et al. (3) showed that splicing factors are recruited to restricted regions of the nucleus where transcription takes place, thus it becomes important to determine whether cell-specific regulatory transcription factors play a role in splicing. Extending these views we decided to investigate whether modifications in RNA pol II promoter architecture could influence alternative splicing of the ED I exon, which encodes a facultative type III repeat of FN (4–5). Alternative splicing of this exon varies during embryo development and aging, in different adult cell types and in proliferative processes such as healing (6). Inclusion of ED I depends on the presence of a 81-bp sequence, known as “splicing enhancer” or SE, located within the central region of the exon (7). The SE markedly stimulates the use of the suboptimal 3′ splice site of ED I through the binding of SR proteins to a nine-nucleotide purine-rich sequence (GAAGAAGAC) present in the SE (8, 9). Serine–arginine-rich (SR) proteins are a family of splicing factors characterized by the presence of a tract of serine-arginine amino acid repeats.
We report here the use of a transient expression alternative splicing assay combined with promoter swapping to demonstrate that differences in promoter structure can lead to differences in alternative splicing.
EXPERIMENTAL PROCEDURES
Plasmid Constructs and Transfections.
A 7,150-bp _Sca_I/_Bss_H II fragment of pSVEDA Tot (8) was blunt ended by fill-in and used as a vector for introducing blunt ended segments of different RNA pol II promoters: the 640-bp _Eco_RI/_Apa_I fragment of human α-1 antitrypsin promoter (10); the 1,445-bp _Hin_dIII/_Sma_I fragment of the long terminal repeat of mouse mammary tumor virus (MMTV); the −220/+44 fragment of wild-type or cyclic AMP response element (CRE)/CCAAT mutant version of human FN promoter (11); and the 691-bp _Nru_I/_Hin_dIII fragment of the immediate early cytomegalovirus (CMV) promoter, obtained from pRC/CMV (Invitrogen). Approximately 1.8 × 10⁵ human hepatoma Hep3B cells were transfected with 8 μl of lipofectamine (GIBCO/BRL) and 2 μg of plasmid DNA in 35-mm tissue culture dishes. Cells were harvested 48 hr posttransfection. Cotransfection with either pCMV–β-galactosidase (β-gal) or Rous sarcoma virus–β-gal plasmids allowed standardization of the RNA samples by transfection efficiencies: an aliquot of the cells was used to measure β-gal activity and the rest was used to prepare total RNA by a single step procedure (12).
Reverse Transcription (RT)–PCR Amplification.
Amounts of RNA corresponding to equal β-gal activity OD readings at 415 nm were used as templates for Moloney murine leukemia virus RT (300 units) in a 20 μl reaction containing 50 mM Tris⋅HCl (pH 8.3), 75 mM KCl, 3 mM Mg2Cl, 10 mM DTT, 20 units of RNasin (Promega), 400 μM dNTPs, 3 μM pdT12–18 (Pharmacia), at 35°C for 1 hr. PCR amplification was performed with 20 μM primers pSV5′j and pSV3′j (8), 1.5 mM MgCl2, 3% (vol/vol) dimethyl sulfoxide, 200 μM dNTPs, and 1.5 units of Taq polymerase. PCR consisted of 30 cycles of 45 sec at 94°C, 60 sec at 63 °C, and 30 sec at 72°C. RT-PCR products were electrophoresed in 1.8% agarose native gels and detected by ethidium bromide staining. When indicated, Southern blot analysis was performed using a 32P-labeled riboprobe corresponding to the 500-bp ED I+ RT-PCR product.
Northern Blot Analysis.
RNA samples were electrophoresed in 1% agarose formaldehyde gels. Samples were vacuum transferred to nylon filters and hybridized at 68°C in 50% (vol/vol) formamide, 7% (wt/vol) SDS, 120 mM phosphate buffer (pH 7), 250 mM NaCl, 10% (vol/vol) PEG with the riboprobe described above.
RESULTS AND DISCUSSION
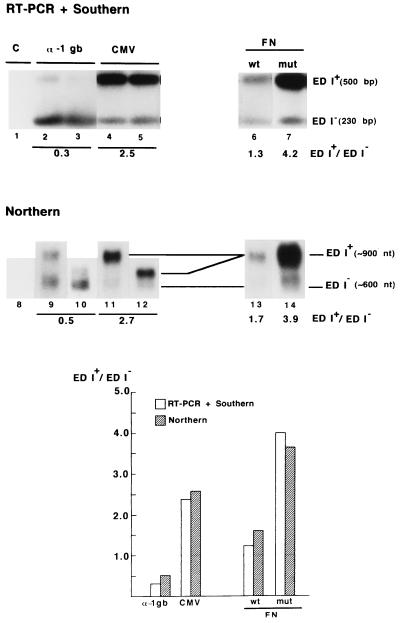
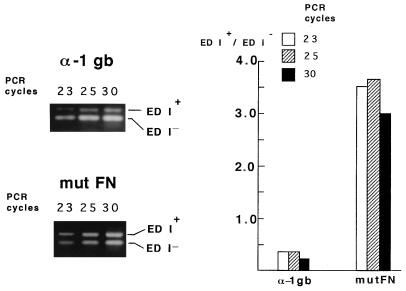
We initially prepared a construct derived from pSVEDA Tot (Fig.1), in which the α-1 globin promoter was replaced by the CMV promoter. These plasmids were transiently expressed in Hep3B cells. Cotransfection with pCMV–β-gal allowed standardization of the samples by transfection efficiency. Cells were harvested 48 hr posttransfection. An aliquot of the cells was used to measure β-gal activity and the rest was used to prepare total RNA. Amounts of RNA corresponding to equal β-gal activities were used to compare the relative proportions of the two mRNA isoforms using a RT-PCR-based method that detects only the messengers originated from the constructs and not those from the endogenous FN and globin genes (8). Fig. 2 (lanes 1–5) shows that inclusion of the ED I exon in mature mRNA was poor with the α-1 globin promoter (ED I+/ED I− ratio = 0.3) but predominant with the CMV promoter (ratio = 2.5). Replacement of the α-1 globin promoter by the liver-specific α-1 anti-trypsin promoter provoked an intermediate effect on alternative splicing (ED I+/ED I− ratio = 0.7; not shown). Results with the α-1 globin and CMV promoters shown in Fig. 2 are duplicates of transfection for each promoter construct. Although RT-PCR is not suitable to compare quantitatively total amounts of RNA from different samples, it is indeed quantitative to determine the relative proportions of ED I+ and ED I− RNAs within each single reaction, as the same pair of primers amplifies both cDNA species in a competitive way. This is evidenced by the fact that all our RT-PCR ratios were consistent with those obtained by direct mRNA analysis [Northern blot analysis, Fig. 2, lanes 8–12 (Note that Northern blots of duplicates in Fig. 2 correspond to electrophoresis runs of different lengths that allow different resolutions of the ED I+ and ED I− RNA bands)]. Further proof of the quantitative nature of the RT-PCR procedure used in this report is that the ED I+/ED I− ratio characteristic of a given promoter is not altered by the number of PCR cycles (Fig. 3).
Figure 2.
Promoter structure affects ED I alternative splicing. RT-PCR + Southern blot analysis (lanes 1–7) and Northern blot analysis (lanes 8–14) of ED I+ and ED I− mRNA isoforms produced in Hep3B cells transiently transfected with α-1 globin/FN chimaeric constructs (Fig. 1) under the control of the α-1 globin (lanes 2, 3, 9, and 10), CMV (lanes 4, 5, 11, and 12), wild-type FN (lanes 6 and 13) and CRE−/CCAAT− mutant FN (lanes 7 and 14) promoters. Duplicates of transfection are shown for the α-1 globin and CMV promoters. Northern duplicates correspond to electrophoresis runs of different lengths. Cells were cotransfected with a CMV promoter-β-gal reporter plasmid as a measure of transfection efficiency. Lane 1 is a control transfected with the β-gal plasmid and pBS SK+ (Stratagene) as carrier DNA. Quantification of scanned autoradiographs was carried out with the NIH image 1.60 software. ED I+/ED I− ratios shown at the bottom of each lane and in the histogram are the average of three experiments. A thin horizontal line in the histogram indicates an ED I+/ED I− ratio of 1.
Figure 3.
Promoter-dependent ED I+/ED I− mRNA ratios determined by RT-PCR are not influenced by the number of PCR cycles. Low and high ED I+/ED I− ratios, characteristic of the α-1 globin and mutant FN promoters, respectively, remain constant in PCRs of 23, 25, and 30 cycles.
The pre-mRNA sequences relevant to ED I alternative splicing (the ED I exon itself and the suboptimal 3′ splice site of its upstream intron) are identical in the three constructs tested. However, promoter replacements altered the transcriptional initiation sites. To exclude the possibility that the observed changes were due to differences in the initiation sites, we compared the effects on alternative splicing of two variants of a single promoter that initiate at the same position. We chose the wild-type proximal region of the human FN promoter (−220 to +44) and a mutant version in which the CRE at position −170 and the CCAAT box at position −150 have been disrupted by introducing point mutations that abolish binding of the corresponding transcription factors (11). These CRE and CCAAT sites act cooperatively in hepatic cells (11, 13) and can function either as negative or positive elements depending on the presence or absence of the simian virus 40 enhancer respectively (P.C., C.G.P., and A.R.K., unpublished results). Since the constructs in Fig. 1 contain the simian virus 40 enhancer, the mutations introduced in the CRE and CCAAT sites increase transcription. ED I splicing of transcripts of wild-type and mutant promoter bearing genes was significantly different and both of them differed from splicing of the α-globin promoted transcript (Fig. 2, lanes 6 and 7). In fact, the mutant FN promoter exhibited the highest inclusion ratio (4.2) that is 2.7-fold over that of the wild-type FN promoter and 15-fold over that of the α-1 globin promoter. Similar results were obtained when the splicing products of the transfected cells were detected directly by Northern blot analysis (Fig. 2, lanes 13 and 14).
Figure 1.
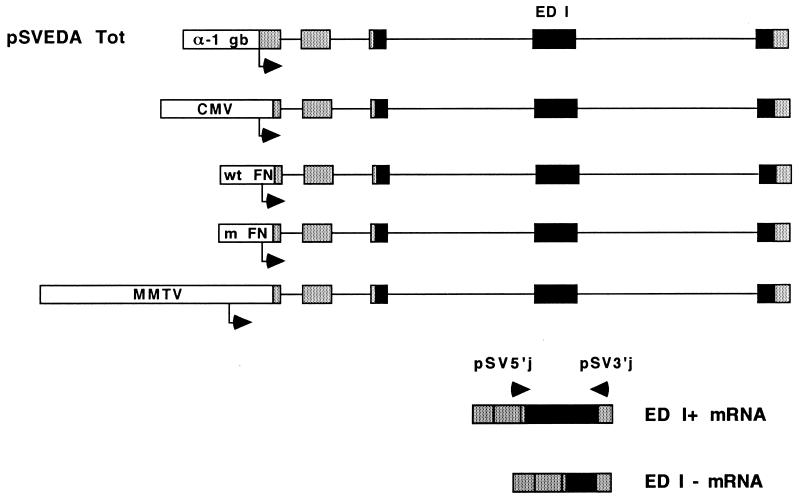
Structure of the α-1 globin-FN constructs used to transfect Hep3B cells. Globin and FN exons are depicted by shaded and solid boxes, respectively. All exons are included constitutively except for ED I, which is facultatively spliced. Arrows on mRNA indicate approximate location of primers pSV5′j and pSV3′j (8) that overlap globin/FN exon boundaries, used to detect specific mRNA products by RT-PCR (see Experimental Procedures). Promoter regions used to replace the α-1 globin promoter of pSVEDA Tot (8) are depicted in scale. Transcription start sites are indicated by arrows underneath each promoter. Distances between each start site and the _Bss_HII site used for cloning the promoters (see Experimental Procedures) are as follows: α-1 globin, 92 bp; CMV, 62 bp; wild-type and mutant (m) FN, 43 bp and MMTV, 289 bp.
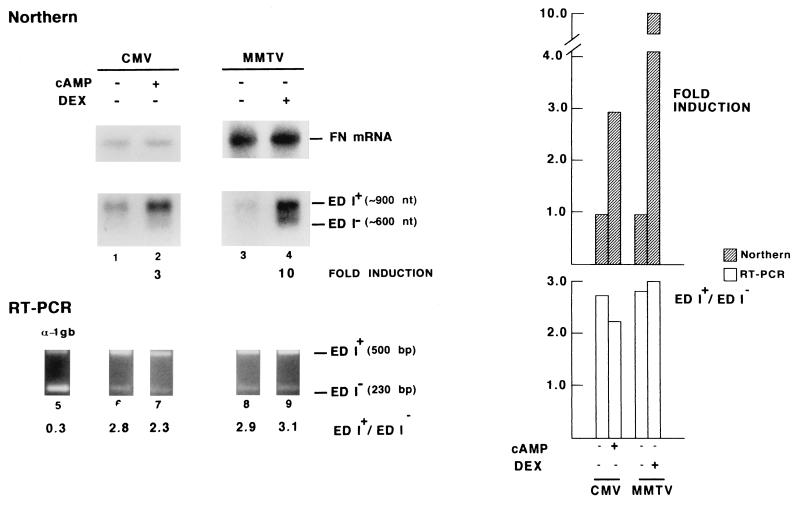
These results indicate that, besides the control exerted by splicing factors in splice site selection (14), alternative splicing is sensitive to the kind of promoter, possibly reflecting the particular arrangement of binding sites for basal and regulatory transcription factors. Indeed, only five point changes in a 220-bp promoter stretch (mutant vs. wild-type FN) were sufficient to alter significantly the splicing pattern. Previous studies suggested that the ratio of differently spliced isoforms can be affected by controlling the rate of transcription. Examples of this are reduction in the P element third intron splicing by transcriptional repression of the P element itself (15) and the effects of pausing of the RNA polymerase on pre-mRNA secondary structure (16). To test this possibility, we looked at the effect of transcriptional activation of two different promoters. We used direct RNA analysis (Northern blot) to put in evidence transcriptional activation using the amount of endogenous FN mRNA (8 kb) as internal control, while RT-PCR was used for accurate quantification of alternative splicing. Under equal transfection efficiencies, activation of the CMV promoter by cAMP (17) increased the total amount of both mRNA isoforms (Fig. 4, lanes 1 and 2) but did not alter the relative proportions characteristic to this promoter (ED I+/ED I− ≃ 2.5; Fig. 4, lanes 6 and 7). Similarly, induction with glucocorticoids of a MMTV-long terminal repeat controlling transcription of the chimaeric minigene increased both isoforms by 10-fold (Fig. 4, lanes 3 and 4), but maintained the same ratio as the noninduced state (ED I+/ED I− ≃ 3.0; Fig. 4, lanes 8 and 9). This indicates that, within these limits, abundance of pre-mRNA is not relevant to ED I splicing and that the observed differences in splicing are related to the nature rather than to the strength of the promoter.
Figure 4.
Transcriptional activation of two different promoters does not affect ED I inclusion. Northern blot analysis (lanes 1–4) and RT-PCR (lanes 5–9) of ED I+ and ED I− mRNA isoforms produced in Hep3B cells transiently transfected with α-1 globin/FN chimaeric constructs under the control of the α-1 globin (lane 5), CMV (lanes 1, 2, 6, and 7) and MMTV (lanes 3, 4, 8, and 9) promoters. The CMV promoter was activated by incubation of the transfected cells with 1 mM dibutyryl cAMP for 48 hr beginning 6 hr after DNA addition (lanes 2 and 7). Activation of the MMTV promoter (lanes 4 and 9) was achieved by cotransfection with plasmid 6RGR (29) expressing the glucocorticoid receptor and incubation with 400 ng/ml dexamethasone for 48 hr beginning 6 hr after DNA addition. Cells were cotransfected with a Rous sarcoma virus (RSV) promoter-β-gal reporter plasmid to assess transfection efficiencies. Transfection and quantification conditions were as in Fig. 2. Hybridization to FN mRNA (8 kb) is shown as internal control.
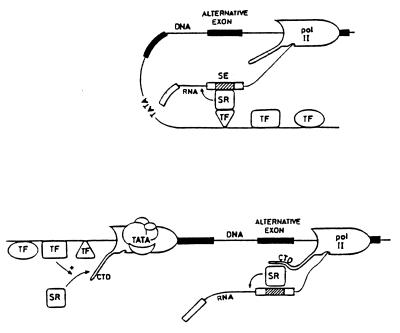
Our results suggest physical interactions between components of the transcription and splicing machineries resulting in modulation of alternative splicing, a process of utmost importance in cell differentiation and development (18). Previous observations support this hypothesis. Splicing in vivo seems to be strictly dependent on RNA pol II promoters. In fact, if an intron-bearing gene is put under the control of the RNA pol III promoter, the transcripts produced are not spliced (19). Coordination of pol II transcription with RNA processing is supported by cytological (1–3) and biochemical studies (20–22). A physical association of the highly phosphorylated form of RNA pol II large subunit with spliceosomes has been demonstrated (20). The repetitive C-terminal domain (CTD) of pol II has been proposed to function in mRNA processing due to its ability to interact with positively charged SR proteins (21, 23). These general splicing factors do not necessarily bind RNA when acting in constitutive splicing. However, they are recruited to weak splicing sites through binding to splicing enhancers, which stimulates inclusion of alternative exons (14). Tethering of the SR protein ASF/SF2 by the ED I splicing enhancer (24) is essential for ED I inclusion (8, 9). This renders ASF/SF2 an obvious candidate for the interactions with the transcription apparatus implied by our results. Fig. 4 depicts two putative models for this interaction. At the top, the SR protein contacts a transcription factor positioned in the promoter concomitantly with transcript processing. At the bottom, a transcription factor interacting with the initiation complex promotes loading of SR proteins on the pol II moving complex. Specific promoter occupation could determine, for instance, the extent of CTD phosphorylation that modulates this interaction. The second model is strongly supported by recent findings of McCracken et al. (22) who showed that the CTD is required for efficient RNA splicing, 3′ end processing and transcriptional termination. While the role of CTD phosphorylation in transcriptional regulation remains controversial (25), the existence of a CTD-dependent mRNA “factory” (22) that carries out coupled transcription, splicing, and cleavage-polyadenylation of mRNA precursors is in good agreement with our findings. Though the influence of naturally occurring alternative promoters on 3′ end processing has been documented before (26, 27), the novelty of our observation is that alternative splicing of an internal exon is tightly coupled to promoter architecture.
Our results predict that factors that regulate alternative splicing may be acting through promoters and that cell specific alternative splicing may not simply result from the differential abundance of ubiquitous SR proteins (28) but from a more complex process involving cell-specific promoter occupation.
Figure 5.
Two alternative models for putative interactions between SR proteins bound to the ED I splicing enhancer (SE, hatched box) with transcription proteins. (Upper) SR protein activity is modulated by interaction with a regulatory transcription factor (TF) positioned on its cognate promoter site at the time splicing occurs. (Lower) Regulatory transcription factors interacting with the initiation complex promote loading of SR proteins (or other splicing factors) onto the moving RNA pol II complex.
Acknowledgments
We thank K. Yamamoto for the glucocorticoid receptor plasmid, M. Caputi for advice, Demián Cazalla, and Norberto Malarini for helpful assistance. This work was supported by grants from the International Centre for Genetic Engineering and Biotechnology, the Fundación Antorchas, the University of Buenos Aires, and the Fogarty International Research Collaborative Award (National Institutes of Health R03 TW00717–01). P.C. and C.G.P. are recipients of fellowships from the University of Buenos Aires. A.R.K. is a career investigator of the Consejo Nacional de Investigaciones Científicas y Técnicas of Argentina.
ABBREVIATIONS
FN
fibronectin
MMTV
mouse mammary tumor virus
CMV
cytomegalovirus, β-gal, β-galactosidase
RT
reverse transcription
CTD
C-terminal domain
CRE
cyclic AMP response element
SE
splicing enhancer
SR
serine–arginine-rich
pol I
II, and III, RNA polymerases I, II, and III
References
- 1.Xing Y, Lawrence J B. Trends Cell Biol. 1993;3:346–353. doi: 10.1016/0962-8924(93)90105-a. [DOI] [PubMed] [Google Scholar]
- 2.Xing Y, Johnson C V, Dobner P R, Lawrence J B. Science. 1993;259:1326–1330. doi: 10.1126/science.8446901. [DOI] [PubMed] [Google Scholar]
- 3.Misteli T, Cáceres J F, Spector D L. Nature (London) 1997;387:523–526. doi: 10.1038/387523a0. [DOI] [PubMed] [Google Scholar]
- 4.Kornblihtt A R, Vibe-Pedersen K, Baralle F E. EMBO J. 1984;3:221–226. doi: 10.1002/j.1460-2075.1984.tb01787.x. [DOI] [PMC free article] [PubMed] [Google Scholar]
- 5.Gutman A, Kornblihtt A R. Proc Natl Acad Sci USA. 1987;84:7179–7182. doi: 10.1073/pnas.84.20.7179. [DOI] [PMC free article] [PubMed] [Google Scholar]
- 6.Kornblihtt A R, Pesce C G, Alonso C R, Cramer P, Srebrow A, Werbajh S E, Muro A F. FASEB J. 1996;10:248–257. doi: 10.1096/fasebj.10.2.8641558. [DOI] [PubMed] [Google Scholar]
- 7.Mardon H J, Sebastio G, Baralle F E. Nucleic Acids Res. 1987;15:7725–7733. doi: 10.1093/nar/15.19.7725. [DOI] [PMC free article] [PubMed] [Google Scholar]
- 8.Caputi M, Casari G, Guenzi S, Tagliabue R, Sidoli A, Melo C A, Baralle F E. Nucleic Acids Res. 1994;22:1018–1022. doi: 10.1093/nar/22.6.1018. [DOI] [PMC free article] [PubMed] [Google Scholar]
- 9.Lavigueur A, La Branche H, Kornblihtt A R, Chabot B. Genes Dev. 1993;7:2405–2417. doi: 10.1101/gad.7.12a.2405. [DOI] [PubMed] [Google Scholar]
- 10.De Simone V, Ciliberto G, Hardon E, Paonessa G, Palla F, Lundberg L, Cortese R. EMBO J. 1987;6:2759–2766. doi: 10.1002/j.1460-2075.1987.tb02570.x. [DOI] [PMC free article] [PubMed] [Google Scholar]
- 11.Alonso C R, Pesce C G, Kornblihtt A R. J Biol Chem. 1996;271:22271–22279. doi: 10.1074/jbc.271.36.22271. [DOI] [PubMed] [Google Scholar]
- 12.Chomczynski P, Sacchi N. Anal Biochem. 1987;162:156–159. doi: 10.1006/abio.1987.9999. [DOI] [PubMed] [Google Scholar]
- 13.Muro A F, Bernath V A, Kornblihtt A R. J Biol Chem. 1992;267:12767–12774. [PubMed] [Google Scholar]
- 14.Chabot B. Trends Genet. 1996;12:472–478. doi: 10.1016/0168-9525(96)10037-8. [DOI] [PubMed] [Google Scholar]
- 15.Roche S E, Schiff M, Rio D C. Genes Dev. 1995;9:1278–1288. doi: 10.1101/gad.9.10.1278. [DOI] [PubMed] [Google Scholar]
- 16.Eperon L P, Graham I R, Griffiths A D, Eperon I C. Cell. 1988;54:393–401. doi: 10.1016/0092-8674(88)90202-4. [DOI] [PubMed] [Google Scholar]
- 17.Hunninghake G W, Monick M M, Liu B, Stinski M F. J Virol. 1989;63:3026–3303. doi: 10.1128/jvi.63.7.3026-3033.1989. [DOI] [PMC free article] [PubMed] [Google Scholar]
- 18.McKeown M. Annu Rev Cell Biol. 1992;8:133–155. doi: 10.1146/annurev.cb.08.110192.001025. [DOI] [PubMed] [Google Scholar]
- 19.Sisodia S S, Sollner-Webb B, Cleveland D W. Mol Cell Biol. 1987;7:3601–3612. doi: 10.1128/mcb.7.10.3602. [DOI] [PMC free article] [PubMed] [Google Scholar]
- 20.Vincent M, Lauriault P, Dubois M-F, Lavoie S, Besaude O, Chabot B. Nucleic Acids Res. 1996;24:4649–4652. doi: 10.1093/nar/24.23.4649. [DOI] [PMC free article] [PubMed] [Google Scholar]
- 21.Yuryev A, Patturajan M, Litingtung Y, Joshi R V, Gentile C, Gebara M, Corden J L. Proc Natl Acad Sci USA. 1996;93:6975–6980. doi: 10.1073/pnas.93.14.6975. [DOI] [PMC free article] [PubMed] [Google Scholar]
- 22.Mc Cracken S, Fong N, Yankulov K, Ballantyne S, Pan G, Greenblatt J, Patterson S D, Wickens M, Bentley D. Nature (London) 1997;385:357–361. doi: 10.1038/385357a0. [DOI] [PubMed] [Google Scholar]
- 23.Greenleaf A. Trends Biochem Sci. 1993;18:117–119. doi: 10.1016/0968-0004(93)90016-g. [DOI] [PubMed] [Google Scholar]
- 24.Tacke R, Manley J L. EMBO J. 1995;14:3540–3551. doi: 10.1002/j.1460-2075.1995.tb07360.x. [DOI] [PMC free article] [PubMed] [Google Scholar]
- 25.Makela T P, Parvin J D, Kim J, Huber L J, Sharp P A, Weinberg R. Proc Natl Acad Sci USA. 1995;92:5174–5178. doi: 10.1073/pnas.92.11.5174. [DOI] [PMC free article] [PubMed] [Google Scholar]
- 26.Bermingham J R, Jr, Scott M P. EMBO J. 1988;7:3211–3222. doi: 10.1002/j.1460-2075.1988.tb03188.x. [DOI] [PMC free article] [PubMed] [Google Scholar]
- 27.Bergers G, Reikerstorfer A, Braselmann S, Graninger P, Busslinger M. EMBO J. 1994;13:1176–1188. doi: 10.1002/j.1460-2075.1994.tb06367.x. [DOI] [PMC free article] [PubMed] [Google Scholar]
- 28.Cáceres J F, Stamm S, Helfman D M, Krainer A R. Science. 1994;265:1706–1709. doi: 10.1126/science.8085156. [DOI] [PubMed] [Google Scholar]
- 29.Godowski P J, Picard D, Yamamoto K R. Science. 1988;241:812–816. doi: 10.1126/science.3043662. [DOI] [PubMed] [Google Scholar]
