Oxidative stress by tumor-derived macrophages suppresses the expression of CD3 ζ chain of T-cell receptor complex and antigen-specific T-cell responses (original) (raw)
Abstract
One of the important mechanisms of immunosuppression in the tumor-bearing status has been attributed to the down-modulation of the CD3 ζ chain and its associated signaling molecules in T cells. Thus, the mechanism of the disappearance of CD3ζ was investigated in tumor-bearing mice (TBM). The decrease of CD3ζ was observed both in the cell lysate and intact cells. Direct interaction of T cells with macrophages from TBM (TBM-macrophages) induced the decrease of CD3ζ, and depletion of macrophages rapidly restored the CD3ζ expression. We found that treatment of such macrophages with_N_-acetylcysteine, known as antioxidant compound, prevented the decrease of CD3ζ. Consistent with this result, the addition of oxidative reagents such as hydrogen peroxide and diamide induced the decrease of CD3ζ expression in T cells. Consequently, the loss of CD3ζ resulted in suppression of the antigen-specific T-cell response. These results demonstrate that oxidative stress by macrophages in tumor-bearing status induces abnormality of the T-cell receptor complex by cell interactions with T cells. Therefore, our findings suggest that oxidative stress contributes to the regulation of the expression and function of the T-cell receptor complex.
Keywords: immunosuppression, _N_-acetylcysteine, reactive oxygen intermediates, redox regulation, T lymphocytes
There has been great progress in the study of immunity against tumor by identification and cloning of tumor antigens (1–4) and by elucidation of the function of T-cell costimulation for antitumor responses (5–7). In spite of these advances for helping antitumor immune responses, it is known that T cells from cancer patients or tumor-bearing mice (TBM) are in a suppressed state and exhibit poor immune responses. Therefore, it is most important for tumor immunity to overcome such immunosuppression in the tumor-bearing status. Several different mechanisms have accounted for this suppression, including down-regulation of growth factors (8, 9), production of immunosuppressive cytokines (8–14), and contributions by suppressive macrophages and suppressive T cells (13, 15, 16). Recently, it has been shown that T cells from patients with advanced cancer or TBM have abnormal structure of the T-cell receptor (TCR)–CD3 complex, particularly the disappearance of the CD3 ζ chain (17–22). The disappearance of CD3ζ in tumor-bearing status appears to be related to the proliferative response of T cells (17), and the degree of the decrease of CD3ζ seems to be correlated with the progression of tumor in cancer patients (18–20, 22) and TBM (21).
We have shown (21) that the disappearance of CD3ζ was due to the regulation at the protein level and was induced by interaction with macrophage (MØ)-like cells accumulated in the spleen of TBM. We found that these MØs were the same cells that have been known for a long time as “suppressive macrophages” in tumor-bearing status. These MØs secrete various immunosuppressive cytokines such as tumor necrosis factor, transforming growth factor β, interleukin 6, and prostaglandin (9, 12–14, 23). In addition, these cells also express a down-regulated level of major histocompatibility complex class II on the cell surface, exhibit poor antigen presentation, and elicit a poor autologous mixed lymphocyte reaction (11, 16, 18, 24).
The induction mechanism of the decrease of CD3ζ by such MØs as well as the mechanism of its disappearance in T cells is not known. It has been proposed that the reduction of CD3ζ in these experiments was due to in vitro degradation during the preparation of cell lysates of T-cell-enriched population containing these macrophages/monocytes (25–27). However, we herein show clearly in carefully controlled experiments that the decrease of the CD3 ζ chain takes place within intact T cells. Furthermore, from the findings that_N_-acetylcysteine (NAC) blocked and oxidants such as hydrogen peroxide induced the decrease of CD3ζ, we demonstrated that the decrease of the CD3 ζ chain is mediated through oxidative stress by macrophages in tumor-bearing status.
MATERIALS AND METHODS
Reagents.
NAC, _N_-acetylserine (NAS), diamide, and phorbol 12-myristate 13-acetate (PMA) were purchased from Sigma. A23187, hydrogen peroxide, and 3-aminopropyltriethoxysilane were from Calbiochem–Novabiotechem (San Diego), Santoku Chemical Industries (Tokyo), and Aldrich, respectively. Chicken ovalbumin (OVA) peptide containing residues 323–339 [OVA-(323–339)] was synthesized as described (28).
Mice.
Six- to 8-week-old female BALB/c mice were purchased from Japan SLC (Hamamatsu, Japan). TBM were prepared as described (21). Briefly, 2 × 10⁶ syngenic colon carcinoma cells (colon 26) were inoculated s.c. into 7- to 10-week-old BALB/c mice. These mice bore a solid tumor approximately 30 mm in diameter at 9–12 weeks after inoculation. TCR transgenic mice (DO-Tg) bearing the TCR of OVA-(323–339)-peptide-specific T-cell hybridoma DO11.10 were provided by D. Y. Loh (Nippon Roche Research Instiute, Kamakura, Japan). The expression of TCR transgenes in the offsprings of DO-Tg was analyzed by staining with anti-CD4 mAb and anti-clonotypic mAb KJ1.26 (provided by P. Marrack, National Jewish Center for Immunology and Respiratory Medicine, Denver).
Cell Preparation.
Splenic T cells were purified through a nylon-wool column (21). The purity of T cells is about 80% for normal T cells and 40% for T cells from 8- to 12-week TBM on flow cytometry (FACS) analysis. Non-T, non-B cells from TBM-spleen cells (TBM-MØs) were prepared as described (21). Briefly, erythrocyte-free splenocytes from TBM were depleted of T cells by treatment with anti-Thy1 mAb (J1j.10) and complement and of B cells with magnetic beads bound to goat anti-mouse IgG antibodies. For coculture system, after 1 × 10⁷ T cells and 5 × 10⁶ TBM-MØs were preincubated in 1 ml of 5% fetal calf serum/RPMI 1640 medium for 30 min at 37°C, they were mixed for 5 min. Their separation was done with a pore membrane (0.4-μm pore size, Biopore membrane, Millipore). For activated macrophages, mice were inoculated intraperitoneally with thioglycolate, followed by injection with 20 μg of lipopolysaccharide (LPS) (0127:B8, Sigma) 1 week later, and the peritoneal macrophages were isolated 2 days later.
Flow Cytometric Analysis of Intracellular Staining.
Cells were washed with PBS, fixed with 3% paraformaldehyde in PBS for 7 min, permeabilized with 0.5% Triton X-100 for 10 min, and then washed in PBS. Fixed and permeabilized cells were incubated in 3% BSA/PBS for 30 min and then with streptavidin (GIBCO/BRL; 10 μg/ml) in PBS for another 30 min to block nonspecific binding and endogenous biotin, respectively (29). The cells were washed twice in PBS and incubated with 200 μM biotin (GIBCO/BRL) in PBS. To block Fc receptor, the cells were incubated with anti-FcγRII/III mAb, 2.4G2. After washing in PBS, the cells were stained with specific mAb, followed by in streptavidin-phycoerythrin (PE) or fluorescein isothiocyanate (FITC)-labeled goat anti-hamster mAb. The antibodies used were biotinylated anti-CD3ɛ mAb (10 μg/ml; 2C11), biotinylated anti-CD3ζ mAb (10 μg/ml; H146.698A), nonbiotinylated anti-CD3ζ mAb, and FITC-labeled anti-Thy1.2 mAb (CD90; PharMingen) for 45 min. All steps were performed at 4°C. Cells were analyzed on a FACScan flow cytometer usingcell quest software (Becton Dickinson).
Analysis with Confocal Microscopy.
Cells were washed with ice-cold PBS, allowed to adhere to glass coverslips pretreated with 2% 3-aminopropyltriethoxysilane (30), and then fixed in 3% paraformaldehyde for 7 min at room temperature, as described (31). After permeabilization with 0.5% Triton X-100, they were incubated in 3% BSA/PBS. CD3ɛ was stained with anti-CD3ɛ mAb (145–2C11) and FITC-conjugated goat-anti-hamster antibody. After blocking with hamster Ig, CD3ζ was then analyzed by biotinylated anti-CD3ζ mAb (H146.698A), followed by staining with quantum red-streptavidin. The coverslips were mounted in aqueous mounting medium (PermaFluor, Lipshaw, Pittsburgh). Double color immunofluorescence analysis was performed by using LSM410 (Zeiss).
Immunoprecipitation and Western Blot Analysis.
Approximately 5 × 10⁷ nylon-purified splenic T cells were preincubated in PBS at 37°C for 15 min and then cultured with or without 50 mM hydrogen peroxide or cocultured with 5 × 10⁷ TBM-MØs for 15 min. After washed, cells were lysed in ice-cold lysis buffer containing 1% Nonidet P-40, 50 mM Tris·HCl (pH 7.6), 150 mM NaCl, 5 mM EDTA, 1 mM phenylmethylsulfonyl fluoride, leupeptin (10 μg/ml), aprotinin (10 μg/ml), antipain(2.5 μg/ml), chymostatin (2.5 μg/ml), pepstatin (10 μg/ml), and 10 mM iodoacetamide at 4°C for 30 min. Postnuclear supernatants were precleared with protein A-Sepharose and immunoprecipitated with anti-CD3ζ mAb (H146.698A) or anti-CD3ζ/η polyclonal antiserum (antiserum 387, from A. Weissman, National Institutes of Health). Immunoprecipitates were separated by SDS/PAGE on a 13% gel under reducing condition and transferred onto a poly(vinylidene difluoride) membrane (Immobilon-P, Millipore). The membrane was blocked in 10% skim milk-containing buffer (Block Ace; Yukijirushi, Sapporo, Japan) and incubated with anti-CD3ζ mAb (10 μg/ml) or anti-CD3ζ/η polyclonal antiserum at 1:500 dilution, respectively. Proteins were visualized with peroxidase-conjugated rabbit anti-mouse Ig antibody (Amersham) by using ECL system (Amersham).
Proliferation Assay.
Approximately 1 × 10⁵ nylon-purified splenic T cells from DO-Tg mice were cultured with 5 × 10⁵ irradiated (3000 rads; 1 rad = 0.01 Gy) T-cell-depleted BALB/c splenocytes as antigen-presenting cells and 0.01 μM OVA-(323–339) in the presence of irradiated TBM-MØs at graded T-cell/TBM-MØ ratios in 200 μl of a complete RPMI 1640 medium (Nikken-Seibutsu-Igaku-Kenkyujo, Kyoto) supplemented with 10% fetal calf serum, 2 mM glutamine, kanamycin (100 μg/ml), and 5 × 10⁻⁵ M 2-mercaptoethanol for 48 hr at 37°C, 5% CO2/95% air. Cells were also stimulated with PMA (5 ng/ml) and A23187 (100 ng/ml). Cells were cultured for 24 hr at 37°C, pulse-labeled with 37 kBq of [3H]thymidine (37 Mbq/ml, Amersham) for the last 8 hr, and then harvested. [3H] uptake was measured with a MicroBeta liquid scintillation counter (Wallac, Gaithersburg, MD). All assays were performed in triplicate.
RESULTS
The Loss of CD3 ζ Chain Within Splenic T Cells of TBM.
As we described (21), the CD3 ζ chain in splenic T cells of TBM disappeared without altering the expression of other components of the TCR complex. We have shown that this disappearance occurred by the interaction with MØs accumulated in the spleen of TBM (21). These results were obtained by immunoprecipitation of the cell lysate from the mixture of T cells and TBM-MØs. However, it has been argued that the loss of CD3ζ is mediated in vitro by proteases derived from the contaminated MØs (25, 26). To address this issue, we analyzed the CD3ζ expression within T cells in TBM by confocal microscopy and FACS without solubilizing the cells.
As shown in Fig. 1, whereas normal T cells were intracellularly stained for both CD3ɛ and CD3ζ, the T-cell-enriched population from the TBM spleen showed the specific loss of CD3ζ without altering the CD3ɛ expression by confocal microscopy. Furthermore, coculture of normal T cells with TBM-MØs for only 5 min resulted in the disappearance of CD3ζ (Fig. 1). The decrease of CD3ζ within T cells was also shown by FACS analysis. T cells in the TBM spleen were stained for Thy-1 and CD3 by two-color analysis (Fig. 2A). In this analysis, T cells were separated from macrophages by staining and showed the reduction of CD3ζ in TBM T cells. Furthermore, the CD3ζ expression decreased by mixing normal T cells with TBM-MØs in a cell-number-dependent manner (Fig. 2B). The specificity of the intracellular staining of CD3ζ was confirmed by the demonstration that splenic T cells from CD3ζ-knockout mice (32) showed background staining with anti-CD3ζ mAb (data not shown).
Figure 1.
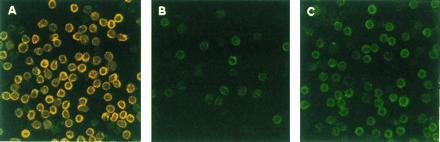
Confocal microscope analysis of the CD3ζ expression in normal splenic T cells (A), T-cell-enriched population from TBM spleen (B), and normal T cells cocultured with TBM-MØs (C). Normal T cells were purified through a nylon wool-column (A and_C_) and then cocultured with TBM-MØs (T−B− spleen cells from TBM) at a ratio of 1:1 for 5 min (C). In B, T-cell-enriched population (approximately 50% were T cells) was prepared through a nylon column. All cells were fixed, permeabilized, and stained with anti-CD3ɛ mAb and anti-CD3ζ mAb-biotin followed by FITC-goat anti-hamster Ig antibodies and quantum red-streptavidin, respectively. Stained cells were analyzed by confocal microscopy LSM410. (×375.)
Figure 2.
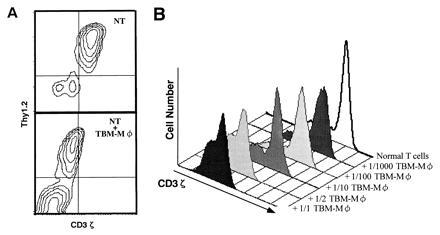
FACS analysis of the decrease of CD3ζ expression induced by TBM-MØs. (A) Two-color analysis of CD3ζ expression in normal splenic T cells in the absence (Upper) or presence (Lower) of TBM-MØs. Cells were fixed, permeabilized, and stained with anti-CD3ζ mAb-biotin followed by PE-streptavidin and anti-Thy1.2 mAb-FITC. The ratio of T cells to TBM-MØs in the coculture was 2:1. NT, normal T cells. (B) Dose-dependent decrease of CD3ζ expression in T cells by TBM-MØs. Normal purified splenic T cells were cocultured for 5 min with the indicated numbers of TBM-MØs (T−B− spleen cells from TBM). The cells were fixed, permeabilized, and stained with anti-CD3ζ mAb-biotin and PE-streptavidin. Stained cells were analyzed by FACScan.
Macrophages in a Certain Activation Stage Possess the Ability to Decrease CD3ζ.
We have characterized (21) the accumulating cells in TBM spleen and showed that they were macrophage-like cells. These cells express Mac-1 and Mac-2 but not F4-80. Furthermore, these cells were found to be Gr-1+ and HSA+ (data not shown; HSA is heat stable antigen), suggesting that they belong to a certain stage of macrophage lineage (11, 14). We have also shown (21) by immunoprecipitation that not only TBM-MØs but also LPS-induced peritoneal MØs induced a similar effect on T cells, to decrease the CD3ζ expression. This observation was further extended by FACS analysis (Fig. 3). Whereas thioglycolate-induced peritoneal MØs failed to induce the decrease of CD3ζ, MØs induced by the combination of thioglycolate and LPS could reduce CD3ζ expression as could TBM-MØs.
Figure 3.
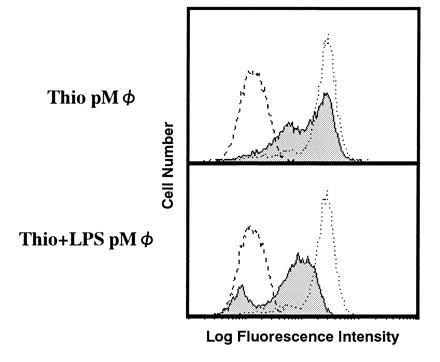
LPS-induced but not thioglycolate-induced peritoneal macrophages have the ability to decrease CD3ζ expression in T cells. Peritoneal macrophages induced by thioglycolate (Thio pMØ) (Upper) or by the combination of thioglycolate and LPS (Thio+LPS pMØ) (Lower) were cocultured with normal purified splenic T cells at a 1:2 ratio. Normal T cells alone (dotted line) and T cells mixed with these macrophages (thin line with shaded histogram) were fixed, permeabilized, and stained with anti-CD3ζ mAb-biotin and PE-streptavidin. The broken line showes a control staining. Stained cells were analyzed by FACScan.
Characterization of the Interaction Between T Cells and TBM-Macrophages.
When TBM-MØs were depleted rapidly by magnetic beads coated with anti-HSA and Mac-1 mAb, CD3ζ expression was rapidly recovered in TBM splenic T cells (Fig.4A). This demonstrates that the loss of CD3ζ is reversible and the recovery of the CD3ζ expression is very rapid in the absence of TBM-MØs and further that CD3ζ was reduced only under the influence of TBM-MØs. We found by using the coculture system that the culture supernatant after the coculture of T cells and TBM-MØs could not replace the ability of TBM-MØs to decrease CD3ζ (data not shown) and further that the loss of CD3ζ was not observed when T cells and MØs were separated by a pore membrane (Fig. 4C). These data demonstrate that the decrease of CD3ζ requires the direct or close interaction between T cells and TBM-MØs and is not mediated by a stable soluble factor. To exclude the possibility that protease(s) was released from MØs after permealization for intracellular staining, entered into permealized T cells, and reduced CD3ζ, the culture supernatant of permeabilized MØs was added onto fixed T cells and then T cells were permeabilized, followed by staining with anti-CD3ζ mAb. There was no decrease of the CD3ζ expression by this treatment with supernatant, demonstrating that the loss of CD3ζ is not induced by factors released from TBM-MØs after permeabilization and that the close contact between T cells and MØs is required (Fig. 4D). Finally, we were able to show the decrease of CD3ζ in T cells without lysing or permeabilizing TBM-MØs. When the mixture of TBM-MØs and T cells was fixed first and then MØs were depleted, the reduced level of the CD3ζ expression was kept in T cells (Fig. 4B). Considering that TBM-MØs were neither lysed nor permeabilized in this system, the result clearly demonstrated that the decrease of CD3ζ was not caused by protease(s) derived from the permeabilized TBM-MØs.
Figure 4.
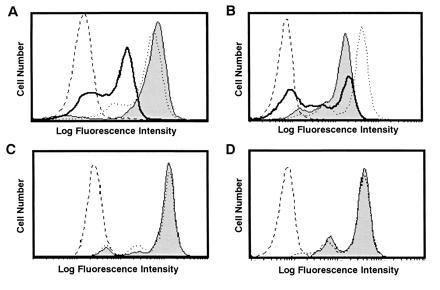
Decrease of CD3ζ in T cells is induced by direct interaction with TBM-MØs and is reversible by depletion of TBM-MØs. (A) Depletion of TBM-MØs recovered the decrease of the CD3ζ expression. The CD3ζ expression was analyzed in normal T cells (dotted line), T cells enriched from TBM spleen (thick line), and TBM splenic T cells that were immediately fixed after depletion of TBM-MØs with anti-HSA and anti-Mac-1 mAbs-coupled magnetic beads (thin line with shaded histogram). The broken line shows a control staining. (B) Fixed T cells kept the decreased level of the CD3ζ expression even after depletion of TBM-MØs. The mixture of TBM-MØs and T cells was fixed first and then TBM-MØs were depleted. These fixed T cells exhibited dye exclusion, indicating that the membrane was not permeabilized by this treatment. The CD3ζ expression was analyzed in normal T cells (dotted line), T cells enriched from TBM spleen (thick line), and TBM splenic T cells after fixation followed by depletion of TBM-MØs (thin line with shaded histogram). The broken line shows a control staining. (C) The decrease of CD3ζ required the close contact between T cells and TBM-MØs. T cells were cocultured with TBM-MØs for 30 min by separation with a pore membrane (thin line with shaded histogram) as compared with normal T cells (dotted line) and the expression of CD3ζ was assessed. The broken line shows a control staining. (D) The decrease of the CD3ζ expression is not mediated by soluble factors from TBM-MØs. T cells were fixed, permeabilized, and then incubated with the supernatant of permeabilized/fixed TBM-MØs (thin line with shaded histogram) as compared with normal T cells (dotted line) and the CD3ζ expression was analyzed. The broken line shows a control staining. The supernatant of the permeabilized TBM-MØs was transferred onto the fixed/permeabilized T cells and incubated for 10 min. While A and B were analyzed by staining with anti-CD3ζ mAb and FITC-goat anti-hamster mAb,C and D were stained with anti-CD3ζ mAb-biotin and PE-streptavidin. All four experiments were performed independently. Stained cells were analyzed by FACScan.
NAC Inhibits TBM-MØ-Induced Loss of CD3ζ.
From various efforts to find a specific inhibitor to block the disappearance of CD3ζ including mAbs against cell surface molecules, we found that only one inhibitor, NAC, could block the reaction. When TBM-MØs were preincubated for 30 min with NAC, the loss of CD3ζ was significantly inhibited (Fig. 5A), and the recovery was observed in a dose-dependent fashion (Fig. 5B). In contrast, the same concentration of NAS, an appropriate control that differs only in the thiol group from NAC, did not block the reaction (Fig. 5B). Although the recovery of CD3ζ was marginally observed by coculture with TBM-MØs treated with 30 mM NAC, the degree of restoration increased with the prolongation of treatment with the same concentration of NAC (data not shown). The results indicate that the SH group of NAC is important for inhibiting the decrease of CD3ζ and suggest that oxidative stress by TBM-MØs suppresses the expression of CD3ζ in T cells.
Figure 5.
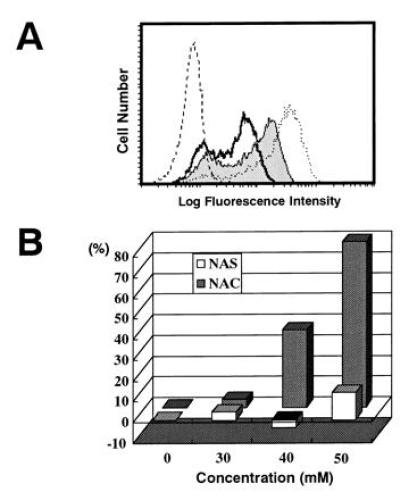
Inhibition of the decrease of CD3ζ expression by NAC but not NAS. (A) The CD3ζ expression in normal T cells (dotted line), T cells cocultured with TBM-MØs (thick line), and T cells cocultured with TBM-MØs pretreated for 30 min with 40 mM NAC (thin line with shaded histogram). The broken line shows a control staining. (B) NAC (shaded bar) but not NAS (open bar) inhibits the decrease of CD3ζ expression in a dose-dependent fashion. TBM-MØs were pretreated with indicated doses of NAC or NAS for 30 min and then cocultured with purified splenic T cells for 5 min T cells were then fixed, permeabilized, and stained with anti-CD3ζ mAb-biotin and PE-streptavidin. Stained cells were analyzed by FACScan. The expression level of CD3ζ was presented as a percentage of the level of normal T cells. The original FACS profile for this graph was represented in A.
Reactive Oxygen Intermediates Induce the Decrease of CD3ζ.
Since NAC was known to inhibit the oxyradical production from activated macrophages, the successful block of the CD3ζ loss by NAC treatment strongly suggests that the mediator from TBM-MØs to reduce the CD3ζ expression is reactive oxygen intermediates (ROI). Therefore, we next examined the direct effect of oxiradicals on the decrease of CD3ζ by adding oxidants, such as hydrogen peroxide and diamide to normal T cells. Indeed, the addition of either hydrogen peroxide or diamide for 15 min induced the significant decrease of CD3ζ, but the expression of CD3ɛ was altered only marginally (Fig. 6). Although the concentrations of these reagents were relatively high, treatment with lower concentrations was also effective when the treatment period was extended (data not shown). Since it has been known that the treatment of T cells with hydrogen peroxide induced massive phosphorylation of many proteins, we examined whether the decrease of CD3ζ may result from the loss or block of the CD3ζ determinant(s) recognized by anti-CD3ζ mAb due to modification of CD3ζ such as tyrosine phosporylation. To exclude this possibility, we examined to blot CD3ζ with polyclonal anti-CD3ζ antisera (Fig.7). T cells were treated with hydrogen peroxide or TBM-MØs, and lysates were prepared with 1% Nonidet P-40 lysis buffer containing various protease inhibitors, immunoprecipitated, and blotted with anti-CD3ζ mAb and polyclonal antibody. The loss of CD3ζ by both treatment was evidenced by both polyclonal anti-CD3ζ antibodies as well as mAb. The experiment by using cell lysates of H202-treated T cells prepared with a RIPA buffer containing 0.1% SDS (0.15 mM NaCl/0.05 mM Tris·HCl, pH 7.2/1% sodium deoxycholate/0.1% SDS) showed the same result (data not shown). This result clearly showed that the loss of CD3ζ was not due to the alteration of CD3ζ antigenic determinant.
Figure 6.
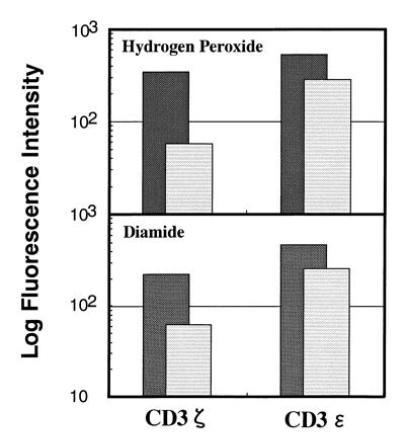
Expression of CD3ζ and CD3ɛ in T cells treated (striped lightly shaded bar) with hydrogen peroxide (Upper) or diamide (Lower) or untreated (darkly shaded bar). Splenic T cells were purified through a nylon column, incubated with 10 mM hydrogen peroxide or 50 mM diamide for 15 min, fixed, permeabilized, and stained with anti-CD3ζ mAb-biotin or anti-CD3ɛ mAb-biotin. Stained cells were analyzed by FACScan and the relative logarithm of fluorescence intensities is presented.
Figure 7.

Decrease of CD3ζ in T cells by oxidative stress of hydrogen peroxide or by coculture with TBM-MØs. Splenic T cells (5 × 10⁷ cells) were treated with medium alone (lane 1), 50 mM hydrogen peroxide (lane 2), or cocultured with 5 × 10⁷ TBM-MØs for 15 min. Cell lysates were prepared with Nonidet P-40 lysis buffer containing various protease inhibitors, immunoprecipitated with anti-CD3ζ mAb (Upper) or polyclonal anti-CD3ζ sera (Lower), analyzed by SDS/PAGE on 13% gels under reducing condition, and blotted with anti-CD3ζ mAb (Upper) or polyclonal antisera (Lower), respectively. The analysis of cell lysates prepared with a RIPA buffer was also performed for H2O2-treated T cells and showed the same result (data not shown). The arrows labeled ζ, H, and L indicate the molecular size for CD3ζ, Ig heavy chain, and Ig light chain used for immunoprecipitation, respectively. Molecular masses (kDa) of protein standards are indicated at the left.
Decrease of CD3ζ Results in the Suppression of Antigen-Specific T-Cell Response.
To elucidate the functional consequence of the decrease of CD3ζ induced by TBM-MØs, we analyzed the antigen-specific T-cell response by using T cells from TCR-transgenic mice. Antigen-specific T cells were purified from ovalbumin (OVA)-specific TCR-transgenic mice and cocultured with a graded number of TBM-MØs prepared from syngeneic BALB/c mice, and then the expression of CD3ζ and OVA-specific T-cell proliferation was measured. Similar to the previous results, the expression of CD3ζ in OVA-specific T cells decreased by coculture with TBM-MØs in a dose-dependent fashion (Fig. 8A). In parallel with the decrease of the level of CD3ζ expression, the OVA-specific proliferative T-cell response was suppressed while the nonspecific responses induced by PMA plus Ca2+ ionophore did not show any significant change (Fig. 8B). Consistent with these observations, proliferation of the T-cell-enriched population from TBM spleen upon stimulation with anti-CD3ɛ mAb showed no significant difference from that of normal T cells (data not shown). These results indicate that the antigen-specific response was sensitive to inhibition caused by the disappearance of CD3ζ in the tumor-bearing status.
Figure 8.

Decrease of CD3ζ by TBM-MØs resulted in suppression of antigen-specific T-cell proliferative response. (A) The decrease of CD3ζ expression in splenic T cells by coculture with graded numbers of TBM-MØs. T cell/TBM-MØ ratio was 100:1 (thin line), 10:1 (thick line), and 1:1 (thin line with shaded histogram), respectively. OVA-specific T cells were purified through a nylon column from the spleen of OVA-specific TCR transgenic mice and cocultured with graded numbers of TBM-MØs from normal tumor-bearing mice. After 5 min as well as 2 days incubation, a part of the cells were collected, fixed, permealized, and stained with anti-CD3ζ-biotin and FITC-streptavidin. Stained cells were analyzed by FACScan. The staining profile after a 5-min incubation was shown. The profile after a 2-day incubation was quite similar. (B) Antigen-specific (open squares) and antigen-nonspecific (solid circles) T-cell proliferation of OVA-specific T cells cocultured with TBM-MØs at the ratios indicated in A. Approximately 1 × 10⁵ nylon-column-purified OVA-specific splenic T cells were cultured with 5 × 10⁵ irradiated (3000 rad) T-cell-depleted spleen cells as antigen-presenting cell source and graded numbers of TBM-MØs in the presence of OVA peptide (30 nM) or the combination of PMA (100 ng/ml) and A23187 (5 ng/ml). Proliferation was assessed by [3H]thymidine incorporation in a triplicate culture. The results are the mean ± SD.
DISCUSSION
In this paper, we addressed three major questions regarding the disappearance of the CD3ζ chain in tumor-bearing status: the first was whether this phenomenon takes place in vivo and is not, thus, an in vitro artifact; the second was to uncover the mechanism that induces the loss of CD3ζ; and the third was to determine the functional consequence of the reduction of CD3ζ. We clearly demonstrated that (i) the disappearance of CD3ζ occurs within T cells, (ii) the mechanism to decrease CD3ζ is the oxidative stress from tumor-derived macrophages upon interaction with T cells, and (iii) the disappearance of CD3ζ suppresses antigen-specific T-cell responses.
After the accumulation of data demonstrating that CD3ζ and its related signaling molecules were down-regulated in the tumor-bearing state in the mouse model (17, 18) and cancer patients (18–20, 22) and the loss of CD3ζ takes place in the presence of macrophages/monocytes, the argument was raised that the disappearance of CD3ζ occurs as an in vitro phenomenon induced by proteases from the contaminated macrophages (25–27). Immunoprecipitation analysis could not rule out this possibility because the cell lysate was prepared from a mixture of T cells and MØs. Therefore, we analyzed the CD3ζ expression within the cells without the preparation of cell lysate. The results clearly showed that the decrease of CD3ζ was observed within T cells and that the direct interaction between T cells and TBM-MØs induced the loss of CD3ζ. Our result that the coculture of T cells with the culture supernatant of permeabilized TBM-MØs failed to decrease CD3ζ excludes the involvement of proteases from TBM-MØs in this system. Furthermore, we present an evidence to show that the decrease of CD3ζ was induced without solubilizing or permealizing TBM-MØs by demonstrating that the reduction of the CD3ζ expression was still observed when the mixture of T cells and TBM-MØs was fixed first and then MØs were depleted.
By quantitative FACS analysis, the decrease of CD3ζ in TBM is found to be reversible and can be rapidly recovered when TBM-MØs are completely removed. This observation is consistent with the finding on the mechanism that ROI from TBM-MØs may induce the loss of CD3ζ. However, the decrease of CD3ζ was observed even in peripheral blood lymphocytes (PBLs) in a high frequency of cancer patients (20, 22). Since PBLs are not always associated with MØs in these cases, whether the same mechanism that we observed in the spleen of TBM also functions in PBLs is not clear. Small numbers of MØs in the periphery might be enough to suppress the PBLs, or alternatively, after CD3ζ was once reduced, some other mechanisms and related factors may operate to prevent the recovery.
Although the responding cells that induced the decrease of CD3ζ in T cells were Mac-1+ (21), they were negative for F4-80, another MØ marker, and positive for Gr-1, a granulocyte marker as well as HSA, an immature lineage marker. Therefore, the accumulating population in the TBM spleen appears to consist of immature macrophage-lineage cells in a certain activated stage. Our data show that not only TBM-MØs but also LPS-induced MØs (but not thioglycolate-induced MØs) have the capability to decrease CD3ζ by interaction with T cells. Therefore, these results imply that the activated MØs that suppress CD3ζ expression can be induced not only in tumor-bearing status but also in some infectious diseases. Indeed, Ochoa’s group showed the loss of the CD3ζ expression in leprosy patients (personal communication).
Our finding that NAC treatment prevents TBM-MØs from inducing the decrease of CD3ζ expression in T cells suggests that the mechanism is related to redox regulation. Indeed, since NAC but not NAS inhibits the decrease of CD3ζ by TBM-MØs, the reducing ability by the thiol group is responsible for the prevention. NAC is an antioxidant precursor of glutathione (GSH) and the addition of NAC increases the intracellular GSH level (33–35). The biological function of redox regulation has been analyzed in the NFκB system in particular (36–39). Activation of NFκB has been shown to be controlled by redox regulation. Since NAC treatment prevents NFκB activation, NAC has also been proposed as a potent candidate for the inhibitor of human immunodeficiency virus replication (33, 36). However, we found that the required amount of NAC to inhibit the disappearance of CD3ζ is much greater than the dose needed for the inhibition of NFκB activation or the increase of the intracellular GSH level. In fact, although the treatment of both normal T cells and TBM-MØs with 10 mM NAC for several hours increases the intracellular GSH level, such treated TBM-MØs still retain the ability to induce the decrease of CD3ζ (data not shown). Thus, the intracellular GSH level in TBM-MØs is not simply correlated with the ability of MØs to induce the disappearance of CD3ζ. Nevertheless, the specific inhibition by NAC compared with NAS indicates the involvement of oxidative stress as the mechanism to induce the decrease of CD3ζ. The requirement of a high dose of NAC may reflect multiple functions of NAC in this system to serve as antioxidant in addition to the regulation of intracellular GSH (34, 40).
Analysis of the direct addition of H2O2 and diamide indicates that ROI may be the responding mediator for the induction of the loss of CD3ζ. Nitric oxide (NO) was not the mediator, because a specific inhibitor of NO synthetase,_N_-amino-l-arginine, failed to inhibit the loss of CD3ζ (data not shown). The experimental result that a high dose of catalase failed to block the decrease of CD3ζ (data not shown) suggests that the ROI from TBM-MØs may function only through the restricted interface between T cells and MØs during interaction rather than through secretion into medium. This idea is consistent with the requirement of high doses of these oxidants for achieving an effective decrease of CD3ζ. The intracellular mechanism to decrease CD3ζ within T cells is not clear at present. It is clear, however, that the loss of CD3ζ is regulated at the protein level probably by degradation. It has been recently reported that degradation of some proteins within the endoplasmic reticulum (ER) can be regulated by redox state (41). Considering the fact that degradation of CD3 proteins has been demonstrated to take place within ER (41, 42), CD3ζ may also be degraded through redox regulation in the tumor-bearing status upon oxidative stress by MØs. We have shown that CD3ζ exhibits rapid turnover independent of the TCR–CD3 complex in normal T cells and that CD3ζ is constantly replaced by newly synthesized CD3ζ and exhibits dynamic dissociation from and association with the TCR–CD3 complex (43). This system may be responsible for the disappearance of CD3ζ in TBM. Oxidative stress by TBM-MØs might induce to inhibit the exchange of the surface CD3ζ with newly synthethized CD3ζ, which results in the lack of CD3ζ.
We have shown the functional consequence of the decrease of CD3ζ in antigen-specific T-cell response by using TCR-transgenic T cells. As we expected, only antigen-specific responses were impaired in parallel with the decrease of CD3ζ. This finding is consistent with our previous observation with CD3ζ-negative T-cell hybridoma variant cells (44, 45). Although a CD3ζ-deficient T-cell hybridoma with a low expression of surface TCR–CD3 complex failed to respond to antigen/major histocompatibility complex, these cells responded very well to the stimulation with anti-CD3ɛ mAb crosslinking. In contrast, a CD3ζ+ T-cell hybridoma with a level of surface TCR complex similar to that of control cells did respond well to antigen (44). Collectively, we demonstrated that the disappearance of CD3ζ by TBM-MØs suppresses the antigen-specific T-cell response, and this causes immunosuppression in the tumor-bearing status.
Note Added in Proof.
After the submission of this paper, Kono_et al_. (46) published data showing that hydrogen peroxide induces the ζ decrease in peripheral T cells of cancer patients.
Acknowledgments
We thank Dr. H. Arase, Dr. Y. Ishida, Dr. S. Ono, and Dr. K. Akagawa for helpful discussions; Dr. J. Hamuro for discussion of unpublished data; Dr. D. Y. Loh for DO-TCR Tg mice; Dr. M. Komiyama and Dr. M. Maekawa for helping with the confocal microscopy; Dr. S. Yokota for electron microscopy; Dr. H. Kominami and Dr. K. Tanaka for biochemical analysis, reagents, and discussions; Ms. M. Sakuma for technical assistance; and Ms. H. Yamaguchi for secretarial assistance. This work was supported by grants to T.S. from the Ministry for Education, Science, and Culture and from the Agency for Science and Technology, Japan, and in part from the Sagawa Cancer Research Foundation.
Footnotes
Abbreivations: TBM, tumor-bearing mouse (mice); TCR, T-cell receptor; MØ, macrophages; NAC,_N_-acetylcysteine; NAS, _N_-acetylserine; PMA, phorbol 12-myristate 13-acetate; OVA, ovalbumin; FACS, flow cytometry; LPS, lipopolysaccharide; PE, phycoerythrin; FITC, fluorescein isothiocyanate; ROI, reactive oxygen intermediates; HSA, heat stable antigen; GSH, glutathione.
References
- 1.Van der Bruggen P, Tranversari C, Chomez P, Lurquin C, De Plaen E, Van der Eynde B, Knuth A, Boon T. Science. 1991;254:1643–1647. doi: 10.1126/science.1840703. [DOI] [PubMed] [Google Scholar]
- 2.Bouchard B, Fuller B B, Vijayasaradhi S, Houghton A N. J Exp Med. 1989;169:2029–2042. doi: 10.1084/jem.169.6.2029. [DOI] [PMC free article] [PubMed] [Google Scholar]
- 3.Becker J C, Brabletz T, Czerny C, Termeer C, Brocker E B. Int. Immunol. 1993;5:1501–1508. doi: 10.1093/intimm/5.12.1501. [DOI] [PubMed] [Google Scholar]
- 4.Kawakami Y, Eliyahu S, Delgaldo C H, Robbins P F, Rivoltini L, Toalian S L, Miki T, Rosenberg S A. Proc Natl Acad Sci USA. 1994;91:3515–3519. doi: 10.1073/pnas.91.9.3515. [DOI] [PMC free article] [PubMed] [Google Scholar]
- 5.Townsend S E, Allison J P. Science. 1993;259:368–370. doi: 10.1126/science.7678351. [DOI] [PubMed] [Google Scholar]
- 6.Boussiotis V A, Gribben J G, Freeman G J, Nadler L M. Curr Opin Immunol. 1994;6:797–807. doi: 10.1016/0952-7915(94)90087-6. [DOI] [PubMed] [Google Scholar]
- 7.Leach D R, Krummel M F, Allison J P. Science. 1996;271:1734–1736. doi: 10.1126/science.271.5256.1734. [DOI] [PubMed] [Google Scholar]
- 8.Alleva D G, Burger C J, Elgert K D. J Immunol. 1994;153:1674–1686. [PubMed] [Google Scholar]
- 9.Young M R I, Wright M A, Matthews J P, Malik I, Prechel M. J Immunol. 1996;156:1916–1922. [PubMed] [Google Scholar]
- 10.Alleva D G, Elgert K D. Immunobiology. 1995;192:155–171. doi: 10.1016/S0171-2985(11)80094-X. [DOI] [PubMed] [Google Scholar]
- 11.Watoson G A, Fu Y-X, Lopez D M. J Leukocyte Biol. 1991;49:126–138. doi: 10.1002/jlb.49.2.126. [DOI] [PubMed] [Google Scholar]
- 12.Li X-F, Takiuchi H, Zou J-P, Katagiri T, Yamamoto N, Nagata T, Ono S, Fujiwara H, Hamaoka T. Jpn J Cancer Res. 1993;84:315–325. doi: 10.1111/j.1349-7006.1993.tb02873.x. [DOI] [PMC free article] [PubMed] [Google Scholar]
- 13.Utsumi K, Takai Y, Tada T, Ohzeki S, Fujiwara H, Hamaoka T. J Immunol. 1990;145:397–403. [PubMed] [Google Scholar]
- 14.Yamamoto N, Zou J-P, Li X-F, Takenaka H, Noda S, Fujii T, Ono S, Kobayashi Y, Mukaida N, Matsushima K, Fujiwara H, Hamaoka T. J Immunol. 1995;154:2281–2290. [PubMed] [Google Scholar]
- 15.Fujii T, Igarashi T, Kishimoto S. J Natl Cancer Inst. 1987;78:509–517. [PubMed] [Google Scholar]
- 16.Askew D, Burger C J, Elgert K D. Immunobiology. 1990;182:1–10. doi: 10.1016/S0171-2985(11)80578-4. [DOI] [PubMed] [Google Scholar]
- 17.Mizoguchi H, O’Shea J J, Longo D L, Loeffler C M, McVicar D W, Ochoa A C. Science. 1992;258:1795–1798. doi: 10.1126/science.1465616. [DOI] [PubMed] [Google Scholar]
- 18.Finke J H, Zea A H, Stanley J, Longo D L, Mizoguchi H, Tubbs R R, Wiltrout R H, O’Shea J J, Kudoh S, Klein E, Bukowski R M, Ochoa A C. Cancer Res. 1993;53:5613–5616. [PubMed] [Google Scholar]
- 19.Nakagomi H, Petersson M, Magnusson I, Juhlin C, Matsuda M, Mellstedt H, Taupin J L, Vivier, Anderson P, Kiessling R. Cancer Res. 1993;53:5610–5612. [PubMed] [Google Scholar]
- 20.Gunji Y, Hori S, Aoe T, Asano T, Ochiai T, Isono K, Saito T. Jpn J Cancer Res. 1994;85:1189–1192. doi: 10.1111/j.1349-7006.1994.tb02927.x. [DOI] [PMC free article] [PubMed] [Google Scholar]
- 21.Aoe T, Okamoto Y, Saito T. J Exp Med. 1995;181:1881–1886. doi: 10.1084/jem.181.5.1881. [DOI] [PMC free article] [PubMed] [Google Scholar]
- 22.Matsuda M, Petersson M, Lenlei R, Taupin J L, Magnusson I, Mellstedt H, Anderson P, Kiessling P. Int. J. Cancer. 1995;61:765–772. doi: 10.1002/ijc.2910610605. [DOI] [PubMed] [Google Scholar]
- 23.Tracy K J, Cerami A. Annu Rev Cell Biol. 1993;9:317–343. doi: 10.1146/annurev.cb.09.110193.001533. [DOI] [PubMed] [Google Scholar]
- 24.Watson G A, Lopez D M. J Immunol. 1995;155:3124–3134. [PubMed] [Google Scholar]
- 25.Noda S, Nagata-Narumiya T, Kosugi A, Narumiya S, Ra C, Fujiwara H, Hamaoka T. Jpn J Cancer Res. 1995;86:383–394. doi: 10.1111/j.1349-7006.1995.tb03068.x. [DOI] [PMC free article] [PubMed] [Google Scholar]
- 26.Franco J L, Ghosh P, Wiltrout R H, Carter C R D, Zea A H, Momozaki N, Ochoa A C, Longo D L, Sayers T J, Komschlies K L. Cancer Res. 1995;55:3840–3846. [PubMed] [Google Scholar]
- 27.Levey D L, Srivastava P K. J Exp Med. 1995;182:1029–1036. doi: 10.1084/jem.182.4.1029. [DOI] [PMC free article] [PubMed] [Google Scholar]
- 28.Murphy K M, Heimberger A B, Loh D H. Science. 1990;250:1720–1723. doi: 10.1126/science.2125367. [DOI] [PubMed] [Google Scholar]
- 29.Elson L H, Nutman T B, Metcalfe D D, Prussin C. J Immunol. 1995;154:4294–4301. [PubMed] [Google Scholar]
- 30.Maddox P H, Jenkins D. J. Clin. Pathol. 1987;40:1256–1260. doi: 10.1136/jcp.40.10.1256. [DOI] [PMC free article] [PubMed] [Google Scholar]
- 31.Kupfer H, Monks C R F, Kupfer A. J Exp Med. 1994;179:1507–1515. doi: 10.1084/jem.179.5.1507. [DOI] [PMC free article] [PubMed] [Google Scholar]
- 32.Ohno H, Aoe T, Taki S, Kitamura D, Ishida Y, Rajewsky K, Saito T. EMBO J. 1993;12:4357–4366. doi: 10.1002/j.1460-2075.1993.tb06120.x. [DOI] [PMC free article] [PubMed] [Google Scholar]
- 33.Roederer M, Staal F J T, Raji P A, Ela S W, Herzenberg L A, Herzenberg L A. Proc Natl Acad Sci USA. 1990;87:4884–4888. doi: 10.1073/pnas.87.12.4884. [DOI] [PMC free article] [PubMed] [Google Scholar]
- 34.Flescher E, Ledbetter J A, Schieven G L, Vela-Roch N, Fossum D, Dang H, Ogawa N, Talal N. J Immunol. 1994;153:4880–4889. [PubMed] [Google Scholar]
- 35.Cotgreave I, Moldeus P, Schuppe I. Biochem. Pharmacol. 1991;42:13–16. doi: 10.1016/0006-2952(91)90674-t. [DOI] [PubMed] [Google Scholar]
- 36.Staal F J T, Roederer M, Herzenberg L A, Herzenberg L A. Proc Natl Acad Sci USA. 1990;87:9943–9947. doi: 10.1073/pnas.87.24.9943. [DOI] [PMC free article] [PubMed] [Google Scholar]
- 37.Anderson M T, Staal F J T, Gitler C, Herzenberg L A, Herzenberg L A. Proc Natl Acad Sci USA. 1994;91:11527–11531. doi: 10.1073/pnas.91.24.11527. [DOI] [PMC free article] [PubMed] [Google Scholar]
- 38.Meyer M, Schreck R, Baeuerle P A. EMBO J. 1993;12:2005–2015. doi: 10.1002/j.1460-2075.1993.tb05850.x. [DOI] [PMC free article] [PubMed] [Google Scholar]
- 39.Toledano M B, Leonard W J. Proc Natl Acad Sci USA. 1991;88:4328–4332. doi: 10.1073/pnas.88.10.4328. [DOI] [PMC free article] [PubMed] [Google Scholar]
- 40.Yan C Y, Ferrari G, Greene L A. J Biol Chem. 1995;270:26827–26832. doi: 10.1074/jbc.270.45.26827. [DOI] [PubMed] [Google Scholar]
- 41.Young J, Kane L P, Exley M, Wileman T. J Biol Chem. 1995;268:19810–19818. [PubMed] [Google Scholar]
- 42.Stafford F J, Bonifacino J S. J Cell Biol. 1991;115:1225–1236. doi: 10.1083/jcb.115.5.1225. [DOI] [PMC free article] [PubMed] [Google Scholar]
- 43.Ono S, Ohno H, Saito T. Immunity. 1995;2:639–944. doi: 10.1016/1074-7613(95)90008-x. [DOI] [PubMed] [Google Scholar]
- 44.Sussman J J, Bonifacino J S, Lippincott-Schwartz J, Weissman A M, Saito T, Klausner R D, Ashwell J D. Cell. 1988;52:85–95. doi: 10.1016/0092-8674(88)90533-8. [DOI] [PubMed] [Google Scholar]
- 45.Aoe T, Goto S, Ohno H, Saito T. Int. Immunol. 1996;6:1671–1679. doi: 10.1093/intimm/6.11.1671. [DOI] [PubMed] [Google Scholar]
- 46.Kono K, Salazar-Onfray F, Petersson M, Hansson J, Masucci G, Wasserman K, Nakazawa T, Anderson P, Kiessling R. Eur J Immunol. 1996;26:1308–1313. doi: 10.1002/eji.1830260620. [DOI] [PubMed] [Google Scholar]