Pseudofam: the pseudogene families database (original) (raw)
Abstract
Pseudofam (http://pseudofam.pseudogene.org) is a database of pseudogene families based on the protein families from the Pfam database. It provides resources for analyzing the family structure of pseudogenes including query tools, statistical summaries and sequence alignments. The current version of Pseudofam contains more than 125 000 pseudogenes identified from 10 eukaryotic genomes and aligned within nearly 3000 families (approximately one-third of the total families in PfamA). Pseudofam uses a large-scale parallelized homology search algorithm (implemented as an extension of the PseudoPipe pipeline) to identify pseudogenes. Each identified pseudogene is assigned to its parent protein family and subsequently aligned to each other by transferring the parent domain alignments from the Pfam family. Pseudogenes are also given additional annotation based on an ontology, reflecting their mode of creation and subsequent history. In particular, our annotation highlights the association of pseudogene families with genomic features, such as segmental duplications. In addition, pseudogene families are associated with key statistics, which identify outlier families with an unusual degree of pseudogenization. The statistics also show how the number of genes and pseudogenes in families correlates across different species. Overall, they highlight the fact that housekeeping families tend to be enriched with a large number of pseudogenes.
INTRODUCTION
The complexity of the eukaryotic genome is characterized by its large amount of non-protein-coding DNA. This type of DNA typically lies in intergenic regions and was regarded as ‘junk’ DNA in the past. However, due to the recent advancement of genomic technology, it has been found that intergenic DNA indeed plays an important role in regulatory function and also provides a basis for studying the dynamics and evolution of a genome (1).
Among all the intergenic elements, from transcription factor binding sites to microsatellites, pseudogenes, which are in effect genetic fossils, are the elements most likely to record historical aspects of living genes. Pseudogenes not only capture genes in the past, but also provide precious clues about genome dynamics, such as gene duplication events (for duplicated pseudogenes) and retrotransposition events (for processed pseudogenes). Since proteins in the same family are believed to share a common ancestor giving rise to the shared domain, association of pseudogenes with their parent protein families could reveal the correlation between the generation of pseudogenes and the functions of their parents. This correlation otherwise might not be observable from the study of individual pseudogenes.
A number of experimental and computational approaches have been developed to identify and annotate pseudogenes in eukaryotic genomes (2–4). Also, there are a few prior studies that have attempted to analyze pseudogenes using protein families (5,6). However, no study thus far has systematically formalized the pseudogene relationships and presented an integrated analysis of several eukaryotes using a family approach. To this end, this article aims to develop a large-scale database of pseudogene families of eukaryotes that could enable researchers to analyze pseudogenes and relate them to existing genomic information in an integrated fashion.
THE PSEUDOFAM WEB SITE
Pseudofam is implemented as an online database, which is available at http://pseudofam.pseudogene.org. The web site itself is a thin-client application implemented using Java on the server side and requires only a web browser on the client side. It provides tools for researchers to browse and query the pseudogene families. Moreover, it provides certain useful statistics (described in detail below), such as the enrichment of parent proteins for each family and the correlation of different family parameters between species. The database is also capable of interfacing with other related systems, such as the Ensembl server and the Pfam database. Furthermore, researchers can download the family data sets, including the alignment of the sequences, in flat file formats.
ASSIGNING PSEUDOGENES TO FAMILIES
Figure 1 depicts an overview of the generation of Pseudofam data from the identification of pseudogenes to the formation of the families. DNA sequences of 10 eukaryotic genomes: human, chimpanzee, dog, mouse, rat, fruit fly, mosquito, chicken, zebra fish and worm, together with their over 291 000 protein sequences were retrieved from Ensembl (http://www.ensembl.org; release 48—December 2007) (7,8). Each genome and its associated protein sequences are run through BLAST (9,10) to identify all genomic regions that share sequence similarity with the given protein sequences. The proteins are divided into groups of queries, which are processed concurrently to reduce overall runtime, while the genomes are used as the BLAST database. The results are then processed using PseudoPipe (4) to identify potential pseudogenes. This analysis pipeline uses tFasty (11) to refine the BLAST alignments and determine frame shifts and other disablements. It takes about 3 days of computational time to complete the identification of pseudogenes in the human genome with our current configuration.
Figure 1.

The generation of pseudofam. (1) Identify pseudogenes by existing proteins of the genome. (2) Map all the parent proteins to their protein families. (3) Assign the identified pseudogenes to their parent protein families. (4) Align the pseudogenes in each family to build the pseudogene families. (5) Calculate the key statistics for the families and organize the data into the Pseudofam database.
Our current release of Pseudofam contains 3821 protein families covering all the protein sequences used as input for identifying the 125 272 pseudogenes. The parent proteins of the identified pseudogenes belong to 2986 pseudogene families. Thus, there are 835 protein families not found to have any pseudogenes. Families for the protein sequences are constructed by mapping the Ensembl peptide IDs to the Pfam ID via mappings available at the BioMart server (http://www.biomart.org/; Ensembl Release 48) (12). Pseudogenes are assigned to the protein families based on the assignments of their parent proteins and then aligned to identify any pseudogene domains by the mechanics described below.
Figure 2 shows a schematic representation of our approach in aligning pseudogene domains by transferring their parent domain alignments from the Pfam multiple alignments. Within each family, a pseudogene is first aligned to its parent protein and then to its corresponding protein domain retrieved from the Pfam database (http://pfam.sanger.ac.uk; version 22) (13,14). After the individual alignments, all the pseudogene domains from distinct species are then aligned together with their parent protein domains. This approach of alignment enables us to accurately align pseudogenes with low levels of similarity and consequently to identify pseudogene domains that might exhibit low similarity to their parent protein domains. The resulting pseudogene domain alignment data provide researchers a means to estimate the mutation rate of genomic elements that evolve under no or less selection pressure (15). This alignment data is available for download.
Figure 2.

The alignment of pseudogene family. Each pseudogene in a family is first aligned to its parent protein. Then, the pseudogene alignment is aligned with the parent protein domain by transferring the corresponding alignment from the Pfam multiple alignments. At last, all the aligned pseudogene domains, including their aligned parent protein domains, will be adjusted together to generate the final alignment.
DESCRIBING PSEUDOGENE FAMILIES USING ONTOLOGIES
With the family data available at Pseudofam, we can extend our family approach to other potentially related analyses. Since pseudogenes are nonprotein coding and have no direct functions, their relationships with other parts of the genome are often neglected and poorly understood. However, more and more findings have demonstrated pseudogenes, as a gene relic, not only facilitate evolutionary study, but also exhibit substantial interactions in the genome. They have been shown to play different roles in the genome remodeling process, including retrotransposition, duplication and mutation. Recent studies, for example, have shown that some of the pseudogenes may have mediated the formation of segmental duplications (SDs) (16), regulating their parent genes through RNA interference (17), or even been reactivated (18,19). As a result, we have developed an ontology [a formal specification of conceptualization (20)] to illustrate pseudogene family relationships. To facilitate further analysis, we have also formatted our ontology into the Open Biomedical Ontology (OBO) format and annotated our data accordingly.
An upper ontology
The ontology in Figure 3 shows an upper ontology depicting the pseudogene family and its relationships. It spans across several domains and involves different domain-specific ontologies, such as the Gene Ontology (GO), Protein Ontology (PO/PrO), Sequence Ontology (SO) and Pseudogene Ontology (see Supplementary Figure S1). It basically consists of three parts. The first (in blue) is the core part and family concept that Pseudofam is built upon. The second (in dark gray) is a part that describes certain primary aspects of pseudogenes that are fairly well established, such as their genomic processes of creation (e.g. retrotransposition and duplication). The third (in light gray) is a part that describes the secondary aspects of a pseudogene family (e.g. its association with SDs), as well as terms that are currently in a draft state. These draft terms include unitary (describing pseudogenes mutated directly from a parent gene), orphaned (for pseudogenes whose parent genes were lost after speciation) and transcribed (for apparently active pseudogenes). While the upper ontology is essentially finished, the full Pseudogene Ontology is still being developed in collaboration with a number of other individuals.
Figure 3.

The Pseudogene family ontology. An upper ontology that describes the various relationships between a pseudogene family and other genomic elements. The solid lines represent direct relationships and the dashed lines represent inferred or indirect relationships. The core part is represented in blue, while the well-established relationships are in dark gray and the secondary aspects of a pseudogene family are in light gray. For detailed concepts and relationships about pseudogene, see Supplementary Figure S1.
Family relationships
Based on the fundamental relationship between protein family and pseudogene, our ontology also depicts the structural and functional relationships tying to a pseudogene family. These relationships could aid in further understanding of various genomic processes. For example, the co-localization of pseudogenes in a shared synteny could indicate their formation before speciation (19,21), and the presence of pseudogenes in SDs could provide clues about SD formation since both pseudogenes and SDs represent duplicated regions of the genome (22). Thus, Pseudofam currently provides the human pseudogene dataset annotated with SD information obtained from the Human Segmental Duplication database at http://eichlerlab.gs.washington.edu/database.html. While the SD relationship derives directly from the pseudogenes themselves, the family relationship of a pseudogene is inferred by the protein family relationship of its parent protein and hence is more indirect. Here, we formalize this inferred relationship in a first-order logic on which Pseudofam is built:
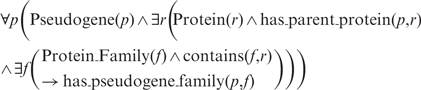
In words, for all pseudogene p, if there exists a protein r, which is a parent protein of p, and there also exists a protein family f, which contains r, then p has a pseudogene family f. Even though a pseudogene is nonprotein coding, this protein family approach of classification gives us a way to associate domain and function with it. Proteins in the same family are believed to share a common structural domain and function that evolved from a common ancestor. As a result, a family approach allows us to analyze pseudogenes by their functional groups and have a better understanding of their roles in genome rearrangement by relating them to other genomic features.
KEY STATISTICS
To further facilitate analysis with our family data, Pseudofam provides key statistics, such as the degree of pseudogenization and pseudogene-to-gene ratio, for each family both online and in the datasets for download. It also provides a tool to correlate different family parameters between species. To identify outlier families that have an unusual degree of pseudogenization, Pseudofam calculates the enrichment of parent proteins in each family and uses the hypergeometric distribution to calculate _P_-value, viz:
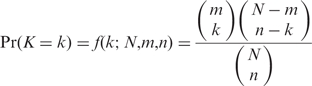
This formula calculates the probability Pr(K) of having the observed number of parent proteins k for a given family with n proteins under the hypergeometric distribution. Required for the computation is the total number of proteins N used for identifying the pseudogenes and the corresponding number of parent proteins m. The _P_-value for a positive enrichment is the Pr(K ⩾ k) and for a negative enrichment is the Pr(K ⩽ k). This parent protein approach is preferred over using a random sampling method to calculate the enrichment of pseudogenes because it is more computationally efficient and less susceptible to the changes of the pseudogenes identification algorithm or parameters that may cause the number of pseudogenes identified to fluctuate. The following sections show a brief analysis based on the key statistics provided by Pseudofam.
Degree of pseudogenization
Table 1 shows the numbers of protein and pseudogene families in different species and their degree of pseudogenization. It indicates that among the species in our study mammals have a higher percentage (an average of 50%) of families containing pseudogenes than nonmammals (an average of 22%). For instance, human has 3486 protein families of which 1790 (51%) are found to have pseudogenes. On the other hand, Drosophila has 2620 protein families but only 201 (8%) are found to have pseudogenes. Looking at the families individually shows that certain families have a high degree of pseudogenization, while some have no pseudogenes at all. For example, the reverse transcriptase (RNA-dependent DNA polymerase) family has 18 out of 22 (82%) proteins found to have associated pseudogenes. In contrast, the bestrophin protein family, which has 71 proteins, has not been found to have any pseudogenes.
Table 1.
Numbers of protein and pseudogene families in different species out of 9318 PfamA families
| Protein family | Pseudogene family | Pseudogenized (%) | |
|---|---|---|---|
| Homo sapiens (HS) | 3486 | 1790 | 51.35 |
| Pan troglodytes (PT) | 3443 | 1906 | 55.36 |
| Canis familiaris (CF) | 3151 | 1529 | 48.52 |
| Mus musculus (MM) | 3461 | 1654 | 47.79 |
| Rattus norvegicus (RN) | 3138 | 1489 | 47.45 |
| Anopheles gambiae (AG) | 2715 | 570 | 20.99 |
| Gallus gallus (GG) | 2911 | 860 | 29.54 |
| Drosophila melanogaster (DM) | 2620 | 201 | 7.67 |
| Danio rerio (DR) | 3145 | 1125 | 35.77 |
| Caenorhabditis elegans (CE) | 2633 | 360 | 13.67 |
| Total | 3821 | 2986 | 78.15 |
Correlation of family sizes across species
Since the mammalian genomes have a substantial number of pseudogene families, they enable us to carry out a more accurate statistical analysis of the correlation of genes and pseudogenes. Table 2 shows the Spearman correlation of the family size between the five mammalian genomes in our study. It shows that protein family size has an obviously stronger correlation (∼0.81) among species than pseudogene family size (∼0.63). It also shows that the correlation of pseudogene family size decreases when the evolutionary distance increases between the species. For example, human has a correlation of 0.89 with chimpanzee, but only around 0.58 with dog, mouse and rat. Similarly, mouse has a correlation of 0.67 with rat, but only around 0.58 with human, chimpanzee and dog. It supports the theory that pseudogenes in general are evolving under no or less selection pressure relative to functional genes.
Table 2.
Spearman's rank correlation of protein family sizes (the upper right) and pseudogene family sizes (the lower left) between different species
| HS | PT | CF | MM | RN | |
|---|---|---|---|---|---|
| HS | - | 0.92 | 0.77 | 0.84 | 0.75 |
| PT | 0.89 | - | 0.79 | 0.84 | 0.77 |
| CF | 0.60 | 0.62 | - | 0.78 | 0.85 |
| MM | 0.58 | 0.60 | 0.57 | - | 0.80 |
| RN | 0.57 | 0.59 | 0.59 | 0.67 | - |
Extreme families
The enrichment results (see Supplementary Table S1) show that families with housekeeping proteins, such as the GAPDH protein (a NAD-binding enzyme involved in glycolysis and glyconeogenesis), and the ribosomal protein RPL7A (responsible in mRNA-directed protein synthesis in all organisms) (14) have significantly more parent proteins than others. In order to investigate whether proteins having housekeeping functions tend to have more pseudogenes than those with nonhousekeeping functions, we downloaded a total of 575 human housekeeping genes derived from gene expression profiling (23,24). We selected all the 197 pseudogene families that contain both the housekeeping and nonhousekeeping genes, and tested the pseudogene-to-gene ratio between these two types of genes using a Wilcoxon signed rank test. We found that the pseudogene-to-gene ratio for housekeeping genes is significantly higher (_P_-value < 0.04) than for nonhousekeeping genes in such pseudogene families, especially in processed pseudogenes (_P_-value < 0.01). It has also been reported previously by Gonclaves et al. (25) that housekeeping genes generally have more processed pseudogenes. This could be explained by the relatively constant expression level of housekeeping genes, which boosts their chances of being retrotranscribed.
CONCLUSION
With the tools, statistics and ontology provided by Pseudofam, we can analyze pseudogenes from a different perspective and integrate pseudogene families with other related datasets to better understand the genome remodeling processes. For example, both pseudogenes and SDs represent duplicated regions of the genome; hence, by analyzing the presence of pseudogenes located in SDs, some precious clues about the generation processes of pseudogene and SD formation can be obtained (26). It was reported recently by Zheng (22) that in humans, SDs are more enriched with pseudogenes than genes, with 36.8% pseudogenes located in SDs and 17.8% genes located in SDs. Since genomic duplications have a destabilizing effect (26), it makes sense that the SDs are more enriched with pseudogenes than with genes, because structural variations in pseudogenes have less impact than in genes. This trend also reflects in the correlations of pseudogenes and parent genes of pseudogene families within SDs for the human genome (see Supplementary Figure S2), where there is a stronger positive Spearman correlation (0.69) between the numbers of duplicated pseudogenes in pseudogene families and those located in SDs, than that of parent genes (0.41).
SUPPLEMENTARY DATA
Supplementary Data are available at NAR Online.
FUNDING
National Institutes of Health Grant number: 5U54HG004555-02; AL Williams Professorship funds. Funding for open access charges: National Institutes of Health.
Conflict of interest statement. None declared.
ACKNOWLEDGEMENTS
We thank Hongyu Zhao, Rajkumar Sasidharan, Philip Kim, Joel Rozowsky, Nitin Bhardwaj, Deyou Zheng and Rebecca Robilotto for their comments on the article, technical assistance and helpful discussion. We would also like to extend our thanks for the technical help from Bert Overduin at Ensembl.
REFERENCES
- 1.Gerstein M, Zheng D. The real life of pseudogenes. Sci. Am. 2006;295:48–55. doi: 10.1038/scientificamerican0806-48. [DOI] [PubMed] [Google Scholar]
- 2.Ortutay C, Vihinen M. PseudoGeneQuest - service for identification of different pseudogene types in the human genome. BMC Bioinformatics. 2008;9:299. doi: 10.1186/1471-2105-9-299. [DOI] [PMC free article] [PubMed] [Google Scholar]
- 3.Yao A, Charlab R, Li P. Systematic identification of pseudogenes through whole genome expression evidence profiling. Nucleic Acids Res. 2006;34:4477–4485. doi: 10.1093/nar/gkl591. [DOI] [PMC free article] [PubMed] [Google Scholar]
- 4.Zhang Z, Carriero N, Zheng D, Karro J, Harrison PM, Gerstein M. PseudoPipe: an automated pseudogene identification pipeline. Bioinformatics. 2006;22:1437–1439. doi: 10.1093/bioinformatics/btl116. [DOI] [PubMed] [Google Scholar]
- 5.Harrison PM, Gerstein M. Studying genomes through the aeons: protein families, pseudogenes and proteome evolution. J. Mol. Biol. 2002;318:1155–1174. doi: 10.1016/s0022-2836(02)00109-2. [DOI] [PubMed] [Google Scholar]
- 6.Liu Y, Harrison PM, Kunin V, Gerstein M. Comprehensive analysis of pseudogenes in prokaryotes: widespread gene decay and failure of putative horizontally transferred genes. Genome Biol. 2004;5:R64. doi: 10.1186/gb-2004-5-9-r64. [DOI] [PMC free article] [PubMed] [Google Scholar]
- 7.Flicek P, Aken BL, Beal K, Ballester B, Caccamo M, Chen Y, Clarke L, Coates G, Cunningham F, Cutts T, et al. Ensembl 2008. Nucleic Acids Res. 2008;36:D707–D714. doi: 10.1093/nar/gkm988. [DOI] [PMC free article] [PubMed] [Google Scholar]
- 8.Stoesser G, Baker W, van den Broek A, Camon E, Garcia-Pastor M, Kanz C, Kulikova T, Leinonen R, Lin Q, Lombard V, et al. The EMBL Nucleotide Sequence Database. Nucleic Acids Res. 2002;30:21–26. doi: 10.1093/nar/30.1.21. [DOI] [PMC free article] [PubMed] [Google Scholar]
- 9.Altschul SF, Gish W, Miller W, Myers EW, Lipman DJ. Basic local alignment search tool. J. Mol. Biol. 1990;215:403–410. doi: 10.1016/S0022-2836(05)80360-2. [DOI] [PubMed] [Google Scholar]
- 10.Altschul SF, Madden TL, Schäffer AA, Zhang J, Zhang Z, Miller W, Lipman DJ. Gapped BLAST and PSI-BLAST: a new generation of protein database search programs. Nucleic Acids Res. 1997;25:3389–3402. doi: 10.1093/nar/25.17.3389. [DOI] [PMC free article] [PubMed] [Google Scholar]
- 11.Pearson WR, Wood T, Zhang Z, Miller W. Comparison of DNA sequences with protein sequences. Genomics. 1997;46:24–36. doi: 10.1006/geno.1997.4995. [DOI] [PubMed] [Google Scholar]
- 12.Durinck S, Moreau Y, Kasprzyk A, Davis S, De Moor B, Brazma A, Huber W. BioMart and Bioconductor: a powerful link between biological databases and microarray data analysis. Bioinformatics. 2005;21:3439–3440. doi: 10.1093/bioinformatics/bti525. [DOI] [PubMed] [Google Scholar]
- 13.Bateman A, Birney E, Durbin R, Eddy SR, Howe KL, Sonnhammer EL. The Pfam protein families database. Nucleic Acids Res. 2000;28:263–266. doi: 10.1093/nar/28.1.263. [DOI] [PMC free article] [PubMed] [Google Scholar]
- 14.Finn RD, Mistry J, Schuster-Boeckler B, Griffiths-Jones S, Hollich V, Lassmann T, Moxon S, Marshall M, Khanna A, Durbin R, et al. Pfam: clans, web tools and services. Nucleic Acids Res. 2006;34:D247–D251. doi: 10.1093/nar/gkj149. [DOI] [PMC free article] [PubMed] [Google Scholar]
- 15.Zhang Z, Gerstein M. Patterns of nucleotide substitution, insertion and deletion in the human genome inferred from pseudogenes. Nucleic Acids Res. 2003;31:5338–5348. doi: 10.1093/nar/gkg745. [DOI] [PMC free article] [PubMed] [Google Scholar]
- 16.Kim PM, Lam HYK, Urban AE, Korbel J, Affourtit J, Grubert F, Chen X, Weissman S, Gerstein M. Analysis of copy number variants and segmental duplications in the human genome: evidence for a change in the process of formation mechanism in recent evolutionary history. Genome Res. 2008 doi: 10.1101/gr.081422.108. doi:10.1101/gr.081422.108. [DOI] [PMC free article] [PubMed] [Google Scholar]
- 17.Tam OH, Aravin AA, Stein P, Girard A, Murchison EP, Cheloufi S, Hodges E, Anger M, Sachidanandam R, Schultz RM, et al. Pseudogene-derived small interfering RNAs regulate gene expression in mouse oocytes. Nature. 2008;453:534–538. doi: 10.1038/nature06904. [DOI] [PMC free article] [PubMed] [Google Scholar]
- 18.Doxiadis GG, van der Wiel MK, Brok HP, de Groot NG, Otting N, 't Hart BA, van Rood JJ, Bontrop RE. Reactivation by exon shuffling of a conserved HLA-DR3-like pseudogene segment in a New World primate species. Proc. Natl Acad. Sci. USA. 2006;103:5864–5868. doi: 10.1073/pnas.0600643103. [DOI] [PMC free article] [PubMed] [Google Scholar]
- 19.Sassi SO, Braun EL, Benner SA. The evolution of seminal ribonuclease: pseudogene reactivation or multiple gene inactivation events? Mol. Biol. Evol. 2007;24:1012–1024. doi: 10.1093/molbev/msm020. [DOI] [PubMed] [Google Scholar]
- 20.Gruber TR. A translation approach to portable ontologies. Knowl. Acquis. 1993;5:199–220. [Google Scholar]
- 21.Svensson O, Arvestad L, Lagergren J. Genome-wide survey for biologically functional pseudogenes. PLoS Comput. Biol. 2006;2:e46. doi: 10.1371/journal.pcbi.0020046. [DOI] [PMC free article] [PubMed] [Google Scholar]
- 22.Zheng D. Asymmetric histone modifications between the original and derived loci of human segmental duplications. Genome Biol. 2008;9:R105. doi: 10.1186/gb-2008-9-7-r105. [DOI] [PMC free article] [PubMed] [Google Scholar]
- 23.Eisenberg E, Levanon EY. Human housekeeping genes are compact. Trends Genet. 2003;19:362–365. doi: 10.1016/S0168-9525(03)00140-9. [DOI] [PubMed] [Google Scholar]
- 24.Su AI, Cooke MP, Ching KA, Hakak Y, Walker JR, Wiltshire T, Orth AP, Vega RG, Sapinoso LM, Moqrich A, et al. Large-scale analysis of the human and mouse transcriptomes. Proc. Natl Acad. Sci. USA. 2002;99:4465–4470. doi: 10.1073/pnas.012025199. [DOI] [PMC free article] [PubMed] [Google Scholar]
- 25.Gonclaves I, Duret L, Mouchiroud D. Nature and structure of human genes that generate retropseudogenes. Genome Res. 2000;10:672–678. doi: 10.1101/gr.10.5.672. [DOI] [PMC free article] [PubMed] [Google Scholar]
- 26.Bailey JA, Eichler EE. Primate segmental duplications: crucibles of evolution, diversity and disease. Nat. Rev. Genet. 2006;7:552–564. doi: 10.1038/nrg1895. [DOI] [PubMed] [Google Scholar]