Major Dietary Protein Sources and the Risk of Coronary Heart Disease in Women (original) (raw)
. Author manuscript; available in PMC: 2011 Aug 31.
Abstract
Background
With the exception of fish, few major dietary protein sources have been studied in relation to the development of coronary heart disease (CHD). Our objective was to examine the relation between foods which are major dietary protein sources and incident CHD.
Methods and Results
We prospectively followed 84,136 women aged 30-55 years in the Nurses’ Health Study with no known cancer, diabetes, angina, myocardial infarction, stroke, or other cardiovascular disease. Diet was assessed by a standardized and validated questionnaire and updated every four years. During 26 years of follow-up, we documented 2,210 incident nonfatal infarctions and 952 deaths from CHD. In multivariable analyses including age, smoking, and other risk factors, higher intakes of red meat, red meat excluding processed meat, and high-fat dairy were significantly associated with elevated risk of CHD. Higher intakes of poultry, fish, and nuts were significantly associated with lower risk. In a model controlling statistically for energy intake, one serving/day of nuts was associated with a 30% (95% CI: 17% to 42%) lower risk of CHD, when compared to one serving/day of red meat. Similarly, when compared to one serving/day of red meat, a lower risk was associated with one serving/day of low-fat dairy (13%; 95% CI: 6% to 19%), poultry (19%; 95% CI: 3% to 33%), and fish (24%; 95% CI: 6% to 39%).
Conclusions
These data suggest that high red meat intake increases risk of CHD, and that CHD risk may be reduced importantly by shifting sources of protein in the U.S. diet.
Keywords: Coronary disease, Diet, Epidemiology, Risk Factors, Women
Introduction
With the exception of fish, relatively few foods that are major sources of dietary protein have been examined in relation to incident coronary heart disease (CHD). The relation of these foods to CHD may not be predicted by the composition of their individual nutrients due to either synergy or antagonism among the nutrients or because of the presence of other constituents in the foods. While neither animal protein nor vegetable protein has been associated with CHD risk1, other nutrients in protein-rich foods, such as saturated fat 2-3, polyunsaturated fat 3-4, and vitamins E, B6, and folate 5 have been associated with risk.
We have previously reported on the relation between red meat, poultry, fish, and dairy products in relation to CHD risk over 14 years 2. We observed that red meat was not significantly associated with CHD, but increasing poultry and fish intake was associated with a decreased risk. A clear understanding of the relation between these food groups and CHD risk over a longer period of time, as well an examination of the individual foods that contribute to each food group and the relation of other major dietary protein sources and CHD risk, would allow individuals to reduce their risk by substituting one protein source for another. This type of dietary change may be easier to accomplish than trying to substitute one nutrient for another or one dietary pattern for another. We therefore examined the relation between major sources of dietary protein and the development of coronary heart disease in a large cohort of women with 26 years of follow up.
Methods
Study Population
The Nurses’ Health Study began in 1976 when 121,700 female registered nurses aged 30-55 years and residing in eleven U.S. states provided detailed information on their medical history and lifestyle. Every two years, follow-up questionnaires have been sent to update information on potential risk factors and to identify newly diagnosed cases of CHD and other diseases. In 1980, a 61-item food-frequency questionnaire (FFQ) was included to assess intake of specific foods. In 1984, the FFQ was expanded to include 116 food items. Similar questionnaires were used to update dietary intake in 1986, 1990, 1994, 1998, and 2002. As in our previous analyses, we excluded those who left more than ten items blank on the 1980 FFQ, those with implausibly low or high scores for total food or energy intake (i.e., less than 2094 kJ (500 kCal) or greater than 14650 kJ (3500 kCal) per day), and those with previously diagnosed cancer, diabetes, angina, myocardial infarction, stroke, or other cardiovascular disease (including a history of coronary artery bypass grafting) 1-3, 6. The final 1980 baseline population consisted of 84,136 women.
The study was approved by the Committee on the use of Human Subjects in Research at Brigham and Women’s Hospital. All subjected gave informed consent to participate.
Ascertainment of Diet
To calculate intakes of specific protein sources, a commonly used unit or portion size for each food was specified on the FFQ (e.g., one slice of processed meat or one hamburger patty) and the nurse was asked how often on average during the previous year she had consumed that amount (for portion sizes, see online-only supplemental material). Nine responses were possible, ranging from “never” to “more than six times per day.” The major protein sources on the FFQs include: chicken with and without skin, chicken sandwich, regular and lean hamburger, beef/pork hot dogs, chicken/turkey hot dog, processed meat sandwich, bacon, beef/pork/lamb mixed dish, beef/pork/lamb main dish, beef liver, chicken liver, skim or low fat milk, whole milk, yoghurt, ice cream, cottage cheese, and hard cheese. The reproducibility and validity of the FFQs in measuring food intake have been previously described in detail 7-11
Women were divided into fifths of cumulative average intake of various protein sources in order to reduce within-person variation and best represent long term diet. These averages were calculated by calculating the mean of all FFQ intakes from all available FFQs up to the beginning of a follow up interval. The cumulative average intake was then associated with CHD incidence from the time of the last returned questionnaire until the next follow up cycle. If dietary data from a particular FFQ was missing, then that FFQ cycle’s cumulative average would be the last cumulative average carried forward.
We stopped updating a participant’s cumulative average intake when she developed an intermediate outcome on the causal pathway between diet and CHD, such as diabetes, hypertension, angina, or hypercholesterolemia. We also stopped updating diet at the diagnosis of cancer or stroke or after coronary artery bypass. This was done because changes in diet after these diagnoses or events may bias the diet-disease association; ie, these diagnoses can be confounders 2-3. In sensitivity analyses, however, we examined cumulative average intake that was continually updated even after intermediate outcomes.
Ascertainment of Endpoint
The primary endpoint for this study was nonfatal myocardial infarction or fatal coronary heart disease occurring after the return of the 1980 FFQ but before June 1, 2006. After report of an infarction, permission to obtain medical records was requested and these were reviewed by study physicians with no knowledge of the subjects’ self-reported risk factor status. Myocardial infarction was confirmed using the World Health Organization criteria: symptoms plus either diagnostic electrocardiographic changes or elevated cardiac enzymes 12. Infarctions that required hospital admission and for which confirmatory information was obtained by interview or letter, but for which no medical records were available, were designated as probable (527/2210 cases of nonfatal myocardial infarction, or 24%). We included all confirmed and probable cases in our report because results were similar after probable cases were excluded.
Deaths were identified from state vital records and the National Death Index or were reported by next of kin or the postal system. Follow-up for deaths has been shown to be more than 98% complete 13. Fatal coronary heart disease was defined as a fatal myocardial infarction only if confirmed by medical records, next-of-kin or contact person, autopsy report, or if coronary heart disease was listed as cause of death on the death certificate and there was evidence of previous coronary disease. We considered sudden death within one hour of the onset of symptoms in women with no other plausible cause of death other than coronary disease as fatal CHD; these cases constituted 146/952 or 15% of fatal CHD cases. Fatal coronary heart disease was designated as presumed if the underlying cause on the death certificate was CHD but no records were available. These cases constituted 193/952 or 20% per cent of fatal CHD cases. Analyses limited to confirmed cases yielded similar results as analyses with both confirmed and presumed cases**.**
Data Analysis
We evaluated the individual associations between red meat, poultry, canned tuna, dark and light-fleshed fish, nuts, and beans in relation to the risk of CHD. We also examined protein source “groups” - total meat (including chicken with and without skin, chicken sandwich, hamburger, beef and chicken/turkey hot dog, processed meat and processed meat sandwich, bacon, beef/pork/lamb as a mixed and main dish, beef and chicken liver), red meat (hamburger, beef hot dog, processed meat and processed meat sandwich, bacon, beef/pork/lamb as a mixed and main dish), poultry (chicken with and without skin, chicken sandwich, and chicken/turkey hot dog ), fish (canned tuna, dark and light fleshed fish, and breaded fish), high-fat dairy (whole milk, ice cream, hard cheese, full fat cheese, cream, sour cream, cream cheese, butter, low-fat dairy (skim/low-fat milk, 1% and 2% milk, yogurt, cottage and ricotta cheeses, low-fat cheese, sherbert) - and their relation to CHD. We also analyzed the ratio of red meat to poultry and red meat to poultry plus fish in relation to incidence of CHD. We estimated the association between animal and vegetable protein and incidence of CHD. We investigated the effect of “substituting” a serving of one major protein source for another by including both as continuous variables in the same multivariable model. The difference in their coefficients plus their covariance was used to estimate the relative risk and 95% CI for the substitution 14.
Person-years of follow-up for each participant were calculated from the return of the 1980 FFQ to the date of the first CHD event, death, or June 1, 2006, whichever came first. The relative risk was computed using a proportional hazards regression model, with the rate in a specific fifth divided by that in the lowest fifth, with adjustment by age in months and calendar time (2-year follow up period). Median values of intake for each fifth were used to test for a linear trend across fifths.
In multivariable proportional hazards models, in addition to age and calendar time, we simultaneously controlled for intakes of total energy (Kcal), cereal fiber (g/day), alcohol (g/day), and trans unsaturated fatty acids (g/day), as well as other potential non-dietary confounding variables. These variables were updated biennially and include body mass index (<22, 22-24, 24-25, 25-27, 27-29, 29-30, 30-32, 32-35, 35-40, >40), physical exercise (<3, 3-9, 9-18, 18-27, 27+ metabolic equivalents/week), cigarette smoking (never, past, current 1-14 cig/day, current 14-25 cig/day, current 25+ cig/day), menopausal status (pre-menopausal, postmenopausal with no history of hormone replacement, postmenopausal with a history of hormone replacement, postmenopausal with current hormone replacement), parental history of early myocardial infarction (defined as infarction before age 65 for participant’s mother or before age 55 for a participant’s father), years of multivitamin use, vitamin E supplement use (yes/no), and aspirin use at least once per week (yes/no). The last value was carried forward for one 2-year cycle to replace missing values. If the last value was missing, than a missing value indicator was created.
In the models with animal and vegetable protein, we built two models: the first included the main exposures plus the above covariates, while the second included main exposures plus the above covariates and saturated fat, mono-unsaturated fat, and polyunsaturated fatty acids. Neither the diagnoses of diabetes, angina, hypertension, or hypercholesterolemia, nor use of the medications that are prescribed to treat these diseases, were included in any of the multivariable models, as these may all be considered intermediate outcomes on the causal pathway between diet and CHD. However, in sensitivity analyses, these intermediates outcomes were included.
Results
During 2,050,071 person-years of follow-up from 1980 through 2006, we documented 2210 nonfatal infarctions and 952 deaths from coronary heart disease**.** Our follow-up rate (defined as person-years contributed by study participants until their last returned FFQ or death divided by person-years contributed by study participants until death) was 97%. Between 1980 and 2002, red meat consumption decreased from a median intake of 1.06 to 0.49 servings/day, while poultry consumption increased from 0.14 to 0.28 servings/day and fish consumption remained unchanged. Characteristics of the study participants during the 26 years of follow-up, averaged according to proportion of person-time in each fifth of intake, are shown in Table 1. High red meat consumption was associated with higher rates of smoking, angina, hypertension, hypercholesterolemia, diabetes, lower physical activity, increased intake of trans fat, and decreased intake vitamin E and multivitamins. The major groups of protein sources were not highly correlated with each other: the Spearman correlation coefficient of red meat with poultry was −0.09; red meat with fish −0.17; and poultry with fish 0.39.
Table 1. Age-standardized characteristics of study participants, 1980-2006*.
| Red Meat | Poultry | Fish | |||||||||||||
|---|---|---|---|---|---|---|---|---|---|---|---|---|---|---|---|
| Fifths | 1st | 2nd | 3rd | 4th | 5th | 1st | 2nd | 3rd | 4th | 5th | 1st | 2nd | 3rd | 4th | 5th |
| Median Intake (servings/day) | 0.49 | 0.83 | 1.14 | 1.50 | 2.11 | 0.07 | 0.14 | 0.24 | 0.40 | 0.56 | 0.07 | 0.11 | 0.14 | 0.25 | 0.43 |
| Age (yrs) | 58 | 58 | 58 | 58 | 57 | 58 | 57 | 58 | 58 | 58 | 57 | 58 | 58 | 58 | 58 |
| Body Mass Index (kg/m2) | 25 | 26 | 26 | 26 | 26 | 25 | 26 | 26 | 26 | 27 | 26 | 25 | 26 | 26 | 27 |
| Current Smoker (%) | 13 | 15 | 17 | 17 | 19 | 21 | 19 | 17 | 13 | 12 | 19 | 17 | 17 | 14 | 13 |
| Family History of Early MI (%) | 13 | 13 | 13 | 13 | 13 | 12 | 13 | 13 | 13 | 13 | 13 | 12 | 13 | 12 | 14 |
| History of Angina (%) | 7 | 6 | 7 | 8 | 10 | 8 | 9 | 6 | 7 | 7 | 9 | 5 | 9 | 5 | 8 |
| History of High Blood Pressure (%) | 30 | 30 | 32 | 36 | 41 | 34 | 38 | 30 | 32 | 31 | 41 | 23 | 38 | 23 | 35 |
| History of High Cholesterol (%) | 31 | 33 | 36 | 39 | 40 | 35 | 37 | 35 | 35 | 35 | 37 | 34 | 36 | 34 | 36 |
| History of Diabetes (%) | 8 | 8 | 10 | 11 | 14 | 10 | 11 | 9 | 10 | 10 | 12 | 7 | 11 | 7 | 12 |
| Aspirin Use At Least Once Per Week (%) | 22 | 21 | 22 | 22 | 24 | 23 | 24 | 21 | 21 | 20 | 25 | 17 | 24 | 17 | 23 |
| Current Hormone Use (%) | 25 | 26 | 26 | 25 | 23 | 23 | 22 | 26 | 27 | 27 | 23 | 29 | 23 | 30 | 25 |
| Vitamin E Use (%) | 26 | 25 | 24 | 23 | 21 | 22 | 22 | 24 | 25 | 26 | 20 | 26 | 22 | 28 | 25 |
| Multivitamin Use (yrs) | 7.8 | 7.7 | 7.4 | 7.0 | 6.6 | 6.6 | 6.6 | 7.4 | 7.8 | 8.2 | 6.3 | 7.7 | 7.0 | 8.4 | 7.8 |
| Calories (Kcal/day) | 1326 | 1492 | 1623 | 1761 | 2015 | 1480 | 1565 | 1656 | 1698 | 1815 | 1535 | 1612 | 1620 | 1739 | 1723 |
| Cereal Fiber (g/day) | 3.3 | 3.5 | 3.5 | 3.5 | 3.3 | 3.0 | 3.0 | 3.5 | 3.7 | 3.9 | 2.7 | 3.8 | 3.1 | 4.3 | 3.7 |
| Trans Fat (g/day) | 2.4 | 3.0 | 3.6 | 4.1 | 5.2 | 3.6 | 3.8 | 3.7 | 3.5 | 3.5 | 3.9 | 3.6 | 3.8 | 3.5 | 3.4 |
| Alcohol (g/day) | 5.8 | 6.1 | 6.3 | 6.5 | 6.6 | 5.6 | 6.5 | 6.3 | 6.2 | 6.2 | 5.9 | 5.4 | 6.6 | 6.4 | 6.4 |
| Activity (METS/wk) | 21 | 18 | 17 | 16 | 15 | 15 | 15 | 17 | 19 | 20 | 14 | 15 | 16 | 19 | 21 |
In age-adjusted analyses, higher intakes of red meat, red meat excluding processed meat, red meat to poultry ratio, red meat to poultry plus fish ratio, and high-fat dairy were significantly associated with increased risk of CHD. Higher intakes of poultry, fish, and low-fat dairy sources were significantly associated with decreased risk (Table 2). When we controlled for age, follow-up period, and smoking status, the significant associations seen in the age-adjusted analyses remained. In multivariable analyses (Table 2) which adjusted for dietary and non-dietary cardiovascular disease risk factors, the associations were reduced in magnitude but remained significant for all the protein groups except low-fat dairy. Fruit and vegetable intake was only weakly to moderately correlated with intake of all the major protein sources and further adjustment for it had no effect on the risk associations. Egg intake was not associated with risk in either age-adjusted or multivariable models.
Table 2. Relative Risks (RR) and 95% confidence intervals for coronary heart disease according to fifths of intake of major sources of dietary protein.
| Fifths | |||||||
|---|---|---|---|---|---|---|---|
| 1st | 2nd | 3rd | 4th | 5th | P fortrend | RR for 1serving/day | |
| Total Meat | |||||||
| Median servings/day | 0.79 | 1.15 | 1.46 | 1.82 | 2.48 | ||
| Age-adjusted | 1.00 | 1.04(0.93,1.16) | 1.09(0.97,1.22) | 1.19(1.07,1.34) | 1.59(1.43,1.77) | <0.0001 | 1.26(1.21, 1.32) |
| Multivariable * | 1.00 | 1.01(0.90,1.13) | 1.00(0.88,1.13) | 1.01(0.89,1.15) | 1.22(1.06,1.40) | <0.01 | 1.13(1.07, 1.20) |
| Red Meat | |||||||
| Median servings/day | 0.49 | 0.83 | 1.14 | 1.50 | 2.11 | ||
| Age-adjusted | 1.00 | 1.15(1.02,1.29) | 1.18(1.05,1.32) | 1.33(1.19,1.49) | 1.75(1.57,1.95) | <0.0001 | 1.32(1.26, 1.38) |
| Multivariable * | 1.00 | 1.09(0.97,1.23) | 1.06(0.93,1.20) | 1.10(0.97,1.26) | 1.29(1.12,1.49) | <0.001 | 1.16(1.09, 1.23) |
| Red Meat, Excluding Processed Meat | |||||||
| Median servings/day | 0.28 | 0.45 | 0.64 | 0.84 | 1.17 | ||
| Age-adjusted | 1.00 | 0.95(0.84,1.06) | 1.11(0.99,1.24) | 1.07(0.95,1.20) | 1.50(1.35,1.66) | <0.0001 | 1.46(1.36, 1.58) |
| Multivariable * | 1.00 | 0.91(0.81,1.03) | 0.99(0.88,1.12) | 0.93(0.81,1.06) | 1.13(0.99,1.30) | 0.02 | 1.19(1.07, 1.32) |
| Poultry | |||||||
| Median servings/day | 0.07 | 0.14 | 0.24 | 0.40 | 0.56 | ||
| Age-adjusted | 1.00 | 1.10(0.98,1.23) | 0.84(0.74,0.96) | 0.83(0.73,0.93) | 0.80(0.70,0.92) | <0.0001 | 0.73(0.61, 0.88) |
| Multivariable * | 1.00 | 1.07(0.96,1.20) | 0.91(0.80,1.04) | 0.94(0.83,1.06) | 0.92(0.80,1.06) | 0.02 | 0.90(0.75, 1.08) |
| Fish | |||||||
| Median servings/day | 0.07 | 0.11 | 0.14 | 0.25 | 0.43 | ||
| Age-adjusted | 1.00 | 0.64(0.55,0.74) | 0.86(0.78,0.94) | 0.59(0.53,0.66) | 0.67(0.60,0.74) | <0.0001 | 0.54(0.43, 0.68) |
| Multivariable * | 1.00 | 0.76(0.65,0.87) | 0.94(0.85,1.03) | 0.76(0.68,0.86) | 0.81(0.72,0.90) | <0.001 | 0.81(0.66, 1.00) |
| Ratio of red meat to poultry | |||||||
| Median servings/day | 1.41 | 2.83 | 4.53 | 7.32 | 13.86 | ||
| Age-adjusted | 1.00 | 1.12(0.99,1.26) | 1.35(1.21,1.52) | 1.41(1.25,1.58) | 1.78(1.59,1.99) | <0.0001 | |
| Multivariable * | 1.00 | 1.00(0.89,1.14) | 1.14(1.01,1.28) | 1.11(0.98,1.25) | 1.26(1.11,1.43) | <0.0001 | |
| Ratio of red meat to poultry and fish | |||||||
| Median servings/day | 0.77 | 1.59 | 2.48 | 3.83 | 7.14 | ||
| Age-adjusted | 1.00 | 1.17(1.04,1.32) | 1.32(1.17,1.49) | 1.54(1.37,1.74) | 1.82(1.62,2.05) | <0.0001 | |
| Multivariable * | 1.00 | 1.07(0.94,1.21) | 1.12(0.98,1.27) | 1.22(1.07,1.39) | 1.28(1.12,1.46) | 0.0001 | |
| High fat dairy | |||||||
| Median servings/day | 0.33 | 0.69 | 1.07 | 1.57 | 3.00 | ||
| Age-adjusted | 1.00 | 0.79(0.71,0.89) | 0.86(0.77,0.96) | 0.89(0.80,0.99) | 1.15(1.04,1.27) | <0.0001 | 1.07(1.04, 1.10) |
| Multivariable * | 1.00 | 0.86(0.77,0.96) | 0.91(0.81,1.02) | 0.93(0.83,1.04) | 1.09(0.97,1.22) | <0.01 | 1.03(1.00, 1.06) |
| Low fat dairy | |||||||
| Median servings/day | 0.07 | 0.32 | 0.69 | 1.14 | 2.32 | ||
| Age-adjusted | 1.00 | 0.68(0.61,0.76) | 0.63(0.57,0.70) | 0.63(0.56,0.70) | 0.67(0.60,0.74) | <0.0001 | 0.91(0.88, 0.95) |
| Multivariable * | 1.00 | 0.79(0.71,0.89) | 0.81(0.73,0.91) | 0.83(0.75,0.93) | 0.90(0.80,1.01) | 0.66 | 1.01(0.96, 1.04) |
| Eggs | |||||||
| Median servings/day | 0.07 | 0.15 | 0.33 | 0.43 | 0.79 | ||
| Age-adjusted | 1.00 | 0.92(0.82,1.03) | 0.74(0.64,0.85) | 1.17(1.05,1.30) | 0.98(0.87,1.11) | 0.12 | 1.14(1.02, 1.27) |
| Multivariable * | 1.00 | 0.96(0.85,1.07) | 0.83(0.72,0.96) | 1.11(1.00,1.23) | 0.96(0.85,1.09) | 0.74 | 1.04(0.93, 1.16) |
| Nuts | |||||||
| Median servings/day | 0.00 | 0.04 | 0.07 | 0.12 | 0.40 | ||
| Age-adjusted | 1.00 | 0.61(0.54,0.68) | 0.85(0.77,0.94) | 0.63(0.57,0.70) | 0.54(0.48,0.60) | <0.0001 | 0.63(0.52, 0.75) |
| Multivariable * | 1.00 | 0.73(0.65,0.82) | 0.91(0.82,1.00) | 0.76(0.67,0.84) | 0.68(0.60,0.76) | <0.0001 | 0.78(0.66, 0.93) |
| Beans | |||||||
| Median servings/day | 0.00 | 0.02 | 0.05 | 0.07 | 0.14 | ||
| Age-adjusted | 1.00 | 0.56(0.48,0.66) | 0.73(0.65,0.82) | 0.83(0.76,0.91) | 0.75(0.67,0.83) | <0.0001 | 0.48(0.31, 0.73) |
| Multivariable * | 1.00 | 0.68(0.58,0.81) | 0.89(0.78,1.00) | 0.92(0.84,1.01) | 0.89(0.80,0.99) | 0.17 | 0.76(0.50, 1.14) |
In age-adjusted analyses, animal protein was associated with increased risk and vegetable protein was associated with decreased risk (animal protein relative risk (RR) across fifths: 1.00, 0.94, 0.96, 0.96, 1.14, p for trend 0.01; vegetable protein RR across fifths: 1.00, 0.84, 0.77, 0.69, 0.62, p for trend <0.0001). In the multivariable analyses, vegetable protein but not animal protein remained significantly associated with decreased risk (vegetable protein RR across fifths: 1.00, 0.88, 0.85, 0.80, 0.72, p for trend <0.001). However, when we included polyunsaturated fat, monounsaturated fat, and saturated fat in the multivariable models, we found no relation between animal or vegetable protein and CHD risk.
When we continued updating a participant’s diet even after she had been diagnosed with angina, diabetes, hypertension, hypercholesterolemia, cancer, or stroke, or had a coronary artery bypass, we saw similar associations with red meat as when we stopped updating diet at these diagnoses (relative risk for highest fifth = 1.31, 95% CI 1.15 −1.50, p for trend < 0.0001); however, poultry, fish, and high-fat dairy were no longer associated with CHD risk. When we stopped updating diet at the diagnosis of an intermediate outcome and also controlled for their presence in the multivariable model, red meat, poultry, fish, and high-fat dairy all remained significantly related to risk of CHD.
In the analyses of individual protein sources, higher intake of the red and processed meats were associated with increased risk, while higher intakes of fish, nuts, and beans were associated with decreased risk (Table 3). When compared to one serving/day of red meat, one serving/day of nuts, fish, poultry, or dairy was associated with a decreased risk of CHD (Figure 1). One serving/day of nuts was associated with a 30% (95% CI: 17% to 42%) lower risk of CHD when compared to one serving/day of red meat. Similarly, when compared to one serving/day of red meat, one serving/day of low-fat dairy was associated with a 13% (95% CI: 6% to 19%) lower risk, one serving/day of poultry was associated with a 19% (95% CI: 3% to 33%) lower risk, and one serving/day of fish was associated with a 24% (95% CI: 6% to 39%) lower risk.
Table 3. Relative Risks (RR) and 95% confidence intervals for coronary heart disease according to fifths of intake of Individual types of red meat, poultry, and fish.
| Fifths | |||||||
|---|---|---|---|---|---|---|---|
| 1st | 2nd | 3rd | 4th | 5th | P fortrend | RR for 1serving/day | |
| Chicken w/o skin | |||||||
| Medianservings/day | 0.00 | 0.07 | 0.14 | 0.24 | 0.43 | ||
| Multivariable * | 1.00 | 0.99(0.88,1.11) | 1.11(1.00,1.23) | 0.81(0.71,0.93) | 1.02(0.90,1.14) | 0.64 | 0.97(0.79, 1.19) |
| Chicken w/ skin | |||||||
| Medianservings/day | 0.00 | 0.04 | 0.07 | 0.14 | 0.31 | ||
| Multivariable * | 1.00 | 0.89(0.78,1.03) | 0.93(0.84,1.03) | 1.02(0.92,1.13) | 0.91(0.82,1.02) | 0.31 | 0.94(0.72, 1.23) |
| Bacon | |||||||
| Medianservings/day | 0.00 | 0.04 | 0.07 | 0.14 | 0.33 | ||
| Multivariable * | 1.00 | 0.80(0.70,0.91) | 1.05(0.95,1.17) | 1.04(0.94,1.16) | 1.03(0.91,1.15) | 0.17 | 1.41(1.12, 1.76) |
| Beef hot dog | |||||||
| Medianservings/day | 0.00 | 0.04 | 0.07 | 0.11 | 0.14 | ||
| Multivariable * | 1.00 | 0.86(0.76,0.97) | 1.14(1.03,1.26) | 0.88(0.77,1.01) | 1.11(0.99,1.23) | 0.07 | 1.35(0.94, 1.93) |
| Beef, mixed dish | |||||||
| Medianservings/day | 0.07 | 0.11 | 0.14 | 0.24 | 0.43 | ||
| Multivariable * | 1.00 | 0.80(0.70,0.91) | 1.13(1.02,1.25) | 0.80(0.71,0.90) | 1.09(0.98,1.22) | 0.22 | 1.23(1.01, 1.49) |
| Beef, main dish | |||||||
| Medianservings/day | 0.07 | 0.14 | 0.29 | 0.43 | 0.70 | ||
| Multivariable * | 1.00 | 1.18(1.05,1.33) | 0.90(0.79,1.03) | 1.14(1.00,1.30) | 1.10(0.96,1.27) | 0.70 | 1.08(0.92, 1.27) |
| Hamburger | |||||||
| Medianservings/day | 0.07 | 0.11 | 0.14 | 0.21 | 0.43 | ||
| Multivariable * | 1.00 | 0.83(0.73,0.94) | 1.14(1.03,1.27) | 0.86(0.75,0.99) | 1.09(0.98,1.23) | 0.11 | 1.42(1.10, 1.84) |
| Processed meat | |||||||
| Medianservings/day | 0.00 | 0.04 | 0.07 | 0.14 | 0.43 | ||
| Multivariable * | 1.00 | 0.89(0.79,1.01) | 0.98(0.88,1.08) | 0.98(0.88,1.10) | 1.05(0.93,1.17) | 0.11 | 1.20(1.03, 1.40) |
| Canned tuna | |||||||
| Medianservings/day | 0.02 | 0.07 | 0.11 | 0.14 | 0.33 | ||
| Multivariable * | 1.00 | 1.07(0.91,1.25) | 0.89(0.74,1.06) | 1.13(0.96,1.33) | 0.97(0.82,1.15) | 0.64 | 1.05(0.72, 1.54) |
| Dark fish | |||||||
| Medianservings/day | 0.00 | 0.07 | |||||
| Multivariable * | 1.00 | 0.92(0.82,1.02) | 0.13 | 0.96(0.37, 2.52) | |||
| Light fish | |||||||
| Medianservings/day | 0.00 | 0.04 | 0.07 | 0.14 | 0.29 | ||
| Multivariable * | 1.00 | 0.95(0.78,1.16) | 1.05(0.90,1.23) | 1.15(0.98,1.34) | 0.91(0.75,1.11) | 0.74 | 0.88(0.52, 1.49) |
Figure 1.
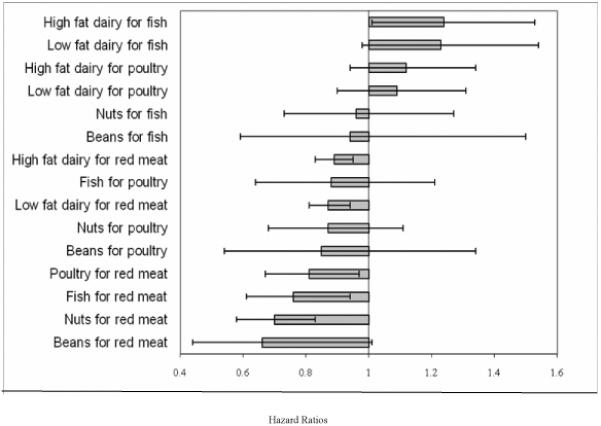
Relative risks and 95% confidence intervals for coronary heart disease associated with replacement of major dietary protein source for another
When compared to one serving/day of fish, one serving/day of dairy products was associated with an increased risk, while one serving/day of nuts or beans was not significantly associated with risk.
Discussion
In this prospective cohort study with 26 years of follow-up, we observed that a higher consumption of red meat was associated with an increased risk of coronary heart disease. The positive association was independent of established dietary and non-dietary cardiovascular risk factors as well as fruit and vegetable intake. When compared to red meat, intakes of dairy, poultry, fish, and especially nuts, were associated with substantially lower risk of coronary disease.
To date, only a few prospective and case-control studies have examined major dietary protein sources and risk of CHD. Snowdon et al followed 25,153 California Seventh-Day Adventists between 1960 and 1980 and observed that that daily meat consumption was associated with a 70% greater risk of fatal CHD in men and 37% greater risk in women 15. Gramenzi et al conducted a case-control study among women with 287 cases and 649 controls: women who consumed ham and salami more than 2 times per week had a significant 60% increased odds of myocardial infarction 16. Sinha et al followed 322,263 men and 223, 390 women in the National Institutes of Health–AARP study for 10 years, documenting 71,252 deaths, including 5,356 deaths from cardiovascular disease among women. They reported an increased risk of cardiovascular mortality among women consuming high intakes of red and processed meats (red meat: RR = 1.50 for highest versus lowest fifth; processed meat: RR = 1.38 for highest versus lowest fifth) 17.
In an earlier analysis of the Nurses Health Study with 14 years of follow up, increasing the ratio of red meat to poultry plus fish was associated with a highly significant positive association 2. A separate analysis with 16 years follow-up showed that higher fish consumption was associated with a lower risk of CHD 4. Compared to these studies, our analysis here has a longer follow up period and greater precision in dietary measurement due to a greater number of cases and repeated dietary questionnaires.
When we continued updating diet throughout follow-up, we no longer observed significant associations between poultry, fish, or high-fat dairy and CHD risk. This suggests other diseases and events do in fact lead nurses to change their diets and thus their presence confound the diet-disease association. Red meat, however, continued to be significantly related to CHD risk even when we continually updated diet and when we controlled for the intermediate outcomes. These results suggest a strong association between red meat and CHD, independent of measured confounders and known intermediate outcomes.
The positive association between total meat and CHD risk is likely driven by the high amount of red meat that makes up total meat intake (Spearman coefficient of correlation 0.94). The strong association between red meat and CHD is not entirely explained by processed meat intake, as red meat remained associated with CHD risk even after excluding processed meat.
Dietary iron, and particularly the heme iron found in red meat, has been positively associated with myocardial infarction and fatal CHD in most 18-22, but not all studies 23-24. Through its effect on systolic blood pressure, the high sodium content of processed meats may be associated with CHD risk 25-26. Compounds created by cooking red meat, including heterocyclic amines and advanced glycation end-products, may also be linked with CHD 27-34. Compared to polyunsaturated fat, high intakes of saturated fat and cholesterol have been linked with increased CHD risk 2-3. A recent meta-analysis reported that saturated fat consumption was not significantly associated with CHD risk 35; however, in this meta-analysis saturated fat was compared to other calorie sources, mostly refined carbohydrates, and high intake of refined carbohydrates has been associated with a high risk of CHD 36. In another recent meta-analysis, with findings similar to ours, total red meat and processed red meat were both positively associated with risk of CHD 37; however, in this meta-analysis, red meat was compared to other sources of calories and the published data did not allow for an explicit comparison with protein sources. When major sources of protein, such as nuts and fish, are used to replace red meat, saturated fat and heme iron and sodium decrease, while intake of polyunsaturated fat increases. The benefit on CHD risk of such a substitution is thus likely to be due to multiple simultaneous changes in nutrient intake.
Our analysis has several important strengths and limitations. The 26 year follow-up with updated dietary data, high follow up rate, and large number of study participants provided excellent power to detect differences in relative risks across fifths (for example: power for test for trend across five quantiles, with 3,162 cases and 80,974 controls and a two-sided test with alpha 0.05 was 99.67% 38). The ability to measure and control for known cardiovascular risk factors in multivariable models permitted less biased estimates of the independent association of protein-rich foods with CHD risk. Measurement of dietary data is imperfect and measurement error would likely lead to an underestimate of the true effect of the exposures with outcome 6. The repeated dietary data serves to reduce random error to some extent. Nevertheless, we cannot exclude the possibility of residual and unmeasured confounding due to the observational nature of this study.
In conclusion, in this large study of U.S. women, we found that greater consumption of red meat was associated with a higher risk of coronary heart disease. Compared to the same number of servings of red meat, consumption of fish, poultry, dairy products, and especially nuts was associated with lower risk. These finding suggest that the risk of coronary heart disease may be reduced importantly by shifting the sources of protein in the U.S. diet.
Supplementary Material
1
Acknowledgments
The authors thank the participants in the Nurses’ Health Study for their ongoing cooperation and commitment as well as Drs. Stephanie Chiuve and Eilis O’Reilly for their statistical support.
Sources of Funding: This study was supported by grants HL034594 and P01CA087969 from the National Institutes of Health, Department of Health and Human Services. In addition, Dr. Bernstein was supported by Public Health Service grant DK00703 from the National Institutes of Health, Dr. Sun was supported by a post-doctoral fellowship provided by Unilever, Inc., and Dr. Hu was supported by grant HL60712 from the National Institutes of Health.
Footnotes
Conflict of Interest Disclosures:
Dr. Hu reported receiving a unrestricted research grant from the California Walnut Commission.
This is a PDF file of an unedited manuscript that has been accepted for publication. As a service to our customers we are providing this early version of the manuscript. The manuscript will undergo copyediting, typesetting, and review of the resulting proof before it is published in its final citable form. Please note that during the production process errors may be discovered which could affect the content, and all legal disclaimers that apply to the journal pertain.
References
- 1.Halton TL, Willett WC, Liu S, Manson JE, Albert CM, Rexrode K, Hu FB. Low-carbohydrate-diet score and the risk of coronary heart disease in women. N Engl J Med. 2006;355:1991–2002. doi: 10.1056/NEJMoa055317. [DOI] [PubMed] [Google Scholar]
- 2.Hu FB, Stampfer MJ, Manson JE, Ascherio A, Colditz GA, Speizer FE, Hennekens CH, Willett WC. Dietary saturated fats and their food sources in relation to the risk of coronary heart disease in women. Am J Clin Nutr. 1999;70:1001–1008. doi: 10.1093/ajcn/70.6.1001. [DOI] [PubMed] [Google Scholar]
- 3.Hu FB, Stampfer MJ, Manson JE, Rimm E, Colditz GA, Rosner BA, Hennekens CH, Willett WC. Dietary fat intake and the risk of coronary heart disease in women. N Engl J Med. 1997;337:1491–1499. doi: 10.1056/NEJM199711203372102. [DOI] [PubMed] [Google Scholar]
- 4.Hu FB, Bronner L, Willett WC, Stampfer MJ, Rexrode KM, Albert CM, Hunter D, Manson JE. Fish and omega-3 fatty acid intake and risk of coronary heart disease in women. JAMA. 2002;287:1815–1821. doi: 10.1001/jama.287.14.1815. [DOI] [PubMed] [Google Scholar]
- 5.Willett WC. Nutritional Epidemiology. Second ed. Oxford University Press; New York and Oxford: 1998. [Google Scholar]
- 6.Stampfer MJ, Hu FB, Manson JE, Rimm EB, Willett WC. Primary prevention of coronary heart disease in women through diet and lifestyle. N Engl J Med. 2000;343:16–22. doi: 10.1056/NEJM200007063430103. [DOI] [PubMed] [Google Scholar]
- 7.Feskanich D, Rimm EB, Giovannucci EL, Colditz GA, Stampfer MJ, Litin LB, Willett WC. Reproducibility and validity of food intake measurements from a semiquantitative food frequency questionnaire. J Am Diet Assoc. 1993;93:790–796. doi: 10.1016/0002-8223(93)91754-e. [DOI] [PubMed] [Google Scholar]
- 8.Giovannucci E, Colditz G, Stampfer MJ, Rimm EB, Litin L, Sampson L, Willett WC. The assessment of alcohol consumption by a simple self-administered questionnaire. Am J Epidemiol. 1991;133:810–817. doi: 10.1093/oxfordjournals.aje.a115960. [DOI] [PubMed] [Google Scholar]
- 9.Salvini S, Hunter DJ, Sampson L, Stampfer MJ, Colditz GA, Rosner B, Willett WC. Food-based validation of a dietary questionnaire: the effects of week-to-week variation in food consumption. Int J Epidemiol. 1989;18:858–867. doi: 10.1093/ije/18.4.858. [DOI] [PubMed] [Google Scholar]
- 10.Willett WC, Sampson L, Browne ML, Stampfer MJ, Rosner B, Hennekens CH, Speizer FE. The use of a self-administered questionnaire to assess diet four years in the past. Am J Epidemiol. 1988;127:188–199. doi: 10.1093/oxfordjournals.aje.a114780. [DOI] [PubMed] [Google Scholar]
- 11.Willett WC, Sampson L, Stampfer MJ, Rosner B, Bain C, Witschi J, Hennekens CH, Speizer FE. Reproducibility and validity of a semiquantitative food frequency questionnaire. Am J Epidemiol. 1985;122:51–65. doi: 10.1093/oxfordjournals.aje.a114086. [DOI] [PubMed] [Google Scholar]
- 12.Rose GA, B H. World Health Organization Monograph Series. Geneva: 1982. Cardiovascular Survey Methods; p. 58. [PubMed] [Google Scholar]
- 13.Stampfer MJ, Willett WC, Speizer FE, Dysert DC, Lipnick R, Rosner B, Hennekens CH. Test of the National Death Index. Am J Epidemiol. 1984;119:837–839. doi: 10.1093/oxfordjournals.aje.a113804. [DOI] [PubMed] [Google Scholar]
- 14.Halton TL, Willett WC, Liu S, Manson JE, Stampfer MJ, Hu FB. Potato and french fry consumption and risk of type 2 diabetes in women. Am J Clin Nutr. 2006;83:284–290. doi: 10.1093/ajcn/83.2.284. [DOI] [PubMed] [Google Scholar]
- 15.Snowdon DA, Phillips RL, Fraser GE. Meat consumption and fatal ischemic heart disease. Prev Med. 1984;13:490–500. doi: 10.1016/0091-7435(84)90017-3. [DOI] [PubMed] [Google Scholar]
- 16.Gramenzi A, Gentile A, Fasoli M, Negri E, Parazzini F, La Vecchia C. Association between certain foods and risk of acute myocardial infarction in women. BMJ. 1990;300:771–773. doi: 10.1136/bmj.300.6727.771. [DOI] [PMC free article] [PubMed] [Google Scholar]
- 17.Sinha R, Cross AJ, Graubard BI, Leitzmann MF, Schatzkin A. Meat intake and mortality: a prospective study of over half a million people. Arch Intern Med. 2009;169:562–571. doi: 10.1001/archinternmed.2009.6. [DOI] [PMC free article] [PubMed] [Google Scholar]
- 18.van der AD, Peeters PH, Grobbee DE, Marx JJ, van der Schouw YT. Dietary haem iron and coronary heart disease in women. Eur Heart J. 2005;26:257–262. doi: 10.1093/eurheartj/ehi027. [DOI] [PubMed] [Google Scholar]
- 19.Lee DH, Folsom AR, Jacobs DR., Jr. Iron, zinc, and alcohol consumption and mortality from cardiovascular diseases: the Iowa Women’s Health Study. Am J Clin Nutr. 2005;81:787–791. doi: 10.1093/ajcn/81.4.787. [DOI] [PubMed] [Google Scholar]
- 20.Ascherio A, Willett WC, Rimm EB, Giovannucci EL, Stampfer MJ. Dietary iron intake and risk of coronary disease among men. Circulation. 1994;89:969–974. doi: 10.1161/01.cir.89.3.969. [DOI] [PubMed] [Google Scholar]
- 21.Klipstein-Grobusch K, Grobbee DE, den Breeijen JH, Boeing H, Hofman A, Witteman JC. Dietary iron and risk of myocardial infarction in the Rotterdam Study. Am J Epidemiol. 1999;149:421–428. doi: 10.1093/oxfordjournals.aje.a009829. [DOI] [PubMed] [Google Scholar]
- 22.Tzonou A, Lagiou P, Trichopoulou A, Tsoutsos V, Trichopoulos D. Dietary iron and coronary heart disease risk: a study from Greece. Am J Epidemiol. 1998;147:161–166. doi: 10.1093/oxfordjournals.aje.a009429. [DOI] [PubMed] [Google Scholar]
- 23.Malaviarachchi D, Veugelers PJ, Yip AM, MacLean DR. Dietary iron as a risk factor for myocardial infarction. Public health considerations for Nova Scotia. Can J Public Health. 2002;93:267–270. doi: 10.1007/BF03405014. [DOI] [PMC free article] [PubMed] [Google Scholar]
- 24.Qi L, van Dam RM, Rexrode K, Hu FB. Heme iron from diet as a risk factor for coronary heart disease in women with type 2 diabetes. Diabetes Care. 2007;30(1):101–106. doi: 10.2337/dc06-1686. [DOI] [PubMed] [Google Scholar]
- 25.Bibbins-Domingo K, Chertow GM, Coxson PG, Moran A, Lightwood JM, Pletcher MJ, Goldman L. Projected effect of dietary salt reductions on future cardiovascular disease. N Engl J Med. 2010;362:590–599. doi: 10.1056/NEJMoa0907355. [DOI] [PMC free article] [PubMed] [Google Scholar]
- 26.Smith-Spangler CM, Juusola JL, Enns EA, Owens DK, Garber AM. Population strategies to decrease sodium intake and the burden of cardiovascular disease: a cost-effectiveness analysis. Ann Intern Med. 2010;152:481–487. doi: 10.7326/0003-4819-152-8-201004200-00212. [DOI] [PubMed] [Google Scholar]
- 27.Baranczewski P, Gustafsson JA, Moller L. DNA adduct formation of 14 heterocyclic aromatic amines in mouse tissue after oral administration and characterization of the DNA adduct formed by 2-amino-9H-pyrido[2,3-b]indole (AalphaC), analysed by 32P_HPLC. Biomarkers. 2004;9:243–257. doi: 10.1080/13547500400010056. [DOI] [PubMed] [Google Scholar]
- 28.Gertig DM, Hankinson SE, Hough H, Spiegelman D, Colditz GA, Willett WC, Kelsey KT, Hunter DJ. N-acetyl transferase 2 genotypes, meat intake and breast cancer risk. Int J Cancer. 1999;80:13–17. doi: 10.1002/(sici)1097-0215(19990105)80:1<13::aid-ijc3>3.0.co;2-w. [DOI] [PubMed] [Google Scholar]
- 29.Hansen ES. International Commission for Protection Against Environmental Mutagens and Carcinogens. ICPEMC Working Paper 7/1/2. Shared risk factors for cancer and atherosclerosis--a review of the epidemiological evidence. Mutat Res. 1990;239:163–179. doi: 10.1016/0165-1110(90)90004-u. [DOI] [PubMed] [Google Scholar]
- 30.Kankova K. Diabetic threesome (hyperglycaemia, renal function and nutrition) and advanced glycation end products: evidence for the multiple-hit agent? Proc Nutr Soc. 2008;67:60–74. doi: 10.1017/S0029665108006034. [DOI] [PubMed] [Google Scholar]
- 31.Santarelli RL, Pierre F, Corpet DE. Processed meat and colorectal cancer: a review of epidemiologic and experimental evidence. Nutr Cancer. 2008;60:131–144. doi: 10.1080/01635580701684872. [DOI] [PMC free article] [PubMed] [Google Scholar]
- 32.Spiteller G. Peroxyl radicals are essential reagents in the oxidation steps of the Maillard reaction leading to generation of advanced glycation end products. Ann N Y Acad Sci. 2008;1126:128–133. doi: 10.1196/annals.1433.031. [DOI] [PubMed] [Google Scholar]
- 33.Wakabayashi K, International Commission for Protection Against Environmental Mutagens and Carcinogens ICPEMC Working Paper 7/1/3. Animal studies suggesting involvement of mutagen/carcinogen exposure in atherosclerosis. Mutat Res. 1990;239:181–187. doi: 10.1016/0165-1110(90)90005-v. [DOI] [PubMed] [Google Scholar]
- 34.Wu K, Giovannucci E, Byrne C, Platz EA, Fuchs C, Willett WC, Sinha R. Meat mutagens and risk of distal colon adenoma in a cohort of U.S. men. Cancer Epidemiol Biomarkers Prev. 2006;15:1120–1125. doi: 10.1158/1055-9965.EPI-05-0782. [DOI] [PubMed] [Google Scholar]
- 35.Siri-Tarino PW, Sun Q, Hu FB, Krauss RM. Meta-analysis of prospective cohort studies evaluating the association of saturated fat with cardiovascular disease. Am J Clin Nutr. 2010;91:535–546. doi: 10.3945/ajcn.2009.27725. [DOI] [PMC free article] [PubMed] [Google Scholar]
- 36.Siri-Tarino PW, Sun Q, Hu FB, Krauss RM. Saturated fat, carbohydrate, and cardiovascular disease. Am J Clin Nutr. 2010;91:502–509. doi: 10.3945/ajcn.2008.26285. [DOI] [PMC free article] [PubMed] [Google Scholar]
- 37.Micha R, Wallace SK, Mozaffarian D. Red and processed meat consumption and risk of incident coronary heart disease, stroke, and diabetes mellitus: a systematic review and meta-analysis. Circulation. 2010;121:2271–2283. doi: 10.1161/CIRCULATIONAHA.109.924977. [DOI] [PMC free article] [PubMed] [Google Scholar]
- 38.Chapman DN, J M. Asymptotic power of chi square tests for linear trend in proportions. Biometrics. 1968;24:315–327. [PubMed] [Google Scholar]
Associated Data
This section collects any data citations, data availability statements, or supplementary materials included in this article.
Supplementary Materials
1