Identification and Characterization of Neuronal Precursors and Their Progeny From Human Fetal Tissue (original) (raw)
. Author manuscript; available in PMC: 2010 Nov 9.
Published in final edited form as: J Neurosci Res. 2001 Nov 1;66(3):356–368. doi: 10.1002/jnr.1228
Abstract
We have examined primary human neuronal precursors (HNPs) from 18–22-week-old fetuses. We showed that E-NCAM/MAP2/β-III tubulin-immunoreactive neuronal precursors divide in vitro and could be induced to differentiate into mature neurons in 2 weeks. HNPs did not express nestin and differentiated slowly compared to rodent neuronal restricted precursors (NRPs, 5 days). Immunocytochemical and physiological analyses showed that HNPs could generate a heterogeneous population of neurons that expressed neurofilament-associated protein and various neurotransmitters, neurotransmitter synthesizing enzymes, voltage-gated ion channels, and ligand-gated neurotransmitter receptors and could fire action potentials. Undifferentiated and differentiated HNPs did not coexpress glial markers. Only a subset of cells that expressed GFP under the control of the Tα1 tubulin promoter was E-NCAM/β-III tubulin-immunoreactive, indicating nonexclusive overlap between these two HNP cell populations. Overall, HNPs resemble NRPs isolated from rodent tissue and appear to be a neuronal precursor population.
Keywords: stem cells, differentiation, electrophysiology
Multipotent human neural stem cells (NSCs) have been isolated from fetal human forebrain and spinal cord (Buc-Caron, 1995; Sabate et al., 1995; Svendsen et al., 1996, 1998; Chalmers-Redman et al., 1997; Johansson et al., 1999; Vescovi et al., 1999a,b; Carpenter et al., 1999; Quinn et al., 1999; Piper et al., 2000) as well as the adult human subependymal zone and hippocampus (Kukekov et al., 1999; Roy et al., 2000a,b). Furthermore, phenotypically restricted lineages have also been reported for human brain tissue. These include glial restricted precursors (GRPs), which have been isolated from adult human brain tissue (Scolding et al., 1999; Roy et al., 1999), and recent reports have suggested the existence of neuronal restricted precursors (NRPs) in both fetal (Raymon et al., 1999; Li et al., 2000) and adult (Roy et al., 2000a,b; Wang et al., 2000) human tissue.
NSCs or neuroepithelial precursor cells (NEPs) can generate neurons in vitro (Carpenter et al., 1999; Piper et al., 2000) as well as in vivo (Svendsen et al., 1998; Vescovi et al., 1999b). In vitro, neurons derived from less committed, NEP-like cell populations develop slowly and do not mature fully until after 70 days under differentiating conditions (Chalmers-Redman et al., 1997). Once differentiated, NEP-derived neuronal cells acquired Na+ and K+ channels but did not develop the ability to fire action potentials despite prolonged culture periods (>3 weeks; Piper et al., 2000). These data suggested that, in human cells, neuronal maturation may require factors other than those described for rodent systems (Chalmers-Redman et al., 1997).
An alternative strategy for obtaining mature neurons may be to isolate more differentiated precursors (for review see Rao 1999). Indeed, such a strategy has been successful in rodent primary (Mayer-Proschel et al., 1997; Kalyani et al., 1998) and ES (Mujtaba et al., 1999) cell cultures. The limited evidence available suggests that this may be true for human precursor cells as well. Immortalized human neuronal precursors (HNPs) mature more rapidly than NSCs from stem cell cultures; for example, immortalized HNPs derived from the spinal neuroepithelium develop action potentials and antigenic phenotypes consistent with spinal cord motor neurons after 4 days (Raymon et al., 1999; Li et al., 2000). Recently, HNPs were isolated from the adult ventricular zone and hippocampus using fluorescence-activated cell sorting (FACS) of brain cells transfected with plasmid DNA in which a neuronal precursor-selective Tα1 tubulin promoter was used to drive the expression of GFP (Roy et al., 2000a,b; Wang et al., 2000). These cells also mature within 2 weeks in culture, although no information on their electrophysiological characteristics and neurotransmitter expression is available.
Our goal in the present studies was to determine whether nonimmortalized HNPs represent a more rapidly maturing functional population than NEPs, whether HNPs are capable of generating multiple neuronal phenotypes, and whether E-NCAM immunoreactivity (IR) and the Tα1 tubulin-driven expression of GFP identify the same population of HNPs. We found that a subset of the cells that expressed GFP under the control of Tα1 tubulin promoter also expressed E-NCAM/β-III tubulin, although the majority did not. These data indicate a non-exclusive overlap between two HNP cell populations. By comparing the immunocytochemical, morphological, and physiological properties of acutely passaged and differentiated HNPs, we show that HNPs resemble NRPs isolated from rodent tissue and appear to be a neuronal precursor population capable of self-renewal and relatively rapid functional maturation of heterogeneous phenotypes.
MATERIALS AND METHODS
Tissue Isolation
Human fetal tissue was collected from five 18–22-week-old fetuses (one 18 weeks, two 20 weeks, two 22 weeks) into Ca/Mg-free Hanks’ balanced salt solution (HBSS). The entire brain region was harvested to maximize the amount of neural tissue collected. Tissue from each fetus was processed and cultured separately. Other than the absolute number of cells obtained, there were no differences between isolations. The tissues were cut into small pieces in PIPES solution (120 mM NaCl, 5 mM KCl, 25 mM glucose, 20 mM PIPES) and then digested with papain (11.4 units/ml papain; Worthington Biochemical Corp., Lakewood, NJ) and DNase I (10 units/ml; Sigma, St. Louis, MO) in PIPES solution by gently shaking for 1 hr at 37°C in 5% CO2. Following incubation, the tissue was collected by centrifuging at 200_g_ for 5 min in an IEC Centra-4B centrifuge, resuspended in DMEM/F12/N2 (Gibco BRL, Rockville, MD) with DNase I (10 units/ml), and incubated for 15 min at 37°C in 5% CO2. The samples were spun and the pellets resuspended in 2 ml of DMEM/F12/N2, then dissociated by sequentially triturating for 20, 10, and 5 times, through three serially narrowed glass Pasteur pipettes. The dissociated cells were purified by passing through a 40 μm cell strainer (Becton-Dickinson, Franklin Lakes, NJ), rinsed with DMEM/F12/N2, and resuspended at 4 × 10⁶ cells/ml in DMEM/F12/N2. The cells were plated at 0.5 ml/dish into 35 mm Falcon Primaria plates, precoated with murine laminin (2 μg/cm2; Gibco BRL) and incubated at 37°C in 5% CO2. After 1 day, an additional 0.5 ml of DMEM/F12/N2 with 25 ng/ml, basic fibroblast growth factor (bFGF; Preprotech, New York, NY) was added to each plate. After incubation for 1–3 days, cells were transferred to T75 culture flasks and flown from New York City to Salt Lake City and delivered to the University of Utah. All tissues were obtained with approval of the Institutional Review Boards of both the University of Utah Medical School (Protocol 7741-99) and Cornell New York Presbyterian Hospital (Protocol 0597-808).
Substrate Preparation
Poly-L-lysine (pLL; Sigma) was dissolved in distilled water (13.3 μg/ml) and applied to 35 mm tissue culture plates or 12 or 18 mm glass coverslips for 1 hr. Excess pLL was withdrawn, and the plates were rinsed once with water. The plates were then incubated with laminin (15 μg/ml in DPBS) for 4 hr at 37°C or at 4°C overnight. The dishes were rinsed once with basal medium just before plating the cells at 2–5 × 10³ cells per plate.
Culture Conditions
The basal medium used in all experiments consisted of DMEM-F12 (Gibco BRL) supplemented as previously described (Piper et al., 2000), along with bFGF (25 ng/ml; Peprotech) and neurotrophin-3 (NT-3; 1 ng/ml; Upstate Biotechnology, Lake Placid, NY). Proliferative cells could be maintained in basal medium for 3 months. For this study, cells were placed under differentiating conditions between 2 and 5 days in culture (DIC). Proliferation was inhibited and differentiation could be induced by reducing bFGF concentrations to 10 ng/ml and adding retinoic acid [RA; 1 μM in 0.01% di-methyl solfoxide (DMSO)] and bone morphogenic protein-2 (BMP-2; 10 ng/ml; Kalyani, 1998). These conditions support neuronal cells, and, by day 14, only 20% of the culture was glial.
BrdU Incorporation
To assess the proliferation of neuronal precursor cells, 5-bromo-2′-deoxyuridine (BrdU; 10 μM; Sigma) was added to the cells for 48 hr. The cells were then fixed with 2% paraformaldehyde for 15 min at room temperature, followed by 95% methanol for 30 min at 20°C. Cells were then washed three times with phosphate-buffered saline (PBS) and 5% goat serum and permeabilized with 2 N HCl for 10 min. Acid was removed by three washes with PBS and 5% goat serum, and the residual HCl was neutralized with sodium borate (Sigma) for 10 min. After rinsing with PBS, cells were incubated with either mouse anti-BrdU antibody (1:100; Sigma) or rat anti-BrdU antibody (1:10; Accurate, Westbury, NY) for 30 min at room temperature in buffer containing 0.5% Triton X-100. The cells were then incubated with goat anti-mouse IgG1 conjugated to a fluorescent label (1:100; Jackson Immunoresearch, West Grove, PA) for 30 min. After three washes with PBS, the cells were observed with a Zeiss fluorescence microscope.
Transient Transfection
The p/Tα1:GFP was constructed as previously described (Wang et al., 2000). We used a proprietary cationic liposome, Effectene (Qiagen Germany), to transfect these promoter-drive plasmids into cultured fetal cells following the manufacturer’s protocols. After the first day in vitro, 1 ml of DMEM/F12/N2 with 5% FBS was added to each culture. Appropriate target cells typically expressed GFP within 2 days of transfection. Transfected cultures were harvested after 5 days and processed for double-label immunocytochemistry as described below.
Immunocytochemistry
Staining procedures were as described previously (Mayer-Proschel et al., 1997). Staining for cell surface markers such E-NCAM was done in cultures of living cells. To stain cells with antibodies against internal antigens, cultures were fixed with 2–4% formaldehyde for 30 min at room temperature. In general, dishes were incubated with the primary antibody for 1 hr, followed by incubation with an appropriate secondary antibody for an additional 1 hr. Double-labeling experiments were performed by simultaneously incubating cells in appropriate combinations of primary antibodies, followed by noncross reactive secondary antibodies. Negative controls with omission of primary or secondary antibodies were run simultaneously. Following antibody staining, 4–6-diamidino-2-phenylindoline (DAPI; Sigma) histochemistry was performed as described previously (Kalyani et al., 1997). Staining was visualized under phase optics using dichroic filters that isolate the appropriate excitation and emission wavelengths associated with each marker and thereby reduce any bleed-through to low background levels. We also routinely stained with only one marker to test for bleed-through across the filter sets used.
We used a panel of phenotype-selective antibodies to assess specific neural cell phenotypes. NEP cells were detected using rabbit anti-human nestin (Lendahl et al., 1990; Dahlstrand et al., 1995; Messam et al., 2000), and HNPs were identified with E-NCAM (Mayer-Proschel et al., 1997). β-III Tubulin (Menezes and Luskin, 1994) and MAP2 were used as markers of HNPs and neurons (Peng et al., 1986; Kosik and Finch, 1987), and synaptophysin and RT-97 were used as markers of mature neurons (Kahn et al., 1987). A2B5 was used to identify GRPs (Eisenbarth et al., 1979), although it can recognize a subset of NRPs (Mujtaba et al., 1999), GFAP was used to identify astrocytes (Bignami et al., 1972), and O4 and Gal-C were used to identify oligodendrocytes (Bansal et al., 1989). Antibodies against specific neurotransmitters and neurotransmitter-synthesizing enzymes were used to assess specific, mature, neuronal phenotypes: glutamate, glycine, choline acetyltransferase (ChAT), and tyrosine hydroxylase (TH). Anti-BrdU antibodies were used to visualize BrdU uptake into S-phase cells. Table I details the isotypes, species, clonality, dilutions, and suppliers for each of these primary antibodies. All secondary antibodies were purchased from either Jackson Immunoresearch Laboratories or Southern Biotechnology Associates Inc. (Birmingham, AL).
TABLE I.
Summary of Primary Antibodies Used in These Studies
| Antigen/antibody | Type | Species | Clonality | Dilution | Source |
|---|---|---|---|---|---|
| E-NCAM | IgM | Hybridoma | Monoclonal | 1:1 | Developmental Hybridoma Studies Bank (DHSB), University of Iowa, Iowa City, IA |
| A2B5 | IgM | Hybridoma | Monoclonal | 1:1 | ATCC, Rockville, MD |
| β-III Tubulin | IgG2b | Mouse | Monoclonal | 1:100 | Sigma, St. Louis, MO |
| MAP2 | IgG | Mouse | Monoclonal | 1:500 | Sigma |
| Human nestin | IgG | Rabbit | Polyclonal | 1:400 | Generated by C. Messam at the NIH-NINDS, Bethseda, MD |
| RT-97 | IgG1 | Mouse | Monoclonal | 1:1 | Developmental Hybridoma Studies Bank (DHSB) |
| Synaptophysin | IgG | Mouse | Monoclonal | 1:100 | Sigma |
| NF-150 | IgG | Mouse | Monoclonal | 1:500 | Sigma |
| ChAT | IgG | Goat | Polyclonal | 1:100 | Chemicon, Temecula, CA |
| TH | IgG | Rabbit | Polyclonal | 1:500 | Chemicon |
| Glutamate | IgG | Rabbit | Polyclonal | 1:100 | Signature Immunologicals, Salt Lake City, UT |
| Glycine | IgG | Rabbit | Polyclonal | 1:100 | Signature Immunologicals |
| GFAP | IgG | Rabbit | Polyclonal | 1:500 | Dako, Carpinteria, CA |
| O4 | IgM | Mouse | Monoclonal | 1:25 | Gift of Dr. M. Mayer-Proschel, University of Rochester, Rochester, NY |
| Gal C | IgG | Mouse | Monoclonal | 1:5 | Gift of Dr. M. Mayer-Proschel |
Electrophysiology
Cells were plated on 12 mm glass coverslips and live stained with E-NCAM antibody as described above. Only E-NCAM+ cells were used for whole-cell current and voltage-clamp recordings (Hamill et al., 1981). Electrodes were pulled from thick-walled borosilicate glass on a Flaming/Brown P-87 pipette puller (Sutter Instruments, Novato, CA), to resistances of ~3–6 MΩ. An Axopatch 200B amplifier was interfaced through a Digidata 1320A analog-to-digital converter (Axon Instruments, Foster City, CA) to a Gateway PC. Data were filtered at 1–10 kHz, then digitized and sampled at 2–50 kHz using pClamp 8 software to control the amplifier and the converter (Axon Instruments). Data were analyzed with pClamp 8, Webfoot (Biodiversity, Park City, UT), and Origin 6.0 (Micro-cal, Northampton, MA).
The external bath solution, human Ringer’s (HR), consisted of (in mM): 140 NaCl, 3 KCl, 1 MgCl2, 2 CaCl2, 10 HEPES, and 10 glucose, pH 7.4. To study action-potential generation, a KAsp internal pipette solution was used consisting of (in mM): 50 KF, 75 Kaspartate, 15 NaCl, 11 EGTA, 10 HEPES. To study Na+ currents in isolation, a CsF solution was used consisting of (in mM): 125 CsF, 15 CsCl, 11 EGTA, 10 HEPES. Both internal solutions were set to pH 7.2 with KOH or CsOH as appropriate. Bath ground was established with a 3 M KCl/Agar bridge. Liquid junction potentials (LJPs) were calculated with Clampex (Axon Instruments), and data were corrected appropriately. The calculated LJPs for the internal solutions with HR as the external solution were: KAsp = 12 mV and CsF = 9 mV. Physiological experiments were conducted on cells from each of the five isolations. No differences were observed between isolates, and the data are reported as the mean ± SEM, with n = total number of cells tested.
Intracellular Ca2+ Measurements
Cells were loaded with 5 μM fura-2am and 80 μg/ml pluronic F127 (Grynkiewicz et al., 1985) in HR for 30 min at 23°C in the dark. The cells were then washed three times with HR, and the fura-2am was allowed to deesterify for 30 min. Changes in the ratio of fluorescence emission intensity at 520 nm by excitation at 340/380 nm were measured and correlated with changes in intracellular calcium ([Ca2+]i) using a standard two-point calibration scheme (Grynkiewicz, 1985).
A Zeiss Attofluor imaging system (Atto Instruments Inc., Rockville, MD) was used to acquire and analyze the data, which were sampled at 1 Hz. Data were collected only from identified live-stained E-NCAM+ cells. Neurotransmitters (500 μM) were made fresh in HR and included γ-aminobutyric acid (GABA), glycine (G), dopamine (DA), glutamate (E), acetylcholine (ACh), and norepinephrine (NE; Sigma). In addition, a 50 mM K+ HR solution was used to depolarize the cells and to test for Ca2+ influx through voltage-gated channels (47 mM NaCl in HR replaced by 47 mM KCl). Ascorbic acid (500 μM) was added to DA and NE solutions to prevent oxidation. Control applications of 500 μM ascorbic acid had no effect. The pH of all test solutions was adjusted to 7.4 with 1 M NaOH. A response to neurotransmitter was defined as a minimum 10% transient rise over the baseline fluorescence ratio within 60 sec from the time of loop insertion. The dead time from loop to bath inport was approximately 10–15 sec.
RESULTS
Acutely Passaged Cultures Contain Nestin− Dividing Neural Precursors
Human fetal cultures (18–22 weeks) were obtained as first-passage cells and characterized. All cultures consisted of a mixed population of cells, which increased in the percentage of E-NCAM/β-III tubulin-expressing cells from 16–20% at 2 days in culture (DIC) to 60% at 6 DIC to 80% at 14 DIC (Fig. 1A,A′,A″, Tables II, III). The 2 DIC cells had small somas and few blunt processes and grew in tight clusters. Although 50% of this mixed population incorporated BrdU after a 16 hr BrdU pulse, only a subset (30%) of the E-NCAM/β-III tubulin-immunoreactive (+) cells (Fig. 1B,C, Table II) was BrdU+. Acutely passaged, E-NCAM/β-III tubulin+ HNPs (Fig. 1D) coexpressed the neuronal protein MAP2 (Fig. 1D′), but none of them coexpressed glial markers such as GFAP or oliogdendroglial markers such as Gal-C and O4 (Fig. 1E–G). A small percentage (<1%) of HNPs coexpressed the GRP marker A2B5; however, A2B5 IR has previously been described in NRPs (Mujtaba et al., 1999). Table II summarizes the IR patterns for cells fixed at 2 and 6 DIC.
Fig. 1.
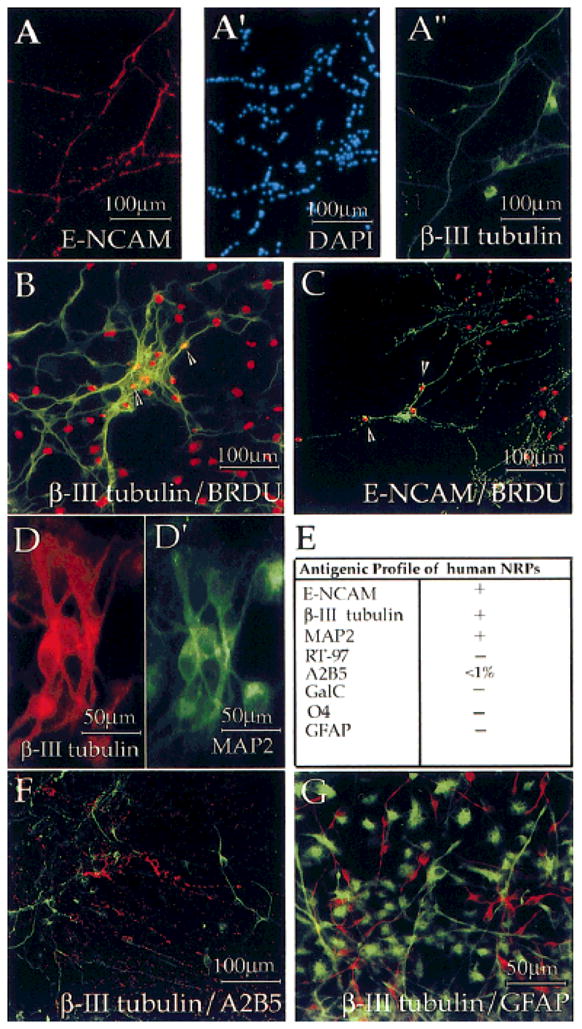
Human neuronal precursors were mitotic and E-NCAM+. First-passage cells were acutely dissociated, plated, and processed for immunocytochemistry 48 hr later. A: First-passage HNPs displayed IR for E-NCAM (A, red) and β-III tubulin (A″, green). DAPI staining of nuclei (A′, blue) shows that only a subset of the cells expresses neuronal markers. β-III Tubulin+ and E-NCAM+ cells (B,C, green) incorporated BrdU (B,C, red), indicating that they were mitotic (arrowheads indicate double-labeled cells). β-III Tubulin+ cells (D, red) coexpressed another neuronal-specific protein, MAP2 (D′, green). β-III Tubulin+ cells (F, green, and G, red) did not coexpress the glial markers A2B5 (F, red) or GFAP (G, green). Staining was performed on two or three dishes of cells from four different isolations. E shows human NRP antigenic profiles.
TABLE II.
Immunostaining Profiles (%) of Human Fetal Brain Culture*
| BrdU+ | Nestin+ | A2B5+ | GFAP+ | E-NCAM+ | β-III Tubulin+ | |
|---|---|---|---|---|---|---|
| First passage, 2 DIC | ||||||
| Percentage of total | 50 | ~70 | <1 | 32 | 20 | 16 |
| Nestin+ | 80 | 100 | <1 | 90 | ~5 | None |
| A2B5+ | ~2 | <1 | 100 | ~5 | <1 | <1 |
| GFAP+ | nd | 15 | 5 | 100 | None | None |
| E-NCAM+ | 30 | ~5 | <1 | None | 100 | 100 |
| β-III tubulin+ | 30 | None | <1 | None | 80 | 100 |
| First passage, 6 DIC | ||||||
| Percentage of total | 30 | ~40 | <1 | 30 | 60 | ~60 |
| Nestin+ | 25 | 100 | <1 | 90 | ~2 | None |
| A2B5+ | ~1 | <1 | 100 | 5 | <1 | <1 |
| GFAP+ | nd | 10 | 5 | 100 | None | None |
| E-NCAM+ | 5 | ~2 | <1 | None | 100 | 100 |
| β-III tubulin+ | 5 | None | <1 | None | 100 | 100 |
TABLE III.
Immunostaining Profiles (%) of Differentiated E-NCAM+ HNPs*
| Condition | E-NCAM+ |
|---|---|
| Differentiation media 14 DIC | |
| Percentage of total cells | ~80 |
| Synaptophysin+ | 3–5 |
| Glutamate+ | ~5 |
| Glycine+ | ~5 |
| TH+ | 2 |
| ChAT+ | 2 |
| MAP2+ | ~75 |
| NF-150+ | 5–10 |
HNP cells could be isolated using E-NCAM immunopanning but could not be maintained in clonal culture. Cells either failed to survive or did not divide more than once after replating. Thus our ability to maintain purified mitotic populations of HNPs for long periods is limited. In contrast, HNPs could be maintained in mixed population and would continue to proliferate for 4–6 weeks or differentiate into postmitotic neurons, but not into astrocytes or oligodendrocytes (Fig. 1E–G).
Because a characteristic feature of the rodent NRPs is the coexpression of nestin with early neuronal markers (Mayer-Proschel et al., 1997), we obtained a human specific nestin antibody (Messam et al., 2000) and examined the expression of nestin in acutely passaged mixed cultures. Nestin expression was abundant (Fig. 2A; ~70% total cells), and, although only 15% of the nestin+ cells stained for GFAP, 90% of the GFAP+ cells were colabeled with nestin (Fig. 2B, arrowheads, Table II). Although ~2% of E-NCAM+ cells stained for nestin (Fig. 2C, arrowheads), none of the β-III tubulin+ cells either in acutely dissociated cells (Fig. 2D) or in passaged cell cultures were nestin+ (Table II). These results raised the possibility that some of the dividing HNPs that we observe in culture do not express nestin immunoreactivity (IR). To test this, we pulsed cultures with BrdU and examined expression of both nestin (Fig. 2E, arrowhead) and β-III tubulin (Fig. 2F) in BrdU-incorporating cells. A few nestin-immunonegative/BrdU-incorporating cells were seen (Fig. 2E, arrow). Triple labeling with β-III tubulin+ confirmed that the nestin-immunonegative/BrdU-incorporating cells were HNPs (Fig. 2F, arrowhead).
Fig. 2.

HNPs do not coexpress nestin. Acutely dissociated human neural cells were grown for 5 days in culture, pulsed with BrdU for 16 hr (E,F), fixed, and processed for immunocytochemistry to detect the expression of nestin (A,B,D,F, red, and C,E, green) and GFAP (B, green), E-NCAM (C, red), β-III tubulin (D,F green), and BrdU (E, red, and F, blue). DAPI staining (A, blue) was used to identify all cells. Large numbers of nestin+ cells were present in culture and made up about 70% of the total cell population (A). About 15% of the nestin+ cells coexpressed GFAP IR (B, arrowheads), although a few GFAP+ cells did not express nestin (B, arrows). Five percent of the E-NCAM+ cells were nestin+ (C, arrowheads), but none of the β-III tubulin+ cells was nestin+ (D). BrdU labeling identified dividing cells (E,F) and showed that BrdU incorporation was seen in both nestin+ (E,F, arrowhead) and nestin− (E,F, arrow) cells. Triple labeling showed that some of the nestin−, BrdU+ cells (F, arrowheads) were β-III tubulin+ (green). Only 5% of the β-III tubulin+ cells incorporated BrdU, and postmitotic BrdU−, nestin−, β-III tubulin+ cells were also seen (F, arrow, green). Staining was performed on two or three dishes of cells from four different isolations.
Maturation of E-NCAM+ Neuronal Cells
To test the maturation of neuronal cells in culture, we compared cells from 2 and 14 days in differentiating media. Over the course of 14–42 days in differentiating conditions, HNPs grew extensive, long, thin processes and continued to express E-NCAM/β-III tubulin IR (Fig. 3A,A′, E-NCAM staining not shown). BrdU-uptake studies demonstrate that many (>90%) of the cells in the differentiated culture had left the cell cycle and become postmitotic (Fig. 3B,B′). Only occasional β-III tubulin+ cells with the immature phenotype of short processes were identified as BrdU+ under the differentiated conditions. Differentiating E-NCAM/β-III tubulin+ cells increased in size, and the number and extent of processes were increased after 14 DIC (Fig. 3C,C′). E-NCAM/β-III tubulin+ cells displayed IR for mature neuronal markers such as neurofilament-associated protein (RT-97, 200 kD; Fig. 3D,D′) and neurofilament 150 (NF-150; Fig. 3E,E′, Table III). RT-97 stained presumptive neurites of β-III tubulin+ differentiated neurons (Fig. 3D′) but displayed only nonspecific nuclear staining of undifferentiated HNPs (Fig. 3D). Nonspecific nuclear staining results from a known cross-reactive nuclear epitope and does not represent RT-97 expression (Kahn et al., 1987).
Fig. 3.
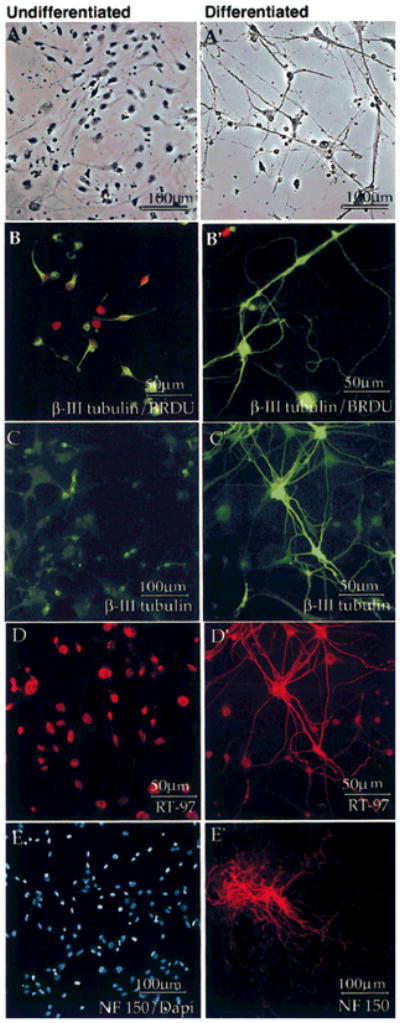
Differentiating HNPs arrested mitosis and expressed RT-97. First-passage cells (A–E) were compared with cells maintained in cultures for 14 days (A′–E′) under differentiating conditions as described in Materials and Methods. Cells were fixed and processed for immunocytochemistry in parallel. Differentiated cultures contained many mature cells with neuronal morphologies compared with first-passage cells (A,A′). Acutely passaged cultures contained dividing BrdU+ (B, red) β-III tubulin+ (B, green) cells, whereas differentiated cultures contained β-III tubulin+ neurons (B′, green) that had exited the cell cycle (B′ shows one BrdU+ cell, red). β-III Tubulin+ cells (C, green) in acute cultures maintained simple morphologies; those in differentiated cultures extended presumptive neurites (C′, green). D: Acute cells did not contain process-specific RT-97 IR (D, red); nuclear staining is a cross-reactive nuclear epitope. Differentiated neurons expressed RT-97 IR on presumptive neurites (D′, red). Acute cells did not express neurofilament (E, NF-150, red, and DAPI, blue, to illustrate cells in the field), although NF-150-expressing cells were seen after 14 DIC (E′, red). Staining was performed on two or three dishes of cells from two different isolations.
Differentiated HNPs Express Multiple Neurotransmitters and Neurotransmitter Enzymes
After 14 days of differentiation in culture, 3–5% of the E-NCAM/β-III tubulin+ cells expressed synaptophysin IR (Fig. 4A,A′). Differentiated neurons also expressed IR for the neurotransmitters glutamate and glycine (Fig. 4B,C, arrowheads) and the neurotransmitter-synthesizing enzymes TH and ChAT (Fig. 4D,E, arrowheads). No staining for TH or ChAT could be observed in the acutely passaged cultures (data not shown). Not all the neurons expressed these markers (Table III), and those that did expressed them in a variety of permutations, indicating that a heterogeneous population of neuronal phenotypes had been generated.
Fig. 4.
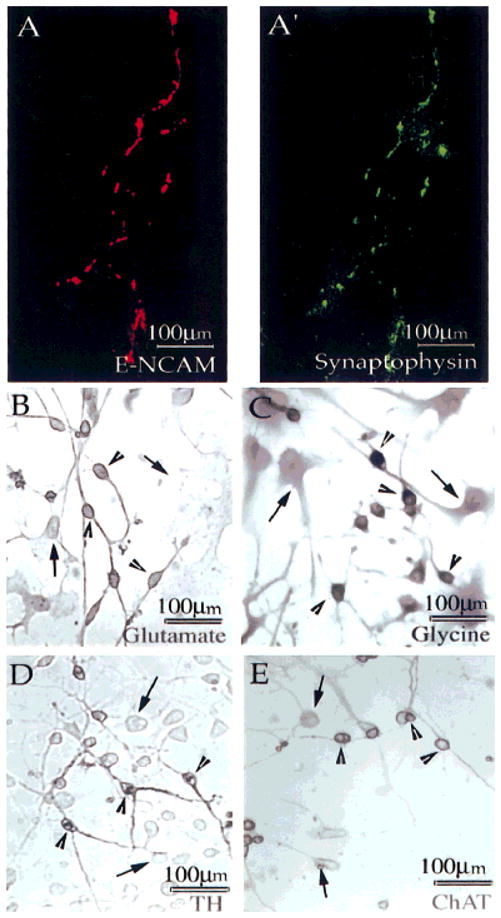
Differentiating HNPs expressed synaptophysin and neurotransmitter-synthesizing enzymes. Cells were maintained under differentiating conditions for 14 DIC and processed for immunocyto-chemistry for E-NCAM (A), synaptophysin (A′), glutamate (B), glycine (C), TH (D), and ChAT (E). A single cell exhibiting synaptophysin IR is shown (A′), and expression colocalizes with that of E-NCAM (A). Subsets of cells express IR for glutamate (B, arrowhead), glycine (C, arrowhead), TH (D, arrowhead), and ChAT (E, arrowhead), whereas other cells are negative (B–E, arrows). Staining was performed on two or three dishes of cells from two different isolations.
HNPs Express Voltage-Gated Ion Channels
HNPs were identified by live cell, E-NCAM immunostaining and then were used for recording. Both Hoffman contrast (Fig. 5A,B) and immunofluorescent images (Fig. 5A′,B′) were obtained for each HNP from which we recorded (Fig. 6). Both acutely passaged and differentiated E-NCAM+ cells expressed voltage-gated Na+ and K+ channels (Fig. 6A,B). Most of the undifferentiated HNPs expressed Na+ and K+ currents (70% and 80%, respectively; n = 10), as did the differentiated neurons (85% and 95%, respectively; n = 40). The differentiated neurons grew considerably in size, as measured by comparing the capacitive area of their membranes (37 ± 5 pF, n = 37) with that of the acutely passaged HNPs (10 ± 7 pF, n = 8). The differentiated neurons exhibited larger magnitudes of whole-cell currents for both Na+ and K+ channels (INa(Diff) = −470 ± 44 pA, n = 37, vs. INa(Acute) −153 ± 62 pA, n = 7; and IK(Diff) = 1,276 ± 244 pA, n = 36, vs. IK(Acute) = 379 ± 67 pA, n =8) but did not differ from the acute HNPs in the overall densities of these channels (INa(Diff)/Cm(Diff)= −20 ± 3 pA/pF, n= 37, vs. INa(Acute)/Cm(Acute) = −15 ± 4 pA/pF, n = 7; and IK(Diff)/Cm(Diff) = 40 ± 6 pA/pF, n = 36, vs. IK(Acute)/Cm(Acute) = 56 ± 15 pA/pF, n = 8). The fast, inward currents were reversibly blocked by application of 300 nM TTX in three of three differentiated cells (data not shown) and indicated that these were voltage-gated Na+ currents (Narahashi et al., 1964).
Fig. 5.
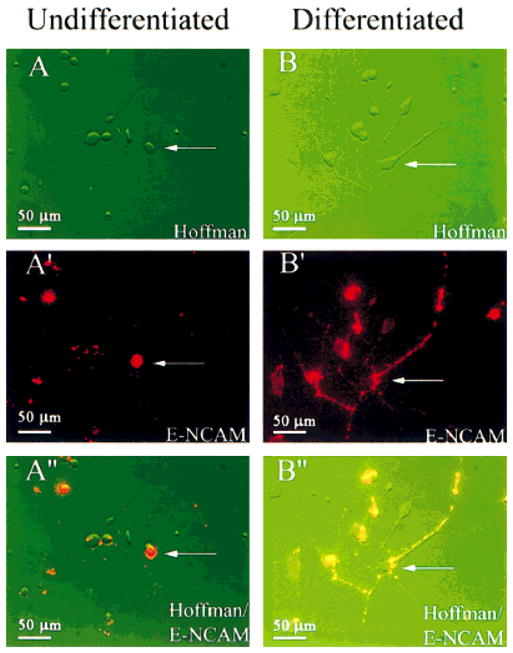
E-NCAM+ HNPs immunoidentified for patch-clamp and fura-2 recordings. Shown are mixed human cell cultures from undifferentiated conditions (A) or following 14 days under differentiating conditions (B), visualized using Hoffman optics. The cells were live stained for E-NCAM (red in A′**, B′). A composite Hoffman-fluorescence image (A″, B**″) shows the red E-NCAM+ HNPs from which whole-cell currents were recorded (arrows). Identical methods were used to identify E-NCAM+ cells used for Ca2+ imaging experiments.
Fig. 6.

Differentiating HNPs expressed voltage-gated Na+ and K+ channels and fired action potentials. A: Whole-cell voltage-clamp recordings were made from E-NCAM+ HNPs in acutely passaged conditions (A1,A2) or following differentiation (A3). Cells were held at −100 mV and stepped to test voltages between −80 and 80 mV in 10 mV increments. Both of the acute HNPs expressed outward K+ currents (A1,A2), but only one exhibited a small inward Na+ current (A2). A differentiated HNP expressed both outward K+ and inward Na+ currents (A3). B1–3: Peak outward K+ currents (triangles) and peak inward Na+ currents (circles) were plotted against the command voltage for the cells represented in A. C: HNPs under acutely passaged conditions failed to fire action potentials (C1,C2); in contrast, a differentiated HNP fired an action potential when stimulated with depolarizing current injections (C3). Inset in C3 shows the action potential overshoot on a longer time scale.
Two minutes after we obtained whole-cell access, the resting potentials of HNPs varied from −30 to 0 mV, so small (−3 to −30 pA) currents were injected to set Vrest at physiologically relevant values (−90 to −40 mV). Three of eight acute HNPs (38%) and 21 of 33 differentiated neurons (64%) generated action potentials when given a brief (0.5 msec) current injection of +100 pA or more. The regenerative, depolarizing phase of these action potentials rose to between 0 and + 15 mV, before the hyperpolarizing phase returned the membrane potential to resting levels, and displayed a classic overshoot of Vrest when Vrest was above the K+ reversal potential (EK ~ −82 mV). Figure 6C1,2 shows that the two undifferentiated cells from Figure 6A1,2 could not fire action potentials. Figure 6C3 and the inset show an action potential elicited from the differentiated HNP shown in Figure 6A3.
Differentiated HNPs Develop Additional Responses to Neurotransmitters
Cells from acutely passaged and differentiated cultures were loaded with the membrane-permeant Ca2+ indicator dye fura-2am. HNPs were again identified by live-cell immunostaining for E-NCAM. Ca2+ response profiles to GABA, glutamate, glycine, DA, ACh, NE, and elevated K+ were obtained from the E-NCAM+ cells under both culture conditions (Fig. 7A–C). The acute HNPs responded with low frequencies to glutamate (6% ± 6%), ACh (18% ± 10%), and elevated K+ (12% ± 8%), but none responded to GABA, glycine, DA, or NE (n = 17). In contrast, the differentiated neurons responded to GABA (4% ± 2%), glycine (6% ± 3%), DA (16% ± 4%), and glutamate (12% ± 4%) with low frequencies and responded to NE (86% ± 5%), ACh (51% ± 6%), and elevated K+ (33% ± 6%) with high to moderate frequencies (n = 70 except, for NE, n = 43). The fraction of E-NCAM+ cells that responded to ACh and NE was significantly different between the acutely passaged and the differentiated cells (Student’s _t_-test, unpaired, P < 0.01 and P < 9 × 10− 14, respectively). The amplitudes of the responses to glutamate, ACh, and elevated K+ were measured from responding cells under both culture conditions and compared. Although the differentiated neurons included cells that showed a much more robust increase in cytosolic Ca2+ than did the undifferentiated HNPs (Fig. 7D), the average Ca2+ increments did not differ between these pools because of the greater variability in response amplitudes of the differentiated population.
Fig. 7.

Differentiating HNPs expressed functional neurotransmitter receptors. A,B: Ratiometric imaging of acute and differentiating E-NCAM+ HNP cells. Ratio of fura-2 emission (I340/I380, left y axis) with approximate Ca2+ concentrations ([Ca2+]i, right y axis). Arrow-heads and labels show application of neurotransmitters. All substances were applied at 500 μM, except for K50, which was 50 mM K+ HR. A: An acutely passaged HNP responded only to acetylcholine (ACh), with small magnitude. B: A differentiated neuron responded to GABA, glutamate (E), glycine (G), elevated K+ (K50), and ACh. C: Fraction of cells responding to neurotransmitters is shown for acutely passaged cells (open bars, n = 17) and differentiated cells [shaded bars, n = 70, except for norepinephrine (NE), for which n = 43]. Acute HNPs did not respond to GABA, glycine, dopamine (DA), NE, or ascorbic acid (AA) control. Differentiated neurons responded to all substances with higher frequencies, but only ACh and NE were significant (asterisks). D: The distribution of response amplitudes is shown by the box plot of acute (left box, open circles) and differentiating cells (Diff; right box, gray circles). Squares represent distribution mean, box represents the 75th percentiles, error bars represent the 95th percentiles, and circles plot the individual response amplitudes. Experiments were performed on a total of six dishes of cells from three different isolations.
Only a Subset of E-NCAM+ HNPs Can Be Identified With Tα1 Tubulin Promoter-Driven GFP Constructs
HNPs have been isolated from adult hippocampus and ventricular zone and from fetal tissue using FACS based on GFP expressed under the control of the Tα1 tubulin promoter (p/Tα1:GFP; Roy et al., 2000a; Wang et al., 2000). To determine whether E-NCAM expression identified the same population of cells as p/Tα1:GFP, we transfected a p/Tα1:GFP construct into fetal cultures and examined the expression of E-NCAM/β-III tubulin and GFAP by the GFP-expressing cells. Transfection efficiency was low (<5%), but about 100 cells could be assessed in each of three experiments. p/Tα1:GFP-expressing cells acquired a neuronal morphology, and both large multipolar as well as small bipolar neurons could be identified (Fig. 8A,A′,A″). None of the GFP-expressing cells shown in Figure 8A stained for β-III tubulin (data not shown). Double labeling with GFAP showed that none of the p/Tα1:GFP+ cells was astrocytic (Fig. 8D). No p/Tα1:GFP+ cells were found that coexpressed nestin protein (data not shown). Double labeling with E-NCAM or β-III tubulin showed that 19% of the p/Tα1:GFP+ cells coexpressed these markers (Fig. 8B,B′,C). The majority (81%) of the p/Tα1:GFP+ cells, however, did not express either E-NCAM or β III tubulin IR (Fig. 8B, inset, and C, arrow). The identification of nonoverlapping cells was surprising but consistent with reports from the Tα1 tubulin transgenic mouse (K. Sawamoto, S. Gold-man, and H. Okano, unpublished results).
Fig. 8.
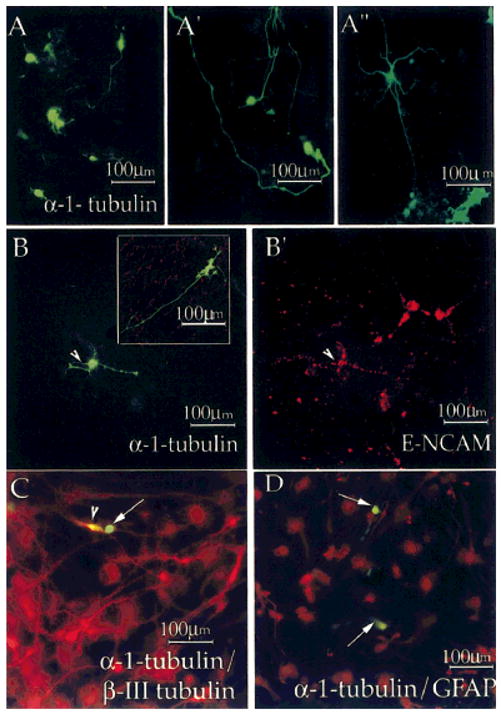
Subset of E-NCAM- and β-III tubulin-immunoreactive HNPs coexpresses α-tubulin promoter-driven GFP. Tα1:GFP constructs were transfected into day 2 cultures of fetal neural cells. GFP expression (A,A′**, A″, B,C,D**, green) was seen in cells with neuronal morphology as early as 24 hr after transfection. Plates were fixed and processed for E-NCAM IR (B, inset, B′, red), β-III tubulin (C, red), and GFAP (D, red). The inset shows lack of colocalization for Tα1:GFP (green) and E-NCAM (red). We show one Tα1:GFP+ cell that was E-NCAM+ (B,B′, arrowhead) and one that was β;-III tubulin+ (C, arrowhead). None of the Tα1:GFP-expressing cells was GFAP+ (arrows in C and D show lack of colocalization). These experiments were performed on two or three dishes of cells from three different isolations.
DISCUSSION
Immunocytochemistry revealed four large subsets of cells that expressed IR for nestin (NSCs, NEPs), A2B5 (GRPs and <1% HNPs), GFAP (astrocytes and astrocyte precursors), or E-NCAM and β-III tubulin (HNPs). Acutely passaged, E-NCAM/β-III tubulin+ HNPs coexpressed the early neuronal marker MAP2 (Fig. 1D′), and BrdU-uptake experiments indicated that many of these cells were mitotic (BrdU+ = 30% at 2 DIC, 5% at 6 DIC). E-NCAM/β-III tubulin+ HNPs matured rapidly in culture (2 weeks) and differentiated into a heterogeneous population of neurons that responded to subsets of applied neurotransmitters and synthesized neurotransmitters and were electrically active. Our data demonstrate that HNPs persist in the developing human cortex until at least 22 weeks of gestation and that E-NCAM IR can be used to identify this neuronal precursor population.
Overall the properties of the HNPs appeared similar to those of the rodent NRPs. As with rodent NRPs, HNPs are mitotic cells that express the early neuronal markers E-NCAM and β-III tubulin; can become post-mitotic in culture; and, upon subsequent differentiation, synthesize mature neuronal markers such as neurofilament, synaptophysin, ChAT, TH, and certain voltage-gated ion channels and ligand-gated neurotransmitter receptors. Also as with the rodent NRPs, HNPs require the presence of the mitogen bFGF to promote division, proliferation, and survival (Kalyani et al., 1998). After differentiation of HNPs for 14–42 days in vitro, the cells took on characteristic neuronal morphologies, similarly to the rodent NRPs (Fig. 3). Synaptophysin staining suggested that the observed cell–cell contacts formed functional synapses, but additional experiments utilizing dual patch-clamp recording, synaptosomal preparations, or FM-143 vesicle imaging will be required to confirm this hypothesis. Ac-quisition of ligand-gated receptor function followed the arrest of HNP mitosis and coincided with differentiation and expression of mature neuronal markers (RT-97, synaptophysin, ChAT, and TH). Individual neurons responded to one or more neurotransmitters, indicating a heterogeneous pattern of receptor expression. This heterogeneity was more limited than that observed in differentiating rat NRPs (Kalyani et al., 1998). Differentiated neurons expressed larger whole-cell, voltage-gated, ion currents than acutely passaged HNPs, but, because the neurons were also larger than the acute HNPs, the current densities did not differ significantly. All of the neurons expressed outward K+ currents that included a varying mix of delayed-rectifier and transient A-type currents based on kinetic observations. Some of the HNPs displayed N-shaped, outward current–voltage relationships that suggested the expression of Ca2+-activated K+ channels. Some also expressed slowly activating and inactivating inward currents that resembled voltage-gated Ca2+ currents. Calcium imaging experiments revealed responses to elevated K+ and supported the notion that HNPs express voltage-gated Ca2+ channels. The majority of differentiated E-NCAM+ cells were capable of firing action potentials. This is similar to the case in rodent NRPs (Kalyani et. al., 1998) but different from E-NCAM− cultured HNPs (Piper et al., 2000), which could not fire action potentials.
Despite these overall similarities, several important differences were noted. Maturation was rapid (2 weeks) compared to that of human NEP cell cultures (>4 weeks; Piper et al., 2000) but was much slower than that in rodent cultures (5 days; Kalyani et al., 1998; Mujtaba et al., 1999) or in immortalized human cell lines (4 days; Li et al., 2000). Rodent NRPs expressed nestin, and virtually all BrdU-incorporating NRPs were nestin+ (Mayer-Proschel et al., 1997). In contrast, only occasional HNPs coexpressed nestin, and in triple-labeling experiments we showed that nestin expression was not seen in dividing HNPs. Unlike the case with rodent NRP cultures (Mayer-Proschel et al., 1997; Kalyani et al., 1998; Mujtaba et al., 1999), HNPs have proved difficult to grow at low densities without genetic intervention (Raymon et al., 1999; Li et al., 2000) and have remained refractory to strict clonal analyses. HNPs could be isolated by immunopanning and would adhere to laminin/fibronectin but would divide only once or twice in culture. Cells plated in this way survived and differentiated into neurons but did not proliferate. Cells maintained in mass culture continued to divide (incorporate BrdU) for as long as 3 months. Density-dependent proliferation and differentiation have been reported for rodent cultures (Hulspas et al., 1997; Tsai and McKay, 2000) and could explain the failure of HNPs to proliferate in the relative absence of neighboring cells.
A possible explanation for the differences between rodent and human cultures may be the time of isolation of human fetal cells compared to that of rodent cells. Rat NRPs are isolated at E13.5 (E10.5 in mice), a time when neurogenesis has just begun. The equivalent age of gestation in humans would be 5 weeks, much earlier than when tissue is available (10–20 weeks). Our analysis of HNPs is therefore confined to later-appearing cells, which may have slower cell cycle times and altered nestin expression. These data raise the possibility that properties of cells change during development and that results obtained in one species may not be readily transferable to another or to a different stage of development.
HNPs have been isolated using a strategy different from the one described here. FACS enrichment of GFP-expressing cells, in which GFP expression was localized to neurons by using the neuron-specific Tα1 tubulin promoter, revealed the existence of a neuronal precursor population (Roy et al., 2000a; Wang et al., 2000). Application of the two strategies in an identical population of cells revealed that each identified a separate but partially overlapping set of cells. Only a subset of the Tα1 tubulin: GFP-expressing cells coexpressed either β-III tubulin or E-NCAM. The Tα1 tubulin:GFP+ cells were nestin− and did not coexpress GFAP, suggesting that they were indeed neurons or neuronal precursors. More detailed comparisons of these overlapping populations are necessary to determine whether these differences are functionally relevant to the phenotypes of cells produced.
Overall, our data support several conclusions. Acute HNPs express several typical neuronal ion channels and neurotransmitter receptors before committing to a specific neuronal fate. Changes in the receptor expression pattern follow the arrest of mitosis and coincide with the expression of morphological and antigenic neuronal phenotypes. Responses to GABA, glycine, DA, ACh, and NE are all up-regulated during differentiation toward a neuronal phenotype. Individual differentiated neurons express heterogeneous complements of the receptors examined. Future experiments will be required to determine the differential roles these receptors play in developmental and neuronal signaling. In summary, our data demonstrate that E-NCAM+/β-III tubulin+/nestin− HNPs, which under differentiating conditions resemble neurons in morphology and certain protein expression patterns, also have the functional capacity to operate as neurons. The availability of renewable sources of human neuronal cells will be an invaluable resource for both therapeutic and research use. These cells will provide a model system in which to examine the effects of intrinsic and extrinsic factors on the process of neuronal development. Should the presumptive synaptic contacts in our cultures prove to exhibit functional properties, then this culture system could be extended to study events underlying synaptogenesis and the characteristics of human neural networks.
Acknowledgments
We gratefully acknowledge the input of all members of our laboratories, provided through discussions and constructive criticisms. M.S.R. was supported by the NINDS, NIDA, and MDA. M.T.L. was supported by NIH, NIDCD grant DC002994. S.A.G. was supported by the NIH.
References
- Bansal R, Warrington AE, Gard AL, Ranscht B, Pfeiffer SE. Multiple and novel specificities of monoclonal antibodies O1, O4, and R-mAb used in the analysis of oligodendrocyte development. J Neurosci Res. 1989;24:548–557. doi: 10.1002/jnr.490240413. [DOI] [PubMed] [Google Scholar]
- Bignami A, Eng LF, Dahl D, Uyeda CT. Localization of the glial fibrillary acidic protein in astrocytes by immunofluorescence. Brain Res. 1972;43:429–435. doi: 10.1016/0006-8993(72)90398-8. [DOI] [PubMed] [Google Scholar]
- Buc-Caron MH. Neuroepithelial progenitor cells explanted from human fetal brain proliferate and differentiate in vitro. Neurobiol Dis. 1995;2:37–47. doi: 10.1006/nbdi.1995.0004. [DOI] [PubMed] [Google Scholar]
- Carpenter MK, Cui X, Hu ZY, Jackson J, Sherman S, Seiger A, Wahlberg LU. In vitro expansion of a multipotent population of human neural progenitor cells. Exp Neurol. 1999;158:265–278. doi: 10.1006/exnr.1999.7098. [DOI] [PubMed] [Google Scholar]
- Chalmers-Redman RM, Priestley T, Kemp JA, Fine A. In vitro propagation and inducible differentiation of multipotential progenitor cells from human fetal brain. Neuroscience. 1997;76:1121–1128. doi: 10.1016/s0306-4522(96)00386-7. [DOI] [PubMed] [Google Scholar]
- Dahlstrand J, Lardelli M, Lendahl U. Nestin mRNA expression correlates with the central nervous system progenitor cell state in many, but not all, regions of developing central nervous system. Brain Res Dev Brain Res. 1995;84:109–129. doi: 10.1016/0165-3806(94)00162-s. [DOI] [PubMed] [Google Scholar]
- Eisenbarth GS, Walsh FS, Nirenberg M. Monoclonal antibody to plasma membrane antigen of neurons. Proc Natl Acad Sci USA. 1979;76:4913–4917. doi: 10.1073/pnas.76.10.4913. [DOI] [PMC free article] [PubMed] [Google Scholar]
- Grynkiewicz G, Poenie M, Tsien RY. A new generation of Ca2+ indicators with greatly improved fluorescence properties. J Biol Chem. 1985;260:3440–3450. [PubMed] [Google Scholar]
- Hamill OP, Marty A, Neher E, Sakmann B, Sigworth FJ. Improved patch clamp techniques for high resolution current recording from cells and cell free patches. Pflugers Arch. 1981;391:85–100. doi: 10.1007/BF00656997. [DOI] [PubMed] [Google Scholar]
- Hulspas R, Tiarks C, Reilly J, Hsieh CC, Recht L, Quesenberry PJ. In vitro cell density-dependent clonal growth of EGF-responsive murine neural progenitor cells under serum-free conditions. Exp Neurol. 1997;148:147–156. doi: 10.1006/exnr.1997.6672. [DOI] [PubMed] [Google Scholar]
- Johansson CB, Svensson M, Wallstedt L, Janson AM, Frisen J. Neural stem cells in the adult human brain. Exp Cell Res. 1999;253:733–736. doi: 10.1006/excr.1999.4678. [DOI] [PubMed] [Google Scholar]
- Kahn J, Anderton BH, Miller CC, Wood JN, Esiri MM. Staining with monoclonal antibodies to neurofilaments distinguishes between sub-populations of neurofibrillary tangles, between groups of axons and between groups of dendrites. J Neurol. 1987;234:241–246. doi: 10.1007/BF00618257. [DOI] [PubMed] [Google Scholar]
- Kalyani A, Hobson K, Rao MS. Neuroepithelial stem cells from the embryonic spinal cord: isolation, characterization, and clonal analysis. Dev Biol. 1997;186:202–223. doi: 10.1006/dbio.1997.8592. [DOI] [PubMed] [Google Scholar]
- Kalyani AJ, Piper D, Mujtaba T, Lucero MT, Rao MS. Spinal cord neuronal precursors generate multiple neuronal phenotypes in culture. J Neurosci. 1998;18:7856–7868. doi: 10.1523/JNEUROSCI.18-19-07856.1998. [DOI] [PMC free article] [PubMed] [Google Scholar]
- Kosik KS, Finch EA. MAP2 and tau segregate into dendritic and axonal domains after the elaboration of morphologically distinct neurites: an immunocytochemical study of cultured rat cerebrum. J Neurosci. 1987;7:3142–3153. doi: 10.1523/JNEUROSCI.07-10-03142.1987. [DOI] [PMC free article] [PubMed] [Google Scholar]
- Kukekov VG, Laywell ED, Suslov O, Davies K, Scheffler B, Thomas LB, O’Brien TF, Kusakabe M, Steindler DA. Multipotent stem/progenitor cells with similar properties arise from two neurogenic regions of adult human brain. Exp Neurol. 1999;156:333–344. doi: 10.1006/exnr.1999.7028. [DOI] [PubMed] [Google Scholar]
- Lendahl U, Zimmerman LB, McKay RD. CNS stem cells express a new class of intermediate filament protein. Cell. 1990;60:585–595. doi: 10.1016/0092-8674(90)90662-x. [DOI] [PubMed] [Google Scholar]
- Li R, Thode S, Zhou J, Richard N, Pardinas J, Rao MS, Sah DW. Motoneuron differentiation of immortalized human spinal cord cell lines. J Neurosci Res. 2000;59:342–352. doi: 10.1002/(sici)1097-4547(20000201)59:3<342::aid-jnr7>3.0.co;2-z. [DOI] [PubMed] [Google Scholar]
- Mayer-Proschel M, Kalyani AJ, Mujtaba T, Rao MS. Isolation of lineage-restricted neuronal precursors from multipotent neuroepithelial stem cells. Neuron. 1997;19:773–785. doi: 10.1016/s0896-6273(00)80960-5. [DOI] [PubMed] [Google Scholar]
- Menezes JR, Luskin MB. Expression of neuron-specific tubulin defines a novel population in the proliferative layers of the developing telencephalon. J Neurosci. 1994;14:5399–5416. doi: 10.1523/JNEUROSCI.14-09-05399.1994. [DOI] [PMC free article] [PubMed] [Google Scholar]
- Messam CA, Hou J, Major EO. Co-expression of nestin in neural and glial cells in the developing human CNS defined by a human-specific anti-nestin antibody. Exp Neurol. 2000;161:585–596. doi: 10.1006/exnr.1999.7319. [DOI] [PubMed] [Google Scholar]
- Mujtaba T, Piper DR, Kalyani A, Groves AK, Lucero MT, Rao MS. Lineage-restricted neural precursors can be identified from both the mouse neural tube and cultured ES cells. Dev Biol. 1999;214:113–127. doi: 10.1006/dbio.1999.9418. [DOI] [PubMed] [Google Scholar]
- Narahashi T, Haas HG, Therrien EF. Tetrodotoxin blockage of sodium conductance increase in lobster giant axons. J Gen Physiol. 1964;47:965–974. doi: 10.1085/jgp.47.5.965. [DOI] [PMC free article] [PubMed] [Google Scholar]
- Peng I, Binder LI, Black MM. Biochemical and immunological analyses of cytoskeletal domains of neurons. J Cell Biol. 1986;102:252–262. doi: 10.1083/jcb.102.1.252. [DOI] [PMC free article] [PubMed] [Google Scholar]
- Piper DR, Mujtaba T, Rao MS, Lucero MT. Immunocytochemical and physiological characterization of a population of cultured human neural precursors. J Neurophysiol. 2000;84:534–548. doi: 10.1152/jn.2000.84.1.534. [DOI] [PubMed] [Google Scholar]
- Quinn SM, Walters WM, Vescovi AL, Whittemore SR. Lineage restriction of neuroepithelial precursor cells from fetal human spinal cord. J Neurosci Res. 1999;57:590–602. [PubMed] [Google Scholar]
- Rao MS. Multipotent and restricted precursors in the central nervous system. Anat Rec. 1999;257:137–148. doi: 10.1002/(SICI)1097-0185(19990815)257:4<137::AID-AR7>3.0.CO;2-Q. [DOI] [PubMed] [Google Scholar]
- Raymon HK, Thode S, Zhou J, Friedman GC, Pardinas JR, Barrere C, Johnson RM, Sah DW. Immortalized human dorsal root ganglion cells differentiate into neurons with nociceptive properties. J Neurosci. 1999;19:5420–5428. doi: 10.1523/JNEUROSCI.19-13-05420.1999. [DOI] [PMC free article] [PubMed] [Google Scholar]
- Roy NS, Wang S, Harrison RC, Benraiss A, Fraser RA, Gravel M, Braun PE, Goldman SA. Identification, isolation, and promoter-defined separation of mitotic oligodendrocyte progenitor cells from the adult human subcortical white matter. J Neurosci. 1999;19:9986–9995. doi: 10.1523/JNEUROSCI.19-22-09986.1999. [DOI] [PMC free article] [PubMed] [Google Scholar]
- Roy NS, Benraiss A, Wang S, Fraser RA, Goodman R, Couldwell WT, Nedergaard M, Kawaguchi A, Okano H, Goldman SA. Promoter-targeted selection and isolation of neural progenitor cells from the adult human ventricular zone. J Neurosci Res. 2000a;59:321–331. doi: 10.1002/(sici)1097-4547(20000201)59:3<321::aid-jnr5>3.0.co;2-9. [DOI] [PubMed] [Google Scholar]
- Roy NS, Wang S, Jiang L, Kang J, Benraiss A, Harrison RC, Fraser RA, Couldwell WT, Kawaguchi A, Okano H, Nedergaard M, Goldman SA. In vitro neurogenesis by progenitor cells isolated from the adult human hippocampus. Nat Med. 2000b;6:271–277. doi: 10.1038/73119. [DOI] [PubMed] [Google Scholar]
- Sabate O, Horellou P, Vigne E, Colin P, Perricaudet M, Buc-Caron MH, Mallet J. Transplantation to the rat brain of human neural progenitors that were genetically modified using adenoviruses. Nat Genet. 1995;9:256–260. doi: 10.1038/ng0395-256. [DOI] [PubMed] [Google Scholar]
- Scolding NJ, Rayner PJ, Compston DA. Identification of A2B5-positive putative oligodendrocyte progenitor cells and A2B5-positive astrocytes in adult human white matter. Neuroscience. 1999;89:1–4. doi: 10.1016/s0306-4522(98)00548-x. [DOI] [PubMed] [Google Scholar]
- Svendsen CN, Clarke DJ, Rosser AE, Dunnett SB. Survival and differentiation of rat and human epidermal growth factor-responsive precursor cells following grafting into the lesioned adult central nervous system. Exp Neurol. 1996;137:376–388. doi: 10.1006/exnr.1996.0039. [DOI] [PubMed] [Google Scholar]
- Svendsen CN, ter-Borg MG, Armstrong RJ, Rosser AE, Chandran S, Ostenfeld T, Caldwell MA. A new method for the rapid and long term growth of human neural precursor cells. J Neurosci Methods. 1998;85:141–152. doi: 10.1016/s0165-0270(98)00126-5. [DOI] [PubMed] [Google Scholar]
- Tsai RY, McKay RD. Cell contact regulates fate choice by cortical stem cells. J Neurosci. 2000;20:3725–3735. doi: 10.1523/JNEUROSCI.20-10-03725.2000. [DOI] [PMC free article] [PubMed] [Google Scholar]
- Vescovi AL, Gritti A, Galli R, Parati EA. Isolation and intracerebral grafting of nontransformed multipotential embryonic human CNS stem cells. J Neurotrauma. 1999a;16:689–693. doi: 10.1089/neu.1999.16.689. [DOI] [PubMed] [Google Scholar]
- Vescovi AL, Parati EA, Gritti A, Poulin P, Ferrario M, Wanke E, Frolichsthal SP, Cova L, Arcellana PM, Colombo A, Galli R. Isolation and cloning of multipotential stem cells from the embryonic human CNS and establishment of transplantable human neural stem cell lines by epigenetic stimulation. Exp Neurol. 1999b;156:71–83. doi: 10.1006/exnr.1998.6998. [DOI] [PubMed] [Google Scholar]
- Wang S, Roy NS, Benraiss A, Goldman SA. Promoter-based isolation and fluorescence-activated sorting of mitotic neuronal progenitor cells from the adult mammalian ependymal/subependymal zone. Dev Neurosci. 2000;22:167–176. doi: 10.1159/000017437. [DOI] [PubMed] [Google Scholar]