Degradation of ribosomal RNA during starvation: Comparison to quality control during steady-state growth and a role for RNase PH (original) (raw)
Abstract
Ribosomal RNAs are generally stable in growing Escherichia coli cells. However, their degradation increases dramatically under conditions that lead to slow cell growth. In addition, incomplete RNA molecules and molecules with defects in processing, folding, or assembly are also eliminated in growing cells in a process termed quality control. Here, we show that there are significant differences between the pathways of ribosomal RNA degradation during glucose starvation and quality control during steady-state growth. In both processes, endonucleolytic cleavage of rRNA in ribosome subunits is an early step, resulting in accumulation of large rRNA fragments when the processive exoribonucleases, RNase II, RNase R, and PNPase are absent. For 23S rRNA, cleavage is in the region of helix 71, but the exact position can differ in the two degradative processes. For 16S rRNA, degradation during starvation begins with shortening of its 3′ end in a reaction catalyzed by RNase PH. In the absence of this RNase, there is no 3′ end trimming of 16S rRNA and no accumulation of rRNA fragments, and total RNA degradation is greatly reduced. In contrast, the degradation pattern in quality control remains unchanged when RNase PH is absent. During starvation, the exoribonucleases RNase II and RNase R are important for fragment removal, whereas for quality control, RNase R and PNPase are more important. These data highlight the similarities and differences between rRNA degradation during starvation and quality control during steady-state growth and describe a role for RNase PH in the starvation degradative pathway.
Keywords: Escherichia coli, ribonuclease, ribosome
INTRODUCTION
The ability to recycle components present in stable macromolecules plays an important role in cell survival. For example, ribosomes normally are extremely stable, but under conditions leading to slow cell growth the need for functional ribosomes decreases and they may become substrates for degradation (Okamura et al. 1973; Cohen and Kaplan 1977; Zundel et al. 2009). As a consequence, ribosome degradation increases under certain physiological conditions such as starvation for the essential nutrients carbon (Kaplan and Apirion 1975a), nitrogen (Kaplan and Apirion 1975a), phosphorus (Kaplan and Apirion 1975a), or magnesium ion (McCarthy 1962).
A possible degradation pathway for Escherichia coli ribosomes during starvation was proposed by Kaplan and Apirion (1975b). In this model, rRNA is fragmented by endoribonucleolytic cleavages, and the resulting fragments are further degraded to mononucleotides by exoribonucleases. While this model addressed the fate of ribosomal RNA, it failed to identify what was responsible for converting a stable ribosome to one that was susceptible to degradation. We have recently shown that the trigger for ribosome degradation during starvation is an increase in free ribosome subunits that are generated as a consequence of the reduced translational activity in starved cells (Zundel et al. 2009). These subunits, with their exposed RNA interfaces, are substrates for existing ribonucleases, since synthesis of new genes is not required for degradation to proceed (Zundel et al. 2009).
In addition to the pre-existing ribosomes that are degraded during nutrient deprivation, ribosomes containing defective rRNA molecules or those that are misassembled also are eliminated by an RNA quality control process that is thought to act during ribosome biogenesis in steady-state growth (Cheng and Deutscher 2003). In earlier studies of a conditional-lethal mutant strain lacking RNase R and carrying a temperature-sensitive PNPase allele, our laboratory showed that these two exoribonucleases played an essential role in the quality control of rRNA. In their absence, large amounts of rRNA fragments accumulate because they could not be further degraded (Cheng and Deutscher 2003).
In this study we examine the pathway of rRNA degradation during starvation and compare it to degradation that occurs as a consequence of quality control. We show that degradation of rRNA during starvation is initiated by endoribonucleolytic cleavages of free ribosome subunits and that rRNA fragments accumulate when specific degradative exoribonucleases are absent. Our data also suggest that RNase PH, previously implicated in tRNA maturation, participates as well in the degradation of rRNA during glucose starvation. Interestingly, while rRNA fragments also accumulate during quality control of ribosome biogenesis, they differ from those generated during glucose starvation, and there is no indication that RNase PH plays a role in this process. These findings suggest that different endoribonucleases may be involved in RNA degradation or that the rRNA exposed and available for degradation may differ in the two processes because during starvation complete subunits are the targets, whereas the quality control process targets immature or defective ribosome particles.
RESULTS
Analysis of ribosome degradation during starvation and comparison with quality control
In an earlier study (Zundel et al. 2009), we showed that ribosome degradation during starvation initiates with an increase in the amount of 50S and 30S ribosome subunits, and suggested that the newly exposed subunit interface would now be susceptible to attack by cellular endoribonucleases. To obtain evidence for this point, we made use of a mutant strain (RNase II−, RNase R−, PNPts) that lacks the three processive exoribonucleases at 42°C. We reasoned that in the absence of these RNases, the rRNA fragments generated by endoribonuclease action on free ribosome subunits would not be degraded further and would, therefore, accumulate. Accordingly, total RNA was isolated from wild-type and RNase-deficient cells grown for 4 h at 42°C in the presence of glucose or starved of a carbon source for the same length of time. RNA was fractioned on an agarose gel as described in the Materials and Methods and stained with ethidium bromide.
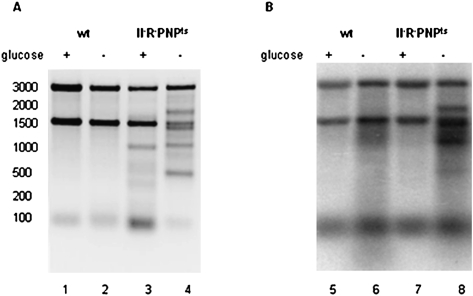
A typical gel is presented in Figure 1, panel A, in which equivalent amounts of RNA were loaded in each lane. As can be seen, 4 h of starvation (− glucose) of the mutant strain led to partial loss of 16S rRNA and the accumulation of multiple large RNA fragments. No fragments accumulated in the wild-type strain (the bands in the 100-nucleotide [nt] region are tRNA and 5S rRNA). These data indicate that degradation of rRNA during starvation proceeds by endonucleolytic cleavages that fragment the 16S and 23S rRNAs. Moreover, the data also show that one or more of the processive exoribonucleases, RNase II, RNase R, or PNPase, is required for removal of the rRNA fragments generated during starvation.
FIGURE 1.
Accumulation of rRNA fragments during glucose starvation and quality control. (A) Total cellular RNA was extracted from either starved cells (− glucose) or growing cells (+ glucose), separated on a 1.5% agarose gel, and visualized by ethidium-bromide staining. (B) Total cellular RNA was extracted from either starved cells (− glucose) or growing cells (+ glucose) that were prelabeled with [32P]Pi and chased for 4 h, separated on a 1.5% agarose gel, transferred to a nylon membrane, and visualized by exposure to a PhosphorImager (Molecular Dynamics) screen.
We previously showed that growing cells that lack RNase R and PNPase also accumulate rRNA fragments. This was attributed to a quality control process that removes defective or misassembled rRNA (Cheng and Deutscher 2003). The data in Figure 1, panel A, also confirm these earlier observations. Of most interest, however, is the finding that the RNA fragments accumulated in the growing cells (+ glucose) differ from those generated as a result of starvation (− glucose). These results suggest either that different endoribonucleases are responsible for the cleavage of rRNA in the two processes or that the sites in the rRNA accessible to the cleavage enzymes differ.
Additional evidence that rRNA degradation resulting from quality control and starvation differ is shown in Figure 1, panel B. Cells were grown in [32P]Pi for several generations and then placed into [32P]Pi-free medium ± glucose for 4 h prior to RNA isolation and analysis. [32P]-labeled fragments derived from 16S and 23S rRNA accumulate in the starved cells, whereas none are present in the growing cells despite the fact that fragments are visible in these cells by staining (panel A; note that the band at ∼100 nt is due to 5S rRNA and tRNA). These data indicate that the substrates for rRNA degradation are different in starvation and quality control. In starved cells, pre-existing ribosomes that were [32P]-labeled during the earlier growth period are the substrates. In contrast, the quality control process removes newly synthesized defective ribosomes during their biogenesis (Cheng and Deutscher 2003), and such ribosomes are unlabeled in this experiment due to growth in [32P]Pi-free medium.
Comparison of pathways of rRNA degradation elicited by starvation or by quality control
To elucidate the degradation pathways for rRNA during starvation and as a consequence of quality control during steady-state growth, primer extension and Northern blot analyses were carried out on the RNA fragments that accumulated during each process in the background of the exoribonuclease-deficient mutant strain. Oligonucleotide probes complementary to the 5′and 3′ ends of 16S and 23S rRNA, as well as to internal regions, were used to assess the fates of individual segments within each RNA. The location of these probes is shown at the top of Figures 2 and 3. Several of these probes were also used as primers for primer extension analysis.
FIGURE 2.
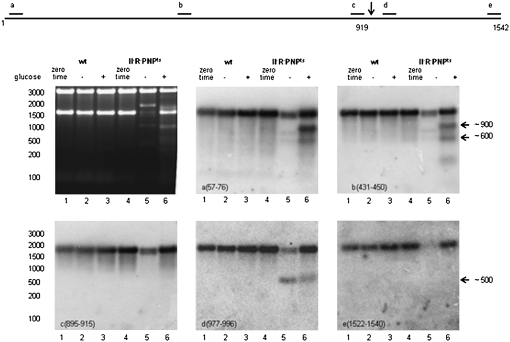
Northern blot analysis of rRNA fragments produced from 16S rRNA. Total cellular RNA was extracted either from cells grown at 31°C to early exponential phase (zero time) or from cells exposed to 4-h starvation (− glucose) or 4-h growth (+ glucose) at 42°C. RNA was separated on a 1.5% agarose gel, visualized by ethidium-bromide staining (upper left panel), transferred to a nylon membrane, and probed with 16S rRNA-specific probes as indicated in each panel. The diagram at the top shows the location of the probes, and the arrow indicates the site of endonucleolytic cleavage.
FIGURE 3.
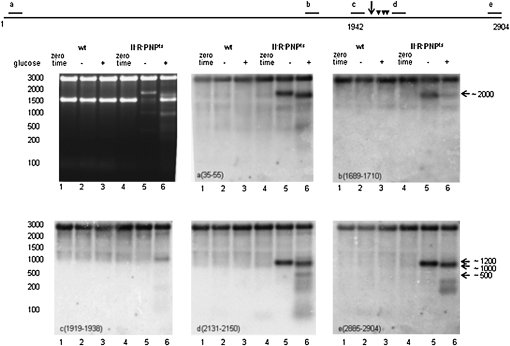
Northern blot analysis of rRNA fragments produced from 23S rRNA. Total cellular RNA was analyzed as in Figure 2 with 23S rRNA–specific probes as indicated in each panel. The diagram at the top shows the location of the probes, and the arrow indicates the site of the main endonucleolytic cleavage. Arrowheads mark sites of secondary cleavages that occur during quality control.
For 16S rRNA, primer extension analysis using probe d as the primer revealed the presence of a 5′ terminus at U920 for the RNA accumulated during each degradative process, suggesting that an endonucleolytic cleavage had occurred between residues A919 and U920 in each case (data not shown). This was confirmed by Northern blot analysis with probe d, which showed that the same downstream ∼500-nt cleavage fragment accumulated in both the presence and absence of glucose (Fig. 2). However, while the upstream ∼900-nt fragment also resulting from this cleavage could be detected by probes a and b for the quality control sample (+ glucose), this fragment was not seen in the starvation sample (− glucose) with any probe, suggesting that under this condition it was rapidly degraded. Inasmuch as RNase II, RNase R, and PNPase are absent, another RNase must be involved in its removal. Interestingly, although the ∼900 nt could be detected by probes a and b, it was not seen with probe c, suggesting that it had undergone shortening at its 3′ end during the quality control process. Primer extension analysis was also carried out with probe b as a primer, but no 5′-end was detected (data not shown).
A second fragment of ∼600 nt was also detected, primarily in the + glucose sample, by probes a and b, but not by probe c. These data indicate that it represents the 5′ 40% of 16S rRNA. It is more likely that this fragment arises by exonucleolytic trimming of the 919-nt fragment rather than by an endonucleolytic cut because there was no indication of the appearance of a downstream product. Taken together, these data suggest that a single, major endonucleolytic cleavage occurs during the degradation of 16S rRNA as a consequence of both starvation and the quality control process. However, it remains to be determined how the 919-nt fragment is degraded during starvation.
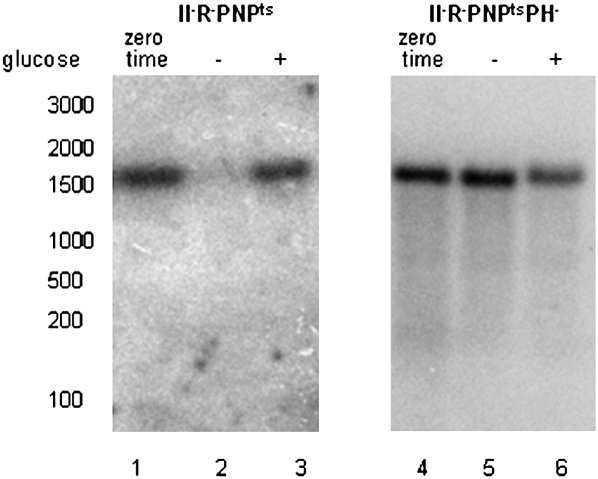
Another difference between the degradation of 16S rRNA during starvation and in the quality control process relates to the extreme 3′ end of the molecule. Note that with probes a to d, the 16S rRNA band is slightly shorter in the starvation sample than in the one generated by quality control (Fig. 2). The explanation for this difference becomes apparent with probe e, which is complementary to the extreme 3′ end of 16S rRNA. No 16S rRNA band is detected with this probe (lane 5, panel e), indicating that removal of the 3′ end may be the first step in the degradation of 16S rRNA during starvation. Note also that the ∼500-nt downstream fragment detected by probe d in each degradation pathway is not detected by probe e. Thus, the 3′ end is also removed during quality control, but apparently after the endonucleolytic cleavage at residue A919 has already occurred.
Differences between the starvation and quality control degradation pathways were also observed for 23S rRNA (Fig. 3). Primer extension analysis using probe d revealed a single endonucleolytic cleavage during starvation degradation located after residue C1942. In contrast, while this cleavage also occurred during the quality control process, multiple other nearby cleavages were found as well. Moreover, the 23S rRNA fragments accumulating in the two processes differed markedly based on Northern blot analysis with a variety of probes complementary to regions throughout the molecule (Fig. 3).
Confirmation of the endonucleolytic cleavage in the C1942 region came from probes a and d, which identify both the upstream (∼2000-nt) and downstream (∼1000-nt) cleavage fragments. As is evident with probe a, the fragment that accumulates in the + glucose lane is several hundred nucleotides shorter than the corresponding fragment generated during starvation and, as a consequence, is barely observed with probe b. Neither fragment is seen with probe c, although a shortened (∼1200-nt) fragment is seen in the + glucose sample. These data suggest trimming of the 3′ end of the upstream (∼2000-nt) fragment generated in both pathways, but the trimming is more extensive in the quality control pathway. Endonucleolytic cleavage of this fragment slightly upstream of probe b is also possible, as is cleavage in the 5′ region to generate the ∼1200-nt fragment identified with probe c.
The downstream (∼1000-nt) fragment is also degraded in a different manner in the two pathways. Only the full-length fragment, detected by both probes d and e, accumulates during starvation, whereas a large number of smaller (∼100-nt to ∼500-nt) fragments are detected in the presence of glucose. These observations suggest that the downstream (∼1000-nt) fragment may be subjected to multiple endonucleolytic cleavages during quality control degradation, but not during starvation. During starvation, exoribonuclease action normally would predominate, but since RNase II, RNase R, and PNPase are absent, the fragment simply accumulates.
Role of processive exoribonucleases in rRNA degradation
As shown above, in the absence of the three processive exoribonucleases, RNase II, RNase R, and PNPase, rRNA fragments accumulate during both starvation degradation and quality control. Based on these data, one or more of the RNases is required to further degrade the rRNA fragments. To examine which RNases participate in each degradative pathway, a series of strains was constructed lacking one, two, or all three of the RNases.
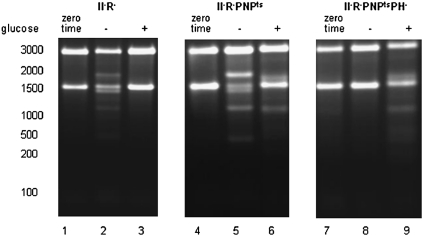
During starvation, fragments did not accumulate in strains lacking only a single RNase, although a small amount of 3′ shortened 16S rRNA was seen in the RNase II− strain (data not shown). These results suggest that in each case one or more alternative RNases could complete the degradative process when one was absent. Likewise, no additional fragments accumulated in the RNase II−, PNPts double mutant, and no fragments were observed in the RNase R−, PNPts strain (data not shown). In contrast, significant accumulation of fragments was found when both RNase II and RNase R were absent, and this pattern was unaffected by the additional removal of PNPase (Fig. 4, lanes 2,5). These data suggest that RNases II and R contribute to rRNA degradation during starvation and that PNPase does not play a role.
FIGURE 4.
Roles of RNase PH and PNPase in the accumulation of rRNA fragments during glucose starvation and quality control. Total cellular RNA was extracted from RNase II− RNase R−, RNase II− RNase R− PNPts, or RNase II− RNase R− PNPts RNase PH− cells grown at 31°C to early exponential phase (zero time) or cells exposed to 4-h starvation (− glucose) or 4-h growth (+ glucose) at 42°C. RNA was separated on 1.5% agarose gels and visualized by ethidium-bromide staining.
The degradation pattern differs in the quality control process. No fragments were detected in an RNase II−, RNase R− strain (Fig. 4, lane 3) or in an RNase II−, PNPts strain (data not shown). However, extensive accumulation of fragments was seen in an RNase R−, PNPts strain (data not shown), in agreement with earlier data (Cheng and Deutscher 2003), and the pattern did not change when RNase II was also removed (Fig. 4, lane 6; see also Fig. 1A). Thus, for quality control, RNase R and PNPase are the major contributors, indicating that the exoribonucleases involved in this process differ from those important during starvation.
RNase PH plays a role in rRNA degradation during starvation
During the course of these studies, both strain MG1655 and its derivative MG1655(Seq)* were used. However, data obtained with the two strains unexpectedly differed. Since strain MG1655 is naturally RNase PH–negative, while strain MG1655(Seq)* has had the rph gene reintroduced, our attention focused on RNase PH as a possible contributor to rRNA degradation. To address this point, we directly compared rRNA degradation during starvation and quality control in strain MG1655I−II−R−PNPts (PH−) to that in MG1655(Seq)*I−II−R−PNPts (PH+).
The data in Figure 4 show the rRNA fragments that accumulate in each of the strains during 4 h in the presence or absence of glucose or at zero time prior to the shift to 42°C. As can be seen, the fragments generated by quality control (+ glucose) were unaffected by removal of RNase PH (cf. lanes 6 and 9). In marked contrast, the absence of RNase PH eliminated the rRNA fragments present during glucose starvation in a strain lacking the three processive exoribonucleases (cf. lanes 5 and 8). Thus, it appears that in the absence of RNase PH, the endonucleolytic cleavages that lead to the generation of rRNA fragments do not occur. These findings suggest that RNase PH plays an important role in rRNA degradation during starvation but that is not required for the quality control process, demonstrating another way in which these two degradation pathways differ.
One possible explanation for this observation is shown in Figure 5. Data presented above indicated that early in the degradation of 16S rRNA its 3′ end is removed. However, this step does not occur when RNase PH is absent (Fig. 5, cf. lanes 5 and 2). Thus, RNase PH, a 3′ to 5′ exoribonuclease, may trim the 3′end of 16S rRNA, and this event serves to initiate the subsequent endonucleolytic cleavages. Although other explanations are possible, it is nevertheless evident that RNase PH plays a critical role in the degradation process during starvation.
FIGURE 5.
Analysis of the 3′-end of 16S rRNA. Total cellular RNA extracted from RNase II− RNase R− PNPts or RNase II− RNase R− PNPts RNase PH− cells grown either at 31°C to early exponential phase (zero time) or exposed to 4-h starvation (− glucose) or 4-h growth (+ glucose) at 42°C was separated on a 1.5% agarose gel, transferred to a nylon membrane, and probed with a probe specific to nucleotides 1522–1540 (Fig. 2, probe e), at the 3′ end of 16S rRNA.
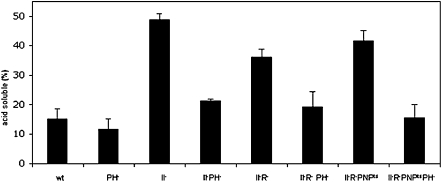
Additional evidence for a role for RNase PH comes from measurement of the acid-soluble radioactivity released from prelabeled ribosomes. This assay quantitates the total amount of rRNA that has been completely degraded during the 4-h starvation period. As shown in Figure 6, in a RNase II−, a RNase II− RNase R−, or a RNase II− RNase R− PNPts strain, the absence of RNase PH leads to a major reduction in the amount of acid-soluble material produced, confirming that RNase PH has an important role in the degradation process during starvation.
FIGURE 6.
Acid-soluble radioactivity generated by degradation of ribosomes during glucose starvation. Cells grown in the presence of [3H]-uridine, were collected and resuspended in M9 medium without glucose followed by incubation at 42°C, as described in Materials and Methods. Samples were taken at 4 h, and degradation was determined from the release of acid-soluble radioactivity presented as a percentage of the total radioactivity in the culture sample. The data shown are the average and standard deviation based on three to eight experimental repeats.
An interesting sidelight to this experiment is the effect of removal of RNase II. Its absence leads to a threefold elevation in the amount of acid-soluble radioactivity released compared with wild type (Fig. 6). This result is independent of polyadenylation as the introduction of a poly(A) polymerase mutation has no observable effect (data not shown). RNase II is known to trim back single-stranded 3′ ends, which are required for other exoribonucleases to bind rRNA fragments to initiate their degradation (Marujo et al. 2000). We attribute the elevated amount of acid-soluble material in the absence of RNase II to the maintenance of the 3′ extensions allowing other RNases to degrade more efficiently.
DISCUSSION
The studies presented here provide a detailed examination of the degradation of rRNA during starvation, and a comparison with degradation during steady-state growth due to quality control. While the two processes share many aspects in common, for example, endonucleolytic cleavages followed by exonucleolytic degradation of the resulting rRNA fragments to acid-soluble material, the details of the two pathways differ markedly. Thus, we have shown that (1) the endonucleolytic cleavage fragments accumulated during the two processes are not the same; (2) further degradation of the rRNA fragments proceeds by different pathways; (3) each pathway uses a distinct subset of processive exoribonucleases; and (4) RNase PH is required for initiating efficient rRNA degradation during starvation.
Primer extension analysis identified a single, major cleavage site in 16S RNA between residues A919 and U920 during both starvation and as a consequence of quality control. However, while the resulting downstream fragment from each process accumulated in the absence of the processive exoribonucleases, the fate of the upstream fragment differed. During starvation, the fragment was rapidly degraded even when three processive exoribonucleases were absent, whereas it accumulated or was cleaved further in the quality control process. The enzyme(s) responsible for the rapid degradation of the upstream fragment is not yet known. Primer extension also identified a major cut in an exposed region of 23S rRNA located between residues C1942 and U1943, although in the quality control process, several other closely spaced cleavages were observed as well. The resulting upstream fragment was shortened more rapidly in the quality control process compared with its counterpart generated during starvation.
Interestingly, in both degradation pathways, the major endonucleolytic cleavages occurred in the RNA-rich ribosome subunit interfaces, as might be expected if ribosome subunits were the substrates for degradation (Zundel et al. 2009). Cleavages occurred between helices 27 and 28 in the 30S particle, and in helix 71 in the 50S subunit. Based on these findings, the initial endonucleolytic cleavages of rRNA during starvation and in the quality control process appear to be similar. However, the resulting fragments appear to be acted upon differently in the two processes, leading to distinct patterns of fragment accumulation in the absence of the processive exoribonucleases. At present, the identity of the endoribonucleases responsible for initiating the degradative processes remains uncertain. In vitro studies suggested that purified RNase E and RNase G could act on ribosome subunits, but rRNA degradation continued in an rne,rng double mutant (M Zundel and MP Deutscher, unpubl.), perhaps due to leakiness of the rnets allele. Further work will be needed to sort out these apparently conflicting data.
On the other hand, we have obtained considerable information about the role of exoribonucleases and have found that they differ in the two degradative processes. Consistent with earlier data (Cheng and Deutscher 2003), RNase R and PNPase were shown to be required for removal of rRNA fragments generated as a consequence of quality control. In contrast, RNase II and RNase R are more important for fragment removal during starvation, and PNPase is not involved. Rather, we find that RNase PH, another Pi-dependent exoribonuclease, plays an essential role in rRNA degradation during starvation. In its absence, total rRNA degradation is greatly reduced and no rRNA fragments accumulate. Moreover, what appears to be the first step in 16S rRNA degradation, removal of ∼50 nt from its 3′ end, does not occur. How the trimming of 16S rRNA is related to the endonucleolytic cleavages is not yet understood, although one possible explanation is that the trimming exposes the 919/920 region to allow cleavage. Nevertheless, these findings define a new role for RNase PH, which heretofore had been implicated only in tRNA maturation in E. coli. Studies are now in progress to further clarify the function of RNase PH in ribosome degradation.
MATERIALS AND METHODS
Bacterial strains
Strains MG1655 I− (Blattner et al. 1997; Soupene et al. 2003) and MG1655(Seq)* I− were considered to be wild type for this study. MG1655(Seq)*, an rph+ derivative of MG1655, was constructed by Donald Court (National Cancer Institute, Bethesda, MD) and provided by Kenneth Rudd (University of Miami, FL). The RNase I− derivatives were constructed by recombineering (Datsenko and Wanner 2000; Datta et al. 2006) and were confirmed by PCR and direct assay for RNase I. Mutant strains lacking one or more of the processive exoribonucleases, RNase R, RNase II, or PNPase, were generated by phage P1-mediated transduction using _rnr_∷kan, _rnb_∷Tn10 or pnp200. MG1655(Seq)* PNPts was generated by cotransduction of the pnp200 allele from strain SK6639 (Yancey and Kushner 1990) with an arginine marker, as described (Cheng and Deutscher 2003). Mutant strains were confirmed by antibiotic resistance and by direct enzymatic assays.
Cell growth and viability
Cells were grown in either M9 minimal medium supplemented with 0.4% glucose or YT medium at either 31°C or 42°C. Antibiotics were added as required at the following concentrations: 50 μg/mL kanamycin, 20 μg/mL chloramphenicol, and 15 μg/mL tetracycline. Cell growth was monitored by A600 values.
In vivo assay for ribosome degradation
Fifty milliliters of M9 minimal or low-phosphate minimal medium (100 mM Tris-HCl at pH 7.6, 50 mM NaCl, 18.8 mM NH4Cl, 0.1 mM KH2PO4, and 0.1 mM CaCl2, 1 mM MgSO4·7H2O) and 0.2% glucose supplemented with 0.1 mM uridine and 1 μCi/mL [3H]-uridine or 1 μCi/mL [32P]-orthophospate, when indicated, was inoculated with small volumes of overnight culture to an initial A600 of 0.004–0.01. Cultures were grown at 31°C to an A600 of ∼0.2. Cells were collected by centrifugation for 15 min in a Sorvall SS34 rotor. The cell pellet was washed twice in M9 salts and resuspended in 50 mL of M9 salts. One 20 mL portion was taken and incubated with shaking at 42°C in the absence of any carbon source for 4 h. A second 20 mL portion was taken, supplemented with 0.4% glucose, and incubated for 4 h at 42°C. A600 readings were taken to monitor growth in each culture. After 4 h, cells were harvested for total RNA isolation. The remaining 10 mL from each sample was retained as zero time controls. One milliliter portions were collected prior to and after the incubations and were further analyzed for acid-soluble material (see below).
Analysis of acid-soluble material
We removed 500 μL portions from the culture samples and treated with 250 μL of 4 M formic acid (Cohen and Kaplan 1977). After 15 min on ice, samples were centrifuged at maximum speed for 15 min in a Fisher bench top microcentrifuge at 4°C. Half of the supernatant fraction was removed and added to 10 mL of scintillation fluid. Samples were counted in a scintillation counter to determine acid-soluble radioactivity.
Preparation and electrophoresis of RNA
RNA was extracted by hot phenol/chloroform treatment of cell pellets and precipitated with ethanol (Huang and Deutscher 1992). Samples were loaded on a 1.5% agarose gel and resolved by electrophoresis at 5 V/cm for 90 min and visualized by ethidium bromide staining. [32P]-labeled rRNA samples were separated on agarose gels, transferred to a nylon membrane (see below), and visualized by exposure to a PhosphorImager (Molecular Dynamics) screen.
Northern blot analysis
rRNA (2.5 μg) was resolved on a 1.5% agarose gel in 1× TAE buffer (40 mM Tris-acetate, 1 mM EDTA) and transferred to a nylon membrane (Perkin Elmer) by downward capillary transfer for 3 h using 1× TAE as the transfer solution. DNA oligonucleotide probes complementary to either 16S rRNA (16S(57–76): 5′-cctgttaccgttcgacttgc-3′; 16S(431–450): 5′-tcctccccgctgaaagtact-3′; 16S(895–915): 5′-atttgagttttaaccttgcg-3′; 16S(977–996): 5′-atgtcaagaccaggtaaggt-3′; 16S(1522–1540): 5′-aaggatgatccaaccgca-3′), 23S rRNA (23S(35–55): 5′-ccttcatcgcctctgactgcc-3′; 23S(1689–1710): 5′-cagcgtgccttctcccgaag-3′; 23S(1919–1938): 5′-tttcgctaccttaggaccgt-3′; 23S(2131–2150): 5′-gactggcgtccacacttcaa-3′ and 23S(2885-2904): 5′-aaggttaagcctcacggttc-3′) were [32P]-labeled at their 5′-ends by T4 polynuclotide kinase. Probes were allowed to anneal to the transferred RNA by overnight incubation in ExpressHyb hybridization solution (Clontech), and the detected bands were visualized by PhosphorImager (Molecular Dynamics) analysis.
Primer extension analysis
Total cellular RNA extracted as described above was annealed to [32P] 5′-end labeled primers specific to nucleotides 431–450 (Fig. 2, probe b), and 996–977 (Fig. 2, probe d) of 16S rRNA and 2131–2150 of 23S rRNA (Fig. 3, probe d). The primers were extended by AMV-RT (Promega) according to the manufacturer's protocol. Primer extension products were precipitated with ethanol; dissolved in DNA loading buffer containing 89% formamide, 4% TE buffer (10 mM Tris-HCl at pH 8.0, 1 mM EDTA), 0.12% bromophenol blue, and 0.17% xylene cyanol; separated on 6% polyacrylamide/7 M urea sequencing gels (SequaGel Sequencing System, National Diagnostics); and visualized by PhosphorImager. DNA sequencing ladders were obtained using plasmid DNA encoding 16S rRNA and 23S rRNA (pKK3535 (Cheng and Deutscher 2003) with DNA Sequenase (USB) according to manufacturer's instructions.
ACKNOWLEDGMENTS
We thank Dr. Arun Malhotra and members of the Deutscher laboratory for helpful discussions and reading of the manuscript. This work was supported by Grant GM16317 from the National Institutes of Health.
Footnotes
REFERENCES
- Blattner FR, Plunkett G III, Bloch CA, Perna NT, Burland V, Riley M, Collado-Vides J, Glasner JD, Rode CK, Mayhew GF, et al. 1997. The complete genome sequence of Escherichia coli K-12. Science 277: 1453–1462 [DOI] [PubMed] [Google Scholar]
- Cheng ZF, Deutscher MP 2003. Quality control of ribosomal RNA mediated by polynucleotide phosphorylase and RNase R. Proc Natl Acad Sci 100: 6388–6393 [DOI] [PMC free article] [PubMed] [Google Scholar]
- Cohen L, Kaplan R 1977. Accumulation of nucleotides by starved Escherichia coli cells as a probe for the involvement of ribonucleases in ribonucleic acid degradation. J Bacteriol 129: 651–657 [DOI] [PMC free article] [PubMed] [Google Scholar]
- Datsenko KA, Wanner BL 2000. One-step inactivation of chromosomal genes in Escherichia coli K-12 using PCR products. Proc Natl Acad Sci 97: 6640–6645 [DOI] [PMC free article] [PubMed] [Google Scholar]
- Datta S, Costantino N, Court DL 2006. A set of recombineering plasmids for gram-negative bacteria. Gene 379: 109–115 [DOI] [PubMed] [Google Scholar]
- Huang S, Deutscher MP 1992. Sequence and transcriptional analysis of the Escherichia coli rnt gene encoding RNase T. J Biol Chem 267: 25609–25613 [PubMed] [Google Scholar]
- Kaplan R, Apirion D 1975. Decay of ribosomal ribonucleic acid in Escherichia coli cells starved for various nutrients. J Biol Chem 250: 3174–3178 [PubMed] [Google Scholar]
- Kaplan R, Apirion D 1975. The fate of ribosomes in Escherichia coli cells starved for a carbon source. J Biol Chem 250: 1854–1863 [PubMed] [Google Scholar]
- Marujo PE, Hajnsdorf E, Le Derout J, Andrade R, Arraiano CM, Regnier P 2000. RNase II removes the oligo(A) tails that destabilize the rpsO mRNA of Escherichia coli. RNA 6: 1185–1193 [DOI] [PMC free article] [PubMed] [Google Scholar]
- McCarthy BJ 1962. The effects of magnesium starvation on the ribosome content of Escherichia coli. Biochim Biophys Acta 55: 880–888 [Google Scholar]
- Okamura S, Maruyama HB, Yanagita T 1973. Ribosome degradation and degradation products in starved Escherichia coli. VI. Prolonged culture during glucose starvation. J Biochem 73: 915–922 [DOI] [PubMed] [Google Scholar]
- Soupene E, van Heeswijk WC, Plumbridge J, Stewart V, Bertenthal D, Lee H, Prasad G, Paliy O, Charernnoppakul P, Kustu S 2003. Physiological studies of Escherichia coli strain MG1655: Growth defects and apparent cross-regulation of gene expression. J Bacteriol 185: 5611–5626 [DOI] [PMC free article] [PubMed] [Google Scholar]
- Yancey SD, Kushner SR 1990. Isolation and characterization of a new temperature-sensitive polynucleotide phosphorylase mutation in Escherichia coli K-12. Biochimie 72: 835–843 [DOI] [PubMed] [Google Scholar]
- Zundel MA, Basturea GN, Deutscher MP 2009. Initiation of ribosome degradation during starvation in Escherichia coli. RNA 15: 977–983 [DOI] [PMC free article] [PubMed] [Google Scholar]
