Lysosomal positioning coordinates cellular nutrient responses (original) (raw)
. Author manuscript; available in PMC: 2011 Oct 1.
Published in final edited form as: Nat Cell Biol. 2011 Mar 13;13(4):453–460. doi: 10.1038/ncb2204
Abstract
Mammalian target of rapamycin (mTOR) signalling and macroautophagy (henceforth autophagy) regulate numerous pathological and physiological processes including cellular responses to altered nutrient levels. However, the mechanisms regulating mTOR and autophagy remain incompletely understood. Lysosomes are dynamic intracellular organelles 1, 2 intimately involved both in the activation of mTOR complex 1 (mTORC1) signalling and in degrading autophagic substrates 3-8. Here we report that lysosomal positioning coordinates anabolic and catabolic responses to changes in nutrient availability by orchestrating early plasma membrane signalling events, mTORC1 signalling and autophagy. Activation of mTORC1 by nutrients correlates with its presence on peripheral lysosomes that are physically close to the upstream signalling modules, while starvation causes perinuclear clustering of lysosomes, driven by changes in intracellular pH (pHi). Lysosomal positioning regulates mTORC1 signalling, which, in turn, influences autophagosome formation. Lysosome positioning also influences autophagosome-lysosome fusion rates, and thus controls autophagic flux by acting both at the initiation and termination stages of the process. Our findings provide a fundamental physiological role for the dynamic state of lysosomal positioning in cells as a coordinator of mTORC1 signalling with autophagic flux.
The serine/threonine kinase mTOR exists in two independent complexes. mTORC1, which controls cell metabolism, includes mTOR and several regulatory subunits including raptor, while mTORC2, a rictor-containing complex, modulates actin cytoskeleton dynamics 9. At least two independent signalling events regulate mTOR activity in response to nutrient availability. One signal is initiated from growth factor receptors that activate mTOR via the tuberous sclerosis complex (TSC1/2) and Ras-family GTP-binding protein, Rheb. This occurs via different upstream pathways, including PI3 kinase and Akt/PKB 9-12. The mechanisms by which amino acids regulate mTOR activity are less well understood, but Rag GTPases and the Ragulator complex can mediate this response by enhancing the association of mTORC1 with the late endosomal/lysosomal compartment by bringing mTORC1 close to its activator Rheb 3, 4, 13. mTORC1 activation stimulates protein synthesis via its phosphorylation substrates p70-S6 kinase (S6K) and 4E-BP 10-12. Conversely, starvation inactivates mTORC1, thereby inhibiting anabolic processes and liberating nutrient reserves by activating autophagy. In autophagy, cytoplasmic proteins, protein complexes and organelles are engulfed by double-membrane vesicles called autophagosomes, which are transported along microtubules towards their minus-ends and ultimately fuse with lysosomes, where their contents are degraded 5, 6, 8. Thus, lysosomes are intimately involved in nutrient responses, as they are a site for mTORC1 activation and a sink for autophagy.
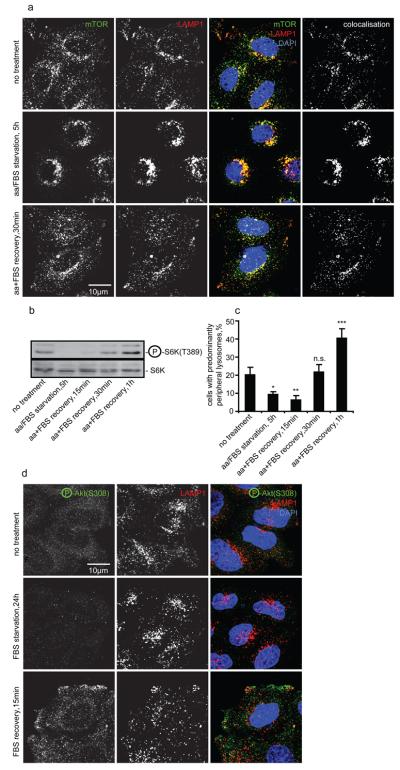
Nutrient deprivation has been reported to release mTOR from lysosomes, while amino acid replenishment restores lysosomal localisation of mTOR and its activity 3, 4. We extended these observations using three different starvation protocols (see Methods). Complete nutrient deprivation, as described 3, 4, decreased colocalisation between mTOR and the late endosomal/lysosomal markers LAMP1 or LAMP2, and inhibited mTOR activity, as assayed by the phosphorylation status of S6K at an mTOR-specific phosphorylation site (Fig. S1a-c, data not shown). However, milder (but more physiological) starvation protocols allowed retention of mTOR on lysosomes without preventing a loss of mTOR activity (Fig. 1a, b, Fig. S1d-i). We noted, however, that the intracellular distribution of lysosomes and lysosome-associated mTOR correlated with nutritional status and mTOR activity. All three starvation protocols increased the proportion of cells with predominantly perinuclear lysosomes, while upon recovery (replenishment of either amino acids alone or together with serum), mTOR activity restoration was paralleled by the increased localisation of LAMP1- and mTOR-positive vesicles at the cell periphery, including plasma membrane projections, such as lamellipodia (Fig. 1a-c, Fig. S1a-l). As previously described 3, 4, mTORC1, rather than mTORC2, associates with lysosomes, since LAMP1-positive vesicles colocalised with the mTORC1 complex-specific subunit raptor but not with mTORC2-specific rictor (Fig. S2a, b).
Fig. 1.
Changes in mTORC1 signalling in response to starvation correlate with lysosomal positioning. (a-c) HeLa cells were either left untreated, amino acid/FBS starved for 5 h, or starved and then recovered in amino acid/FBS-containing medium, then immunostained, or immunoblotted using antibodies as shown. Colocalisation panels show an overlap between mTOR and LAMP1 signals. Note that changes in the positioning of lysosomal mTOR (quantified as a percentage of cells with predominantly peripheral localisation of LAMP1-positive vesicles, (a) and (c)) correlate with mTORC1 activity (levels of phosphorylated S6K relative to the total S6K, (b)). (d) Visualisation of Akt activated in response to recovery after serum starvation. After nutrient recovery, LAMP1-positive vesicles localise to peripheral regions with higher concentrations of phospho-Akt. For all panels, values are means ± s.e.m. of three independent experiments performed in triplicate. * p < 0.05, ** p < 0.01, *** p < 0.005 t-test; other comparisons are not significant (n.s.). Representative maximum intensity projections of serial confocal optical sections are shown. Uncropped images of blots are shown in Supplementary Fig. 7.
We investigated if the correlation between mTORC1 activity and lysosomal positioning is an epiphenomenon, or if they are causally linked. First, we tested if changes in the localisation of LAMP1-positive vesicles could be a consequence of altered mTOR activity. However, neither inhibition of mTOR signalling by raptor or rictor siRNA knockdown or with its specific inhibitor rapamycin, nor upregulation of mTORC1 activity by overexpression of mTOR, raptor or Rheb, affected the positioning of LAMP1-positive vesicles (Fig. S2a-k). Similarly, lysosomal positioning was independent of Akt activity upstream of mTORC1 (Fig. S2l-t). Therefore, we considered an alternative possibility that lysosomal positioning influenced mTORC1 activity, since the peripheral localisation of lysosomal mTORC1 would bring it closer to upstream signalling molecules at the cell-membrane, such as the active form of Akt of which a major pool was detected close to the plasma membrane during the recovery phase (it is inactive during starvation) (Fig. 1d) 14, 15.
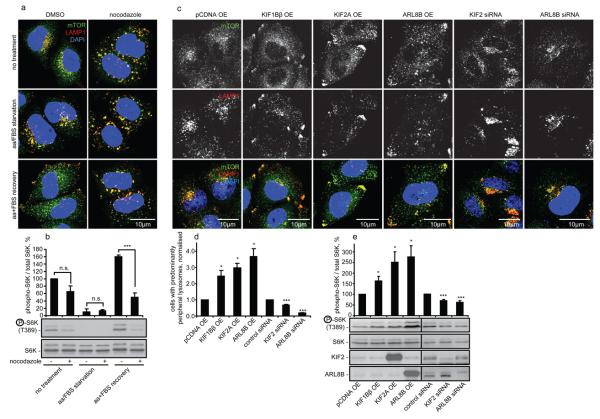
Accordingly, we investigated if factors that alter lysosomal positioning independent of changes in nutrient availability, affected mTORC1 activity. Short-term treatment with the microtubule-depolymerising drug, nocodazole, dispersed lysosomes uniformly in the cell and obliterated any differences in lysosomal positioning seen during our starvation/recovery treatments (Fig. 2a). Nocodazole tended to suppress mTORC1 activity under basal conditions in full tissue culture medium and prevented the full recovery of mTORC1 signalling upon restoration of nutrients after starvation (Fig. 2b).
Fig. 2.
Factors changing lysosomal positioning also affect mTORC1 signalling. (a) and (b) Nocodazole flattens the differences in lysosomal mTOR localisation and dampens mTORC1 signalling in response to changes in nutrient availability. Cells were treated as in Fig. 1a followed by the incubation with DMSO (vehicle) or with nocodazole during the last 2 h before fixation/lysis. Samples were analysed by immunofluorescence (a) or immunoblotting (b). Quantification of phopho-S6K levels is shown in (b). (c-f) Changes in lysosomal positioning induced by kinesin- or small GTPase-family members (c, d) correlate with changes in mTORC1 activity (e). HeLa cells were transfected with overexpression constructs or with siRNA as shown, followed by immunofluorescence (c,d) or by immunoblotting (e) analyses. Values are means ± s.e.m. of three independent experiments performed in triplicate. All comparisons are with the control within each treatment condition, * p < 0.05, *** p < 0.005 t-test; n.s. not significant. Uncropped images of blots are shown in Supplementary Fig. 7.
We tested our hypothesis using more specific tools by overexpressing two kinesin superfamily members, KIF1Bβ and KIF2, which redistribute lysosomes to the cell periphery 16, 17. The kinesin-induced increase in the peripheral localisation of LAMP1- and mTOR-positive compartments correlated with increased mTORC1 activity (Fig. 2c-e). The small GTPase ARL8B (ARF-like, also called Gie2) localises to lysosomes and also distributes them to the periphery 18-20. We confirmed these data and found that ARL8B overexpression, like the kinesins, increased localisation of lysosomal mTORC1 at the cell periphery and enhanced its activity (Fig. 2c-e, Fig. S3a). We also tested the converse situation by knocking down KIF2 and ARL8B and found that it resulted in clustering of lysosomes around the microtubule-organising centre (MTOC), which correlated with reduced mTORC1 activity (Fig. 2c-e). Short-term nocodazole treatment obliterated any differences in lysosomal localisation caused by ARL8B, and also flattened any differential effects of ARL8B knockdown or overexpression (Fig. S3b). Thus, the effects of ARL8B on mTORC1 activity are unlikely to be due to a direct interaction of ARL8B with mTORC1, but are microtubule-dependent and correlate with lysosomal localisation, consistent with mTORC1 activity being regulated by lysosomal positioning.
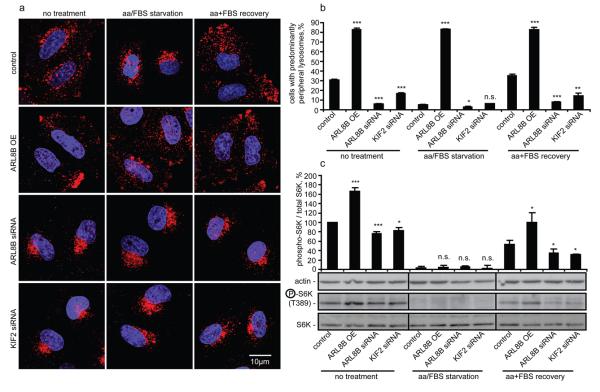
Forcing lysosomes to the cell periphery by ARL8B overexpression, or inducing their perinuclear clustering by ARL8B or KIF2 knockdown, prevented the changes in lysosomal distribution that normally occur during starvation/recovery phases (Fig 3a, b). This allowed us to test if appropriate lysosomal positioning is required for the changes in mTORC1 signalling during starvation/recovery. During starvation, no mTORC1 activity was detected (assessed by S6K phosphorylation), even when lysosomes remained peripheral due to ARL8B overexpression, suggesting that peripheral localisation of lysosomes and of lysosomal mTOR is not sufficient for mTORC1 signalling in the absence of upstream signalling induced by nutrients (Fig. 3a-c). However, the predominantly peripheral lysosomal localisation mediated by ARL8B overexpression enhanced the induction of mTORC1 signalling upon addition of nutrients after starvation, while preventing lysosomal spreading by ARL8B or KIF2 knockdown reduced the restoration of mTOR signalling in the recovery period (Fig. 3a-c). Therefore, lysosomal distribution appears to modulate the intensity of mTORC1 signalling response to nutrients.
Fig. 3.
Lysosomal positioning regulates recovery of mTOR signalling after starvation. (a-c) HeLa cells transfected with ARL8B or KIF2 siRNA, or with ARL8B overexpression construct (non-targeting siRNA and empty pCDNA vector used as transfection controls), were either left untreated, serum/amino acid starved for 5 h, or starved and then recovered in amino acid and FBS containing medium for 30 min. Cells were immunostained using LAMP1 antibody (a) and the percentage of cells with predominantly peripheral localisation of LAMP1-positive vesicles was quantified (b) or subjected to immunoblotting (c) using antibodies as shown. Quantification of phospho-S6K levels relative to the total S6K is shown in (c). Values are means ± s.e.m. of three independent experiments performed in triplicate. All comparisons are with the control within each treatment condition, * p < 0.05, ** p < 0.01, *** p < 0.005 t-test; n.s. not significant. Uncropped images of blots are shown in Supplementary Fig. 7.
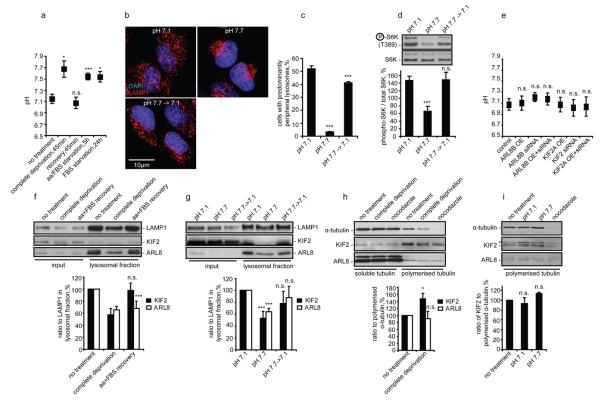
To investigate mechanisms responsible for changes in lysosomal localisation in response to nutrients, we tested if our starvation/recovery protocols affected pHi, which controls lysosomal positioning 1. All three starvation protocols increased pHi from ~7.1 to ~7.7, returning to basal levels after nutrient restoration (Fig. 4a). Such pHi alterations were sufficient to affect lysosomal positioning and mTORC1 activity in full tissue culture medium (Fig. 4b-d). Importantly, changing lysosomal positioning by manipulating ARL8B or KIF2 levels did not affect pHi (Fig. 4e). These results suggest that nutrient levels control pHi, which changes lysosomal localisation, thus affecting mTOR signalling.
Fig. 4.
Nutrients control lysosomal positioning by modulating pHi and lysosomal levels of KIF2 and ARL8B. (a) Starvation increases pHi in HeLa cells allowed to starve using three different protocols (see Methods) with or without subsequent recovery. (b-d) Changing pHi from 7.1 to 7.7 is sufficient to affect localisation of lysosomes and mTORC1 activity. pHi was titrated in full tissue culture medium containing nigericin, which allows one to force changes in pHi by altering pH in the medium, followed by immunostaining (b, c) or western blotting (d) using antibodies as shown. (e) Changes in lysosomal localisation have no effect on pHi. ARL8B and KIF2 were overexpressed or knocked down in HeLa cells followed by pHi measurement. (f, g) Nutrients and pHi affect levels of ARL8 and KIF2 in lysosomal fractions. Protein levels and their quantification in total cellular lysates or in isolated lysosomal fractions from HeLa cells subjected to 1 h nutrient deprivation/recovery (f) or to 1 h changes of pHi in full tissue culture medium containing nigericin (g) are shown. (h, i) Effect of nutrients and pHi on binding of ARL8 and KIF2 to polymerised microtubules. HeLa cells treated as in panels (f) and (g), followed by isolation of polymerised microtubule fraction and western blotting. Asterisk indicates a nonspecific band.
For all panels values are means ± s.e.m. of three independent experiments performed in triplicate. All comparisons are with the control within each treatment condition, * p < 0.05, ** p < 0.01, *** p < 0.005 t-test; n.s. not significant. Uncropped images of blots are shown in Supplementary Fig. 7.
We speculated that nutrients and pHi may influence lysosomal movement by affecting binding of proteins like KIF2 or ARL8B to lysosomes or microtubules. Both nutrient deprivation and increased pHi reduced the levels of these proteins in lysosomal fractions, while restoration of nutrients or basal pHi fully or partially reversed this phenotype (Fig. 4f, g). However, starvation and high pHi do not appear to decrease the ability of KIF2 and ARL8B to move lysosomes by reducing their binding to polymerised microtubules (Fig. 4h, i). Thus, nutrients may stimulate lysosomal redistribution to the cell periphery by maintaining lower pHi, which favours recruitment to lysosomes of proteins that control their intracellular positioning, while starvation increases pHi and displaces these proteins from lysosomes.
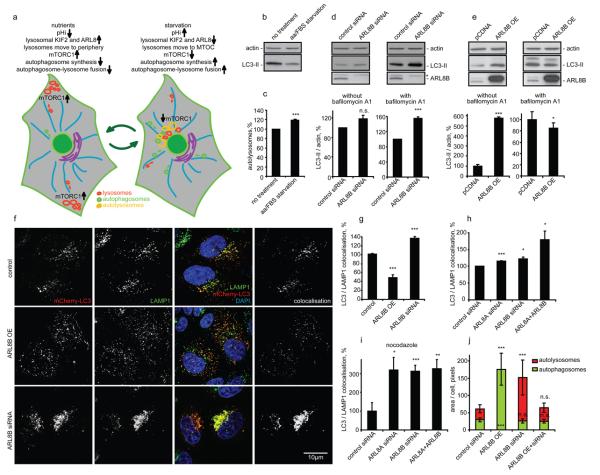
By influencing mTORC1 activity, lysosomal positioning would be anticipated to regulate autophagosome formation. Perinuclear positioning of lysosomes should also favour autophagosome-lysosome fusion by placing more lysosomes in the travel path of autophagosomes that form randomly in cells and move along microtubules towards the MTOC 5. Thus, lysosomal positioning may coordinate autophagic flux at both the initiation and termination stages (Fig. 5a). This would be consistent with observations that starvation, whilst increasing autolysosome formation (detected as an increase in the proportion of GFP-quenched, mRFP-only microtubule-associated protein 1 light chain 3 (LC3)-positive dots in cells stably expressing mRFP-GFP tandem fluorescent-tagged LC3 (tfLC3) 21), can, in some cells, reduce the steady-state numbers of autophagosomes (which correlate with the levels of lipidated, autophagosome-associated form of LC3 (LC3-II) versus actin 22), suggesting that starvation is simultaneously increasing the rates of autophagosome/LC3-II formation and degradation (Fig. 5b, c, Fig. S4a-c).
Fig. 5.
Lysosomal positioning modulates autophagy. (a) Diagram illustrating how lysosomal positioning coordinates mTOR signalling and autophagy. Peripheral lysosomal localisation (nutrient-induced) increases mTOR activity (blocking autophagosome synthesis) and reduces autophagosome-lysosome fusion. Starvation-induced lysosomal clustering reduces mTOR activity (activating autophagosome synthesis) and facilitates autophagosome-lysosome fusion. (b, c) 5 h serum and amino acid starvation of HeLa cells reduces LC3-II levels (b), but increases autolysosome numbers detected using tfLC3 (c). With tfLC3, GFP- and RFP-positive puncta represent autophagosomes prior to lysosomal fusion, while RFP-positive/GFP-negative puncta represent autolysosomes - GFP is more rapidly quenched by low lysosomal pH (see Methods). Increased autolysosomes suggest enhanced starvation-induced flux of LC3 to lysosomes. (d) ARL8B knockdown increases autophagosomal synthesis. siRNA-transfected HeLa cells were incubated for 48 h, then left untreated or incubated with bafilomycin A1. LC3-II levels versus actin were quantified (bottom graphs). Asterisk: nonspecific band. (e) ARL8B overexpression inhibits autophagosome synthesis and degradation. HeLa cells overexpressing ARL8B or empty vector were analysed as in (d). (f) HeLa cells were cotransfected with either ARL8B overexpression construct or siRNA (non-targeting siRNA and empty pEGFP vector were transfection controls) together with mCherry-LC3 for 48 h. After fixation, cells were stained for endogenous LAMP1 and DNA (DAPI). Representative maximum intensity projections of serial confocal optical sections are shown. Colocalisation panels show overlapping mCherry-LC3 and LAMP1 signals. (g-i) Quantification of autophagosome-lysosome fusion in HeLa cells. Percentages of autolysosomes (positive for both mCherry-LC3 and LAMP1) to autophagosomes (positive for mCherry-LC3 and negative for LAMP1) were quantified. In panel (i), we analysed cells treated for 2 h with nocodazole before fixation, which dispersed the perinuclear lysosomal cluster (see Fig. 2a). (j) Autophagosomal and autolysosomal numbers in tfLC3-expressing cells after ARL8B overexpression and knockdown. (Fig. S5o shows representative cells). In panels (g-j) we analysed 20 cells/group in three independent experiments. Values are means ± s.e.m of three independent experiments performed in triplicate. * p < 0.05, ** p < 0.01, *** p < 0.005 t-test; other comparisons not significant (n.s.). Uncropped images of blots are shown in Supplementary Fig. 7.
Accordingly, we investigated if autophagic flux is affected by factors that modulate lysosomal distribution, focusing on ARL8B, which had the strongest effect on lysosomal positioning and mTORC1 activity. We measured steady-state autophagosome/LC3-II levels as well as autophagosome formation (levels of LC3-II in the presence of lysosomal inhibitor bafilomycin A1 that blocks its degradation) 22. In line with our prediction (Fig. 5a), ARL8B knockdown increased autophagosome formation (LC3-II levels in the presence of bafilomycin A1) (Fig. 5d), consistent with the decreased mTOR activity (Fig. 2e). ARL8B knockdown in nutrient starvation conditions, when mTOR activity is suppressed, had no significant effect on autophagosome formation (Fig. S4d). ARL8A, a close homolog of ARL8B, phenocopies ARL8B and the two genes have additive effects on autophagy (Fig. S4e, f). These ARL8 effects were confirmed using different sets of smartpool siRNA as well as individual siRNA oligonucleotides (Fig. S4e-j). Similar to ARL8A/B, knockdown of KIF2, which increased lysosomal perinuclear localisation and reduced mTORC1 activity (Fig. 2c-e), also increased autophagosome synthesis (Fig. S4k-n).
Lysosomal scattering induced by ARL8B overexpression increased steady-state LC3-II levels and numbers of autophagic vesicles, while in the presence of bafilomycin A1 LC3-II levels were either unaffected or even reduced (Fig. 5e, Fig. S5a-e). Thus, ARL8B may reduce both autophagosome formation (LC3-II in the presence of bafilomycin A1), as well as autophagosome-lysosome fusion (increased LC3-II in normal medium). KIF2A overexpression mimicked this effect on LC3-II levels though its effect was less pronounced (Fig. S5a-e). We could rescue the effects of ARL8B and KIF2A overexpression by a simultaneous knockdown of either protein demonstrating siRNA specificity (Fig. S5a-e). As previously seen for ARL8A knockdown, its overexpression phenocopied the effect of ARL8B overexpression on LC3-II levels (Fig. S5f).
To further test that lysosomal positioning could influence autophagosome-lysosome fusion, we measured the effect of ARL8B on the proportion of autophagosomes (marked with mCherry-LC3) that colocalise with lysosomes (marked with anti-LAMP1 antibody or with lgp120-EGFP). As predicted (Fig. 5a), overexpression of ARL8B decreased autophagosome-lysosome colocalisation (Fig. 5f, g; Fig. S5g, h). This autophagosome-lysosome fusion defect was not due to decreased lysosome numbers, as ARL8B overexpression did not change the expression of LAMP1, LAMP2 or mature cathepsin D (Fig. S5i). The effect of ARL8B overexpression on autophagosome-lysosome fusion is also not due to increased mTOR activity and decreased autophagosome synthesis. First, ARL8B overexpression increased total autophagosome numbers despite decreased autophagosome formation (Fig. 5e), suggesting a block at the fusion step. Second, ARL8B overexpression resulted in an increase in autophagosome/LC3-II levels, even when mTORC1 activity was blocked by rapamycin (Fig. S5j). Indeed, the ability of rapamycin to reduce the accumulation of mutant huntingtin, an autophagy substrate, was blocked by ARL8B overexpression (Fig. S5k). Finally, ARL8B inhibited autophagosome-lysosome fusion in a kinesin- and microtubule-dependent manner (Fig. S5l-n).
Conversely, knockdown of ARL8B enhanced autophagosome-lysosome colocalisation (Fig. 5f, g), while simultaneous knockdown of ARL8B and ARL8A additively enhanced autophagosome-lysosome fusion (Fig. 5h). This reflects increased autophagosome-lysosome fusion and not simply increased proximity in a tight perinuclear cluster, since increased colocalisation was also observed after the lysosomal cluster was scattered throughout the cytoplasm by subsequent nocodazole treatment (Fig. 5i). The effects of ARL8B on autophagosome-lysosome fusion were also confirmed in tfLC3-expressing cells (Fig. 5j, Fig. S5o).
In order to test the potential physiological and clinical relevance of our results we investigated the effects of ARL8 and KIF2 overexpression and knockdown on autophagic flux using diverse autophagic substrates. These include mutant forms of huntingtin associated with Huntington's disease (EGFP-httQ74) 23, mutant A53T α-synuclein that causes some familial forms of Parkinson's disease (EGFP-A53T) 24 and Mycobacterium tuberculosis var. bovis Bacillus Calmette-Guérin (BCG) related to the tuberculosis-causing mycobacterium 25, 26. ARL8 or KIF2 knockdowns protected in these disease models by reducing the levels of pathogenic autophagic substrates, while overexpression had the opposite effect (Fig. S6a-n). In agreement with its role in mTOR signaling and autophagy knockdown of the Drosophila ARL8 homologue reduced S6K phosphorylation and suppressed polyglutamine toxicity in vivo (Fig. S6o, p).
In summary, lysosomes change their intracellular positioning in response to nutrient availability, thus coordinating mTORC1 activity, autophagosome synthesis and autophagosome-lysosome fusion. During starvation, mTORC1 activity is repressed, which induces autophagosome formation. Starvation increases pHi, causing lysosomes to cluster near the MTOC, facilitating autophagosome-lysosome fusion. This may be due to a pH-dependent loss from lysosomes of proteins regulating anterograde lysosome movement. Conversely, nutrient replenishment restores basal pHi inducing lysosomal scattering, which brings lysosomal mTORC1 to the cell periphery and stimulates its activity by increasing its coupling to the gradient of signalling molecules emanating from the plasma membrane 14, 15. The intracellular gradient of active Akt, as reported here, is consistent with previous observations, for example the localisation and activation of Akt at the leading edge of chemotaxing cells 27.
Our data are consistent with multiple independent mechanisms regulating mTORC1 signalling 3, 4, 10, 11, 13. The lysosomal association of mTORC1 is required for its activation by amino acids, but constitutive targeting of mTORC1 to lysosomes does not completely abolish its sensitivity to amino acids, suggesting other mechanisms of regulation 3. While lysosomal redistribution during the recovery phase after starvation may not be the initial or sole trigger for mTOR activation, lysosomal localisation allows another level of control that modulates and reinforces other signalling inputs to mTOR.
While most known autophagy-inducing signals affect autophagosome synthesis, here we show that the archetypical signal, starvation, impacts both at the synthesis and autophagosome-lysosome fusion stages, which would greatly increase the efficiency of the delivery of autophagic substrates for catabolism, compared to just increasing autophagosome synthesis. This will enhance autophagy-mediated nutrient release during starvation, facilitating the rapid availability of secondary energy sources and, therefore, cell survival. This may be an adaptation that has particular advantages in higher eukaryotic cells, where autophagosomes are generally formed at sites that are distant from lysosomes, while yeast autophagosomes originate close to the vacuole.
Finally, autophagy is increasingly recognised as being a central cellular process for a wide variety of human diseases including cancer, neurodegeneration and infectious diseases. In this context our findings may have therapeutic potential, since ARL8 proteins are GTPases and thus provide potential drug targets. For example, increased mTORC1 activity and decreased autophagy are associated with tumorogenesis, and lysosomal spreading is associated with metastasis 28. Our data suggest that all these phenomena may be targeted by ARL8 inhibition. Furthermore, since suppression of ARL8 activity increased the clearance of a wide range of disease-associated autophagic substrates, ARL8 inhibition may provide a tractable therapeutic target for various infectious and neurodegenerative diseases.
Supplementary Material
1
2
3
4
5
6
7
8
9
Acknowledgements
We thank: S. Munro (ARL8 constructs and antibody), T. Katada (anti-ARL8 antibody), W.G. Kaelin (KIF1Bβ), N. Hirokawa (KIF2), D.M. Sabatini (mTOR, raptor, rictor), T. Yoshimori (EGFP-LC3, mRFP-GFP-LC3), N. Mizushima (Atg5-deficient and wild-type Atg5 MEFs), W.J. Strittmatter (Q81-EGFP), J.P. Luzio (lgp120-EGFP), A. Tolkovsky (GFP-LC3 cells), R. Tsien (mCherry), T. Kouno (hLC3B) and K-L. Guan (Rheb); B. Ravikumar, S. Luo and B. Underwood for helpful suggestions, M. Gratian and M. Bowen for microscopy assistance, and the Bloomington Drosophila Stock Center. We are grateful for funding from: Hughes Hall Research Fellowship (V.I.K. and Sov.S.), 2005 Pergolide Fellowship from Eli Lilly Japan (Shi.S.), British Council Japan Association (Shi.S.), MRC studentships (M.L. and L.J.), Daphne Jackson Trust Fellowship funded by MRC (F.H.S.), Heiser Foundation Postdoctoral Fellowship in Tuberculosis and Leprosy Research (E.A.R.), NIH grant AI069345, and in part NIH grants AI045148, and AI042999 (V.D.), Wellcome Trust Senior Fellowship in Clinical Science (D.C.R.), MRC programme grant (D.C.R., C.O'K.), and EU Framework VI (EUROSCA) grant (D.C.R.).
Footnotes
Contributions
All authors designed and analysed experiments. V.I.K., Shi.S., M.L., F.H.S., E.A.R., S.I., L.J., Sov.S., M.F. and F.M.M. performed experiments. V.I.K. and D.C.R. wrote the manuscript. D.C.R. supervised the project.
Competing financial interests
The authors declare that they have no competing financial interests.
References
- 1.Heuser J. Changes in lysosome shape and distribution correlated with changes in cytoplasmic pH. J Cell Biol. 1989;108:855–864. doi: 10.1083/jcb.108.3.855. [DOI] [PMC free article] [PubMed] [Google Scholar]
- 2.Luzio JP, Pryor PR, Bright NA. Lysosomes: fusion and function. Nat Rev Mol Cell Biol. 2007;8:622–632. doi: 10.1038/nrm2217. [DOI] [PubMed] [Google Scholar]
- 3.Sancak Y, et al. Ragulator-Rag Complex Targets mTORC1 to the Lysosomal Surface and Is Necessary for Its Activation by Amino Acids. Cell. 2010 doi: 10.1016/j.cell.2010.02.024. [DOI] [PMC free article] [PubMed] [Google Scholar]
- 4.Sancak Y, et al. The Rag GTPases bind raptor and mediate amino acid signaling to mTORC1. Science. 2008;320:1496–1501. doi: 10.1126/science.1157535. [DOI] [PMC free article] [PubMed] [Google Scholar]
- 5.Jahreiss L, Menzies FM, Rubinsztein DC. The itinerary of autophagosomes: from peripheral formation to kiss-and-run fusion with lysosomes. Traffic. 2008;9:574–587. doi: 10.1111/j.1600-0854.2008.00701.x. [DOI] [PMC free article] [PubMed] [Google Scholar]
- 6.Kimura S, Noda T, Yoshimori T. Dynein-dependent movement of autophagosomes mediates efficient encounters with lysosomes. Cell Struct Funct. 2008;33:109–122. doi: 10.1247/csf.08005. [DOI] [PubMed] [Google Scholar]
- 7.Klionsky DJ. Autophagy: from phenomenology to molecular understanding in less than a decade. Nat Rev Mol Cell Biol. 2007;8:931–937. doi: 10.1038/nrm2245. [DOI] [PubMed] [Google Scholar]
- 8.Ravikumar B, et al. Mammalian macroautophagy at a glance. J Cell Sci. 2009;122:1707–1711. doi: 10.1242/jcs.031773. [DOI] [PMC free article] [PubMed] [Google Scholar]
- 9.Sengupta S, Peterson TR, Sabatini DM. Regulation of the mTOR complex 1 pathway by nutrients, growth factors, and stress. Mol Cell. 40:310–322. doi: 10.1016/j.molcel.2010.09.026. [DOI] [PMC free article] [PubMed] [Google Scholar]
- 10.Tee AR, Anjum R, Blenis J. Inactivation of the tuberous sclerosis complex-1 and -2 gene products occurs by phosphoinositide 3-kinase/Akt-dependent and -independent phosphorylation of tuberin. J Biol Chem. 2003;278:37288–37296. doi: 10.1074/jbc.M303257200. [DOI] [PubMed] [Google Scholar]
- 11.Tee AR, Manning BD, Roux PP, Cantley LC, Blenis J. Tuberous sclerosis complex gene products, Tuberin and Hamartin, control mTOR signaling by acting as a GTPase-activating protein complex toward Rheb. Curr Biol. 2003;13:1259–1268. doi: 10.1016/s0960-9822(03)00506-2. [DOI] [PubMed] [Google Scholar]
- 12.Soulard A, Hall MN. SnapShot: mTOR signaling. Cell. 2007;129:434. doi: 10.1016/j.cell.2007.04.010. [DOI] [PubMed] [Google Scholar]
- 13.Kim E, Goraksha-Hicks P, Li L, Neufeld TP, Guan KL. Regulation of TORC1 by Rag GTPases in nutrient response. Nat Cell Biol. 2008;10:935–945. doi: 10.1038/ncb1753. [DOI] [PMC free article] [PubMed] [Google Scholar]
- 14.Jiang H, Vogt PK. Constitutively active Rheb induces oncogenic transformation. Oncogene. 2008;27:5729–5740. doi: 10.1038/onc.2008.180. [DOI] [PMC free article] [PubMed] [Google Scholar]
- 15.Cai SL, et al. Activity of TSC2 is inhibited by AKT-mediated phosphorylation and membrane partitioning. J Cell Biol. 2006;173:279–289. doi: 10.1083/jcb.200507119. [DOI] [PMC free article] [PubMed] [Google Scholar]
- 16.Santama N, et al. KIF2beta, a new kinesin superfamily protein in non-neuronal cells, is associated with lysosomes and may be implicated in their centrifugal translocation. EMBO J. 1998;17:5855–5867. doi: 10.1093/emboj/17.20.5855. [DOI] [PMC free article] [PubMed] [Google Scholar]
- 17.Matsushita M, Tanaka S, Nakamura N, Inoue H, Kanazawa H. A novel kinesin-like protein, KIF1Bbeta3 is involved in the movement of lysosomes to the cell periphery in non-neuronal cells. Traffic. 2004;5:140–151. doi: 10.1111/j.1600-0854.2003.00165.x. [DOI] [PubMed] [Google Scholar]
- 18.Bagshaw RD, Callahan JW, Mahuran DJ. The Arf-family protein, Arl8b, is involved in the spatial distribution of lysosomes. Biochem Biophys Res Commun. 2006;344:1186–1191. doi: 10.1016/j.bbrc.2006.03.221. [DOI] [PubMed] [Google Scholar]
- 19.Hofmann I, Munro S. An N-terminally acetylated Arf-like GTPase is localised to lysosomes and affects their motility. J Cell Sci. 2006;119:1494–1503. doi: 10.1242/jcs.02958. [DOI] [PubMed] [Google Scholar]
- 20.Okai T, et al. Novel small GTPase subfamily capable of associating with tubulin is required for chromosome segregation. J Cell Sci. 2004;117:4705–4715. doi: 10.1242/jcs.01347. [DOI] [PubMed] [Google Scholar]
- 21.Kimura S, Noda T, Yoshimori T. Dissection of the autophagosome maturation process by a novel reporter protein, tandem fluorescent-tagged LC3. Autophagy. 2007;3:452–460. doi: 10.4161/auto.4451. [DOI] [PubMed] [Google Scholar]
- 22.Tanida I, Minematsu-Ikeguchi N, Ueno T, Kominami E. Lysosomal turnover, but not a cellular level, of endogenous LC3 is a marker for autophagy. Autophagy. 2005;1:84–91. doi: 10.4161/auto.1.2.1697. [DOI] [PubMed] [Google Scholar]
- 23.Ravikumar B, Duden R, Rubinsztein DC. Aggregate-prone proteins with polyglutamine and polyalanine expansions are degraded by autophagy. Hum Mol Genet. 2002;11:1107–1117. doi: 10.1093/hmg/11.9.1107. [DOI] [PubMed] [Google Scholar]
- 24.Webb JL, Ravikumar B, Atkins J, Skepper JN, Rubinsztein DC. Alpha-Synuclein is degraded by both autophagy and the proteasome. J Biol Chem. 2003;278:25009–25013. doi: 10.1074/jbc.M300227200. [DOI] [PubMed] [Google Scholar]
- 25.Gutierrez MG, et al. Autophagy is a defense mechanism inhibiting BCG and Mycobacterium tuberculosis survival in infected macrophages. Cell. 2004;119:753–766. doi: 10.1016/j.cell.2004.11.038. [DOI] [PubMed] [Google Scholar]
- 26.Singh SB, Davis AS, Taylor GA, Deretic V. Human IRGM induces autophagy to eliminate intracellular mycobacteria. Science. 2006;313:1438–1441. doi: 10.1126/science.1129577. [DOI] [PubMed] [Google Scholar]
- 27.Merlot S, Firtel RA. Leading the way: Directional sensing through phosphatidylinositol 3-kinase and other signaling pathways. J Cell Sci. 2003;116:3471–3478. doi: 10.1242/jcs.00703. [DOI] [PubMed] [Google Scholar]
- 28.Mohamed MM, Sloane BF. Cysteine cathepsins: multifunctional enzymes in cancer. Nat Rev Cancer. 2006;6:764–775. doi: 10.1038/nrc1949. [DOI] [PubMed] [Google Scholar]
- 29.Tafani M, et al. Regulation of intracellular pH mediates Bax activation in HeLa cells treated with staurosporine or tumor necrosis factor-alpha. J Biol Chem. 2002;277:49569–49576. doi: 10.1074/jbc.M208915200. [DOI] [PubMed] [Google Scholar]
- 30.Ong V, et al. A role for altered microtubule polymer levels in vincristine resistance of childhood acute lymphoblastic leukemia xenografts. J Pharmacol Exp Ther. 2008;324:434–442. doi: 10.1124/jpet.107.128926. [DOI] [PubMed] [Google Scholar]
- 31.Korolchuk VI, Mansilla A, Menzies FM, Rubinsztein DC. Autophagy inhibition compromises degradation of ubiquitin-proteasome pathway substrates. Mol Cell. 2009;33:517–527. doi: 10.1016/j.molcel.2009.01.021. [DOI] [PMC free article] [PubMed] [Google Scholar]
Associated Data
This section collects any data citations, data availability statements, or supplementary materials included in this article.
Supplementary Materials
1
2
3
4
5
6
7
8
9
