Antemortem MRI based Structural Abnormality Index (STAND)-Scores Correlate with Postmortem Braak Neurofibrillary Tangle Stage (original) (raw)
. Author manuscript; available in PMC: 2011 May 18.
Abstract
The clinical diagnosis of Alzheimer Disease (AD) does not exactly match the pathological findings at autopsy in every subject. Therefore, in-vivo imaging measures, such as Magnetic Resonance Imaging (MRI) that measure anatomical variations in each brain due to atrophy, would be clinically useful independent supplementary measures of pathology. We have developed an algorithm that extracts atrophy information from individual patient’s 3D MRI scans and assigns a STructural Abnormality iNDex (STAND)-score to the scan based on the degree of atrophy in comparison to patterns extracted from a large library of clinically well characterized AD and CN (cognitively normal) subject’s MRI scans. STAND-scores can be adjusted for demographics to give adjusted-STAND (aSTAND)-scores which are typically > 0 for subjects with abnormal brains. Since histopathological findings are considered to represent the “ground truth”, our objective was to assess the sensitivity of aSTAND-scores to pathological AD staging. This was done by comparing antemortem MRI based aSTAND-scores with post mortem grading of disease severity in 101 subjects who had both antemortem MRI and postmortem Braak neurofibrillary tangle (NFT) staging. We found a rank correlation of 0.62 (p<0.0001) between Braak NFT stage and aSTAND-scores. The results show that optimally extracted information from MRI scans such as STAND-scores accurately capture disease severity and can be used as an independent approximate surrogate marker for in-vivo pathological staging as well as for early identification of AD in individual subjects.
Keywords: Alzheimer Disease, neurofibrillary tangles, amnestic mild cognitive impairment, Braak NFT stage, magnetic resonance imaging
INTRODUCTION
The diagnosis of possible or probable Alzheimer disease (AD) is made according to clinical criteria (McKhann et al., 1984), however a definitive diagnosis can only be made at autopsy (NIA-Reagan, 1997). The pathological hallmarks of the disease are the presence of neurofibrillary tangles (NFT) and amyloid plaques. The topographic distribution of NFT follows a fairly stereotypical pattern of progression while this is not the case for amyloid plaques. Therefore a staging system for NFT was formulated by Braak and Braak (Braak and Braak, 1991) which takes into account the stereotypical disease progression of NFT in AD and has been widely accepted for pathological AD staging. However, in most clinicopathological series poor correlation is seen between antemortem clinical assessment of cognition and post mortem examination in a segment of subjects. Specifically, approximately 30% of cognitively normal subjects will meet pathological criteria for AD at postmortem (Crystal et al., 1993; Hulette et al., 1998; Jicha et al., 2006; Katzman et al., 1988; Knopman et al., 2003; Morris and Price, 2001; Nagy et al., 1999; Riley et al., 2002; Schmitt et al., 2000). Given that the clinical assessment is unlikely to exactly match findings at autopsy in every subject, in-vivo imaging measures, such as magnetic resonance imaging (MRI) that reflects disease stage would be useful. The value added to clinical assessment by MRI would be that it is an independent measure of neuronal loss and thus provides a supplementary measure only based on anatomy in contrast to clinical diagnosis which is done on the basis of clinical examination and neuropsychological tests which do not take anatomy into consideration.
It has been well established that structural MRI can be an approximate surrogate marker of disease stage in AD (Kantarci and Jack, 2003; Killiany et al., 2000). However, most MRI-pathologic correlation studies to date have been done using hippocampal volume measures or other non voxel-wise imaging methods. These studies have shown that severity of hippocampal atrophy correlates well with Braak NFT stage (Gosche et al., 2002; Jack et al., 2002) and with neurofibrillary tangle density (Csernansky et al., 2004; Silbert et al., 2003). Excellent correlation is found between hippocampal volume measures obtained on either antemortem MRI (Zarow et al., 2005) or postmortem MRI (Bobinski et al., 2000) and hippocampal neuron cell counts in autopsy specimens. Voxel-wise studies of gray matter loss (which have not included pathological correlation) in both AD and amnestic mild cognitive impairment (aMCI) demonstrate that the topographic distribution of gray matter loss closely mirrors the expected spatial distribution of neurofibrillary pathology described by Braak.(Baron et al., 2001; Braak and Braak, 1991; Chetelat et al., 2002; Frisoni et al., 2002; Rombouts et al., 2000; Whitwell et al., 2007). It has also been shown that both MRI measures of atrophy and cognitive impairment correlate better with Braak NFT stage and NFT burden than with amyloid burden (Gomez-Isla et al., 1997; Josephs et al., 2007 Epub). So, while MRI is not a direct measure of neuronal pathology, ample evidence supports the position that it is a fairly proximate surrogate of NFT stage and neuron loss, and it could therefore be a valuable approximate in-vivo surrogate marker of pathological stage.
Given the large amount of data present in a three dimensional (3D) MRI scan, it is a tedious, time consuming task to sort through each data set and accurately assess the degree and the pattern of atrophy in each patient’s scan as well assess the pattern of disease evolution over multiple scans of the same individual. As an alternative, measures to condense information from the 3D scans have been proposed. The most widely used summary measures are 1) ROI-based techniques: for example tracing and quantifying the volume of medial temporal lobe structures e.g. the hippocampus or entorhinal cortex, since AD related atrophy occurs the earliest as well as most severely in these regions (Fox et al., 1996; Jack et al., 1992), and 2) Global atrophy measures: estimating the percentage change in brain volume between two scans since global tissue loss is a hallmark of neurodegenerative diseases (Freeborough and Fox, 1997; Schott et al., 2005). However, these image analysis techniques might not optimally extract all the disease pathology specific information. ROI based techniques are spatially limited and do not make use of all the available information in a 3D image data set. Whereas the global atrophy measures do not compute the voxel wise topographic pattern of localized tissue density loss and thus may have lower information content than if the atrophy is quantified at a voxel level. A third group of techniques most widely used are voxel-based analytic techniques (Ashburner and Friston, 2000) which are very useful in providing group-wise comparisons. However the statistical testing portion of VBM is designed to test for group-wise differences or trends in data, not diagnosis in individual subjects.
To overcome these limitations, the method of STructural Abnormality iNDex (STAND)-scores was developed to extract optimal information from each scan and condense this information into a single number as a measure of structural abnormality in the MRI scan. STAND-score is computed for each new incoming scan (i.e. test scan) based on the degree and the pattern of atrophy in comparison to the scans of a large database of well characterized AD and cognitively normal (CN) subjects (STAND database). The STAND score method reduces all information in a 3D structural MRI to a single value which in turn can be used for diagnosis in individual subjects. Thus a single MRI scan can be used for the diagnosis of new individual incoming patients. The details for computation of STAND-score and (age and gender adjusted) aSTAND-scores are presented in the methods section and can be found in detail in our original publication (Vemuri et al., 2008).
In this study we exploit the fact that Braak staging (Braak and Braak, 1991) is generally accepted as “ground truth” for staging AD disease severity. The main aims of this study were 1) to validate aSTAND-scores calculated from antemortem MRI with post mortem pathological staging and assess the sensitivity of aSTAND-scores to pathological disease staging and 2) compare aSTAND-score classifications to the antemortem clinical diagnosis. For completeness we also investigated how aSTAND-scores compare with MRI-based hippocampal volume measures which have been found to be fairly sensitive markers of AD disease pathology (Gosche et al., 2002; Jack et al., 2002) and are widely used in the field.
It is important to note that clinically characterized AD and CN cases were used to train the algorithm which in turn was used to assign STAND-scores to pathologically confirmed cases. While this permitted us to assess performance of the algorithm relative to the pathological gold standard, this approach might appear to suffer from inverted logic – i.e. one might assume that the algorithm would be trained using pathologically confirmed cases and tested on clinically diagnosed cases. We took this approach because a large library of scans is needed for algorithm training; and, a library of ante mortem scans from subjects who subsequently underwent autopsy that is sufficiently large to appropriately train the algorithm is not available at the present time.
METHODS
Subjects
All subjects had been prospectively recruited into the Mayo Clinic Alzheimer’s Disease Research Center (ADRC), or the Alzheimer’s disease Patient Registry (ADPR), and were identified from the ADRC/ADPR database. These longitudinal studies include independent nursing, neurological, and psychometric evaluations. Each participant’s information is reviewed by a panel of neurologists, neuropsychologists, and research nurses to assign a consensus clinical diagnosis. Cognitive status was assessed using Mini-Mental Status Examination (MMSE) (Folstein et al., 1975), and the Clinical Dementia Rating sum of boxes (CDR-SB) (Hughes et al., 1982). The diagnosis of dementia was made based on the Diagnostic and Statistical Manual of Mental Disorders, Fourth Edition (American Psychiatric Association, 1994). The diagnosis of AD was also made according to established criteria (McKhann et al., 1984). Clinical diagnosis of amnestic Mild Cognitive Impairment (aMCI) was made according to the criteria of Petersen et al. (Petersen, 2004; Petersen et al., 1999). Informed consent was obtained for participation in the studies, which were approved by the Mayo Institutional Review Board. Apolipoprotein E (APOE) genotyping was also performed in all subjects.
Throughout this paper we refer to two sets of patients a) STAND database: A previously established database of 160 clinically well characterized AD and CN patients each (320 total cases) with MRI scans that were used to train the algorithm to identify AD specific atrophy patterns in comparison with CN. These subjects did not have autopsy evaluation. b) Test Cases: One hundred and one subjects with antemortem scans as well as neuropathological staging. The test cases were not included in the STAND database.
a) STAND Database
One hundred sixty subjects that fulfilled clinical criteria for probable AD (McKhann et al., 1984) were age and gender matched to 160 CN subjects. The clinical diagnosis of AD and CN was established at the time of the MRI scan. Potential subjects for this study that fulfilled clinical criteria for AD were excluded if they had hemispheric cerebral infarctions on MRI or any secondary clinical features suggesting contributions from non-AD dementias. The criteria for normal subjects were: no active neurological or psychiatric conditions; no cognitive complaints; normal neurological exam; no psychoactive medications; if a prior neurological or psychiatric condition was present, they must have returned to normal. The characteristics of all the subjects in STAND database are shown in Table 1.
Table 1.
Subject demographics of the STAND database used for algorithm training
| AD (n=160) | CN (n=160) | |
|---|---|---|
| No. of females (%) | 67 (42) | 72 (45) |
| Median (range) age, yrs. | 77 (55, 98) | 77 (48,92) |
| APOE ε4 carriers (%) | 96 (60) | 41 (26) |
| Median (range) MMSE (/30) | 22 (3–30) | 29 (23–30) |
| Median (range) CDR-SB (/18) | 5.5 (0.5–18) | 0 (0–0.5) |
b) Subjects with post mortem Neuropathological Diagnosis
We identified 101 patients with final neuropathological diagnoses covering the AD spectrum from low to high probability of AD according to the National Institute on Aging and Reagan Institute Working Group on Diagnostic Criteria for the Neuropathological Assessment of Alzheimer’s disease (NIA-Reagan) (Hyman and Trojanowski, 1997) from the ADRC and ADPR cohorts who had a MRI evaluation. For subjects with Braak NFT stages II–VI the time difference between the scan date and death was not more than 48 months. Subjects with Braak NFT stages 0 and I were binned together and any time between scan and death was allowed. A lenient time from scan to death was used for subjects staged Braak 0–I in order to accrue more subjects at the lowest stages, with the rationale that pathological stage at the time of the scan could not be more advanced than the stage at the time of autopsy. However, the closest scan to death was always used for subjects in whom multiple antemortem scans were available. The clinical diagnosis at the time of the scan categorized according to the Braak NFT stage is presented in Table 2. Subjects were excluded if they had pathological evidence of hippocampal sclerosis vascular dementia, or a non-AD neurodegenerative disorder except presence of Lewy bodies if they were secondary to a pathological diagnosis of AD. Subjects with pure Lewy Body disease were excluded. Subjects were also not excluded due to the presence of argyrophilic grains which are considered a feature of typical aging (Josephs et al., 2006). The clinical histories of all cases were reviewed and subjects with a clinical diagnosis of a non-AD dementia or who had treatments or concurrent illnesses interfering with cognitive function or brain function were not included in this study.
Table 2.
Subject demographics for all autopsy subjects by Braak NFT stage.
| Braak NFT Stage | |||||||
|---|---|---|---|---|---|---|---|
| 0–I (n=7) | II (n=9) | III (n=16) | IV (n=11) | V (n=31) | VI (n=27) | P-value | |
| Median (range) age at scan, y | 86 (53, 95) | 78 (72, 90) | 86 (72, 100) | 87 (81, 93) | 85 (59, 98) | 81 (49, 93) | 0.03 |
| Median (range) age at death, y | 91 (57, 101) | 81 (74, 94) | 89 (74, 103) | 88 (82, 94) | 86 (60, 100) | 83 (51, 94) | 0.028 |
| No. females (%) | 6 (86) | 6 (67) | 11 (69) | 4 (36) | 17 (55) | 18 (67) | 0.34 |
| Median, (range) education, y | 16 (12, 16) | 15 (12, 20) | 12 (8, 20) | 16 (7, 18) | 15 (8, 20) | 15 (8, 18) | 0.75 |
| APOE ε4 carriers (%) | 2 (29) | 2 (22) | 5 (31) | 6 (55) | 16 (53) | 17 (68) | 0.086 |
| Hippocampal W-score | −0.4 (−1.8, 1.2) | 0.2 (−1.2, 0.8) | 0.1 (−2.6, 3.1) | −1.1 (−2.6, 1.9) | −1.7 (−2.8, 3.1) | −1.7 (−2.8, 0.4) | 0.002 |
| Median (range) MMSE | 30 (27, 30) | 29 (26, 30) | 27 (18, 30) | 27 (23, 30) | 22 (12, 29) | 14 (7, 29) | <0.001 |
| *Median (range) CDR – SB | 0.0 (0.0, 0.0) | 0.0 (0.0, 3.0) | 0.0 (0.0, 8.0) | 1.0 (0.0, 17.0) | 7.0 (0.0, 18.0) | 10.0 (1.5, 18.0) | <0.001 |
| *Median (range) time to death from scan, y | 5.2 (3.7, 10.5) | 2.4 (1.2, 4.1) | 2.0 (0.1, 4.0) | 1.6 (0.7, 3.9) | 1.8 (0.2, 4.0) | 2.3 (0.6, 3.9) | <0.001 |
The characteristics of the identified patients are presented in Table 2. Kruskal-Wallis tests were used to compare groups on age, years of education, MMSE, CDR-SB and time from scan to death. Fisher’s exact test was used to compare groups on gender and the proportion of apolipoprotein epsilon 4 (APOE ε 4) carriers. We report medians and use nonparametric methods due to skewness in the numeric clinical variables.
Neuropathological Staging
The brain of each of the 101 subjects was processed according to the protocol of the Mayo Clinic ADRC Neuropathology Core. Afterexternal examination of the fresh specimen, the brain was dividedby a sagittal cut into the right and left hemi-brains. One hemisphere(usually the left) was fixed for 7 to 10days in 10% to 15% buffered formalin and was coronally sectioned into 1-cm slabs and photographed. Sampling was done according to the Consortium to Establish a Registry of AD (CERAD) protocol (Mirra et al., 1991). Pathological diagnoses were made by one or both of neuropathologists (JEP or DWD) who were blinded to the clinical and imaging data.
A Braak NFT stage (Braak and Braak, 1991) was assigned with each stage operationally defined as follows: Stage I - NFT confined to the transentorhinal cortex (layer IV); Stage II -NFT in entorhinal cortex (layer II); Stage III - NFT in hippocampus (CA1 and subiculum); Stage IV - NFT in temporal lobe association neocortex (mild); Stage V - NFT in temporal, frontal or parietal association neocortex (moderate to severe); Stage VI – NFT in primary visual cortex. Braak staging was determined by any evidence of NFT in a given area, indicating the earliest and the most minimal involvement. In each case a neuritic plaque score was also assigned based upon the most affected region according to the CERAD protocol (Mirra et al., 1991) Neuritic plaques (NP) were identified by the presenceof dystrophic neurites, arranged radially to form a discretespherical lesion averaging approximately 30 μm in diameter. To insure uniformity in estimates between evaluators, the following guidelines wereapplied: sparse NPs − 1 to 5 NPs/100× field; moderate NPs − 6 to 19 NPs/100× field; and frequent NPs − 20 or more NPs/100× field. The pathologic diagnosis of AD was made according to the National Institute on Aging and Reagan Institute Working Group (NIA-Reagan) criteria (Hyman and Trojanowski, 1997). Based upon the topographic distribution of NFT (Braak NFT stage) and the density of neuritic plaques (CERAD neuritic plaque score) the case was assigned low, intermediate or high probability of AD. The patient characteristics are categorized according to their Braak NFT staging in Table 2.
MRI Acquisitions
All MRI studies were performed on 1.5 Tesla GE-SIGNA MRI scanners (GE Medical Systems, Waukesha, WI) using a standard transmit-receive volume head coil over a period of 11 years (1995–2006). All scanners undergo a standardized quality control calibration procedure every morning which monitors geometric fidelity over a 200 mm volume along all 3 cardinal axes, signal to noise ratio, and transmit gain. Subject images were obtained using a standardized imaging protocol that included a coronal T1-weighted 3-dimensional volumetric spoiled gradient echo (SPGR) sequence with the following scan parameters: FOV= 24 × 18.5 or 22 × 16.5 cm, in-plane matrix=256×192, 1.6 mm partition thickness and 124 contiguous partitions, flip angle=25°, TR=23 sec, TE=6–10 ms, bandwidth=±16 kHz.
STAND-scores
The detailed description of STAND-score estimation using support vector machines (SVMs) can be found in (Vemuri et al., 2008). The main steps for processing each new incoming scan (i.e. test scan) for the computation of STAND-score are as follows:
- SPM5 was used for tissue segmentation and normalization (http://www.fil.ion.ucl.ac.uk/spm) of each test scan (Ashburner and Friston, 2005). In order to reduce any potential normalization and segmentation bias across the disease groups, customized tissue probability maps created for the original STAND publication were used and all test scans are registered to this template. The gray matter (GM), white matter (WM) and CSF density probabilities of each test scan were smoothed, modulated and down-sampled to an isotropic voxel size of 8 mm by simple averaging. The GM, WM and CSF densities in voxel sizes of 8×8×8 mm3 were used as features for the development of STAND-scores.
- 3D weight maps of pattern and severity of atrophy were created using all the 320 scans in the training STAND database (Fig. 1). These maps indicate the importance of each voxel of a particular tissue type for classification of AD from CN; depending upon how much that voxel is affected by the disease. Training (i.e. voxel selection) was based only on the MRI findings of the 320 cases not on prior knowledge about pathology. A subset of voxels was selected such that accuracy is maximized in differentiating AD and CN. The weights obtained from the trained SVM classifier (for these selected voxels) are applied to the test cases to give a measure of normality or abnormality in the brain structures (typically ≥ +1 for the most abnormal and ≤ −1 for the most normal brain), which is labeled as the STAND-score. For each test scan, the STAND-score is a single value that represents the severity of tissue density loss on a voxel-wise basis throughout the 3D MRI scan in comparison to the pattern extracted from the library of scans.
Fig. 1.
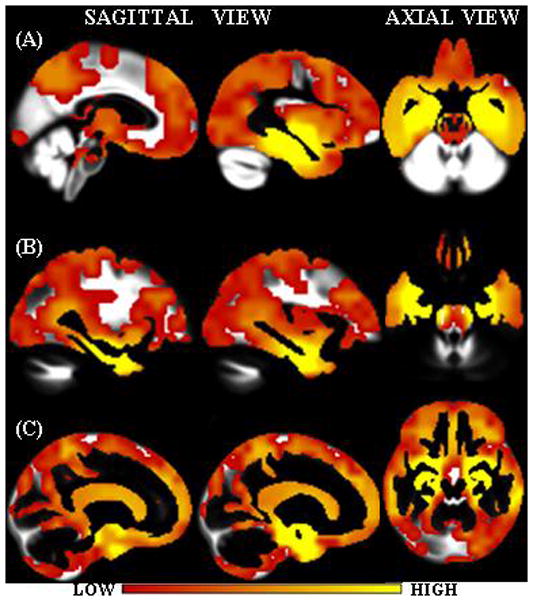
Interpolated weight vectors for (A) GM, (B) WM and (C) CSF overlaid on the corresponding custom template. Color scale indicates the weight i.e. the importance of the voxel location for classification.
Note that the anatomic patterns automatically extracted as important for classification (Fig. 1) from the MRI scans are consistent with known distribution of AD pathology. For example, hippocampus and entorhinal cortex were found to be very important in all the tissue density maps because these areas are affected most severely in AD. Neurofibrillary pathology begins in, and is ultimately most severe in the medial temporal lobe, particularly the entorhinal cortex and hippocampus (Braak and Braak, 1991). From there it spreads to the basal temporal lobe and paralimbic cortical areas such as the posterior cingulate gyrus and precuneus and finally to the association neocortices. Basal forebrain and the dorsal ponto-mesencephalic areas are also involved. The loss of GM and WM in the medial temporal lobe causes a corresponding increase of CSF in the same regions. In Fig. 1, the GM weight vector regions intersect parts of WM and CSF regions and CSF vectors intersect parts of GM and WM density regions. This is due to the fact that smoothing of the individual GM, WM and CSF densities was done as well as large voxel sizes of 8×8×8 mm3 densities were constructed. These two steps were crucial in order to reduce errors that might arise due to registration and segmentation.
As explained above only those voxels that maximize accuracy in differentiating AD and CN are used for estimating the STAND-score. A total of 276 voxels (135 GM, 53 WM and 88 CSF) were selected in training the algorithm and these voxels separated AD and CN with a fourfold cross-validation accuracy of 87.2 % (sensitivity of 86.1 % and specificity of 88.3%). The entire coronal extent of the voxels is shown in Fig. 2 (coronal (y) extent of the voxels in MNI coordinates was from slices −46 to 9).
Fig. 2.
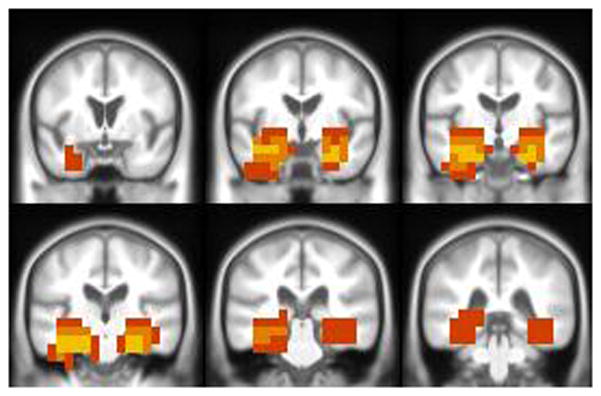
Anatomic patterns with maximum discriminative power between AD and controls are overlaid on the corresponding custom T1 template. Color scale used to indicate the frequency of occurrence of the voxel in multiple tissue maps. Yellow: voxel location used in all three tissues (GM, WM and CSF); orange: voxel location used in at least two tissues and red: voxel location used in one tissue only.
Most of these voxels were in the medial temporal lobe which had most of the highest weight vectors. An added advantage of using these voxels for staging of the vivo pathology is that the voxels in the medial temporal lobe provide better grading of NFTs in the lower Braak NFT stages. It should be noted that although Braak NFT staging reflects progressive presence (not density) of plaques in select areas that define the topographic pathway of NFT spread, NFT burden in the temporal lobe (i.e. the STAND search space (Fig. 2)) does increase as Braak stage increases (Braak and Braak, 1991) – even though NFT density in the temporal lobe is not what Braak stage measures directly.
Demographic information has an effect on the STAND-scores since brain volume varies with both age and gender (Jack et al., 1997; Lemaitre et al., 2005; Shiino et al., 2006; Smith et al., 2006). In addition, old age is the strongest known risk factor for typical late onset AD (Evans et al., 1989). Therefore, these scores can be additionally adjusted for subject’s demographic information e.g. age and gender to give adjusted-STAND (aSTAND)-score (Vemuri et al., 2008). When adjusted for age and gender, aSTAND-scores have a slightly better accuracy of 89% (sensitivity of 88% and specificity of 90%). The antemortem MRI scan of each of the 101 subjects with postmortem evaluation was assigned a STAND-score and aSTAND-score independently by comparing the atrophy in the regions selected by the algorithm.
Hippocampus W-scores
To investigate the association between hippocampal measures and aSTAND-scores we measured hippocampal volumes for all the patients. All image processing steps required for the estimation of hippocampal volumes (for every subject) were performed by one of the authors (M.M.S.), who was blinded to all clinical and pathologic information. Volume measurements of the hippocampi were derived from the same T1-weighted SPGR scan described in the MRI acquisitions section using methods that have been described previously (Jack et al., 1992; Jack et al., 1989). The intrarater test–retest reproducibility of this method has been verified with a coefficient of variation of 0.28% (Jack et al., 1998). Measurements of intracranial volume were derived from a T1-weighted sagittal sequence with 5-mm contiguous sections. Intracranial volume was determined by tracing the margins of the inner table of the skull on contiguous images from the sagittal sequence (Jack et al., 1989). Raw hippocampal volumes were adjusted for age, gender, and total intracranial volume using a W score method (Jack et al., 1997). Hippocampal W scores can be considered age, gender, and head size adjusted Z scores with 0 mean and SD 1 among normal elderly subjects. Negative W scores therefore indicate atrophy while values greater than 0 indicate adjusted volumes above the expected mean for cognitively normal elderly.
RESULTS
STAND-scores, aSTAND-scores and Braak NFT Stage
The rank correlation of STAND-scores and aSTAND-score with Braak NFT stage was found to be 0.58 and 0.62 respectively (p<0.0001). From this point onwards we discuss aSTAND-scores since demographics adjusted scores compensate for age related changes other than AD pathology that are associated with atrophy, for example cerebrovascular disease and also correlate slightly better with Braak. The aSTAND-scores for the 101 antemortem scans are plotted as a function of the Braak NFT stage in Fig. 3. On an average, the aSTAND-scores increase with Braak NFT stage. The mean and standard deviation of the aSTAND-score for each Braak NFT stage are presented at the bottom of Table 3. All the associations in this paper are computed using Spearman rank correlations.
Fig. 3.
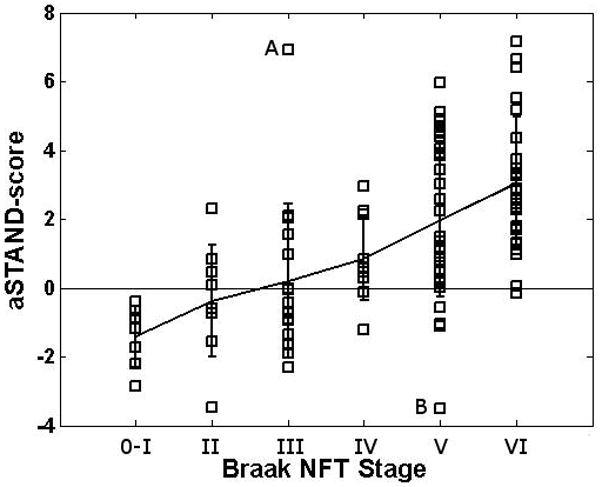
aSTAND-score categorized according to pathological Braak NFT stage. Subjects A and B are outlier cases with aSTAND score – Braak stage discordance discussed in the paper.
Table 3.
Mean and standard deviation of aSTAND-score of all autopsy subjects by Braak NFT stage.
| Braak NFT Stage | ||||||
|---|---|---|---|---|---|---|
| 0–I | II | III | IV | V | VI | |
| Mean (std) of aSTAND-score | −1.4 (0.88) | −0.38 (1. 61) | 0.2 (2.24) | 0.84 (1.19) | 1.99 (2.26) | 3.04 (1.93) |
aSTAND-scores and Clinical Diagnosis
The 101 pathologically confirmed subjects were divided based on the aSTAND-score into those with patterns of atrophy consistent with AD i.e. abnormal (aSTAND-score >0) and those with patterns of atrophy consistent with CN (aSTAND-score≤0). This diagnostic classification was then compared to the clinical diagnoses given at the time of MRI for each subject (Table 4 and Fig. 4). The aSTAND-score was used since age related atrophy should be differentiated from AD pathology and also age adjustment provides slightly better classification accuracy in comparison with no adjustment (Vemuri et al., 2008). Using aSTAND-score>0 as abnormal, we compared clinical diagnosis vs aSTAND-score based classification. This comparison is complicated by the fact that aSTAND-score provides a binary classification while clinical classification groups subjects into one of 3 possible categories, i.e. CN, aMCI, or AD. It has been suggested that subjects who are clinically normal typically have Braak 0–II, subjects who are aMCI on average have Braak NFT stages III–IV, and subjects who are clinically AD on average have Braak NFT stages V or VI (Bennett et al., 2006; Jicha et al., 2006). Exceptions to these general guidelines commonly occur.
Table 4.
Clinical diagnosis at the time of MRI scan and aSTAND-score based classification for all autopsy subjects by Braak NFT stage.
| Braak NFT Stage | ||||||
|---|---|---|---|---|---|---|
| 0–I (n=7) | II (n=9) | III (n=16) | IV (n=11) | V (n=31) | VI (n=27) | |
| Clinical Diagnosis at MRI | ||||||
| Normal | 7 (100%) | 8 (89%) | 9 (56%) | 5 (45%) | 4 (13%) | 0 |
| aMCI | 0 | 1 (11%) | 4 (25%) | 2 (18%) | 5 (16%) | 1 (4%) |
| AD | 0 | 0 | 3 (19%) | 4 (36%) | 22 (71%) | 26 (96%) |
| Diagnosis using MRI scan based aSTAND-score (aSTAND-score ≥ 0 for AD; <0 for CN) | ||||||
| Normal | 7 (100%) | 5 (56%) | 11 (69%) | 2 (18%) | 4 (13%) | 1(4%) |
| AD | 0 | 4 (44%) | 5 (31%) | 9 (82%) | 27 (87%) | 26 (96%) |
Fig. 4.
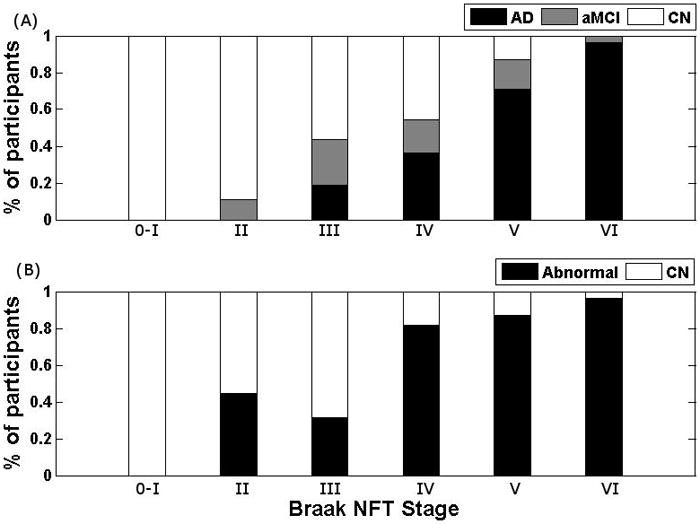
The percentage of subjects in each Braak stage classified based on (A) clinical diagnosis and (B) diagnosis using aSTAND-score at the time of the MRI scan.
Table 4 and Fig. 4 show that all subjects with Braak NFT stage 0–I were classified as normal using both the aSTAND-score and clinical diagnosis. All of the subjects with Braak NFT stage II were also clinically normal, although the aSTAND-score showed that 4 subjects (44%) had a pattern of atrophy consistent with AD. Of the 4 subjects with Braak NFT stage V or VI and a clinical diagnosis of normal the aSTAND-score classified 2/4 (50%) as abnormal which would fit better with the pathological stage. Similarly, 5/6 (83%) of the subjects with Braak NFT stage V–VI and a clinical diagnosis of aMCI were classified as abnormal by the aSTAND-scores. Nearly all subjects, 46/48 (96%), with Braak NFT stage V and VI and a clinical diagnosis of AD were also classified as abnormal using aSTAND-score.
We define outliers as subjects whose aSTAND-scores fall roughly outside two-standard deviations from the mean of each Braak group. There were two outliers in this analysis (labeled A and B on Fig. 3) that are discussed here. Subject A was an 81 yr. old male AD patient with MMSE=19, CDR-SB=8.0 and Braak NFT stage III who was classified as abnormal by the aSTAND score. Since this patient was demented before death and has a very high aSTAND-score one may have expected him to have a higher Braak NFT stage. Note that Braak NFT stage is defined by the presence of NFT in the standardized staging tissue blocks, not severity, and discrepancies between NFT stage and severity do occur. The result in outlier A may reflect a high NFT burden and associated neuronal loss in the medial temporal lobe, without progression of NFT to association neocortex and hence a Braak NFT stage no higher than III and only a possible CERAD diagnosis. Conversely, Subject B was a 98 yr. old CN female with MMSE=25, CDR-SB=0.0 and Braak NFT stage V who was classified as normal by aSTAND score and was also clinically normal despite a Braak NFT stage of V and a definite CERAD diagnosis. Cases with a high Braak NFT stage yet no clinical abnormalities are found in nearly all autopsy series (Mesulam, 2000) and it is unclear why this discrepancy exists.
There were four subjects with Braak NFT stage II and aSTAND-score >0. Out of the four subjects two clinically converted to MCI before death. A third subject had large ventricles and CDR=0.5 which is the possible explanation for the positive STAND-score. The fourth patient was a 75 yr. old female with who was an APOE ε4 carrier, which is a known risk factor for AD.
aSTAND-scores and Hippocampal W-scores
The scatter plot showing the relationship between aSTAND-scores and hippocampal W-scores for all the subjects is shown in Fig. 5. Symbols are used to indicate the low (0–II), intermediate (III–IV) and high (V–VI) Braak NFT stages. The rank correlation of Hippocampal W-scores with Braak NFT stage was −0.4 (p=0.0001).
Fig. 5.
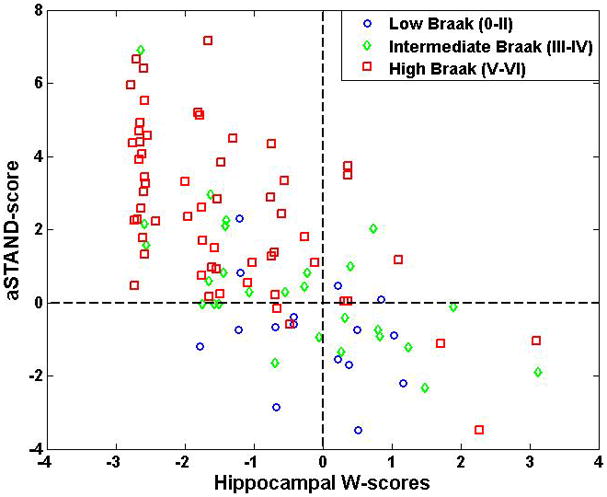
Scatter plot showing relationship between aSTAND-score and hippocampal W score. For convenience, reference lines at a W score of zero and aSTAND-score of 0 have been added to the plot.
Correlation with Clinical Scores (MMSE and CDR-SB)
Correlation of Braak NFT stage with MMSE and CDR-SB was −0.69 and 0.67 respectively and correlation of aSTAND-scores with MMSE and CDR-SB was −0.71 and 0.76 respectively. All correlations were highly significant with p<0.0001
aSTAND-scores, CERAD Neuritic Plaque Counts and NIA-Reagan Criteria
Correlation of aSTAND-score with CERAD Neuritic Plaque scores and NIA-Reagan criteria was found to be 0.52 and 0.54 respectively (p<0.0001). Out of the 52 patients with NIA-Reagan high probability of AD, 46 were correctly classified as abnormal with aSTAND-score.
DISCUSSION
There have been numerous studies in the literature showing that clinical diagnosis based on established criteria does not predict AD pathology with 100% accuracy i.e. all clinically diagnosed AD patients will not have AD pathology, and up to 30% of cognitively normal subjects will have AD pathology at autopsy (Crystal et al., 1993; Hulette et al., 1998; Jicha et al., 2006; Katzman et al., 1988; Knopman et al., 2003; Morris and Price, 2001; Riley et al., 2002; Schmitt et al., 2000). For this reason, it would be useful to have additional non-invasive measures to complement the clinical assessment. Since degenerative histological changes occur long before the disease is clinically detectable (Gomez-Isla et al., 1996), perhaps decades, MRI based measures would be useful for in-vivo staging of the disease. Indeed, this study has shown that aSTAND-score, a measure of the degree and pattern of atrophy on a scan, correlates strongly with Braak pathological stage and may provide useful information to aid in inferring pathologic stage in vivo that is independent of clinical or psychometric evaluations.
Given the amount of structural information present in an MRI scan, the measure used for diagnosis should optimally extract disease specific information from the entire scan. A STAND-score is assigned to each scan based on the degree and pattern of atrophy relative to a large database of AD and CN (STAND database). The advantage of this technique is that it examines all voxels simultaneously and selects those that are important for classification from the STAND database. Our results show that the STAND-score method approximately captures disease severity when compared against the ground truth of pathologic staging. In subjects with low and high Braak NFT stages where we can be fairly certain about what the expectations should be for aSTAND-score performance, we found excellent aSTAND-score pathological correlation. In the outliers we suspect that Braak score, while an accurate index of stage, may not have provided a complete representation of actual NFT burden and associated neuronal loss. The variability of the aSTAND-scores within each Braak NFT stage can be attributed to this same principle. Braak staging is done on the basis of the earliest appearance of any neurofibrillary pathology in selected regions and is not a measure of NFT burden either globally or regionally. In addition NFTs, although closely associated, are not a direct measure of neuronal loss. Conversely, the aSTAND-score takes into account both severity as well as topographic distribution of neuronal loss as the basis of gray and white matter atrophy and the associated expansion of CSF spaces.
As discussed below we do not propose that STAND scores be used as a substitute for clinical diagnosis, but rather as an independent complimentary source of information about staging. We do see in this study some specific instances in which the aSTAND-scores could help the clinical diagnosis in terms of predicting underlying pathology. In some cases at the pathological extremes (i.e. low and high Braak) where clinical-pathological discordance existed, the match between Braak NFT stage and STAND-score seemed to be better than the match between Braak NFT stage and clinical diagnosis. For example, 4 subjects with a Braak NFT stage of V or VI had a clinical diagnosis of normal yet the STAND-score classified 50% of these subjects as abnormal which fits better with the fact that these subjects have advanced stage NFT pathology. In addition, the STAND-score classified 4 of the subjects with Braak NFT stage II as abnormal of whom 2 had CDR-SB>0.0 and had a clinical diagnosis of MCI at the time of death indicating that they might have been on the path to AD. This is consistent with the fact that NFT pathology is observed in the medial temporal lobe at this Braak NFT stage (Braak and Braak, 1991) and therefore one may also expect cortical atrophy in these regions. There is also evidence indicating that cortical atrophy precedes cognitive symptoms (Fox et al., 1996). These results therefore suggest that aSTAND-score could be a very useful surrogate marker for early identification of the disease.
Braak NFT stage correlated better with aSTAND-score than with hippocampal W-scores. This can be attributed to the fact that W-scores take into account only the hippocampal volume whereas aSTAND-scores are assigned by taking into account a larger region of brain selected based on the overall disease related atrophy differences between a large group of AD and CN.
It is important to note that STAND-scores do not consider the amyloid plaque aspect of AD pathology. In other words, the amyloid plaque burden and its contribution to the clinical syndrome of AD or the pathological diagnosis of AD are not being assessed. However, we found a good correlation of aSTAND-scores with neuritic plaque counts even though aSTAND-scores are based on NFT. This is due to the fact that both neuritic plaques and NFTs are the basis of cognitive decline and there exists an indirect relationship between neuritic plaques and aSTAND-scores. The present pathological standard for AD (NIA-Reagan) takes neuritic amyloid plaques in addition to NFTs into consideration for the pathological diagnosis and the clinical syndrome of AD is also related (although less closely than NFT) to neuritic amyloid plaques. This may account for some of the disagreements between clinical diagnosis vs. Braak NFT stage and STAND scores. At the present time, we also do not take into account the effect of ischemic vascular disease on brain morphometry. Inclusion of the imaging manifestations of cerebrovascular disease would result in STAND-scores that encompass a more comprehensive picture of brain pathology related to cognitive impairment.
Limitations of the Study
- The time difference between the MRI scan and death will contribute to some bias when Braak NFT stage is correlated with the antemortem STAND-score. In order to reduce the time difference as well as maintain a reasonable sample size, the time difference between the last MRI scans before death and time to death was set to a maximum of four years for Braak NFT stages II–VI. If we had required a shorter interval from the MRI scan to death, then the number of subjects available for the study would have dropped considerably. Given the fact that AD pathology takes several years, probably decades, to develop; we think it is a reasonable approximation to allow subjects with an antemortem MRI scan within four years of death. Any time from MRI scan to death was allowed for Braak NFT stages 0–I since these subjects can only have been at Braak NFT stages 0 or I at the time of the scan.
- Clinically diagnosed AD and CN subjects were used to construct the STAND-database. This issue is however unavoidable; because a large database of labeled AD and CN scans is required in order to train the algorithm (here we used 320 scans for training). Ideally training would be done using pathologically confirmed AD and CN cases. In the absence of such a large cohort with pathological diagnosis, the next best option is to construct a training database with clinically diagnosed AD and CN subjects that have been carefully characterized. If there were some cases that are incorrectly labeled in the STAND database, we assume that the effect is minimized by the large sample size. The regions obtained through the voxel feature selection process accurately mirror the known anatomic distribution of neuronal pathology in AD (Braak and Braak, 1994). This serves as an additional qualitative validation of the algorithm – i.e. STAND-scores are assigned using patterns of atrophy that are biologically sensible and related to AD neuropathology.
- At present the proposed method is designed for assessing disease severity only in AD. In the future we anticipate extending the STAND-score technique to other non-AD dementias such as Dementia of Lewy Bodies (DLB) and Frontotemporal Dementia (FTD).
Advantages in using MRI for in-vivo pathological staging
Structural MRI measures GM atrophy which is related to the loss of neurons, synapses, and dendritic de-arborization that occurs on a microscopic level in neurodegenerative diseases (Bobinski et al., 2000; Zarow et al., 2005); WM atrophy which is related to loss of structural integrity of WM tracts presumably resulting from the dying back of axonal processes (Rose et al., 2000; Stoub et al., 2005); and ex-vacuo expansion of CSF spaces. Since there is a significant negative correlation between NFT density and neuronal counts (Busch et al., 1997; Gomez-Isla et al., 1997); MRI indirectly reflects NFT density. It has been shown that neuronal loss correlates with but exceeds NFT density in AD and directly contributes to overall cognitive function (Gomez-Isla et al., 1997). Since MRI measures neuronal loss; optimally extracted MRI based measures (i.e. STAND-scores) that take into account both the magnitude and the topographic pattern of atrophy provide a reliable scale for staging the in-vivo pathology.
Another advantage in using high resolution structural MRI for in-vivo staging is the fact that there is a lesser possibility of sampling error: MRI samples the entire brain while Braak staging is based on analysis of six brain sections. Compared to other MRI based image analysis techniques that perform only group-wise comparisons using 3D MRI scans, STAND-score method has the advantage of assessing the disease state in individual subjects. We envision that the STAND-score algorithm could be useful clinically for disease staging in conjunction with established clinical evaluation methods. Presently the operating point for the algorithm is set to maximize overall accuracy, but this could be changed to give higher sensitivity if the algorithm were used for screening or high specificity if it were used to identify candidates for high risk therapeutics. The STAND-scores presented in this paper are based on SPM segmentations and if hardware variations in multi site studies affect segmentation, then there would be unwanted variation due to a “center effect” in the scores. On the other hand, if hardware variation had no effect on segmentation then there should be no center effect. This is something we would like to address in the near-future.
Acknowledgments
This study was supported by grants P50 AG16574, R01 AG11378, R01 AG06786, and K23 AG030935 from the National Institute on Aging, Bethesda MD, RR24151 K12 CTSA Mentored Career Development Program, the support of the Robert H. and Clarice Smith and Abigail Van Buren Alzheimer’s Disease Research Program of the Mayo Foundation, U.S.A, the Alexander Family Alzheimer’s Disease Research Professorship of the Mayo Foundation, U.S.A and Opus building grant NIH C06 RR018898. DSK has been a consultant to GE HealthCare, GlaxoSmithKline and Myriad Pharmaceuticals, has served on a Data Safety Monitoring Board for Neurochem Pharmaceuticals, and is an investigator in a clinical trial sponsored by Elan Pharmaceuticals. RCP has been a consultant to GE Healthcare and is on a Treatment Effects Monitoring Committee for a clinical trial sponsored by Elan Pharmaceuticals. BB is an investigator in a clinical trial sponsored by Myriad Pharmaceuticals. CRJ receives research support from Pfizer in the form of research grants. The authors would like to thank Stephen D. Weigand and Scott Przybelski; Department of Health Science Research at Mayo Clinic for their statistical assistance in identifying cohorts for this study. We would like to thank the reviewers for their suggestions.
References
- American Psychiatric Association. Diagnostic and Statistical Manual of Mental Disorders. 4. Washington DC: American Psychiatric Association; 1994. (DSM IV) [Google Scholar]
- Ashburner J, Friston KJ. Voxel-based morphometry--the methods. Neuroimage. 2000;11:805–821. doi: 10.1006/nimg.2000.0582. [DOI] [PubMed] [Google Scholar]
- Ashburner J, Friston KJ. Unified segmentation. Neuroimage. 2005;26:839–851. doi: 10.1016/j.neuroimage.2005.02.018. [DOI] [PubMed] [Google Scholar]
- Baron JC, Chetelat G, Desgranges B, Perchey G, Landeau B, de la Sayette V, Eustache F. In vivo mapping of gray matter loss with voxel-based morphometry in mild Alzheimer’s disease. Neuroimage. 2001;14:298–309. doi: 10.1006/nimg.2001.0848. [DOI] [PubMed] [Google Scholar]
- Bennett DA, Schneider JA, Arvanitakis Z. Neuropathology of older persons without cognitive impairment from two community-based clinical-pathologic studies. Neurology. 2006;66:1837–1844. doi: 10.1212/01.wnl.0000219668.47116.e6. [DOI] [PubMed] [Google Scholar]
- Bobinski M, de Leon MJ, Wegiel J, Desanti S, Convit A, Saint Louis LA, Rusinek H, Wisniewski HM. The histological validation of post mortem magnetic resonance imaging-determined hippocampal volume in Alzheimer’s disease. Neuroscience. 2000;95:721–725. doi: 10.1016/s0306-4522(99)00476-5. [DOI] [PubMed] [Google Scholar]
- Braak H, Braak E. Neuropathological stageing of Alzheimer-related changes. Acta Neuropathol (Berl) 1991;82:239–259. doi: 10.1007/BF00308809. [DOI] [PubMed] [Google Scholar]
- Braak H, Braak E. Morphological criteria for the recognition of Alzheimer’s disease and the distribution pattern of cortical changes related to this disorder. Neurobiol Aging. 1994;15:355–356. doi: 10.1016/0197-4580(94)90032-9. discussion 379–380. [DOI] [PubMed] [Google Scholar]
- Busch C, Bohl J, Ohm TG. Spatial, Temporal and Numeric Analysis of Alzheimer Changes in the Nucleus Coeruleus. 1997;18:401–406. doi: 10.1016/s0197-4580(97)00035-3. [DOI] [PubMed] [Google Scholar]
- Chetelat G, Desgranges B, De La Sayette V, Viader F, Eustache F, Baron JC. Mapping gray matter loss with voxel-based morphometry in mild cognitive impairment. Neuroreport. 2002;13:1939–1943. doi: 10.1097/00001756-200210280-00022. [DOI] [PubMed] [Google Scholar]
- Crystal HA, Dickson DW, Sliwinski MJ, Lipton RB, Grober E, Marks-Nelson H, Antis P. Pathological markers associated with normal aging and dementia in the elderly. Ann Neurol. 1993;34:566–573. doi: 10.1002/ana.410340410. [DOI] [PubMed] [Google Scholar]
- Csernansky JG, Hamstra J, Wang L, McKeel D, Price JL, Gado M, Morris JC. Correlations between antemortem hippocampal volume and postmortem neuropathology in AD subjects. Alzheimer Dis Assoc Disord. 2004;18:190–195. [PubMed] [Google Scholar]
- Evans DA, Funkenstein HH, Albert MS, Scherr PA, Cook NR, Chown MJ, Hebert LE, Hennekens CH, Taylor JO. Prevalence of Alzheimer’s disease in a community population of older persons. Higher than previously reported. Jama. 1989;262:2551–2556. [PubMed] [Google Scholar]
- Folstein MF, Folstein SE, McHugh PR. “Mini-mental state”. A practical method for grading the cognitive state of patients for the clinician. J Psychiatr Res. 1975;12:189–198. doi: 10.1016/0022-3956(75)90026-6. [DOI] [PubMed] [Google Scholar]
- Fox NC, Warrington EK, Freeborough PA, Hartikainen P, Kennedy AM, Stevens JM, Rossor MN. Presymptomatic hippocampal atrophy in Alzheimer’s disease. A longitudinal MRI study. Brain. 1996;119(Pt 6):2001–2007. doi: 10.1093/brain/119.6.2001. [DOI] [PubMed] [Google Scholar]
- Freeborough PA, Fox NC. The boundary shift integral: an accurate and robust measure of cerebral volume changes from registered repeat MRI. IEEE Trans Med Imaging. 1997;16:623–629. doi: 10.1109/42.640753. [DOI] [PubMed] [Google Scholar]
- Frisoni GB, Testa C, Zorzan A, et al. Detection of gray matter loss in mild Alzheimer’s disease with voxel-based morphometry. J Neurol Neurosurg Psychiatry. 2002;73:657–664. doi: 10.1136/jnnp.73.6.657. [DOI] [PMC free article] [PubMed] [Google Scholar]
- Gomez-Isla T, Hollister R, West H, Mui S, Growdon JH, Petersen RC, Parisi JE, Hyman BT. Neuronal loss correlates with but exceeds neurofibrillary tangles in Alzheimer’s disease. Ann Neurol. 1997;41:17–24. doi: 10.1002/ana.410410106. [DOI] [PubMed] [Google Scholar]
- Gomez-Isla T, Price JL, McKeel DW, Jr, Morris JC, Growdon JH, Hyman BT. Profound loss of layer II entorhinal cortex neurons occurs in very mild Alzheimer’s disease. J Neurosci. 1996;16:4491–4500. doi: 10.1523/JNEUROSCI.16-14-04491.1996. [DOI] [PMC free article] [PubMed] [Google Scholar]
- Gosche KM, Mortimer JA, Smith CD, Markesbery WR, Snowdon DA. Hippocampal volume as an index of Alzheimer neuropathology: findings from the Nun Study. Neurology. 2002;58:1476–1482. doi: 10.1212/wnl.58.10.1476. [DOI] [PubMed] [Google Scholar]
- Hughes CP, Berg L, Danziger WL, Coben LA, Martin RL. A new clinical scale for the staging of dementia. Br J Psychiatry. 1982;140:566–572. doi: 10.1192/bjp.140.6.566. [DOI] [PubMed] [Google Scholar]
- Hulette CM, Welsh-Bohmer KA, Murray MG, Saunders AM, Mash DC, McIntyre LM. Neuropathological and neuropsychological changes in “normal” aging: evidence for preclinical Alzheimer disease in cognitively normal individuals. J Neuropathol Exp Neurol. 1998;57:1168–1174. doi: 10.1097/00005072-199812000-00009. [DOI] [PubMed] [Google Scholar]
- Hyman BT, Trojanowski JQ. Consensus recommendations for the postmortem diagnosis of Alzheimer’s disease. The National Institute on Aging, and Reagan Institute Working Group on Diagnostic Criteria for the Neuropathological Assessment of Alzheimer’s Disease. Neurobiol Aging. 1997;18:S1–2. [PubMed] [Google Scholar]
- Jack CR, Jr, Dickson DW, Parisi JE, Xu YC, Cha RH, O’Brien PC, Edland SD, Smith GE, Boeve BF, Tangalos EG, et al. Antemortem MRI findings correlate with hippocampal neuropathology in typical aging and dementia. Neurology. 2002;58:750–757. doi: 10.1212/wnl.58.5.750. [DOI] [PMC free article] [PubMed] [Google Scholar]
- Jack CR, Jr, Petersen RC, O’Brien PC, Tangalos EG. MR-based hippocampal volumetry in the diagnosis of Alzheimer’s disease. Neurology. 1992;42:183–188. doi: 10.1212/wnl.42.1.183. [DOI] [PubMed] [Google Scholar]
- Jack CR, Jr, Petersen RC, Xu Y, O’Brien PC, Smith GE, Ivnik RJ, Tangalos EG, Kokmen E. Rate of medial temporal lobe atrophy in typical aging and Alzheimer’s disease. Neurology. 1998;51:993–999. doi: 10.1212/wnl.51.4.993. [DOI] [PMC free article] [PubMed] [Google Scholar]
- Jack CR, Jr, Petersen RC, Xu YC, Waring SC, O’Brien PC, Tangalos EG, Smith GE, Ivnik RJ, Kokmen E. Medial temporal atrophy on MRI in normal aging and very mild Alzheimer’s disease. Neurology. 1997;49:786–794. doi: 10.1212/wnl.49.3.786. [DOI] [PMC free article] [PubMed] [Google Scholar]
- Jack CR, Jr, Twomey CK, Zinsmeister AR, Sharbrough FW, Petersen RC, Cascino GD. Anterior temporal lobes and hippocampal formations: normative volumetric measurements from MR images in young adults. Radiology. 1989;172:549–554. doi: 10.1148/radiology.172.2.2748838. [DOI] [PubMed] [Google Scholar]
- Jicha GA, Parisi JE, Dickson DW, Johnson K, Cha R, Ivnik RJ, Tangalos EG, Boeve BF, Knopman DS, Braak H, Petersen RC. Neuropathologic outcome of mild cognitive impairment following progression to clinical dementia. Arch Neurol. 2006;63:674–681. doi: 10.1001/archneur.63.5.674. [DOI] [PubMed] [Google Scholar]
- Josephs KA, Whitwell JL, Ahmed Z, Shiung MM, Weigand SD, Knopman DS, Boeve BF, Parisi JE, Petersen RC, Dickson DW, Jack CR., Jr β-amyloid burden is not associated with rates of brain atrophy. Ann Neurol. 2007 doi: 10.1002/ana.21223. Epub. [DOI] [PMC free article] [PubMed] [Google Scholar]
- Josephs KA, Whitwell JL, Parisi JE, Knopman DS, Boeve BF, Geda YE, Jack CR, Jr, Petersen RC, Dickson DW. Argyrophilic grains: A distinct disease or an additive pathology? Neurobiol Aging. 2006 doi: 10.1016/j.neurobiolaging.2006.10.032. [DOI] [PMC free article] [PubMed] [Google Scholar]
- Kantarci K, Jack CR., Jr Neuroimaging in Alzheimer disease: an evidence-based review. Neuroimaging Clin N Am. 2003;13:197–209. doi: 10.1016/s1052-5149(03)00025-x. [DOI] [PubMed] [Google Scholar]
- Katzman R, Terry R, DeTeresa R, Brown T, Davies P, Fuld P, Renbing X, Peck A. Clinical, pathological, and neurochemical changes in dementia: a subgroup with preserved mental status and numerous neocortical plaques. Ann Neurol. 1988;23:138–144. doi: 10.1002/ana.410230206. [DOI] [PubMed] [Google Scholar]
- Killiany RJ, Gomez-Isla T, Moss M, Kikinis R, Sandor T, Jolesz F, Tanzi R, Jones K, Hyman BT, Albert MS. Use of structural magnetic resonance imaging to predict who will get Alzheimer’s disease. Ann Neurol. 2000;47:430–439. [PubMed] [Google Scholar]
- Knopman DS, Parisi JE, Salviati A, Floriach-Robert M, Boeve BF, Ivnik RJ, Smith GE, Dickson DW, Johnson KA, Petersen LE, et al. Neuropathology of cognitively normal elderly. J Neuropathol Exp Neurol. 2003;62:1087–1095. doi: 10.1093/jnen/62.11.1087. [DOI] [PubMed] [Google Scholar]
- Lemaitre H, Crivello F, Grassiot B, Alperovitch A, Tzourio C, Mazoyer B. Age- and sex-related effects on the neuroanatomy of healthy elderly. Neuroimage. 2005;26:900–911. doi: 10.1016/j.neuroimage.2005.02.042. [DOI] [PubMed] [Google Scholar]
- McKhann G, Drachman D, Folstein M, Katzman R, Price D, Stadlan EM. Clinical diagnosis of Alzheimer’s disease: report of the NINCDS-ADRDA Work Group under the auspices of Department of Health and Human Services Task Force on Alzheimer’s Disease. Neurology. 1984;34:939–944. doi: 10.1212/wnl.34.7.939. [DOI] [PubMed] [Google Scholar]
- Mesulam MM. Principles of Behavioral and Cognitive Neurology. 2. Oxford University Press; 2000. [Google Scholar]
- Mirra SS, Heyman A, McKeel D, Sumi SM, Crain BJ, Brownlee LM, Vogel FS, Hughes JP, van Belle G, Berg L. The Consortium to Establish a Registry for Alzheimer’s Disease (CERAD). Part II. Standardization of the neuropathologic assessment of Alzheimer’s disease. Neurology. 1991;41:479–486. doi: 10.1212/wnl.41.4.479. [DOI] [PubMed] [Google Scholar]
- Morris JC, Price AL. Pathologic correlates of nondemented aging, mild cognitive impairment, and early-stage Alzheimer’s disease. J Mol Neurosci. 2001;17:101–118. doi: 10.1385/jmn:17:2:101. [DOI] [PubMed] [Google Scholar]
- Nagy Z, Hindley NJ, Braak H, Braak E, Yilmazer-Hanke DM, Schultz C, Barnetson L, Jobst KA, Smith AD. Relationship between clinical and radiological diagnostic criteria for Alzheimer’s disease and the extent of neuropathology as reflected by ‘stages’: a prospective study. Dement Geriatr Cogn Disord. 1999;10:109–114. doi: 10.1159/000017110. [DOI] [PubMed] [Google Scholar]
- NIA-Reagan. Consensus recommendations for the postmortem diagnosis of Alzheimer’s disease. The National Institute on Aging, and Reagan Institute Working Group on Diagnostic Criteria for the Neuropathological Assessment of Alzheimer’s Disease. Neurobiol Aging. 1997;18:S1–2. [PubMed] [Google Scholar]
- Petersen RC. Mild cognitive impairment as a diagnostic entity. J Intern Med. 2004;256:183–194. doi: 10.1111/j.1365-2796.2004.01388.x. [DOI] [PubMed] [Google Scholar]
- Petersen RC, Smith GE, Waring SC, Ivnik RJ, Tangalos EG, Kokmen E. Mild cognitive impairment: clinical characterization and outcome. Arch Neurol. 1999;56:303–308. doi: 10.1001/archneur.56.3.303. [DOI] [PubMed] [Google Scholar]
- Riley KP, Snowdon DA, Markesbery WR. Alzheimer’s neurofibrillary pathology and the spectrum of cognitive function: findings from the Nun Study. Ann Neurol. 2002;51:567–577. doi: 10.1002/ana.10161. [DOI] [PubMed] [Google Scholar]
- Rombouts SA, Barkhof F, Witter MP, Scheltens P. Unbiased whole-brain analysis of gray matter loss in Alzheimer’s disease. Neurosci Lett. 2000;285:231–233. doi: 10.1016/s0304-3940(00)01067-3. [DOI] [PubMed] [Google Scholar]
- Rose SE, Chen F, Chalk JB, Zelaya FO, Strugnell WE, Benson M, Semple J, Doddrell DM. Loss of connectivity in Alzheimer’s disease: an evaluation of white matter tract integrity with colour coded MR diffusion tensor imaging. J Neurol Neurosurg Psychiatry. 2000;69:528–530. doi: 10.1136/jnnp.69.4.528. [DOI] [PMC free article] [PubMed] [Google Scholar]
- Schmitt FA, Davis DG, Wekstein DR, Smith CD, Ashford JW, Markesbery WR. “Preclinical” AD revisited: neuropathology of cognitively normal older adults. Neurology. 2000;55:370–376. doi: 10.1212/wnl.55.3.370. [DOI] [PubMed] [Google Scholar]
- Schott JM, Price SL, Frost C, Whitwell JL, Rossor MN, Fox NC. Measuring atrophy in Alzheimer disease: a serial MRI study over 6 and 12 months. Neurology. 2005;65:119–124. doi: 10.1212/01.wnl.0000167542.89697.0f. [DOI] [PubMed] [Google Scholar]
- Shiino A, Watanabe T, Maeda K, Kotani E, Akiguchi I, Matsuda M. Four subgroups of Alzheimer’s disease based on patterns of atrophy using VBM and a unique pattern for early onset disease. Neuroimage. 2006;33:17–26. doi: 10.1016/j.neuroimage.2006.06.010. [DOI] [PubMed] [Google Scholar]
- Silbert LC, Quinn JF, Moore MM, Corbridge E, Ball MJ, Murdoch G, Sexton G, Kaye JA. Changes in premorbid brain volume predict Alzheimer’s disease pathology. Neurology. 2003;61:487–492. doi: 10.1212/01.wnl.0000079053.77227.14. [DOI] [PubMed] [Google Scholar]
- Smith CD, Chebrolu H, Wekstein DR, Schmitt FA, Markesbery WR. Age and gender effects on human brain anatomy: A voxel-based morphometric study in healthy elderly. Neurobiol Aging. 2006 doi: 10.1016/j.neurobiolaging.2006.05.018. [DOI] [PubMed] [Google Scholar]
- Stoub TR, deToledo-Morrell L, Stebbins GT, Leurgans S, Bennett DA, Shah R. Hippocampal disconnection due to white matter loss in individuals with amnestic mild cognitive impairment. Alzheimer’s Association International Conference on Prevention of Dementia: Early Diagnosis and Intervention. 2005;1:40. [Google Scholar]
- Vemuri P, Gunter JL, Senjem ML, Whitwell JL, Kantarci K, Knopman DS, Boeve BF, Petersen RC, Jack CR., Jr Alzheimer’s disease diagnosis in individual subjects using structural MR images: Validation studies. Neuroimage. 2008;39:1186–1197. doi: 10.1016/j.neuroimage.2007.09.073. [DOI] [PMC free article] [PubMed] [Google Scholar]
- Whitwell JL, Przybelski SA, Weigand SD, Knopman DS, Boeve BF, Petersen RC, Jack CR., Jr 3D maps from multiple MRI illustrate changing atrophy patterns as subjects progress from mild cognitive impairment to Alzheimer’s disease. Brain %R 101093/brain/awm112. 2007;130:1777–1786. doi: 10.1093/brain/awm112. [DOI] [PMC free article] [PubMed] [Google Scholar]
- Zarow C, Vinters HV, Ellis WG, Weiner MW, Mungas D, White L, Chui HC. Correlates of hippocampal neuron number in Alzheimer’s disease and ischemic vascular dementia. Ann Neurol. 2005;57:896–903. doi: 10.1002/ana.20503. [DOI] [PMC free article] [PubMed] [Google Scholar]