Physiologic Screening Test for Eating Disorders/Disordered Eating Among Female Collegiate Athletes (original) (raw)
. 2003 Oct-Dec;38(4):286–297.
Abstract
Objective:
To develop and evaluate a physiologic screening test specifically designed for collegiate female athletes engaged in athletic competition or highly athletic performances in order to detect eating disorders/disordered eating. No such physiologically based test currently exists.
Methods:
Subjects included 148 (84.5%) of 175 volunteer, National Collegiate Athletic Association Division I (n = 92), club (n = 15), and dance team (n = 41) athletes 18 to 25 years old who attended a large, Midwestern university. Participants completed 4 tests: 2 normed for the general population (Eating Disorders Inventory-2 and Bulimia Test-Revised); a new physiologic test, developed and pilot tested by the investigators, called the Physiologic Screening Test; and the Eating Disorder Exam 12.0D, a structured, validated, diagnostic interview used for criterion validity.
Results:
The 18-item Physiologic Screening Test produced the highest sensitivity (87%) and specificity (78%) and was superior to the Eating Disorders Inventory-2 (sensitivity = 62%, specificity = 74%) and Bulimia Test-Revised (sensitivity = 27%, specificity = 99%). A substantial number (n = 51, 35%) of athletes were classified as eating disordered/disordered eating.
Conclusions:
The Physiologic Screening Test should be considered for screening athletes for eating disorders/disordered eating. The Physiologic Screening Test seems to be a viable alternative to existing tests because it is specifically designed for female athletes, it is brief (4 measurements and 14 items), and validity is enhanced and response bias is lessened because the purpose is less obvious, especially when included as part of a mandatory preparticipation examination.
Keywords: dieting behaviors, anorexia nervosa, bulimia nervosa, Eating Disorder Examination, Eating Disorders Inventory-2, Bulimia Test-Revised, female athlete triad
The female athlete triad syndrome includes 3 interrelated components of a serious nature: disordered eating, amenorrhea, and osteoporosis.1 Although estimates vary, one study has shown that athletes are 2 to 3 times more likely than the general population and college-aged peers to meet criteria for eating disorders,2,3 and as many as 62% of athletes engage in pathogenic weight-control behaviors.4,5 A greater preponderance of female athletes with low body weights and body fat percentages are in sports that emphasize trimness and leanness.1 Despite serious medical sequelae associated with eating disorders and disordered eating, few screening tests have been designed specifically for athletes.6
The use and development of screening tests to detect disordered eating and eating disorders is justified according to Wilson and Jungner7 (as cited in Timmreck8) when the following are present: (a) The disease/condition is prevalent; (b) a major medical problem exists among the population or subpopulation of concern; (c) diagnostic tests and procedures are available and make it possible to differentiate diseased individuals from borderline or nondiseased individuals; (d) prognosis is improved if the disease is detected and treated before the usual time; (e) a recognizable latent and early symptomatic stage occurs; (f) accepted treatments are available for patients with the recognized disease; (g) facilities for diagnosis and treatment are available; (h) screening does not harm the individual being screened; (i) the screening test and process are acceptable to those performing the screening and those being screened; (j) the screening process is simple and brief, so large groups can participate; (k) the test is to be administered by qualified professionals or trained technicians; (l) the test is innocuous, easily administered, inexpensive, and minimally time consuming to complete and yields reliable and valid results; and (m) screening is to be a regular and ongoing process.
Research on athletes and eating disorders has matured since its inception more than 2 decades ago3 to the point when the development of a screening test specifically designed for female college athletes seems warranted, if not overdue. For example, a recent meta-analysis of 34 samples by Smolak et al9 provided further justification for the need for a screening test. Significantly more eating problems were self-reported among college athletes than among college-aged, nonathlete controls; however, the difference was nonsignificant among high school athletes versus age-mate controls. Significantly more eating problems were noted among elite athletes than nonathletes, and elite athletes participating in lean sports were especially at risk compared with controls. Significantly more eating problems were reported among those participating in dance/performance sports (eg, ballet, aerobics, cheerleading) in comparison with nonathletes. The need for a screening test for female athletes also is apparent based on outcries from both athletic and sports medicine personnel, despite the variable prevalence rates of eating-disorder symptoms and the existence of eating disorders among different groups of athletes.10 In addition, psychosocial treatments for eating disorders are promising despite recalcitrance.
An important step in the development of any screening test is to establish content validity of items. One method of establishing a physiologically based item domain is to identify variables based on physiologic plausibility, a review of the research literature, and recommendations by experts. Physiologic plausibility is similar in meaning to the causality criteria concept in epidemiology known as (biological) plausibility.8 In terms of physiologic plausibility, the issue is whether the variable considered for assessment makes physiologic sense in terms of current knowledge about eating disorders. Several ways to address this issue are to systematically note the relationships among physical complications of eating-disorder behaviors, the body systems they affect, and the consequent signs and symptoms.11–13 The variables identified as physiologically plausible could then be used to conduct a literature review. Those variables or physiologic signs and symptoms reported by the largest portions of study participants could be considered for inclusion in a screening test for eating-disorder/disordered-eating athletes.14–34 This list of variables could then be compared with what experts recommended for inclusion.35,36 Consequently, development of physiologic items for a physiologic screening test would be based on the following: (a) cogent domains that make physiologic sense, (b) variables that have been identified several times in the literature as warning flags for eating disorders/disordered eating, and (c) recommendations by experts.
There is an exigent need for a screening test, designed specifically for female collegiate athletes, that ameliorates validity by reducing measurement error. One source of measurement error is response bias,37 or answering in a socially desirable way rather than candidly. Response bias is likely to be minimized in a physiologically based test because some items are measurements and as such are objective in nature, require no verbal response, and cannot be as easily manipulated or distorted by the athlete to meet societal expectations or perceived demands of social desirability. Furthermore, questionnaire items that are physiologically based are likely to reduce response bias when there is no apparent theme to the items, their purpose is ambiguous, and items are presented in a context that does not arouse suspicion about their relevance to screening for existence of an eating-disorder/disordered-eating condition. For example, if physiologic measurements and physiologically based questions were included in a preparticipation examination, the process would not seem peculiar or extraordinary.38,39
Our purpose was to develop and evaluate a physiologic screening test specifically designed for collegiate female athletes engaged in athletic competition or highly athletic performances in order to detect eating disorders/disordered eating. The present study was conducted to address the following research questions: (1) What are the epidemiologic results for the Physiologic Screening Test, including sensitivity, specificity, percentage of false positives, percentage of false negatives, positive predictive value, negative predictive value, yield, accuracy, and validity? (2) What percentage of subjects are correctly classified into various eating-disorders/disordered-eating categories as verified by a systematic, psychometrically validated, structured diagnostic interview? (3) How do the epidemiologic results for the Physiologic Screening Test compare with other commercial screening tests used with, but not normed for, athletes? (4) What are the specific variables that provide the most accurate subject classification based on a structured, diagnostic interview?
METHODS
Subjects
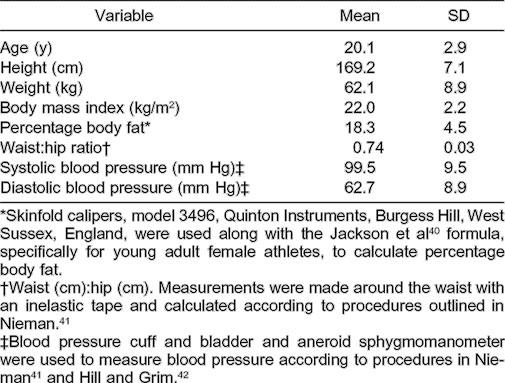
A total of 148 of 175 (84.5%) National Collegiate Athletic Association Division I sport, club, and dance female athletes at a large, Midwest university participated in the study. Demographic and anthropometric data are reported in Table 1. Athletes who participated in the study were from the following 12 teams or groups: basketball, softball, swimming, tennis, track and field, volleyball, cross-country, golf, gymnastics, cheerleading, dance company, and modern dance.
Table 1.
Demographic and Anthropometric Subject Characteristics for All Athletes (n = 148)
The study and research protocol were approved by the university's institutional review board, the athletic director, the head team physician, and the head athletic trainer. Participation was voluntary, and confidentiality was guaranteed both verbally and in writing, which also aided in assuring no reprisals for participation. Written informed consent was obtained from participants. Physicians, athletic trainers, coaches, and parents were not admitted to the test site and were not allowed access to any information except in aggregate form to avoid bias and undue influence. Athletes who divulged or were suspected of an eating disorder/disordered eating were provided referral information to seek professional assistance on or off campus from qualified eating-disorder professionals.
Recruitment
The study was formally presented to each of the 12 teams. Athletes were informed that the research protocol focused primarily on dietary and exercise behaviors; 2 testing sessions were required, each lasting approximately 1 hour, during which surveys and physiologic assessments were completed. Each athlete independently scheduled specific days and times for testing and agreed to report promptly at the scheduled appointment time to the human performance laboratory in one of the university academic departments on campus.
Procedures
Test Sessions and Test Administration
All participants completed all aspects of the testing. The 2 test sessions were held on different days, usually less than 1 week apart. During the first session, the Eating Disorders Inventory, 2nd edition,43 and Bulimia Test-Revised screening tests (psychometrically validated and normed for the general population) were administered.44 A commercial vendor distributes the Eating Disorders Inventory-2,43 and the Bulimia Test-Revised is obtainable from the authors44 for a fee.
Eating Disorders Inventory-2
The Eating Disorders Inventory-2 is a 91-item screening test designed to measure attitudes, feelings, and behaviors common to both anorexia nervosa and bulimia nervosa. The Eating Disorders Inventory-2 includes 11 subscales; the 3 subscales that receive the greatest consideration are the Bulimia, Body Dissatisfaction, and Drive-for-Thinness subscales because they are the core subscales for screening eating disorders. These 3 subscales measure the tendency to engage in binge eating, discontentment with body size and shape, and excessive concerns for dieting and preoccupation with weight, respectively. A total of 23 items (25.3%) from these 3 subscales were used in the analyses. Conservative high-score cutoffs of ≥20 for Body Dissatisfaction45 and ≥14 for Drive for Thinness46 were utilized because predictive validity has been established only for these 2 subscales with clinical diagnosis of an eating disorder.46
Because cutoff scores have not been established for any of the other subscales, the other 8 subscales (Ineffectiveness, Perfectionism, Interpersonal Distrust, Interoceptive Awareness, Maturity Fears, Asceticism, Impulse Regulation, and Social Insecurity) were not included. These 8 subscales were developed for the primary purpose of tapping more general organizational constructs or psychological traits clinically relevant to eating disorders and also to provide information about psychological factors that contribute to understanding the remarkable heterogeneity in the psychopathology associated with eating disorders.43 Although these subscales may be clinically relevant for therapeutic settings, the central features of Bulimia, Body Dissatisfaction, and Drive for Thinness provide an economical means of identifying individuals who have subclinical eating problems or those who may be at risk for developing eating disorders.43
Previously reported psychometric data for the Eating Disorders Inventory-2 indicated that the internal consistency of each of the subscales determined by Cronbach alpha, was between .44 and .93. The average interitem total correlation was .63, which suggests a modest but respectable degree of internal consistency.45 Criterion validity correlations using expert ratings were from .43 to .68. Test-retest reliability coefficients for the Eating Disorders Inventory-2 administered 1 week apart to student and staff nurses (n = 70) were .79 to .95 for the 3 subscales used in the analyses.
Bulimia Test-Revised
The Bulimia Test-Revised44 is a commonly used screening test designed to assess bulimia-type characteristics. The items are based on criteria identified in the Diagnostic and Statistical Manual of Mental Disorders DSM III-R47 for bulimia nervosa. The multiple-choice (5-point, Likert-type scale) questionnaire consists of 35 items (28 items are used to determine the total Bulimia Test score) categorized into 7 areas: binges, feelings, vomiting, food, weight, laxative/diuretic abuse, and menstrual regularity. Scores for the Bulimia Test-Revised can be from 29 to 140. A person with a score of ≥104 is likely to be diagnosed as having bulimia nervosa in an interview.44
A psychometric investigation of the Bulimia Test-Revised reported by Brelsford et al48 found an internal consistency of .92 and a stability correlation of .83 when first and second test administrations were compared 4 to 6 weeks apart. Sensitivity of the Bulimia Test-Revised was 26.9%, while the specificity, positive predictive value, and negative predictive value were all ≥.70.44 A major limitation of the Eating Disorders Inventory-2 and the Bulimia Test-Revised is that their external validity is not based on college-aged female athletes.
Eating Disorder Examination
During the second test session, the Eating Disorder Examination49 and the Physiologic Screening Test were administered. The Eating Disorder Examination, according to Garner,46 is the current gold standard for diagnosing eating disorders. The Eating Disorder Examination is a psychometrically validated, structured interview and is based on the diagnostic criteria specified in Diagnostic and Statistical Manual of Mental Disorders DSM III-R47 and IV11 for both anorexia nervosa and bulimia nervosa or variations of these eating disorders. The Eating Disorder Examination assesses the frequency and number of days key behavioral aspects of eating disorders (ie, overeating and use of pathogenic weight-control methods) occur. Completion of the Eating Disorder Examination requires descriptive information from subjects as well as information addressing 5 subscales (Overeating, Restraint, Eating, Shape, and Weight concerns).
Wilson and Smith50 reported interrater reliability for the Eating Disorder Examination subscales to be between .97 and .99, and Rosen et al51 reported coefficients from .83 to .99. Internal consistency was satisfactory according to Cooper et al,52 who reported coefficients of .68 to .90 for the 5 subscales. Cooper et al52 also reported discriminate validity and found that the Eating Disorder Examination distinguished well on all items for a group of patients with eating disorders (n = 100) versus normal controls (n = 42). According to Rosen et al,51 concurrent validity for the Eating Disorder Examination was modestly related to self-reported dietary restraint and overeating but was highly associated with self-reported vomiting episodes. Test-retest reliability has not been reported.49
Interviewers (n = 2) in the present study took approximately 45 minutes to administer the Eating Disorder Examination to each participant. Interviewers attended eight 2-hour training sessions conducted by a licensed clinical psychologist knowledgeable about the Eating Disorder Examination and eating disorders/disordered eating. A criterion-referenced approach was used to determine when interviewers met certain minimal standard criteria of performance and would be permitted to interview. The minimal criteria for interviewing were when the interviewers correctly answered questions that indicated familiarity with the Eating Disorder Examination procedures and when their mock interview scores were identical to those of the clinical psychologist.
Physiologic Screening Test
The Physiologic Screening Test was developed for this study to identify eating disorders/disordered eating specifically in female, college-aged athlete populations. Items used for development of the Physiologic Screening Test were based on physical signs and symptoms of eating disorders/disordered eating13–34 and concurrence by authorities35,36 in accordance with the physiologic plausibility principle summarized earlier. The Physiologic Screening Test took approximately 15 minutes to complete. The test was presented to subjects in a medical examination-type format so as to obscure its purpose.
The test originally included 44 items and was divided into 2 parts: a 12-item, self-report questionnaire and physiologic interview that included 15 self-report questions and 17 physical measurements. One clinician took all physiologic measurements. The technician was a master's-level exercise physiologist familiar with and practiced in all aspects of the measurements. Establishing intertester and intratester reliability was nullified by using one technician. Validity was not formally assessed and reliability was achieved through the use of one trained technician.
The final version of the Physiologic Screening Test included 12 items and was evaluated to assess item performance. The test was administered to a convenience sample of female athletes (n = 45) participating on varsity, junior varsity, and club collegiate (crew and soccer) and high school (basketball) teams so as not to reduce the sample size of the available target group. Readability was calculated to be 7th-grade reading level using the Gunning Fog method.53 Response bias37 was assessed by asking athletes to comment if any of the questions or responses were not clearly stated, if response options were inadequate, or if they felt a question would prompt a dishonest answer or a socially desirable response. No changes to items were needed as a result of their feedback. Test-retest reliability was .85 after a 2-week interval of retesting.
Items were reduced by a statistical screening process (see explanation below) to produce those that discriminated best between eating-disorders/disordered-eating subjects and OK (ie, not classified as eating-disordered/disordered-eating) subjects and were retained for the final version of the Physiologic Screening Test. The 6 best questionnaire items addressed the following signs and symptoms: dizziness, abdominal bloating, abdominal pain/cramps, frequency of bowel movements, stool consistency, and number of periods/year. For the first 3 items, subjects responded by using a Likert-type ordinal scale: 1 = always, 2 = frequently, 3 = sometimes, 4 = rarely, and 5 = never. Scoring for final analyses was reversed (ie, a response of always was given a 5, frequently a 4, etc), wherein a higher score was indicative of a greater likelihood of eating disorders/disordered eating. For the last 3 items, frequency of bowel movements was rated on a 6-point ordinal scale from 1= more than once a day to 6 = less than every 4 days. Stool consistency was rated from 1 = diarrhea-like (watery) to 3 = hard, dry, and small pieces (constipation). The questions addressing bowel movements were scored so diarrhea and constipation were both equal indicators of eating-disorders/disordered-eating behaviors. Number of periods annually was rated from 1 = 0 to 6 = 12 and was reverse scored.
The best 8 self-report interview items included the following: (a) hours exercised outside of practice, (b) whether menstrual cycles had ever been irregular, (c) lowest weight at current height, (d) age at this weight, (e) highest weight, (f) difference computed between highest and lowest weights, (g) perception of ever being overweight, and (h) whether currently trying to change or maintain weight. Hours exercised were measured on an interval ratio scale in hours and minutes, irregular periods were measured on a nominal scale as yes or no, highest and lowest weights were measured on an interval ratio scale in pounds, age was measured on an interval ratio scale in years, perceptions of overweight were measured on a nominal scale as yes or no, and efforts to change or maintain weight were measured on a nominal scale and trichotomized as gain, lose, or maintain weight.
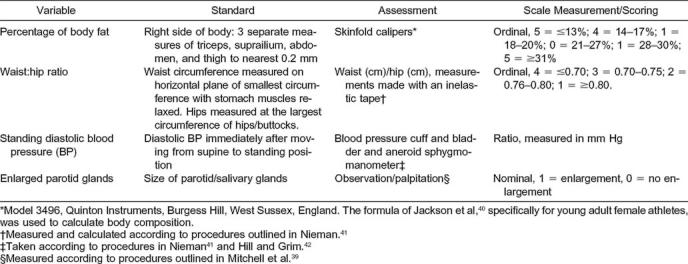
The best 4 physiologic measurements, percentage of body fat, waist:hip ratio, standing diastolic blood pressure, and enlarged parotid glands, are presented in Table 2, along with the standard method of assessment, scale of measurement, and procedures for assessment.
Table 2.
Physiologic Screening Test and Item Scoring for Interview and Physical Measurements
Subject Classification
Responses given by the athletes during the Eating Disorder Examination interviews, which included key diagnostic questions based on Diagnostic and Statistical Manual of Mental Disorders DSM III-R47 and Diagnostic and Statistical Manual of Mental Disorders DSM IV11 criteria, were used for classification of subjects into one of the following 7 categories: (a) anorexia nervosa, (b) bulimia nervosa, (c) not otherwise specified—anorexia nervosa, (d) not otherwise specified—bulimia nervosa, (e) not otherwise specified—both anorexia nervosa and bulimia nervosa, (f) disordered eating, or (g) no eating disorders/disordered eating (or OK). Classification criteria (Table 3) represent the spectrum of eating-disorders/disordered-eating behaviors. Higher (ie, 4, 5, or 6) versus lower (ie, 0, 1, 2, or 3) scores for Eating Disorder Examination responses indicated a greater likelihood of an eating disorder/disordered eating. An anorexia nervosa classification meant all 5 criteria were met. Bulimia nervosa meant all 3 criteria were met. Not otherwise specified—anorexia nervosa meant 4 of the 5 criteria for anorexia nervosa were met, and scores for fear of weight gain and feelings of fatness were ≥3 and maintaining low body weight was a 1 or 2 (see Table 3 for explanation of these numbers). Not otherwise specified—bulimia nervosa meant all 3 criteria for bulimia nervosa were met except that purging occurred less often than weekly over the last 3 months, objective binging happened less than twice/week for the last 3 months, subjective binging occurred 2 times/week over the past 3 months, and the score on items assessing the importance of shape and/or weight was ≥3. Not otherwise specified—both anorexia nervosa and bulimia nervosa meant criteria for both categories were met. Disordered eating meant 2 of the major and 2 of the minor criteria listed under this classification in Table 3 had to be met. Disordered eating was operationalized based on the following definition of disordered eating from the American College of Sports Medicine1 organization:
… a wide spectrum of harmful and often ineffective eating behaviors (are) used in attempts to lose weight or achieve a lean appearance. The spectrum of behaviors ranges in severity from restricting food intake, to binging and purging, to the DSM-IV defined disorders of Anorexia Nervosa and Bulimia Nervosa.
Table 3.
Subject Classification According to Diagnostic and Statistical Manual of Mental Disorders III-R / IV 11,47 Criteria for Eating Disorders and Operationalization of Disordered Eating
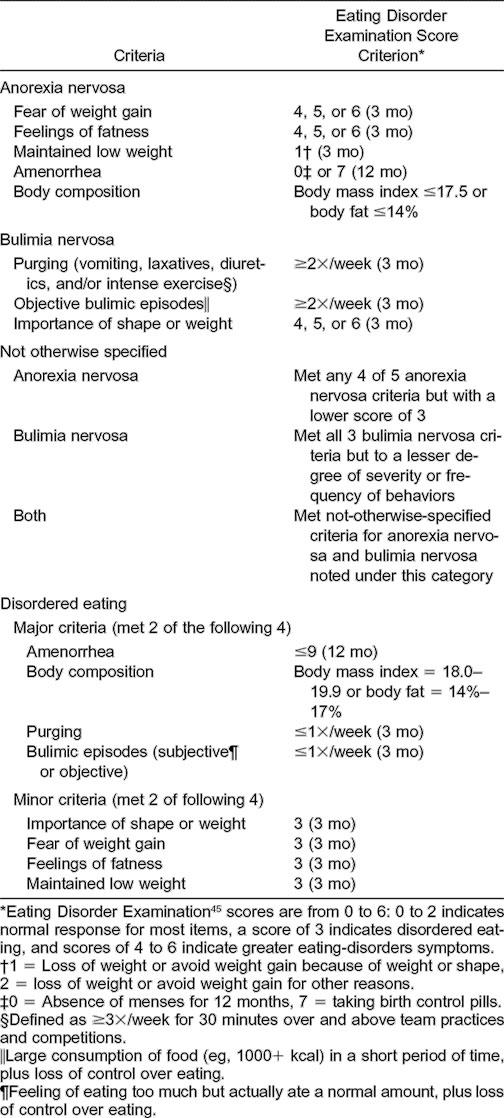
The final category of OK was assigned to those subjects who did not meet the criteria for either eating disorders or disordered eating.
Study Design
A cross-sectional research design was used. Outcomes of the Eating Disorders Inventory-2, Bulimia Test-Revised, and Physiologic Screening Test items were compared with the Eating Disorder Examination interview. Each athlete was classified into either the eating-disorder/disordered-eating group or the OK group based on the Eating Disorder Examination structured-interview outcome. From the item pool of all 3 tests, a subset of items, each of which effectively discriminated between eating disorders/disordered eating and OK subjects, was identified using the 3-step questionnaire item-selection procedure described below.
Data Analyses
Descriptive Statistics
The distributional features of those variables measured on a continuous scale (eg, height, weight, etc) were examined by computing measures of central tendency (means, medians, and modes), dispersion (standard deviations), and distributional plots to ascertain if they violated parametric assumptions related to skewness and kurtosis.
Group Membership
The results of the structured interviews based on the Eating Disorder Examination determined each subject's response group membership (ie, eating disorders/disordered eating or OK). This dichotomous response variable was used to derive the best set of discriminating items from the Physiologic Screening Test, as detailed below.
Questionnaire Item Selection
Each of the 12 Physiologic Screening Test questionnaire items was examined for its potential to discriminate eating disorders/disordered eating from OK subjects with the following 3-step procedure. The following steps were used to determine the best 6 items. First, the difference between the scored item mean for the eating-disorders/disordered-eating group and the corresponding scored item mean for the OK group had to produce a significant t test result (P < .05). Second, based on a logistic regression analysis, the item had to be a significant (P < .05) predictor of eating disorders/disordered eating with the sign of its coefficient in the expected direction according to the presence or absence of an eating disorder/disordered eating. To reduce dimensionality and to facilitate ease of application in the field, those items passing steps 1 and 2 were then summed to provide an overall questionnaire score. Third, an individual item was retained in this process if it contributed to overall discrimination between eating disorders/disordered eating and OK, based on psychometric performance measures such as sensitivity and specificity, while also meeting both of the following conditions: a correlation of at least .4 between the item and the total questionnaire score and Cronbach alpha of at least .6. A lower Cronbach alpha level was set so that items with any potential for group discrimination would not be excluded prematurely. Six items were retained.
The Interview Self-Report and Physiologic-Measurement Item Selection
The best 8 interview self-report items and the 4 best physical measurements were determined by using essentially the same 3-step procedure described above, except for item correlations with the total. Furthermore, because these variables were measured on many different scales, from dichotomous 0-1 indicators (eg, presence or absence of parotid-gland enlargement) to continuous measures (eg, blood pressure), the variables were not summed but entered into the discriminant function individually. Several of the interview items were scored.
The specific procedures for arriving at the 12 interview and physical-measurement items involved the same first 2 steps (mean separation and logistic regression) used for questionnaire items, except that a liberal P value of .25 was selected so as not to eliminate a potentially useful item. Specifically, the coefficient of each item for the final discriminant function had to have the correct sign so that the variable contributed to discrimination in the expected manner (ie, a higher score on an item had to be associated with greater risk of an eating disorder/disordered eating, while a lower score implied an OK). Item correlations with the total and Cronbach alphas were required to meet the conditions of step 3 of the item-selection process. Last, in all the discriminant analyses, prior probabilities for the 2 response groups of eating disorders/disordered eating or OK were adjusted to achieve a target sensitivity of at least 80% while maintaining an acceptably high specificity of at least 75%. These same target values for sensitivity and specificity also were used for Eating Disorders Inventory-2 and Bulimia Test-Revised, although they were not achieved.
Discriminant Function Score and Subject Screening
A subject was screened into either the eating disorders/disordered eating or OK group using the discriminant function score. The discriminant function score was calculated by multiplying a subject's scored value on an item by the corresponding coefficient, then summing these products over the items. Note that each item must be measured on the same scale as used in this study and scored as described above in order to produce a valid discriminant function score. Screening into either eating disorders/disordered eating or OK was done by comparing the discriminant score with the selected cutoff (18.04 in this study), for which the target sensitivity and specificity were exceeded. If a subject's score exceeded this cutoff, she was classified as eating disorders/disordered eating; otherwise, she was classified as OK.
Power Estimate
A post hoc power estimate54 indicated that, at an alpha level of .05, the t tests had at least 80% power to detect a difference between eating disorders/disordered eating and OK group means equal to 0.5σ, where σ denotes the standard deviation of a given item from the Physiologic Screening Test. This suggested that power was adequate for the analyses.
Epidemiologic Analyses
The overall ability to predict eating disorder/disordered eating for each of the screening tests was examined by comparing sensitivity, specificity, percentage of false positives, percentage of false negatives, positive predictive value, negative predictive value, yield, accuracy, and validity.55 Sensitivity describes how well the test correctly identifies those with eating disorders/disordered eating. Specificity evaluates the ability of the test to identify those without eating disorders/disordered eating. The false-positives measure is the number of subjects without the disorder who tested positive. The false-negatives measure is the number of subjects classified as eating disorders/disordered eating who tested negative. The positive predictive value describes the probability that a person who is classified as eating disorders/disordered eating tests positive for the disorder. Negative predictive value represents the probability that those who are not classified as eating disorders/disordered eating test negative. Yield is the proportion of true positives identified by the test based on the total number of respondents. Accuracy is the test's ability to correctly classify both true positives and true negatives. Validity is the ability of the test to measure what it is supposed to measure, and sensitivity and specificity are used to determine validity. Definitions and formulas also are provided in Table 4.
Table 4.
Epidemiologic Statistics for the 3 Screening Tests (Percentages)

RESULTS
Epidemiologic Analyses
Overall, the Physiologic Screening Test had the highest sensitivity of 86.5% and above-target specificity of 77.7% (Table 4). In comparison, sensitivity and specificity of the Bulimia Test-Revised were 26.9% and 98.9%, respectively, while the values for the Eating Disorders Inventory-2 were 61.5% and 74.2%, both below the target values specified above.
The Physiologic Screening Test had a false-positive rate of 22.3%, lower than that of the Eating Disorders Inventory-2. The Bulimia Test-Revised had the lowest false-positive rate of 1.1%, but this was an artifact of the use of the scoring suggested by Thelen et al44 and resulted in almost all subjects being classified as OK, and hence, a very low false-positive rate. Not surprisingly, this produced an unacceptably low sensitivity and unacceptably high false-negative rate (Table 5). This also explained the unusually high positive predictive value of the Bulimia Test-Revised. Other cutoffs for the Bulimia Test-Revised, which better balanced overall sensitivity and specificity, produced consistently poorer measures than the Eating Disorders Inventory-2 and were well below those of the Physiologic Screening Test. The Physiologic Screening Test outperformed the Eating Disorders Inventory-2 and Bulimia Test-Revised on the false-negative rate and negative predictive value, yield, overall accuracy, and validity.
Table 5.
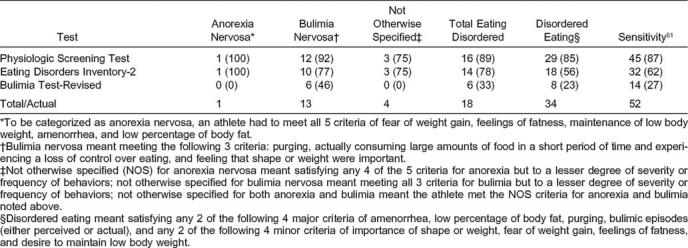
Frequency (Percentage) Correctly Classified for Each Screening Test by Eating-Disorders/Disordered-Eating Category and Sensitivity
Discriminant Model Analyses
The discriminant function coefficients for the final 13-item Screening Test model are provided in Table 6. The first item is the sum of the 6 questionnaire items that were significant on both the t and logistic-regression item-selection criteria and were retained after step 3 of model refinement described above. These 6 items were abdominal bloating, abdominal cramping, frequency of bowel movements, stool consistency, dizziness, and number of menstrual periods. This sum of 6 items had significant mean separation between the eating disorders/disordered eating and OK groups (mean = 12.86 and 10.91 for eating-disorders/disordered-eating and OK subjects, respectively; _t_78 = 3.78, P < .01, and a significant logistic regression, P < .01).
Table 6.
Discriminant Function Coefficients for the Physiologic Screening Test
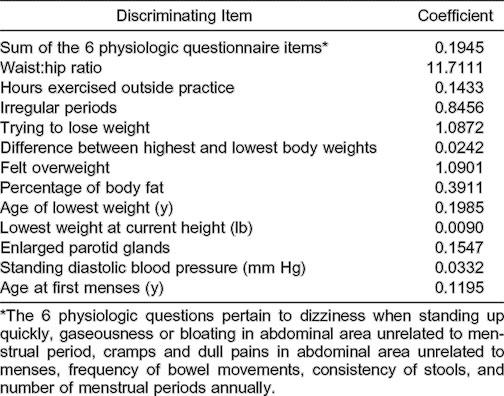
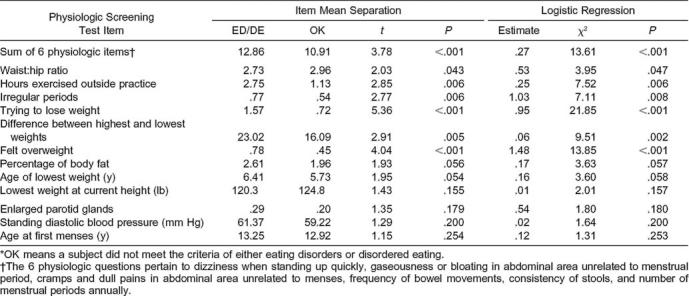
Summary statistics for the 12 other interview-physical measures are presented in Table 7. These 12 items are as follows: a subject's waist-to-hip ratio; hours/week an athlete exercised outside of regular practice times; irregular-periods score; trying-to-lose-weight score; highest versus lowest weight difference; felt-overweight score; body-fat percentage score; age-of-lowest-weight score; lowest weight at current height; parotid-gland enlargement score; standing diastolic blood pressure; and age at first menses.
Table 7.
Univariate and Multivariate Physiologic Screening Test Results for Eating-Disorders/Disordered-Eating (ED/DE) and OK Groups*
Prevalence Rates
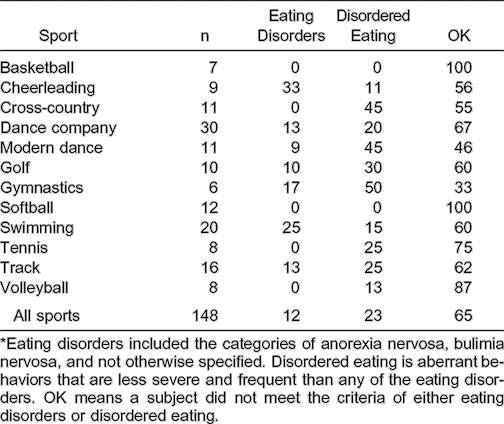
The highest prevalence rate of eating disorders was among cheerleaders (33%), while disordered eating occurred frequently among gymnasts (50%), modern dancers (45%), and cross-country athletes (45%) (Table 8). In basketball and softball, no athletes met criteria for eating disorder/disordered eating.
Table 8.
Prevalence Rates (Percentages)*
DISCUSSION
The primary purpose of this study—to develop and psychometrically evaluate a physiologic screening test for eating disorders/disordered eating among collegiate females engaged in athletic competition or highly athletic performances—was achieved. The epidemiologic analyses support the conclusions that the Physiologic Screening Test more accurately detected eating-disorders/disordered-eating athletes than either the Eating Disorders Inventory-2 or Bulimia Test-Revised. The Physiologic Screening Test was the only 1 of the 3 to meet the criteria of sensitivity ≥80% and specificity ≥75%. More specifically, the Physiologic Screening Test, in comparison with the 2 commercial tests, produced superior results for sensitivity (87%), false negatives (15%), negative predictive value (91%), yield (30%), accuracy (81%), and validity (64%). Specificity (78%) and positive predictive value (68%) were both respectable. The sensitivity and specificity for the Bulimia Test-Revised were 27% and 99% and for the Eating Disorders Inventory-2, 62% and 74%, respectively.
The superior specificity of the Bulimia Test-Revised was an artifact of the inferior and unacceptable sensitivity. Sensitivity and specificity proportions act counter to each other; as one increases, the other decreases, and vice versa. The Physiologic Screening Test has the distinction of correctly classifying ≥8 of 10 eating-disorders/disordered-eating female athletes and nearly 8 of 10 of those classified as OK. On the other hand, while the Bulimia Test-Revised correctly categorized almost all athletes who were classified as OK, it did so at the expense of correctly classifying only 3 eating-disorders/disordered-eating athletes out of 10, an unacceptably low performance measure for a screening test.
In defense of the Bulimia Test-Revised, it was designed as a screening test for bulimics only. However, based on our data, the Bulimia Test-Revised was not as accurate as the other 2 tests administered in screening athletes in any category including bulimia, which it was designed to test. The Eating Disorders Inventory-2 did better by correctly classifying ≥6 of 10 eating-disorders/disordered-eating athletes and ≥7 of 10 who were OK. The Eating Disorders Inventory-2 was inferior to the Physiologic Screening Test and was not specifically designed for female collegiate athletes, and its intent is clearer and more obvious.
A related question was how the physiologic test compared with other tests developed specifically for athletes and what advantages there were in using a physiologically oriented test. Although screening tests designed specifically for athletes are beginning to appear,56 the most psychometrically and statistically sophisticated test to date that is most comparable is the Athletic Milieu Direct Questionnaire.57 Sensitivity and specificity for the 19-item Athletic Milieu Direct Questionnaire are 80% and 75%, respectively, in comparison with the 18-item Physiologic Screening Test at 87% and 78%, respectively. The Athletic Milieu Direct Questionnaire items reflect psychosocial and athletic milieu behaviors relevant to weight management, diet, and exercise. Items based on physical signs and symptoms, however, may appear more objective and, therefore, apt to reduce response bias, especially if a physiologic test is included as part of a mandatory preparticipation medical examination and during follow-up visits.
The final choice about which test to use, the Athletic Milieu Direct Test or the Physiologic Screening Test, would be based on the educational background and academic training of the person administering the test. For example, a person with a psychosocial background would be more qualified to administer the Athletic Milieu Direct Test, and someone with a physiologic background, such as an athletic trainer, would be better suited to administer the Physiologic Screening Test. Availability of both tests is an advantage. Two-stage screening could be conducted either by administering the same test again after a specified period or by administering the tests sequentially.57 An advantage of 2-stage screening is that the total number tested the second time is fewer than the first time and, thereby, requires fewer resources, and the numbers of false positives and false negatives are diminished.57
Prevalence rates of eating disorders/disordered eating in the present study were high (n = 52, 35%). Approximately 1 in 3 female collegiate student athletes in this sample experienced some form of an eating disorder/disordered eating, which further substantiates the existence of a major public health problem among female athletes. Not surprisingly, almost twice as many athletes were classified as disordered eating (n = 34, 65%) versus eating disorders (n = 18, 35%), indicating a significantly greater percentage of disordered-eating versus eating-disordered subjects (Z = 2.22, P = .0264). Of the 18 who were eating disordered, the largest portions were bulimic (n = 13, 72%) and not otherwise specified (n = 4, 22%) versus anorexic (n = 1, 6%). Prevalence rates of eating disorders/disorder eating also were highest among sports that emphasize leanness and/or shape (gymnastics, modern dance, cross-country, and cheerleading), and the findings appear similar to those reported by Smolak et al.9 Prevalence rates in the present study may be higher because “not otherwise specified” and “disordered eating” were included as categories. Otherwise, the rates of anorexia nervosa and bulimia nervosa are similar to those in studies by other authors who used the Diagnostic and Statistical Manual of Mental Disorders DSM III-R/IV classification criteria. One such study was large scale, with 695 athletes representing 22 colleges and universities.2,58 Despite the controversy about true prevalence rates,10,36 the availability of a viable screening test is essential because many behaviors related to eating disorders/disordered eating are often not obvious. A viable screening test also is essential because it is a composite of behaviors that are of concern and not a single behavior in isolation; also, as signs and symptoms are fewer, detection is even more difficult. In addition, our data indicate that both eating disorders and disordered eating should be the focus because of the numbers classified in both categories.
It may be inadvisable to continue to assume that risk is restricted to sports in which leanness or a specific weight (or both) are important. In the present study, eating disorders/disordered eating were observed among athletes representing 10 of 12 (83%) sports. The only sports in which eating disorders/disordered eating were not observed were basketball and softball. Nevertheless, if personnel and money for screening are limited, then priority for screening might be given to those sports emphasizing leanness and body weight. Eating disorders/disordered eating were observed more than 2 times as often in these sports (n = 36, 69%) versus those sports that tend not to emphasize leanness and body weight (n = 16, 31%). Another interesting finding is that gymnasts were third, not first, in the proportion classified as eating disordered, although they were first in the proportion classified as disordered eating, as well as when the proportions for eating disorders and disordered eating were summed. These findings indicate that gymnasts should still be a high-priority, at-risk group.
It also may be unwise to assume that eating disorders/disordered eating are restricted to just elite athletes. The prevalence rates of eating disorders/disordered eating observed among nonelite athletes (club athletes and dancers, n = 24, 47%) in this study were nearly equivalent to those in elite Division I female athletes (n = 27, 53%). Local political factors required that nonelite athletes be included in our study because resources and services were disproportionate in comparison with elite athletes. Nonelite athletes may be just as committed to sport, follow similarly rigorous practice schedules, and have vocational ambitions to benefit from athletics akin to elite athletes; thus, it seems prudent to expand the research focus and clinical services to nonelite university and college athletes.
One contribution of this study was the use of physiologic plausibility as selection criteria for topic areas, which was supported by both the research literature and recommendations of experts. The salient question, however, was whether physiologic signs and symptoms collectively could be used to effectively screen for eating disorders/disordered eating. The answer to the question based on the present study results is affirmative. The best discriminating items were blood pressure, waist:hip ratio, percentage body fat, parotid-gland enlargement, menstrual history and frequency, weight history and perceptions of body weight, exercise habits after practice, frequency of bowel movements and normalcy of stools, pain and bloating in the abdomen, and dizziness when rising quickly.
Four potential limitations should be considered when interpreting the data. First, internal validity and response bias may be challenged because self-reported behaviors were solicited as part of the physiologic testing and in response to interview questions related to the Eating Disorder Examination. However, there is no reason to suspect, based on clinical observations, that participants responded untruthfully or in a socially desirable manner. Fourteen of the 18 items of the Physiologic Screening Test required a self-report response, but the purpose of the questions was ambiguous and difficult to detect because the focus was on physiologic factors (versus eating behaviors) and the questions appeared nonthematic. The remaining 4 assessments were physiologic and required no verbal response and, therefore, could not be altered by the respondent to suit social conditions or expectations. Response bias also was addressed by repeated assurances regarding confidentiality. Participants were told that candid answers were expected (and would be welcomed and prized). Otherwise, the project would be pointless and of no benefit. No penalties for candor would occur (eg, loss of team position or peer status), and the purpose was research, not fault finding. In addition, participants responded willingly and were abundantly forthcoming with replies.
Second, content validity might be questioned. Efforts were made to be thorough by concentrating on physiologic plausibility, examining the research literature to identify the most discriminating variables between subjects who were eating disordered and those who were not eating disordered, and consulting additional experts as to which physiologic variables should be included. In addition, 2 experts knowledgeable about physiology and eating disorders perused items to assess content validity, and both concurred that the items and approach were satisfactory.
Third, the results might be challenged on generalizability because only athletes from 1 major university were included. Application to Division I athletes with similar demographic characteristics as study participants should be acceptable with a precaution that the chance of a type I or type II error might be greater. These errors could be reduced by repeat screenings. A nationwide study of representative Division I, II, and III institutions is recommended. The research protocol should include at a minimum both the Physiologic Screening Test and Eating Disorder Examination to further validation.
Last, it might be argued that athletes with eating disorders/disordered eating avoided participation because athletes were volunteers and participation was voluntary. Although a possibility, there is no basis for this concern. The study was promoted as a sports-medicine study focusing on eating and exercise behaviors of athletes. If an athlete were aware of the true purpose of the study, it could equally be argued that those wanting help would participate because it was a rare opportunity to present issues related to eating disorders/disordered eating offered by an independent, unbiased, neutral source and to potentially receive assistance. The data also indicate that a substantial proportion of participants freely reported personal information related to the need for assistance. In addition, the number of nonparticipants (n = 27) was relatively small, and if the distribution of cases to categories matched those who participated in the study, the proportions would remain unchanged. If a greater proportion of nonparticipants had eating disorders/disordered eating, the results are conservative estimates and the problem is of even greater magnitude and concern than reported.
Two primary reasons exist for using the Physiologic Screening Test in future research. First, the magnitude of the problem of eating disorders/disordered eating needs to be verified nationwide. More precise estimates of prevalence rates based on criterion validity will bring further attention to the problems and issues among athletes, help change policies such as minimum body-weight requirements, prioritize safeguarding the health of athletes, and underscore the need for education. Second would be to use the categories operationalized in this study to further verify the prevalence of athletes who meet the criteria for each category. The categories could serve as a triage method and a viable means to devise appropriate primary, secondary, and tertiary prevention strategies specifically for athletes depending on the numbers involved and the magnitude and severity of the problem. Trends could be observed to denote progress or the need for greater or immediate attention. Because of the paucity of research, additional efforts should be devoted to developing interventions specifically for athletes.59,60
In summary, an important initial step has been completed to develop a physiologic screening test for Division I collegiate females engaged in athletic competition or highly athletic performances who are at risk for eating disorders/disordered eating. A physiologic screening test seems to have advantages in that response bias may be minimized and the test can be easily incorporated into preparticipation examinations, which may further aid in disguising the purpose of the test and thereby ameliorating validity. Validity also may be enhanced because the physiologic test provides an alternate form of a screening test that can be included as a part of repeat screening. This mechanism for early detection offers the opportunity to reduce or eliminate eating disorders/disordered eating and aid in fostering healthy collegiate athletic competition.
ACKNOWLEDGMENTS
This article is dedicated to the late Judy K. (Edson) Black. Judy was personally devoted to the advancement of health promotion through the encouragement and mentoring of promising graduate students who were committed to making a difference and changing behaviors related to diet and exercise. Over the course of nearly 2 decades, she gave her time and shared her home, positive spirit, and sincere care to enhance the professional preparation and development of many dozens of students. She was well known, respected, and revered for her service and dedication to students and their personal growth and development and professional achievements.
The project reported and article are a result of research funded by the National Athletic Trainers' Association (NATA) and 2 NATA-REF grants (project 0395-B007). In addition to the NATA, we thank Dr Stephen Badylak, former Head Team Physician, and Denny Miller, Head Athletic Trainer, for their help and support. We also acknowledge the contributions of James Larkin and Lisa (Lauer) Chrysler for their help with subject recruitment and data collection. We are extremely grateful to Deborah L. Nagel for helping to list criteria for subject classification, interviewing, collection and tabulation of data, and editing.
The authors have a proprietary interest in the Physiologic Screening Test.
REFERENCES
- 1.Otis CL, Drinkwater B, Johnson M, Loucks A, Wilmore J. American College of Sports Medicine position stand: the female athlete triad. Med Sci Sports Exerc. 1997;29:i–ix. doi: 10.1097/00005768-199705000-00037. [DOI] [PubMed] [Google Scholar]
- 2.Burckes-Miller ME, Black DR. Male and female college athletes: prevalence of anorexia nervosa and bulimia nervosa. Athl Train J Natl Athl Train Assoc. 1988;23:137–140. [Google Scholar]
- 3.Black DR, editor. Eating Disorders Among Athletes: Theory, Issues, and Research. Reston, VA: American Alliance for Health, Physical Education, Recreation and Dance; 1991. pp. 1–10. [Google Scholar]
- 4.Black DR, Burckes-Miller ME. Male and female college athletes: use of anorexia nervosa and bulimia nervosa weight loss methods. Res Q Exerc Sport. 1988;59:252–256. [Google Scholar]
- 5.Burckes-Miller ME, Black DR. Behaviors and attitudes associated with eating disorders: perceptions of college athletes about food and weight. Health Educ Res Theory Pract. 1988;3:203–208. [Google Scholar]
- 6.Comerci GD. Medical complications of anorexia nervosa and bulimia nervosa. Med Clin North Am. 1990;74:1293–1310. doi: 10.1016/s0025-7125(16)30517-x. [DOI] [PubMed] [Google Scholar]
- 7.Wilson JMG, Jungner F. Principles and practice of screening for disease. Public Health Pap. 1968;34:1–163. [Google Scholar]
- 8.Timmreck TC. An Introduction to Epidemiology. 3rd ed. Sudbury, MA: Jones and Bartlett; 2002. pp. 337–372. [Google Scholar]
- 9.Smolak L, Murnen SK, Ruble AE. Female athletes and eating problems: a meta-analysis. Int J Eat Disord. 2000;27:371–380. doi: 10.1002/(sici)1098-108x(200005)27:4<371::aid-eat1>3.0.co;2-y. [DOI] [PubMed] [Google Scholar]
- 10.Brownell KD, Rodin J. Prevalence of eating disorders in athletes. In: Brownell KD, Rodin J, Wilmore JH, editors. Eating, Body Weight and Performance in Athletes: Disorders of Modern Society. Philadelphia, PA: Lea & Febiger; 1992. pp. 128–145. [Google Scholar]
- 11.American Psychiatric Association. Diagnostic and Statistical Manual of Mental Disorders DSM IV. Washington, DC: American Psychiatric Association; 1994. pp. 539–550. [Google Scholar]
- 12.Brownell KD, Steen SN, Wilmore JH. Weight regulation practices in athletes: analysis of metabolic and health effects. Med Sci Sports Exerc. 1987;19:546–556. [PubMed] [Google Scholar]
- 13.Ogren FP, Huerter JV, Pearson PH, Antonson CW, Moore GF. Transient salivary gland hypertrophy in bulimics. Laryngoscope. 1987;97:951–953. [PubMed] [Google Scholar]
- 14.Abraham SF, Beumont PJV. How patients describe bulimia or binge eating. Psychol Med. 1982;12:625–635. doi: 10.1017/s0033291700055732. [DOI] [PubMed] [Google Scholar]
- 15.Barrow GW, Saha S. Menstrual irregularity and stress fractures in collegiate female distance runners. Am J Sports Med. 1988;16:209–216. doi: 10.1177/036354658801600302. [DOI] [PubMed] [Google Scholar]
- 16.Brooks-Gunn J, Warren MP, Hamilton LH. The relation of eating problems and amenorrhea in ballet dancers. Med Sci Sports Exerc. 1987;19:41–44. [PubMed] [Google Scholar]
- 17.Gadpaille WJ, Sanborn CF, Wagner WW., Jr Athletic amenorrhea, major affective disorders, and eating disorders. Am J Psychiatry. 1987;144:939–942. doi: 10.1176/ajp.144.7.939. [DOI] [PubMed] [Google Scholar]
- 18.Halmi KA, Fry M. Serum lipids in anorexia nervosa. Biol Psychiatry. 1974;8:159–167. [PubMed] [Google Scholar]
- 19.Jacobs MB, Schneider JA. Medical complications of bulimia: a prospective evaluation. Q J Med. 1985;54:177–182. [PubMed] [Google Scholar]
- 20.Kaplan AS. Hyperamylasemia and bulimia: a clinical review. Int J Eat Disord. 1987;6:537–543. [Google Scholar]
- 21.Kaplan AS, Woodside DB. Biological aspects of anorexia nervosa and bulimia nervosa. J Consult Clin Psychol. 1987;55:645–653. doi: 10.1037//0022-006x.55.5.645. [DOI] [PubMed] [Google Scholar]
- 22.King A. Primary and secondary anorexia nervosa syndromes. Br J Psychiatry. 1963;109:470–479. doi: 10.1192/bjp.109.461.470. [DOI] [PubMed] [Google Scholar]
- 23.Levin AP, Hyler SE. DSM-III personality diagnosis in bulimia. Compr Psychiatry. 1986;27:47–53. doi: 10.1016/0010-440x(86)90068-4. [DOI] [PubMed] [Google Scholar]
- 24.Marcos A, Varela P, Santacruz I, Munoz-Velez S, Morande G. Nutritional status and immunocompetence in eating disorders: a comparative study. Eur J Clin Nutr. 1993;47:787–793. [PubMed] [Google Scholar]
- 25.Mitchell JE, Hatsukami D, Eckert ED, Pyle RL. Characteristics of 275 patients with bulimia. Am J Psychiatry. 1985;142:482–485. doi: 10.1176/ajp.142.4.482. [DOI] [PubMed] [Google Scholar]
- 26.Mitchell JE, Pyle RL, Eckert ED, Hatsukami D, Lentz R. Electrolyte and other physiological abnormalities in patients with bulimia. Psychol Med. 1983;13:273–278. doi: 10.1017/s0033291700050881. [DOI] [PubMed] [Google Scholar]
- 27.Palla B, Litt IF. Medical complications of eating disorders in adolescents. Pediatrics. 1988;81:613–623. [PubMed] [Google Scholar]
- 28.Philipp E, Willershausen-Zonnchen B, Hamm G, Pirke KM. Oral and dental characteristics in bulimia and anorexia patients. Int J Eat Disord. 1991;10:423–431. [Google Scholar]
- 29.Pirke KM, Fichter MM, Chlond C, et al. Disturbances of the menstrual cycle in bulimia nervosa. Clin Endocrinol (Oxf) 1987;27:245–251. doi: 10.1111/j.1365-2265.1987.tb01150.x. [DOI] [PubMed] [Google Scholar]
- 30.Pops MA, Schwabe AD. Hypercarotenemia in anorexia nervosa. JAMA. 1968;205:533–534. [PubMed] [Google Scholar]
- 31.Pyle RL, Mitchell JE, Eckert ED. Bulimia: a report of 34 cases. J Clin Psychiatry. 1981;42:60–64. [PubMed] [Google Scholar]
- 32.Schwabe AD, Lippe BM, Chang RJ, Pops MA, Yager J. Anorexia nervosa. Ann Intern Med. 1981;94:371–381. doi: 10.7326/0003-4819-94-3-371. [DOI] [PubMed] [Google Scholar]
- 33.Silverman JA. Anorexia nervosa: clinical observations in a successful treatment plan. J Pediatr. 1974;84:68–73. doi: 10.1016/s0022-3476(74)80555-x. [DOI] [PubMed] [Google Scholar]
- 34.Warren MP, Vande Wiele RL. Clinical and metabolic features of anorexia nervosa. Am J Obstet Gynecol. 1973;117:435–449. doi: 10.1016/0002-9378(73)90053-7. [DOI] [PubMed] [Google Scholar]
- 35.Beals KA, Brey RA, Gonyou JB. Understanding the female athlete triad: eating disorders, amenorrhea, and osteoporosis. J Sch Health. 1999;69:337–340. doi: 10.1111/j.1746-1561.1999.tb06425.x. [DOI] [PubMed] [Google Scholar]
- 36.Garner DM, Rosen LW, Barry D. Eating disorders among athletes: research and recommendations. Child Adolesc Psychiatr Clin North Am. 1998;7:839–857. [PubMed] [Google Scholar]
- 37.Nunnally JC. Psychometric Theory. 2nd ed. New York, NY: McGraw-Hill; 1978. pp. 594–596. [Google Scholar]
- 38.Johnson MD. Tailoring the preparticipation exam to female athletes. Physician Sportsmed. 1992;20(7):60–72. doi: 10.1080/00913847.1992.11947449. [DOI] [PubMed] [Google Scholar]
- 39.Mitchell JE, Seim HC, Colon E, Pomeroy C. Medical complications and medical management of bulimia. Ann Intern Med. 1987;107:71–77. doi: 10.7326/0003-4819-107-1-71. [DOI] [PubMed] [Google Scholar]
- 40.Jackson AS, Pollock ML, Ward A. Generalized equations for predicting body density of women. Med Sci Sports Exerc. 1980;12:175–181. [PubMed] [Google Scholar]
- 41.Nieman DC. Fitness and Sports Medicine: A Health Related Approach. 3rd ed. Palo Alto, CA: Bull Publishing Co; 1995. pp. 66–70.pp. 141–143. [Google Scholar]
- 42.Hill MN, Grim CM. How to take a precise blood pressure. Am J Nurs. 1991;91:38–42. [PubMed] [Google Scholar]
- 43.Garner DM. Eating Disorders Inventory-2. Odessa, FL: Psychological Assessment Resources, Inc; 1994. [Google Scholar]
- 44.Thelen MH, Farmer J, Wonderlich S, Smith MA. Revision of the Bulimia Test: the BULIT-R. Psychol Assess. 1991;3:119–124. [Google Scholar]
- 45.Garner DM, Olmstead MP, Polivy J. Development and validation of a multidimensional eating disorder inventory for anorexia nervosa and bulimia. Int J Eat Disord. 1983;2:15–34. [Google Scholar]
- 46.Garner DM. Measurement of eating disorder psychotherapy. In: Brownell KD, Fairburn CG, editors. Eating Disorders and Obesity: A Comprehensive Handbook. New York, NY: The Guilford Press; 1995. pp. 191–196. [Google Scholar]
- 47.American Psychiatric Association. Diagnostic and Statistical Manual of Mental Disorders DSM III-R. Washington, DC: American Psychiatric Association; 1987. pp. 65–71. [Google Scholar]
- 48.Brelsford TN, Hummel RM, Barrios BA. The Bulimia Test-Revised: a psychometric investigation. Psychol Assess. 1992;4:399–401. [Google Scholar]
- 49.Fairburn CG, Cooper Z. The Eating Disorder Examination, 12.0D. In: Fairburn CG, Wilson GT, editors. Binge Eating: Nature, Assessment, and Treatment. New York, NY: Guilford Press; 1993. pp. 317–360. [Google Scholar]
- 50.Wilson GT, Smith D. Assessment of bulimia nervosa and evaluation of the Eating Disorder Examination. Int J Eat Disord. 1989;8:173–179. [Google Scholar]
- 51.Rosen JC, Vara L, Wendt S, Leitenberg H. Validity studies of the Eating Disorders Exam. Int J Eat Disord. 1990;11:111–120. [Google Scholar]
- 52.Cooper Z, Cooper PJ, Fairburn CG. The validity of the Eating Disorder Examination and its subscales. Br J Psychiatry. 1989;154:807–812. doi: 10.1192/bjp.154.6.807. [DOI] [PubMed] [Google Scholar]
- 53.Gunning R. The Technique of Clear Writing. New York, NY: McGraw-Hill; 1952. pp. 1–27. [Google Scholar]
- 54.Cohen J. Statistical Power Analysis for the Behavioral Sciences. Revised ed. New York, NY: Academic Press; 1977. pp. 27–29. [Google Scholar]
- 55.Friis RH, Sellers TA. Epidemiology for Public Health Practice. 2nd ed. Gaithersburg, MD: Aspen Publishers; 1999. pp. 318–320. [Google Scholar]
- 56.McNulty KY, Adams CH, Anderson JM, Affenito SG. Development and validation of a screening test to identify eating disorders in female athletes. J Am Diet Assoc. 2001;101:886–892. doi: 10.1016/S0002-8223(01)00218-8. [DOI] [PubMed] [Google Scholar]
- 57.Nagel DL, Black DR, Leverenz LJ, Coster DC. Evaluation of a screening test for female college athletes with eating disorders and disordered eating. J Athl Train. 2000;35:431–440. [PMC free article] [PubMed] [Google Scholar]
- 58.Sundgot-Borgen J. Prevalence of eating disorders in elite female athletes. Int J Sport Nutr. 1993;3:29–40. doi: 10.1123/ijsn.3.1.29. [DOI] [PubMed] [Google Scholar]
- 59.Abood DA, Black DR. Health education prevention for eating disorders among college female athletes. Am J Health Behav. 2000;24:209–219. [Google Scholar]
- 60.Abood DA, Black DR, Birnbaum RD. Nutrition education intervention for college female elite athletes. J Nutr Educ Behav. In press doi: 10.1016/s1499-4046(06)60150-4. [DOI] [PubMed] [Google Scholar]