GWAS Findings for Human Iris Patterns: Associations with Variants in Genes that Influence Normal Neuronal Pattern Development (original) (raw)
Abstract
Human iris patterns are highly variable. The origins of this variation are of interest in the study of iris-related eye diseases and forensics, as well as from an embryological developmental perspective, with regard to their possible relationship to fundamental processes of neurodevelopment. We have performed genome-wide association scans on four iris characteristics (crypt frequency, furrow contractions, presence of peripupillary pigmented ring, and number of nevi) in three Australian samples of European descent. Both the discovery (n = 2121) and replication (n = 499 and 73) samples showed evidence for association between (1) crypt frequency and variants in the axonal guidance gene SEM_A3A_ (p = 6.6 × 10⁻¹¹), (2) furrow contractions and variants within the cytoskeleton gene TRAF3IP1 (p = 2.3 × 10⁻¹²), and (3) the pigmented ring and variants in the well-known pigmentation gene SLC24A4 (p = 7.6 × 10⁻²¹). These replicated findings individually accounted for around 1.5%–3% of the variance for these iris characteristics. Because both SEMA3A and TRAFIP1 are implicated in pathways that control neurogenesis, neural migration, and synaptogenesis, we also examined the evidence of enhancement among such genes, finding enrichment for crypts and furrows. These findings suggest that genes involved in normal neuronal pattern development may also influence tissue structures in the human iris.
Main Text
Using genotyped SNPs to predict complex iris phenotypes1 has proved to be very successful in studies with European samples. So far, 48 SNPs in 11 different regions have been significantly associated with eye (iris) color, and a combination of six of these is able to predict blue-, green/hazel-, and brown-colored eyes with an overall accuracy of 91%, 72%, and 93%, respectively,2–4 demonstrating feasibility for forensic applications.5 Furthermore, pigmentation SNPs in ASIP (MIM 600201), TYR (MIM 606933), TYRP1 (MIM 115501), MC1R (MIM 155555), OCA2 (MIM 611409), and SLC45A2 (MIM 606202) account for 12% of the familial risk of malignant melanoma (MIM 155600) in sun-exposed populations of European decent.6 However, very little is known about genes that influence iris characteristics other than eye color. These additional phenotypes are worthy of attention, because the embryological origin of the iris makes it ideal for studying genes that are expressed early in development of the neural crest and neural ectoderm,7 believed to be of importance for both ophthalmological and neurological diseases. For example, mutations in PAX6 (MIM 607108) have been found to cause aniridia (partial or complete loss of the iris)8 (MIM 106210) as well as neural loss in the frontal lobe,9,10 and tissue markers in the iris have been associated with neurological diseases, including Down syndrome11 (MIM 190685), neurofibromatosis type 112 (MIM 162200), and Gillespie syndrome13,14 (MIM 206700), suggesting that development of the iris and the brain may be linked. Dysfunctional development of the cell layers in the iris also contributes to ocular melanoma15,16 (MIM 155720), glaucoma17,18 (MIM 137750, 231300, 137760], pigment dispersion (MIM 600510), pseudoexfoliation syndrome19 (MIM 177650) and Axenfeld-Rieger syndrome18 (MIM 62482, 80500) (other iris-related eye diseases are listed in NIEBank). We used a GWAS approach to identify genes associated with texture and pigment characteristics of the human iris and to explore the involvement of these genes in pathways for normal neurodevelopment.
We conducted a multistage study of 2693 individuals to detect genetic variation in four general iris characteristics. The discovery sample, consisting of 1652 individuals (age range 9–23 years, mean 13.23, SD 1.83) from the Brisbane Adolescent Twin Study (BATS) and 469 individuals (age range 5–50 years, mean 17.28, SD 10.49) from the Twin Eye Study in Tasmania (TEST). We validated the results from the discovery sample, using two independent replication samples. We directly genotyped the nine most promising SNPs in an independent replication sample of 499 Australian adolescent twins and siblings (age range 9–20 years, mean 13.50, SD 1.96), and conducted in silico replication in a second independent GWAS sample in which phenotypes were available for 73 individuals (age range 5–19 years, mean 10.76, SD 4.14). A full description of the Australian twin cohorts is given elsewhere.20,21 All three samples were drawn from the general population. All participants provided written informed consent, and the studies were approved by the respective local research ethics committees. An overview of the samples is presented in Table 1.
Table 1.
Overview of Discovery and Replication Twin-Family Samples Used for GWAS of Iris Pattern Phenotypes and of the Reduced Samples of Independent Subjects used for Polygenic Prediction Analyses
| Sample | MZ Twins | DZ Twins | Other Sibling | N of Families | Mean Family Size | Effective Sample Size | No. of SNPs Tested |
|---|---|---|---|---|---|---|---|
| GWAS and VEGAS Analyses | |||||||
| Discovery Sample: BATS | 500 | 907 | 245 | 745 | 2.21 | 1652 | 2,383,268b |
| Discovery Sample: TEST | 190 | 255 | 24 | 244 | 1.92 | 469 | 2,383,268b |
| Replication Sample 1 | 127 | 242 | 130 | 222 | 2.24 | 499 | 11c |
| Replication Sample 2d | 29 | 27 | 17 | 41 | 1.78 | 73 | 9b |
| Polygenic Prediction Analysesa | |||||||
| Discovery Sample: BATS | 251 | 440 | - | 691 | 1.00 | 691 | 383b |
| Discovery Sample: TEST | 96 | 133 | - | 229 | 1.00 | 229 | 383b |
| Replication Sample 2d | 15 | 21 | - | 36 | 1.00 | 36 | 383b |
Genotyping was performed with Illumina HumanHap 610W Quad arrays. Genotypic data were screened through a series of quality control criteria, including Mendelian errors, minor allele frequency (MAF) ≥ 1%, p-value of a Hardy-Weinberg equilibrium (HWE) test ≥ 10−6, SNP call rate > 95%, and Illumina Beadstudio GenCall score ≥ 0.7. We screened the genotypic data for ancestral outliers by using principal-component analysis,22 comparing the genotyped data in the discovery sample with 16 global populations sourced from HapMap Phase 3 and Northern European subpopulations from a previous study.23 Approximately 2% of the samples were excluded as ancestral outliers. As described elsewhere,24 the genotypic data were imputed to HapMap CEU I+II (release 22, build 36) with the use of MACH with a set of 274,604 SNPs that were common to the seven waves of genotyping available when this project began at QIMR.24 The same quality control pipeline was used to clean the genotypic data of the second replication sample, resulting in a set of 469,117 SNPs that were used for imputation via the same procedures that were used in the discovery sample. After quality control (r2 ≥ 0.3; MAF ≥ 0.01; HWE p > 10−6), the imputed data in the discovery sample and in replication sample 2 contained 2,383,268 and 2,379,931 SNPs, respectively.
The phenotypes used within this study were derived from close-up high-resolution digital color photos of the iris. Four ordinal scales, depicted in Figures 1–4, were used by M.L. to rate the iris characteristics of interest: crypt frequency (Figure 1) measures different degrees of hypoplasia in the two top cell layers in the iris (i.e., anterior border layer and underlying stroma), the extension and evenness of the peripupillary pigmented ring (Figure 2) indexes the amount of melanin that circumscribes the pupil, the distinction and extension of furrow contractions (Figure 3) is a measure of the overall thickness of the iris, and frequency of iris nevi (Figure 4) is a measure of the number of melanin accumulations on the anterior border layer. The scale construction, the rating procedure, and the interrater reliability of the rating procedure have been reported in detail elsewhere.25 The photos of each participant's right and left iris were viewed simultaneously by the rater during the rating procedure. However because the polychoric correlations for the iris characteristics from the right or left iris ranged from 0.91 to 0.95 (Table S1 available online), only ratings for the right iris were used in the genetic analysis.
Figure 1.
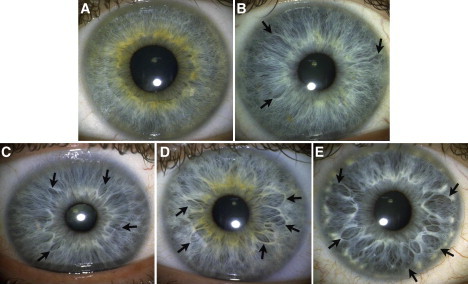
Crypt Frequency
Crypt frequency measures the degree of hypoplasia in the two top cell layers in the iris; i.e., the anterior border layer and the underlying stroma. The arrows indicate examples of crypt markings of interest in the iris tissue. The categories above depict (A) only parallel and/or densely packed curly fibers, (B) spots of wavy fibers and 1–3 shallow crypts, (C) at least four shallow crypts, (D) at least five marked crypts and/or a tissue texture that is more permeable than in category 3, (E) at least four large crypts that extend at least 2/3 of the distance between the collarette and the periphery of the iris.
Figure 2.
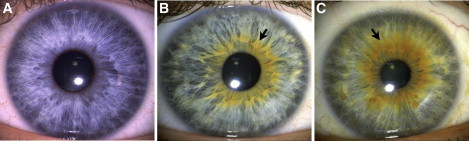
Extension and Evenness of the Pigmented Ring
The pigmented ring measures the amount of melanin that surrounds the pupil and distinguishes different shades of green and hazel eye color (91% of people judged to have a green or hazel eye color by a distant observer in this sample had a pigmented ring). The categories above depict (A) the absence of a pigmented ring; (B) an uneven pigmented ring, covering 18–348 degrees; (C) an even pigmented ring, covering > 348 degrees.
Figure 3.
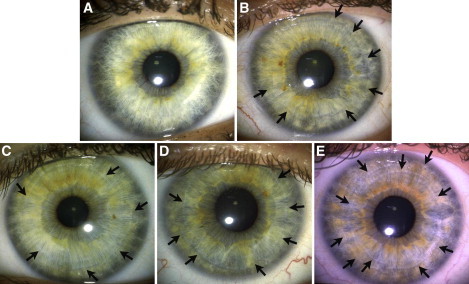
Distinction and Extension of Furrow Contractions
Furrows manifest as the result of a tendency of the iris to fold in exactly the same location each time the iris adapts to different light conditions. They relate to the overall thickness and density of the iris (thicker irises have more extended furrows). The arrows indicate example of furrows on the iris. The categories above depict (A) the absence of furrows, or short furrows extending < 90 degrees; (B) furrows extending between 90 and 288 degrees; (C) distinct furrows, extending at least 288 degrees; (D) more marked furrows than in category 3, extending at least 324 degrees; (E) at least two concentric furrows, with a primary furrow of > 324 degrees and a second furrow of > 288 degrees.
Figure 4.
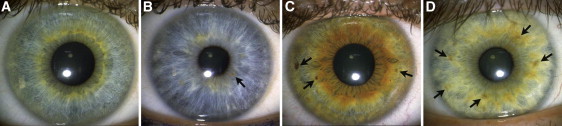
Frequency of Iris Nevi
Iris nevi are melanin accumulations on the anterior border layer. The arrows point to examples of iris nevi. The categories above depict (A) the absence of iris nevi, (B) at least one iris nevus, (C) at least three iris nevi, (D) at least five iris nevi.
To establish the test-retest reliabilities of the ratings in this sample, a representative sample of 400 iris photos of crypts, furrows, and nevi were rated twice by the first author, five weeks apart, the second rating blind to the first. For the pigment ring, a randomized subsample of 982 iris photos was rated independently by M.L. and R.A.S. The polychoric test-retest and interobserver reliabilities ranged from 0.91 to 0.96 (Table S1). The distributions of the iris characteristics in the discovery and replication samples are presented in Table S2. Because relatively few participants had iris characteristics that corresponded with the highest categories, the data were recoded to produce three categories for crypts and furrows and two for iris nevi.
The phenotypic correlations between the iris characteristics for males and females are shown in Table S3. For estimation of the heritability of the iris characteristics in our sample, heritability analyses were undertaken in the context of a classical twin design with the use of standard structural equation modeling techniques for analysis of the data from monozygotic (MZ) and dizygotic (DZ) twin pairs in the discovery sample.26 To enable the analysis of the ordinal data, we used a multifactorial threshold model, which assumes that the observed data reflect an underlying continuous distribution that cannot be quantified but arises from the sum of numerous factors of small effect. Under this model, the ordered classes are parameterized as thresholds required to divide a standard normal distribution into categories with cumulative probability equal to the frequency of the categories in the observed data. The best-fitting model incorporating additive (A) and nonadditive (D) genetic and individual environment (E) variance components are presented in Table S4. The broad-sense heritabilities for crypt, furrows, pigmented ring, and iris nevi were 84%, 87%, 93%, and 71%, respectively, somewhat higher than previously reported for these scales in a German twin sample.25 Furthermore, age and sex differences were observed for the threshold estimates: males scored higher than females on crypts, but they received somewhat lower scores on nevi, furrows, and the pigmented ring than females. Despite the fairly narrow age range of our sample (87.6% of the sample were between 10 and 16 years), older participants also tend to receive higher scores on nevi and furrows than younger participants, but no age differences were found for the other iris characteristics.
GWAS analyses in the discovery stage were conducted with the use of quality-controlled hard-call genotypes in MERLIN (fastassoc),27 which controls for family structure and zygosity by modeling kinship within each family.28 We included sex, age, eye color, and the six SNPs in HERC2 (MIM 605837) and OCA2 that have been shown to be most strongly associated with eye color (rs12913832, rs7183532, rs7495174, rs11852452, rs7179994, rs7183877) as covariates in the GWAS analysis.6
In the second stage of the study, we examined evidence for replication by genotyping the nine most promising SNPs in an independent replication sample (replication1) and through in silico replication of a small independent GWAS sample. For both replication samples, the analyses were conducted with MERLIN. The results from the three samples were combined using an inverse standard-error-weighted meta-analysis within METAL.29
The results for the strongest association signals in the discovery sample as well as the result in the replication samples and the meta-analysis are presented in Table 2. The third strongest association signal for crypts in the discovery sample, rs10235789 (7q21.11; p = 2.7 × 10⁻⁶), was supported in both replication samples (p = 2.0 × 10⁻⁴ and p = 2.5 × 10⁻³), with meta-analysis of the three samples yielding a p value of 6.6 × 10⁻¹¹ (Figure S1). rs10235789 is located in intron 6 of SEM_A3A_, which has previously been associated with schizophrenia30,31 (MIM 181500) and the progression of Alzheimer disease32 (MIM 104300). SEM_A3A_ inhibits the migration of the neural crest cells that grow into the periocular region to form the pupillary membrane, which later develops into the anterior border layer and stroma in the iris, these being the cell layers where crypts occur.7,33 Thus, it is likely that SEM_A3A_, which in the brain influences apical dendritic growth and can function as either a chemorepulsive or chemoattractive agent for axonal outgrowth,34 also influences processes that contribute to the formation of crypts in the human iris. About 1.5% of the variance for crypts could be explained by the replicated SNP findings on 7q21.11 (rs10235789). A number of other promising association signals were observed in the discovery sample (rs13140875, rs205611, rs10874518). However, these results were not replicated in the other two samples.
Table 2.
Results for the Strongest Association Signals in the Discovery Sample, Association in Replication Sample 1 and Replication Sample 2, and the Meta-Analyses of These Samples
| Sample | MAF Alleles (Effect Null) | Crypts | Furrows | Pigmented Ring | Iris Nevi | ||||||||||||||
|---|---|---|---|---|---|---|---|---|---|---|---|---|---|---|---|---|---|---|---|
| P | β | SE | r2 (%) | P | β | SE | r2 (%) | P | β | SE | r2 (%) | P | β | SE | r2 (%) | ||||
| rs13140875 (Closest Gene: ANXA10) | |||||||||||||||||||
| D | 0.13 | T | C | 9.7 × 10⁻⁸ | 0.16 | 0.03 | 1.55 | 0.100 | −0.06 | 0.03 | 0.15 | 0.270 | 0.03 | 0.03 | 0.07 | 0.310 | 0.02 | 0.02 | 0.06 |
| R1 | 0.13 | T | C | 0.045 | −0.12 | 0.06 | 0.85 | 0.700 | 0.03 | 0.08 | 0.03 | 0.870 | 0.01 | 0.08 | 0.01 | 0.190 | 0.06 | 0.04 | 0.36 |
| R2 | 0.10 | T | C | 0.292 | −0.18 | 0.17 | 2.51 | 0.759 | 0.06 | 0.21 | 0.21 | 0.349 | −0.13 | 0.14 | 1.99 | 0.606 | 0.05 | 0.09 | 0.51 |
| MA | T | C | 2.5 × 10⁻⁴ | 0.10 | 0.03 | − | 0.091 | −0.05 | .03 | − | 0.436 | 0.02 | 0.03 | − | 0.100 | 0.03 | 0.02 | − | |
| rs205611 (Closest Gene: AC007387.1) | |||||||||||||||||||
| D | 0.19 | A | G | 2.1 × 10⁻⁶ | −0.13 | 0.03 | 1.43 | 1.3 × 10⁻⁴ | 0.10 | 0.03 | 0.66 | 0.330 | 0.03 | 0.03 | 0.06 | 0.500 | −0.01 | 0.02 | 0.03 |
| R1 | 0.19 | A | G | 0.190 | −0.07 | 0.05 | 0.35 | 0.480 | −0.05 | 0.07 | 0.10 | 0.250 | −0.07 | 0.07 | 0.26 | 0.290 | −0.04 | 0.04 | 0.23 |
| R2 | 0.25 | A | G | 1.1 × 10⁻² | −0.30 | 0.12 | 9.36 | 0.915 | −0.01 | 0.15 | 0.02 | 0.495 | −0.06 | 0.10 | 0.68 | 0.922 | 0.01 | 0.06 | 0.01 |
| MA | A | G | 1.2 × 10⁻⁶ | −0.12 | 0.03 | − | 6.4 × 10⁻³ | 0.07 | 0.03 | − | 0.729 | 0.01 | 0.03 | − | 0.418 | −0.02 | 0.02 | − | |
| rs10235789 (Closest Gene: SEMA3A) | |||||||||||||||||||
| D | 0.42 | C | T | 2.7 × 10⁻⁶ | 0.10 | 0.02 | 1.27 | 9.3 × 10⁻⁵ | −0.09 | 0.02 | 0.86 | 0.620 | −0.01 | 0.02 | 0.01 | 0.540 | −0.01 | 0.01 | 0.02 |
| R1 | 0.50 | C | T | 2.0 × 10⁻⁴ | 0.15 | 0.04 | 2.92 | 0.750 | −0.02 | 0.05 | 0.02 | 0.200 | 0.07 | 0.05 | 0.35 | 0.096 | 0.05 | 0.03 | 0.59 |
| R2 | 0.42 | C | T | 2.5 × 10⁻³ | 0.27 | 0.10 | 13.9 | 1.3 × 10⁻² | −0.30 | 0.12 | 9.54 | 0.384 | −0.07 | 0.08 | 1.17 | 0.349 | −0.05 | 0.05 | 1.02 |
| MA | C | T | 6.6 × 10⁻¹¹ | 0.12 | 0.02 | − | 3.2 × 10⁻⁶ | −0.09 | 0.02 | − | 0.886 | −0.01 | 0.02 | − | 0.548 | −0.01 | 0.01 | − | |
| rs2189849, rs1357813a, rs2189849 (Closest Gene: SEMA3A) | |||||||||||||||||||
| D | 0.29 | C | A | 3.1 10−5 | 0.10 | 0.02 | 0.97 | 2.1 × 10⁻³ | −0.08 | 0.03 | 0.53 | 0.680 | −0.01 | 0.02 | 0.01 | 0.170 | −0.02 | 0.02 | 0.10 |
| R1 | 0.27 | A | T | 0.680 | −0.02 | 0.05 | 0.03 | 0.620 | −0.03 | 0.06 | 0.06 | 0.920 | −0.01 | 0.06 | 0.00 | 0.530 | −0.02 | 0.04 | 0.09 |
| R2 | 0.22 | C | A | 0.128 | 0.17 | 0.12 | 4.33 | 0.403 | −0.12 | 0.14 | 1.32 | 0.555 | 0.06 | 0.10 | 0.66 | 0.927 | 0.01 | 0.06 | 0.01 |
| MA | C | A | 3.2 × 10⁻⁶ | 0.09 | 0.02 | − | 6.5 × 10⁻³ | −0.07 | 0.03 | − | 0.685 | −0.01 | 0.02 | − | 0.306 | −0.02 | 0.02 | − | |
| rs4732540 (Closest Gene: SEMA3A) | |||||||||||||||||||
| D | 0.49 | A | G | 8.5 × 10⁻⁵ | 0.02 | 0.02 | 0.86 | 6.1 × 10⁻³ | −0.06 | 0.02 | 0.42 | 0.990 | 0.00 | 0.02 | 0.00 | 0.260 | −0.02 | 0.01 | 0.07 |
| R1 | 0.46 | A | G | 0.140 | 0.06 | 0.04 | 0.45 | 0.090 | −0.09 | 0.05 | 0.60 | 0.160 | −0.07 | 0.05 | 0.41 | 0.210 | −0.04 | 0.03 | 0.33 |
| R2 | 0.36 | A | G | 0.368 | 0.08 | 0.09 | 1.13 | 0.593 | −0.06 | 0.11 | 0.40 | 0.422 | −0.06 | 0.07 | 0.91 | 0.280 | −0.05 | 0.05 | 1.31 |
| MA | A | G | 0.088 | 0.03 | 0.02 | − | 4.7 × 10⁻⁴ | −0.06 | 0.02 | − | 0.470 | −0.01 | 0.02 | − | 0.014 | −0.02 | 0.01 | − | |
| rs10874518 (Closest Gene: OLFM3) | |||||||||||||||||||
| D | 0.35 | A | C | 3.5 × 10⁻⁶ | −0.10 | 0.02 | 1.26 | 0.840 | 0.01 | 0.03 | 0.00 | 0.970 | −0.00 | 0.02 | 0.00 | 0.460 | −0.01 | 0.01 | 0.03 |
| R1 | 0.36 | A | C | 0.330 | 0.04 | 0.04 | 0.18 | 0.320 | −0.05 | 0.05 | 0.19 | 0.160 | 0.07 | 0.05 | 0.39 | 0.340 | −0.03 | 0.03 | 0.17 |
| R2 | 0.36 | A | C | 0.401 | 0.09 | 0.11 | 1.23 | 0.358 | −0.12 | 0.13 | 1.48 | 0.105 | 0.14 | 0.09 | 4.61 | 0.552 | −0.03 | 0.06 | 0.52 |
| MA | A | C | 1.2 × 10⁻⁴ | −0.07 | 0.02 | − | 0.686 | −0.01 | 0.03 | − | 0.410 | 0.02 | 0.02 | − | 0.184 | −0.01 | 0.01 | − | |
| rs3739070, rs11900963b, rs3739070 (Closest Gene: TRAF3IP1) | |||||||||||||||||||
| D | 0.08 | A | C | 4.1 × 10⁻³ | −0.11 | 0.04 | 0.47 | 6.2 × 10⁻⁸ | 0.24 | 0.04 | 1.70 | 0.460 | −0.03 | 0.04 | 0.03 | 0.170 | 0.04 | 0.03 | 0.11 |
| R1 | 0.13 | A | T | 5.8 × 10⁻⁵ | −0.28 | 0.07 | 3.39 | 1.3 × 10⁻⁴ | 0.34 | 0.09 | 3.07 | 0.370 | 0.08 | 0.09 | 0.17 | 0.540 | 0.03 | 0.05 | 0.10 |
| R2 | 0.07 | A | C | 0.189 | −0.27 | 0.21 | 3.86 | 0.654 | 0.12 | 0.26 | 0.45 | 0.086 | 0.29 | 0.17 | 6.67 | 0.911 | −0.01 | 0.10 | 0.02 |
| MA | A | C | 6.1 × 10⁻⁶ | −0.16 | 0.03 | − | 2.3 × 10⁻¹² | 0.25 | 0.03 | − | 0.967 | 0.00 | 0.04 | − | 0.167 | 0.03 | 0.02 | − | |
| rs4900109 (Closest Gene: SLC324A4) | |||||||||||||||||||
| D | 0.45 | G | T | 0.060 | −0.04 | 0.02 | 0.22 | 0.880 | 0.01 | 0.02 | 0.00 | 2.9 × 10⁻¹³ | 0.17 | 0.02 | 3.23 | 0.450 | −0.01 | 0.01 | 0.03 |
| R1 | 0.42 | G | T | 0.190 | −0.06 | 0.04 | 0.36 | 0.990 | 0.00 | 0.05 | 0.00 | 5.7 × 10⁻⁵ | 0.22 | 0.05 | 3.45 | 0.150 | 0.04 | 0.03 | 0.44 |
| R2 | 0.37 | G | T | 0.742 | 0.03 | 0.10 | 0.19 | 0.096 | −0.22 | 0.13 | 4.92 | 0.737 | 0.03 | 0.08 | 0.20 | 0.962 | −0.01 | 0.05 | 0.01 |
| MA | G | T | 0.018 | −0.04 | 0.02 | − | 0.826 | 0.01 | 0.02 | − | 7.7 × 10⁻²¹ | 0.17 | 0.02 | − | 0.879 | −0.01 | 0.01 | − | |
| rs11630290 (Closest Gene: HERC1) | |||||||||||||||||||
| D | 0.17 | C | T | 0.060 | −0.04 | 0.02 | 0.22 | 0.630 | 0.01 | 0.03 | 0.01 | 0.076 | 0.05 | 0.03 | 0.18 | 6.3×10⁻⁶ | 0.10 | 0.02 | 1.13 |
| R1 | 0.22 | C | T | 0.210 | −0.06 | 0.05 | 0.30 | 0.290 | −0.06 | 0.06 | 0.21 | 0.980 | 0.00 | 0.06 | 0.00 | 0.430 | 0.05 | 0.06 | 0.12 |
| R2 | 0.21 | C | T | 0.336 | 0.13 | 0.14 | 1.61 | 0.339 | 0.16 | 0.17 | 1.60 | 0.696 | 0.04 | 0.11 | 0.27 | 0.921 | −0.01 | 0.08 | 0.02 |
| MA | C | T | 0.031 | −0.04 | 0.02 | − | 0.999 | −0.00 | 0.03 | − | 0.125 | 0.04 | 0.03 | − | 1.3 × 10⁻⁶ | 0.09 | 0.02 | − |
For furrows, the most strongly associated SNP was rs3739070 (p = 6.2 × 10⁻⁸), a nonsynonymous coding SNP in TRAF3IP1 (MIM 607380) on chromosome 2q37.3 (Table 2, Figure S2). This finding was replicated with the use of a proxy SNP in replication sample 1 (rs11900963, p = 1.3 × 10⁻⁴, r2 = 1.00, D′ = 1.00, HapMap II r22b36 CEU). Meta-analysis across the three samples yielded a p value of 2.3 × 10⁻¹², suggesting that TRAF3IP1 may contribute to the overall thickness and density of the iris. TRAF3IP1 is also implicated in neurogenesis, neural migration, and synaptogenesis.35,36 About 1.7% of the variance in the discovery sample and 3% in the first replication sample were explained by rs3739070.
The SNP most strongly associated with the pigmented ring, rs4900109 (p = 2.90 × 10⁻¹³), exceeded our threshold for genome-wide significance in the discovery sample and was also found to be strongly associated with the pigmented ring in the replication sample 1 (p = 5.70 × 10⁻⁵; Table 2). Not surprisingly, meta-analysis of the three samples was highly significant (7.6 × 10⁻²¹). This SNP is situated in an intergenic region on chromosome 14q32.12 upstream of the well-known pigmentation gene SLC24A4 (MIM 609840) and is in high LD with rs12896399 in the same region (rs4900109, rs12896399, r2 = 1.00, D′ = 1.00 within the HapMap CEU sample), which has been previously associated with blue versus brown eye color, blue versus green eye color, hair color, skin sensitivity to sun, and increased risk for cutaneous malignant melanoma.4,6,37–39 Thus, rs4900109 may influence where in the iris the pigment is placed, rather than overall eye color per se. The finding that 91% of people judged to have a green or hazel eye color by a distant observer in this sample have a pigmented ring supports this notion. Furthermore, 12 SNPs in the GWAS (Figure S3) had a p value less than 1.0 × 10⁻⁵, and all except rs4900109 were situated in regions that have not previously been associated with iris pigmentation. These SNPs may influence where melanin is deposited in the iris and may also be modifying risk alleles for cutaneous melanoma, because three of the top findings are in well-known regions associated with cutaneous melanoma: 6q16.3 (rs9322729, p = 8.2 × 10⁻⁶),40,41 7q21.3 (rs10808093, p = 5.6 × 10⁻⁶),42,43 and 7q31.1 (rs6957003, p = 6.4 × 10⁻⁶).44,45 In both the discovery sample and the larger replication sample, rs4900109 accounted for around 3.2% of the variance in the pigmentation ring.
For iris nevi, rs11630290, located in HERC1 (MIM 605109; 15q22.31), showed the strongest association signal (p = 6.3 × 10⁻⁶; Table 2, Figure S4). However, this association did not replicate, although the direction of effect was consistent in the larger replication sample and the meta-analysis yielded a p value of 1.28 × 10⁻⁶. HERC1 is distinct from the well-known pigmentation gene HERC2, which is situated 35 Mbp downstream of HERC1 on chromosome 15. Little is known about HERC1, but it is believed to be involved in different membrane transport processes.46,47 Other suggestive SNP findings and the quantile-quantile (Q-Q) and Manhattan plots for each iris characteristic are presented in Figures S1–S4.
To complement our genome-wide association analysis, we performed genome-wide gene-based tests by using VEGAS,48,49 which accounts for the size of genes, SNP density, and the LD between SNPs. Depending on the underlying genetic architecture, this approach can be more powerful than traditional SNP-level analyses, such as when, for example, a gene contains two or more semi-independent causal variants of moderate significance. For each trait, the p values for the genic SNPs from the GWAS analysis of the discovery sample were assigned to genes according to positions on the UCSC Genome Browser hg18 assembly. In order to capture regulatory regions and SNPs in LD, we used the default setting in VEGAS, which defines gene boundaries as ± 50 kb of 5′ and 3′ UTRs. Tables S5–S8 present the results from VEGAS,48 summarizing the 50 most associated genes for each iris characteristic.
The only gene with an empirical p value ≤ 3.0 × 10⁻⁶ after 106 simulations (our Bonferroni-corrected threshold that corrects for the 17,787 genes tested) was SEM_A3A_, and its association with crypts and this may suggest that there are other SNPs in SEM_A3A_ with small effects that influence crypts and are in low LD with rs10235789 (Figure S5). SEM_A3A_ influences the two top cell layers in the human iris where crypts occur7,33 but also the cell layers in cerebral cortex,34,50 hippocampus,51,52 cerebellum,30 and amygdala.52 Therefore, we decided to investigate whether crypts also are associated with other genes that, like SEM_A3A_, have been associated with decreased cortical width and depleted dendritic branching in the medial forebrain.53–55 This was accomplished by testing of a “gene set” derived from an experiment conducted by Krasnova et al.55
Krasnova and colleagues55 injected 6-hydroxydopamine into the medial forebrain of mice on postnatal day 1, which resulted in a decrease in the dopamine levels in the cortex and striatum of 78% and 38%, respectively (on postnatal day 7), as well as changes in the frontocortical width and somatosensory parietal cortex. Expression microarrays were then used to identify genes that were up- or downregulated in response to this treatment in the medial forebrain. They found expression differences in SEM_A3A_ and 228 other genes. SNP data for 219 of the orthologous human genes were available in our discovery sample (Table S9). Consequently, in order to test whether the 24,812 SNPs derived from this gene set were enriched for association with crypts, and potentially also with furrows, we examined the distribution of test statistics for these SNPs as compared to (1) the expectation under the null hypothesis and (2) the distribution of p values for the SNPs from 1,000 randomly selected sets of 219 genes of similar size and with similar numbers of SNPs.
As shown in the Q-Q plots in Figure 5, the distributions of p values for this candidate SNP set was enriched for crypts. This enrichment is reflected in the high λ values of these SNP sets, indicating that this enrichment is not due to a small number of large effects, but rather to a systematically higher degree of association throughout the candidate SNP set. Importantly, this enhanced association is absent when considering the λ from the full GWAS analysis (i.e., for crypts λGWAS = 1.0051 [Figure S1A], whereas λKrasnova Set = 1.1362), suggesting that this is unlikely to be due to a methodological artifact. We also used bootstrapping (sampling with replacement) to examine evidence for enhancement, comparing the number of SNPs reaching a nominal p value of .01 observed in genes within the Krasnova set to that observed in 1,000 randomly selected sets of 219 genes of similar size. As shown in Table S14, the bootstrapping analyses suggested that a distribution this enriched for crypt and furrow was unlikely to arise by chance alone (empirical p value = 0.019 and 0.034, respectively).
Figure 5.
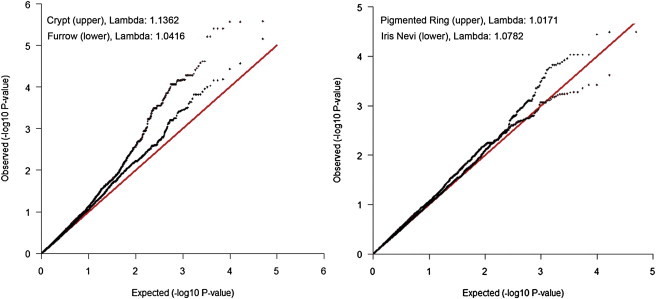
Q-Q Plots for the 24,812 SNPs Located within the 219 Genes in the Krasnova et al. Set55
See Table S9 as well.
To further investigate the hypothesis that these neuronal pathway genes are associated with iris characteristics, we used PLINK to calculate polygenic profile scores by using the maximally associated SNP from the 50 most significant genes derived from the VEGAS analyses of the discovery sample (Tables S5–S8) and the 50 most significantly associated genes from Krasnova's gene set (Tables S10–13). The profile score from the Krasnova set accounted for 4% of the variation in the crypts in the replication sample (r = 0.2), as compared to the 1.7% accounted for by the empirically derived gene set (Table S15). These results are somewhat preliminary, but our results suggest that genes influencing morphogenesis in the developing cortex also influence human iris patterns. Although the current findings suggest that human orthologs of genes responsible for neuronal morphogenesis in the mouse cortex are associated with crypt frequency and furrows, it is possible that the current findings may reflect the effect of a variant in long-range LD or trans effects. Thus, these findings warrant replication using both genetic and brain imaging techniques, which can evaluate whether SNPs associated with iris characteristics are also associated with brain morphology and function.
In conclusion, we report two quantitative trait loci that affect visible tissue characteristics in the human iris. These loci account for about 1.5% of the variance for crypt and furrows. The variants associated with crypts fall within SEM_A3A_, which is expressed in the cell layers where crypts occur. Variants associated with furrows fall within TRAF3IP1, which is essential for cytoskeleton function. Both SEM_A3A_ and TRAF3IP1 are implicated in pathways that control neurogenesis, neural migration, and synaptogenesis. In addition, we found that variants associated with the pigmented ring, which lie upstream of SLC24A4, are in strong LD with variants that have been associated with eye color, suggesting that these variants may influence where in the iris the pigment is placed, rather than overall eye color per se.
Acknowledgments
The authors thank Manuel Ferreira for helpful discussions and the twins and their families for their participation. We also thank Anjali Henders, Ann Eldridge, Marlene Grace, Kerrie McAloney (sample collection); Lisa Bowdler, Steven Crooks (DNA processing); David Smyth, Harry Beeby, and Daniel Park (IT support).
Funding was provided by the Australian National Health and Medical Research Council (241944, 339462, 389927,389875, 389891, 389892, 389938, 442915, 442981, 496739,552485, 552498), the Australian Research Council (A7960034, A79906588, A79801419, DP0770096, DP0212016, DP0343921),the FP-5 GenomEUtwin Project (QLG2-CT-2002-01254), and the U.S. National Institutes of Health (NIH grants AA07535, AA10248, AA13320, AA13321, AA13326, AA14041, MH66206). S.E.M., D.R.N., A.F.M., M.A.R.F., S.M., D.L.D., and G.W.M. are supported by the National Health and Medical Research Council (NHMRC) Fellowship Scheme. M.L. is a Postdoctoral Fellow supported by the Swedish Research Council.
Supplemental Data
Document S1. Five Figures and 15 Tables
Web Resources
The URLs for data presented herein are as follows:
- Entrez Gene, http://www.ncbi.nlm.nih.gov/gene
- GeneCards, http://www.genecards.org/
- Haploview, www.broad.mit.edu/mpg/haploview/
- Merlin, http://www.sph.umich.edu/csg/abecasis/Merlin/
- Metal, http://www.sph.umich.edu/csg/abecasis/Metal/
- Mx, http://www.vcu.edu/mx/
- NCIB Unigene, http://www.ncbi.nlm.nih.gov/unigene
- NIEBank, http://neibank.nei.nih.gov
- Online Mendelian Inheritance in Man (OMIM), http://www.omim.org
- Plink, http://pngu.mgh.harvard.edu/∼purcell/plink/
- SNAP plots, http://www.broadinstitute.org/mpg/snap/ldplot.php
References
- 1.Sturm R.A., Larsson M. Genetics of human iris colour and patterns. Pigment cell & melanoma research. 2009;22:544–562. doi: 10.1111/j.1755-148X.2009.00606.x. [DOI] [PubMed] [Google Scholar]
- 2.Liu F., van Duijn K., Vingerling J.R., Hofman A., Uitterlinden A.G., Janssens A.C., Kayser M. Eye color and the prediction of complex phenotypes from genotypes. Curr. Biol. 2009;19:R192–R193. doi: 10.1016/j.cub.2009.01.027. [DOI] [PubMed] [Google Scholar]
- 3.Liu F., Wollstein A., Hysi P.G., Ankra-Badu G.A., Spector T.D., Park D., Zhu G., Larsson M., Duffy D.L., Montgomery G.W. Digital quantification of human eye color highlights genetic association of three new loci. PLoS Genet. 2010;6:e1000934. doi: 10.1371/journal.pgen.1000934. [DOI] [PMC free article] [PubMed] [Google Scholar]
- 4.Sulem P., Gudbjartsson D.F., Stacey S.N., Helgason A., Rafnar T., Magnusson K.P., Manolescu A., Karason A., Palsson A., Thorleifsson G. Genetic determinants of hair, eye and skin pigmentation in Europeans. Nat. Genet. 2007;39:1443–1452. doi: 10.1038/ng.2007.13. [DOI] [PubMed] [Google Scholar]
- 5.Walsh S., Liu F., Ballantyne K.N., van Oven M., Lao O., Kayser M. IrisPlex: A sensitive DNA tool for accurate prediction of blue and brown eye colour in the absence of ancestry information. Forensic Sci Int Genet. 2010;5:170–180. doi: 10.1016/j.fsigen.2010.02.004. [DOI] [PubMed] [Google Scholar]
- 6.Duffy D.L., Zhao Z.Z., Sturm R.A., Hayward N.K., Martin N.G., Montgomery G.W. Multiple pigmentation gene polymorphisms account for a substantial proportion of risk of cutaneous malignant melanoma. J. Invest. Dermatol. 2010;130:520–528. doi: 10.1038/jid.2009.258. [DOI] [PMC free article] [PubMed] [Google Scholar]
- 7.Cvekl A., Tamm E.R. Anterior eye development and ocular mesenchyme: new insights from mouse models and human diseases. Bioessays. 2004;26:374–386. doi: 10.1002/bies.20009. [DOI] [PMC free article] [PubMed] [Google Scholar]
- 8.Simpson T.I., Price D.J. Pax6; a pleiotropic player in development. Bioessays. 2002;24:1041–1051. doi: 10.1002/bies.10174. [DOI] [PubMed] [Google Scholar]
- 9.Ellison-Wright Z., Heyman I., Frampton I., Rubia K., Chitnis X., Ellison-Wright I., Williams S.C., Suckling J., Simmons A., Bullmore E. Heterozygous PAX6 mutation, adult brain structure and fronto-striato-thalamic function in a human family. Eur. J. Neurosci. 2004;19:1505–1512. doi: 10.1111/j.1460-9568.2004.03236.x. [DOI] [PubMed] [Google Scholar]
- 10.Osumi N., Shinohara H., Numayama-Tsuruta K., Maekawa M. Concise review: Pax6 transcription factor contributes to both embryonic and adult neurogenesis as a multifunctional regulator. Stem Cells. 2008;26:1663–1672. doi: 10.1634/stemcells.2007-0884. [DOI] [PubMed] [Google Scholar]
- 11.Donaldson D.D. The significance of spotting of the iris in mongolids: Brushfield spots. Arch. Ophthalmol. 1961;65:26–31. [Google Scholar]
- 12.Lee M.J., Stephenson D.A. Recent developments in neurofibromatosis type 1. Curr. Opin. Neurol. 2007;20:135–141. doi: 10.1097/WCO.0b013e3280895da8. [DOI] [PubMed] [Google Scholar]
- 13.Mariën P., Brouns R., Engelborghs S., Wackenier P., Verhoeven J., Ceulemans B., De Deyn P.P. Cerebellar cognitive affective syndrome without global mental retardation in two relatives with Gillespie syndrome. Cortex. 2008;44:54–67. doi: 10.1016/j.cortex.2005.12.001. [DOI] [PubMed] [Google Scholar]
- 14.Ticho B.H., Hilchie-Schmidt C., Egel R.T., Traboulsi E.I., Howarth R.J., Robinson D. Ocular findings in Gillespie-like syndrome: association with a new PAX6 mutation. Ophthalmic Genet. 2006;27:145–149. doi: 10.1080/13816810600976897. [DOI] [PubMed] [Google Scholar]
- 15.Houlston R.S., Damato B.E. Genetic predisposition to ocular melanoma. Eye (Lond.) 1999;13:43–46. doi: 10.1038/eye.1999.9. [DOI] [PubMed] [Google Scholar]
- 16.Richtig E., Langmann G., Müllner K., Smolle J. Ocular melanoma: epidemiology, clinical presentation and relationship with dysplastic nevi. Ophthalmologica. 2004;218:111–114. doi: 10.1159/000076146. [DOI] [PubMed] [Google Scholar]
- 17.Chang B., Smith R.S., Hawes N.L., Anderson M.G., Zabaleta A., Savinova O., Roderick T.H., Heckenlively J.R., Davisson M.T., John S.W. Interacting loci cause severe iris atrophy and glaucoma in DBA/2J mice. Nat. Genet. 1999;21:405–409. doi: 10.1038/7741. [DOI] [PubMed] [Google Scholar]
- 18.Davis-Silberman N., Ashery-Padan R. Iris development in vertebrates; genetic and molecular considerations. Brain Res. 2008;1192:17–28. doi: 10.1016/j.brainres.2007.03.043. [DOI] [PubMed] [Google Scholar]
- 19.Asano N., Schlötzer-Schrehardt U., Naumann G.O. A histopathologic study of iris changes in pseudoexfoliation syndrome. Ophthalmology. 1995;102:1279–1290. [PubMed] [Google Scholar]
- 20.Mackey D.A., Mackinnon J.R., Brown S.A., Kearns L.S., Ruddle J.B., Sanfilippo P.G., Sun C., Hammond C.J., Young T.L., Martin N.G., Hewitt A.W. Twins eye study in Tasmania (TEST): rationale and methodology to recruit and examine twins. Twin Res. Hum. Genet. 2009;12:441–454. doi: 10.1375/twin.12.5.441. [DOI] [PMC free article] [PubMed] [Google Scholar]
- 21.Wright M.J., Martin N.G. Brisbane Adolescent Twin Study: Outline of study methods and research projects. Aust. J. Psychol. 2004;56:65–78. [Google Scholar]
- 22.Price A.L., Patterson N.J., Plenge R.M., Weinblatt M.E., Shadick N.A., Reich D. Principal components analysis corrects for stratification in genome-wide association studies. Nat. Genet. 2006;38:904–909. doi: 10.1038/ng1847. [DOI] [PubMed] [Google Scholar]
- 23.McEvoy B.P., Montgomery G.W., McRae A.F., Ripatti S., Perola M., Spector T.D., Cherkas L., Ahmadi K.R., Boomsma D., Willemsen G. Geographical structure and differential natural selection among North European populations. Genome Res. 2009;19:804–814. doi: 10.1101/gr.083394.108. [DOI] [PMC free article] [PubMed] [Google Scholar]
- 24.Medland S.E., Nyholt D.R., Painter J.N., McEvoy B.P., McRae A.F., Zhu G., Gordon S.D., Ferreira M.A., Wright M.J., Henders A.K. Common variants in the trichohyalin gene are associated with straight hair in Europeans. Am. J. Hum. Genet. 2009;85:750–755. doi: 10.1016/j.ajhg.2009.10.009. [DOI] [PMC free article] [PubMed] [Google Scholar]
- 25.Larsson M., Pedersen N.L., Stattin H. Importance of genetic effects for characteristics of the human iris. Twin Res. 2003;6:192–200. doi: 10.1375/136905203765693843. [DOI] [PubMed] [Google Scholar]
- 26.Neale, M., Boker, S., Xie, G., and Maes, H. (1999). Mx: Statistical Modeling. 5th Edition (Box 126 MCV, Richmond, VA 23298, Department of Psychiatry: Medical College of Virginia).
- 27.Chen W.M., Abecasis G.R. Family-based association tests for genomewide association scans. Am. J. Hum. Genet. 2007;81:913–926. doi: 10.1086/521580. [DOI] [PMC free article] [PubMed] [Google Scholar]
- 28.Pe'er I., Yelensky R., Altshuler D., Daly M.J. Estimation of the multiple testing burden for genomewide association studies of nearly all common variants. Genet. Epidemiol. 2008;32:381–385. doi: 10.1002/gepi.20303. [DOI] [PubMed] [Google Scholar]
- 29.Willer C.J., Li Y., Abecasis G.R. METAL: fast and efficient meta-analysis of genomewide association scans. Bioinformatics. 2010;26:2190–2191. doi: 10.1093/bioinformatics/btq340. [DOI] [PMC free article] [PubMed] [Google Scholar]
- 30.Eastwood S.L., Law A.J., Everall I.P., Harrison P.J. The axonal chemorepellant semaphorin 3A is increased in the cerebellum in schizophrenia and may contribute to its synaptic pathology. Mol. Psychiatry. 2003;8:148–155. doi: 10.1038/sj.mp.4001233. [DOI] [PubMed] [Google Scholar]
- 31.Wedenoja J., Loukola A., Tuulio-Henriksson A., Paunio T., Ekelund J., Silander K., Varilo T., Heikkilä K., Suvisaari J., Partonen T. Replication of linkage on chromosome 7q22 and association of the regional Reelin gene with working memory in schizophrenia families. Mol. Psychiatry. 2008;13:673–684. doi: 10.1038/sj.mp.4002047. [DOI] [PubMed] [Google Scholar]
- 32.Good P.F., Alapat D., Hsu A., Chu C., Perl D., Wen X., Burstein D.E., Kohtz D.S. A role for semaphorin 3A signaling in the degeneration of hippocampal neurons during Alzheimer's disease. J. Neurochem. 2004;91:716–736. doi: 10.1111/j.1471-4159.2004.02766.x. [DOI] [PubMed] [Google Scholar]
- 33.Lwigale P.Y., Bronner-Fraser M. Semaphorin3A/neuropilin-1 signaling acts as a molecular switch regulating neural crest migration during cornea development. Dev. Biol. 2009;336:257–265. doi: 10.1016/j.ydbio.2009.10.008. [DOI] [PMC free article] [PubMed] [Google Scholar]
- 34.Polleux F., Morrow T., Ghosh A. Semaphorin 3A is a chemoattractant for cortical apical dendrites. Nature. 2000;404:567–573. doi: 10.1038/35007001. [DOI] [PubMed] [Google Scholar]
- 35.Callicott J.H., Straub R.E., Pezawas L., Egan M.F., Mattay V.S., Hariri A.R., Verchinski B.A., Meyer-Lindenberg A., Balkissoon R., Kolachana B. Variation in DISC1 affects hippocampal structure and function and increases risk for schizophrenia. Proc. Natl. Acad. Sci. USA. 2005;102:8627–8632. doi: 10.1073/pnas.0500515102. [DOI] [PMC free article] [PubMed] [Google Scholar]
- 36.Deutsch S.I., Burket J.A., Katz E. Does subtle disturbance of neuronal migration contribute to schizophrenia and other neurodevelopmental disorders? Potential genetic mechanisms with possible treatment implications. Eur. Neuropsychopharmacol. 2010;20:281–287. doi: 10.1016/j.euroneuro.2010.02.005. [DOI] [PubMed] [Google Scholar]
- 37.Eriksson N., Macpherson J.M., Tung J.Y., Hon L.S., Naughton B., Saxonov S., Avey L., Wojcicki A., Pe'er I., Mountain J. Web-based, participant-driven studies yield novel genetic associations for common traits. PLoS Genet. 2010;6:e1000993. doi: 10.1371/journal.pgen.1000993. [DOI] [PMC free article] [PubMed] [Google Scholar]
- 38.Han J., Kraft P., Nan H., Guo Q., Chen C., Qureshi A., Hankinson S.E., Hu F.B., Duffy D.L., Zhao Z.Z. A genome-wide association study identifies novel alleles associated with hair color and skin pigmentation. PLoS Genet. 2008;4:e1000074. doi: 10.1371/journal.pgen.1000074. [DOI] [PMC free article] [PubMed] [Google Scholar]
- 39.Sturm R.A. Human ‘coat colour’ genetics. Pigment cell & melanoma research. 2008;21:115–116. doi: 10.1111/j.1755-148X.2008.00444.x. [DOI] [PubMed] [Google Scholar]
- 40.Miele M.E., Jewett M.D., Goldberg S.F., Hyatt D.L., Morelli C., Gualandi F., Rimessi P., Hicks D.J., Weissman B.E., Barbanti-Brodano G., Welch D.R. A human melanoma metastasis-suppressor locus maps to 6q16.3-q23. Int. J. Cancer. 2000;86:524–528. doi: 10.1002/(sici)1097-0215(20000515)86:4<524::aid-ijc13>3.0.co;2-w. [DOI] [PubMed] [Google Scholar]
- 41.Shirasaki F., Takata M., Hatta N., Takehara K. Loss of expression of the metastasis suppressor gene KiSS1 during melanoma progression and its association with LOH of chromosome 6q16.3-q23. Cancer Res. 2001;61:7422–7425. [PubMed] [Google Scholar]
- 42.de Snoo F.A., Hottenga J.J., Gillanders E.M., Sandkuijl L.A., Jones M.P., Bergman W., van der Drift C., van Leeuwen I., van Mourik L., Huurne J.A. Genome-wide linkage scan for atypical nevi in p16-Leiden melanoma families. Eur. J. Hum. Genet. 2008;16:1135–1141. doi: 10.1038/ejhg.2008.72. [DOI] [PubMed] [Google Scholar]
- 43.McCannel T.A., Burgess B.L., Nelson S.F., Eskin A.F., Straatsma B.R. Genomic Identification of Significant Targets in Ciliochoroidal Melanoma. Invest Ophthalmol Vis Sci. 2010;52:3018–3022. doi: 10.1167/iovs.10-5864. [DOI] [PubMed] [Google Scholar]
- 44.Segura M.F., Hanniford D., Menendez S., Reavie L., Zou X., Alvarez-Diaz S., Zakrzewski J., Blochin E., Rose A., Bogunovic D. Aberrant miR-182 expression promotes melanoma metastasis by repressing FOXO3 and microphthalmia-associated transcription factor. Proc. Natl. Acad. Sci. USA. 2009;106:1814–1819. doi: 10.1073/pnas.0808263106. [DOI] [PMC free article] [PubMed] [Google Scholar]
- 45.Treszl A., Ladanyi A., Rakosy Z., Buczko Z., Adany R., Balazs M. Molecular cytogenetic characterization of a novel cell line established from a superficial spreading melanoma. Front. Biosci. 2006;11:1844–1853. doi: 10.2741/1927. [DOI] [PubMed] [Google Scholar]
- 46.Rosa J.L., Barbacid M. A giant protein that stimulates guanine nucleotide exchange on ARF1 and Rab proteins forms a cytosolic ternary complex with clathrin and Hsp70. Oncogene. 1997;15:1–6. doi: 10.1038/sj.onc.1201170. [DOI] [PubMed] [Google Scholar]
- 47.Mashimo T., Hadjebi O., Amair-Pinedo F., Tsurumi T., Langa F., Serikawa T., Sotelo C., Guénet J.L., Rosa J.L. Progressive Purkinje cell degeneration in tambaleante mutant mice is a consequence of a missense mutation in HERC1 E3 ubiquitin ligase. PLoS Genet. 2009;5:e1000784. doi: 10.1371/journal.pgen.1000784. [DOI] [PMC free article] [PubMed] [Google Scholar]
- 48.Liu J.Z., McRae A.F., Nyholt D.R., Medland S.E., Wray N.R., Brown K.M., Hayward N.K., Montgomery G.W., Visscher P.M., Martin N.G., Macgregor S., AMFS Investigators A versatile gene-based test for genome-wide association studies. Am. J. Hum. Genet. 2010;87:139–145. doi: 10.1016/j.ajhg.2010.06.009. [DOI] [PMC free article] [PubMed] [Google Scholar]
- 49.Neale B.M., Sham P.C. The future of association studies: gene-based analysis and replication. Am. J. Hum. Genet. 2004;75:353–362. doi: 10.1086/423901. [DOI] [PMC free article] [PubMed] [Google Scholar]
- 50.Whitford K.L., Dijkhuizen P., Polleux F., Ghosh A. Molecular control of cortical dendrite development. Annu. Rev. Neurosci. 2002;25:127–149. doi: 10.1146/annurev.neuro.25.112701.142932. [DOI] [PubMed] [Google Scholar]
- 51.Chédotal A., Del Rio J.A., Ruiz M., He Z., Borrell V., de Castro F., Ezan F., Goodman C.S., Tessier-Lavigne M., Sotelo C., Soriano E. Semaphorins III and IV repel hippocampal axons via two distinct receptors. Development. 1998;125:4313–4323. doi: 10.1242/dev.125.21.4313. [DOI] [PubMed] [Google Scholar]
- 52.Giger R.J., Pasterkamp R.J., Heijnen S., Holtmaat A.J., Verhaagen J. Anatomical distribution of the chemorepellent semaphorin III/collapsin-1 in the adult rat and human brain: predominant expression in structures of the olfactory-hippocampal pathway and the motor system. J. Neurosci. Res. 1998;52:27–42. doi: 10.1002/(SICI)1097-4547(19980401)52:1<27::AID-JNR4>3.0.CO;2-M. [DOI] [PubMed] [Google Scholar]
- 53.Tamamaki N., Fujimori K., Nojyo Y., Kaneko T., Takauji R. Evidence that Sema3A and Sema3F regulate the migration of GABAergic neurons in the developing neocortex. J. Comp. Neurol. 2003;455:238–248. doi: 10.1002/cne.10476. [DOI] [PubMed] [Google Scholar]
- 54.Pascual M., Pozas E., Soriano E. Role of class 3 semaphorins in the development and maturation of the septohippocampal pathway. Hippocampus. 2005;15:184–202. doi: 10.1002/hipo.20040. [DOI] [PubMed] [Google Scholar]
- 55.Krasnova I.N., Betts E.S., Dada A., Jefferson A., Ladenheim B., Becker K.G., Cadet J.L., Hohmann C.F. Neonatal dopamine depletion induces changes in morphogenesis and gene expression in the developing cortex. Neurotox. Res. 2007;11:107–130. doi: 10.1007/BF03033390. [DOI] [PubMed] [Google Scholar]
Associated Data
This section collects any data citations, data availability statements, or supplementary materials included in this article.
Supplementary Materials
Document S1. Five Figures and 15 Tables