Xenome—a tool for classifying reads from xenograft samples (original) (raw)
Abstract
Motivation: Shotgun sequence read data derived from xenograft material contains a mixture of reads arising from the host and reads arising from the graft. Classifying the read mixture to separate the two allows for more precise analysis to be performed.
Results: We present a technique, with an associated tool Xenome, which performs fast, accurate and specific classification of xenograft-derived sequence read data. We have evaluated it on RNA-Seq data from human, mouse and human-in-mouse xenograft datasets.
Availability: Xenome is available for non-commercial use from http://www.nicta.com.au/bioinformatics
Contact: tom.conway@nicta.com.au
1 INTRODUCTION
Xenograft models are an important tool for many areas of biomedical research, including oncology, immunology and HIV pathology. A typical scenario, drawn from oncology research, is that of a human prostate cancer grown in an immunocompromised mouse model. Doing so allows researchers to investigate aspects of the cancer that are not necessarily preserved in cell lines, and it allows investigations into the interactions between the cancer and the surrounding stromal tissue. The mouse may be biopsied or harvested and samples of cancer and/or stroma collected at various time points during an experiment.
Difficulties arise, when sequencing the genome or transcriptome of the samples because host (mouse) material (i.e. DNA/RNA) will inevitably comingle with the graft (human) material. If a sufficiently careful section is taken, it has been generally assumed that the level of host contamination is low enough that it may be ignored. This may be a dangerous assumption, however, since the level of gene expression is non-uniform. If the overall level of host contamination in a graft sample is measured to be 10 overall, it may still be the case for a given gene that the host homologue accounts for most or all of the expression.
Contamination may be minimized by physical or biochemical techniques such as conservative sectioning, cell sorting or laser capture micro-dissection, but these techniques can be a significant source of technical bias, or in some cases may require infeasibly large amounts of starting material. Further, in the case of transcriptomic investigation, classifying host and graft in vitro may fail to adequately capture the interactions between them.
An alternative strategy is to sequence an acknowledged mixture of host and graft, then use in silico methods to classify the individual sequence reads. This is the approach discussed here. We demonstrate a simple technique, based on an analysis of sequence reads using Tophat, and a more precise technique based on a _k_-mer decomposition of the host and graft reference sequences, Xenome. In both cases, the primary goal of the analysis is to classify reads into four classes: reads attributable to the host, reads attributable to the graft, reads which could be attributed to both and reads which are attributable to neither. To the best of our knowledge, there are no results in the literature examining the classification of high-throughput sequencing short reads from xenograft models. The studies we know of are concerned with microarray expression profiles or alternative methods for estimating the amount of host material or cell types in the samples. For example, Lin et al. (2010) investigate the use of species-specific variation in gene length and a multiplex PCR to ascertain the relative amount of mouse and human DNA. Wang et al. (2010) use microarray gene profiling data and in silico techniques to estimate the quantity of various tissue components. In Samuels et al. (2010), there is an analysis of a mouse xenograft model using microarray data. They conclude that if there is more than 90% human DNA then the expression profiles are not unduly skewed. They also describe an experimental method for removing homologous genes based on cross-hybridization analysis of the probes. Ding et al. (2010) use short read sequencing to study a cancer genome and identify mutations/deletions. They estimate tumour cellularity using pathological assessment, and state that their xenograft is 90% tumour cells. They also map NOD/SCID (mouse) genomic data to human and mouse genomes, reporting 3.17% and 95.85% mapping rates, respectively, and so apply no correction for the murine cells. We note that in the context of non-uniform RNA-Seq data ignoring the contribution of the murine expression can lead to biases.
Tools such as Tophat serve a different purpose than that of Xenome. The former aligns reads to a reference, and we can use those alignments for a variety of purposes, including the classification task we present here. In contrast, Xenome only performs the classification task itself. This is an important distinction, since an alignment must assign the read to zero or more positions in the genome; the classification merely has to decide if the read was more likely to arise from the genome than not.
For the remainder of the article, we will assume, unless otherwise stated, that sequence reads arise from RNA-Seq. However, the techniques we present are applicable to genomic DNA sequences (including ChIP-Seq and MeDIP-Seq) and also to other mixtures of DNA species.
2 METHODS
Under the assumption that a graft sample has only a low level of host material contamination, the simplest analysis is to use a regular mapping-based RNA-Seq analysis tool, such as Tophat and assume that either the observed expression is dominated by the graft, which has the greatest number of input cells, or that the homology between the host species and graft species is such that reads arising from host material will tend to map poorly, and the resultant inferred level of gene expression will be negligible.
In some cases, these assumptions may be true, but in the case of human cancer xenografts in mice, for example, the second assumption is false for many transcripts, and a more precise technique is desirable.
Therefore, we have developed two techniques—one based on the existing RNA-Seq resequencing tool Tophat (Trapnell et al., 2009), and one based on _k_-mer decompositions of the host and graft references. For genomic DNA, another resequencing/alignment tool could just as well be used.
2.1 A _Tophat_-based method
A more precise analysis may be performed by using Tophat (Trapnell et al., 2009) to analyse the reads. First, Tophat is used to process the read set with the graft genome as reference. Secondly, Tophat is used to process the read set with the host genome as reference. Lastly, the accepted alignments from the Tophat mappings are post-processed to partition the reads into four classes: host, graft, both or neither. Tophat provides mapping quality scores in its output, but they only reflect whether or not the read mapped to multiple locations. If the quality scores reflected a measure of certainty that the read maps to the given location, a more sophisticated approach would be to extend the classification to assign reads that map with high certainty to one genome and low certainty to the other to the appropriate specific class rather than both. We do not pursue this further here.
An implementation of this method may be achieved easily with Tophat, SAMtools (Li et al., 2009) and some simple scripts. As will be apparent in the results presented in Section 3, although very few reads are misclassified (i.e. classified as host instead of graft, or vice versa), a significant proportion of the reads, even in a pure graft or pure host sample, fall into the both class. If these ambiguous reads were uniformly distributed in their origin across the genome, this would have only a small impact, but as we will elucidate in Section 4, the ambiguous reads are non-uniformly distributed. As a result, a significant number of genes cannot have their expression unambiguously pinned to the host or the graft, though at least compared with a single analysis, the set-based analysis makes clear which reads may be clearly associated with the host or the graft, and does not assume that all gene expression in the sample is explained by the graft.
2.2 A _k_-mer-based method
Our method proceeds in two phases: constructing a reference data structure, then classifying reads with respect to that reference data structure. The reference structure is built from the sets of _k_-mers in a pair of reference sequences, which we will refer to as the host and the graft.
2.2.1 Definitions
Since in most sequencing protocols the reads are a mixture of forward and reverse complements with respect to the reference sequence, we cannot assume the orientation of _k_-mers drawn from reads will match the orientation of _k_-mers drawn from the reference. We could always consider both orientations, but that would entail a lot of double handling of information, so instead we normalize or canonicalize _k_-mers.
Definition 1. —
(_k_-mer canonicalization). Consider a _k_-mer x. We denote its reverse complement by
.
A canonical _k_-mer
is defined by a choice function
giving a deterministic choice between x and
:
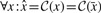
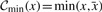
In principle, we can choose any such function: min or max being obvious candidates, and the results of our method are identical for all choices. In Section 4, we will present our specific choice which has important performance ramifications.
This definition can be extended to a set of _k_-mers S in the obvious way:

Definition 2. —
(Marginal inclusion). Consider a set of canonical _k_-mers
. We say that a _k_-mer x is has marginal membership of
if
does not exist in
, but has a Hamming distance 1 neighbour y such that
is a member of
.
To aid our computation of marginal inclusion, we define the function

where _Ham_1(x) is the set of Hamming distance 1 neighbours of x. Note that


2.2.2 Reference construction
For both host and graft reference sequences, we construct the set of canonical _k_-mers ( and
and  respectively). From these we compute a complete set of canonical reference _k_-mers
  . Note that
  .
.
The sets of canonical _k_-mers tend to be large: with k = 25, there are 2.4 billion in the human genome, 2.1 billion in the mouse genome, and 4.5 billion in the union—only 12 million are shared.
A naive representation (2 bits per base, packed), would use 50 bits per 25-mer, or about 26 GB. As discussed in our previous work (Conway and Bromage, 2011), information theory gives a lower bound for the memory usage. For a domain of 4_k_ possible _k_-mers, the minimum number of bits required to represent a set of n _k_-mers is

In the case of the union  above, this is about 10 GB, or less than half what is required for the naive representation. As also discussed in our previous work, succinct data structures have been developed to give concrete representations that approach this theoretical lower bound. The one we use, due to (Okanohara and Sadakane, 2006), works very well, requiring about 13 GB.
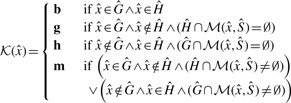
For each reference _k_-mer, we determine whether it occurs in the host, the graft, both, or if it occurs in one and has a marginal occurrence in the other. These classes are denoted h, g, b or m, respectively (Fig. 1). More formally, we compute the function  for each
may be extended to project not just _k_-mers to classes, but also a set of _k_-mers  to a set of classes in the obvious way:
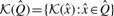
Fig. 1.

A Venn diagram showing the different classes that a given _k_-mer may belong to. The marginal host (and marginal graft) partitions are for those host (and graft) _k_-mers that are Hamming distance 1 from a _k_-mer in the graft (and host) reference
These classes are pre-computed and stored as a sequence of 2-bit values corresponding to the _k_-mers in the succinctly store reference set.
The class m denotes that the _k_-mer exists in  and has marginal membership of
  or vice versa. That is, they are marginally distinctive, in the sense that a single polymorphism or sequencing error may cause a _k_-mer in that class to change from being marginally host to being marginally graft. Since the marginal set is symmetric (every marginal host _k_-mer has a corresponding marginal graft _k_-mer and vice versa), and represents _k_-mers that are not very discriminating, we combine both marginal sets into a single marginal set with the class m.
2.2.3 Classification
Classification proceeds by taking each read r and constructing the set of canonical _k_-mers that may be derived from the read  . We then map the set of _k_-mers to a set of classes by the function described above. _k_-mers that do not occur in the reference,
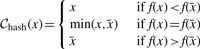
  , are ignored. The _k_-mer classes that occur for a given read determine the classification of the read as a whole according to the following function:
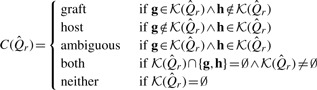
The read classes graft and host denote cases where there is at least one _k_-mer which unambiguously comes from that _k_-mer class, and there are no contradictory _k_-mers (i.e. unambiguously from the opposing reference). The ambiguous class corresponds to the case where there are _k_-mers which appear to be contradictory—unambiguously host, and unambiguously graft. The both class represents cases where there are only _k_-mers which are either unambiguously common to both the host and graft or _k_-mers which may belong to either if they contain a single polymorphism or sequencing error. The last class, neither, represents those cases where there were no matching _k_-mers.
2.2.4 Implementation concerns
In Section 2.2, we introduced an abstract canonicalization function . The most commonly used concrete function is min (or max), which selects the lexicographically/numerically smaller of the _k_-mers x and  :
:
We use the following definition, assuming some reasonable hash function f:
Assuming f is a reasonable hash function, this definition effectively makes a random, but deterministic choice between x and  .
.
We use this definition, rather than the more common lexicographic one, because lexicographic canonicalization leads to the set of canonical _k_-mers being non-uniformly distributed across the set of all possible _k_-mers.
There are two ways in which a more uniform distribution of _k_-mers improves performance of Xenome. The first is that the succinct bitmap representation that we use (due to Okanohara and Sadakane, 2006) performs better on a uniform distribution of bits (that is, a uniform distribution of _k_-mers). The second is that it improves the performance of our intermediate hash table, from which the succinct bitmap data structure is built.
The way the hash table is used is that as the input sequences are read, they are decomposed into _k_-mers which are stored in the hash table, which is of a fixed (controlled by a command line parameter) size. When the hash table fills (that is, unresolvable collisions arise), it is sorted and written out to disk. When all source _k_-mershave been read, the sorted runs are merged and the main succinct bitmap is constructed.
The specific representation used is a succinct cuckoo hash table, broadly similar to (Arbitman et al., 2010). The succinct representation relies on the fact that the location of the slot where a key x (in this case, a _k_-mer) is stored contains some of the information present in the key.
Consider an idealized hash table with load factor 1 (i.e. the number of values stored in the table equals the number of slots in the hash table), with no collisions. If the width of the hash table is 2_J_, then J bits of the key are implied by the slot chosen. For keys of N bits, therefore, the entries of the hash table need store only N − J bits. The simplest way this may be realized would be to just use J bits of the key as the slot number, and store the remainder in that slot, but of course, this is likely to have an unacceptable number of collisions.
Instead, we use an invertible hash function [based on a single-stage Feistel network, see Luby and Rackoff (1988)] to turn a key x into a slot number s and a stored component v in such a way that given s and v we can recover x (assuming a hash function f):
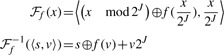
The size of the key data stored in the hash table is, then, 2_J_ (N_−_J) bits. If 2_J_≪2_N_, this is within (1+o(1)) log2(2_N_2_J_) bits, and hence succinct.
[Of course, idealized hash tables are not possible if the set of keys is not known in advance. Hence we use cuckoo hashing (Pagh and Rodler, 2004), in which collisions are resolved (as far as possible) using multiple hash functions.]
To make the sorting of keys more efficient, our hash function preserves the N_−_J most significant bits of the keys, which are then stored in the hash table (along with a few bits to determine which hash function was used). This means that we can perform an initial bucketing without inverting the hash functions; the buckets can then be processed independently, using multiple threads if required.
Now consider a set of random _k_-mers. For hash-based canonicalization, given a good hash function, there is an equal probability of observing any base in the most significant position in  . For lexicographic canonicalization, there is a probability of
  that it is A,
  that it is C,
  that it is G, and only
  that it is T. For a set of N random _k_-mers, the expected entropy at the most significant base is 2.0 bits and 1.85 bits, respectively.
This matters, because hash functions are frequently vulnerable to poor behaviour in the presence of highly correlated sets of keys. In real, biologically derived sets of _k_-mers, the set of _k_-mers is non-random, so there is likely to be less entropy to begin with, and therefore loss of entropy due to canonicalization is exacerbated. This is especially problematic in the case of the above family of invertible hash functions, since it is precisely the most-significant bits of the key which are passed to the underlying hash function f.
The upshot of this is that min leads to highly correlated _k_-mers, which in turn lead to a high probability of unresolvable collisions even when the hash table is nearly empty, resulting in a large number of short runs. Since the set of canonical _k_-mers that result from hash are less correlated, the hash table is unlikely to encounter unresolvable collisions until it is almost full (80–85% in practice).
2.3 _Xenome_—usage and workflow
To use the xenome tool, first it must be invoked to construct the reference data structures. A typical invocation will give the FASTA filenames for the host and graft genomes, a filename prefix for the index files, and optionally, the amount of working RAM to use (in Giga Bytes), and the number of threads to use:

This will run for some time—on the human/mouse references, around 4–6 h on an 8-core server. This need only be done once for a given pair of references, and a given _k_-mer size. The _k_-mer size defaults to 25, which seems to work well.
With the reference data structures built, read data may be segregated. To make the output files easier to identify, command line flags can be used to name the host and graft files. If paired data is being classified, the – –pairs flag should be given—pairs are classified by computing  over all the _k_-mers in the pair.
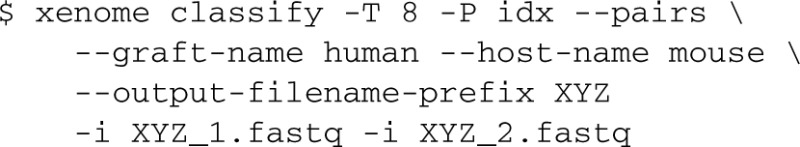
This yields the following set of files:
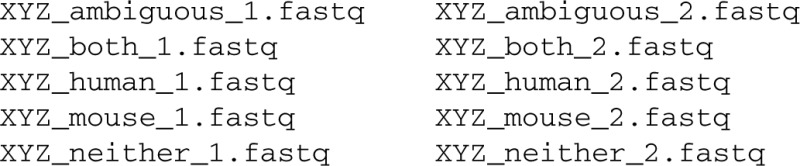
If the total size of the index files is larger than RAM, xenome will perform poorly, but the flag −M can be supplied with the maximum desired working set size, and the classification will be done in multiple passes each using less memory.
On a single server with 8 AMD Opteron cores running at 2 GHz and with 32 GB of RAM Xenome processes ~15 000 read pairs per second.
Having classified the reads, typical usage would be to then run Tophat and Cufflinks to perform intron-aware gapped alignments and compute gene expression. Instead of running Tophat on all of the reads, having separated the reads according to their origin, we can run it with the human genome just against the human fraction of the reads, and against the mouse genome on the mouse fraction of the reads. It may well be desirable to combine the both and ambiguous fractions with the human fraction to run against the human genome, and also with the mouse fraction to run against the mouse genome. If this is done, attention should be paid to homologous genes, since it is possible that the human and mouse homologues may be represented by the same reads. In some cases, the correct attribution of the gene expression may be apparent from the nature of the experiment. For example, a sample from a human prostate cancer grown in mouse may show ambiguous expression in MYH genes which would be reasonably attributed to the stromal mouse tissue.
3 RESULTS
Our analysis examines two questions: whether or not it is technically feasible to separate host and graft reads in silico; and whether or not the fast technique we have proposed (Xenome) yields a worthwhile improvement over the mapping (Tophat) based technique.
In the first experiment, we take a sample of human cDNA sequence data (SRR342886), and a sample of mouse cDNA sequence data (SRR037689) and analyse them both with Tophat and Xenome, and compare the results. This allows us to evaluate the degree to which sequences are misclassified (assigned to human rather than mouse or vice versa), and the specificity of the classification—the proportion of sequences which are not classified as both. The use of pure human or mouse cDNA gives an experiment where the correct assignment of reads is known.
The second experiment runs the same analysis on sequence data from a human prostate cancer xenograft growing in a mouse host [BM18, see McCulloch et al. (2005)]. In this case, however, we not only classify the reads, but use the Tophat mappings to compute approximate levels of gene expression [measured in fragments per thousand bases of transcript per million mapped reads, or _FPKM_ Trapnell et al. (2010)] and use human species-specific quantitative RT-PCR (qRT-PCR) on selected genes to validate the results. In this instance, we have no gold standard by which we can judge the results, but the qRT-PCR will give some degree of validation, and known aspects of the biology of the cancer can give some qualitative corroboration.
Tophat uses a global analysis, combining the results of all the read mappings to locate exons, junctions and so on. In contrast, Xenome performs pre-computation on the two reference genomes, then classifies each read independently. Therefore, for each of the three sets of reads, we ran Tophat with the human reference genome and again with the mouse reference genome, then, as described in Section 2.1, the mappings were post-processed to determine which reads belonged to each of the four classes. Each of the four partitions of the sets of reads was then partitioned with Xenome to allow us to easily determine which reads were classified as the same by both procedures, and which were classified differently.
Figures 2, 3 and 4 summarize the results. For the three samples, the proportion of reads receiving the same classification were 82, 87 and 84%, respectively. As can be seen from the human and mouse only figures, both techniques are accurate, in as much as they misclassify only a small proportion of the reads (the worst case being the _Tophat_-based analysis of the human cDNA which misclassified 1.2% of the reads—all the other analyses misclassified 0.2–0.3%). The main difference between the _Tophat_-based and Xenome analyses is that the latter yields better specificity—the fraction of reads classed as both is significantly smaller in the Xenome analysis. To check for false positives for the human cDNA dataset, we also used BLAT (Kent, 2002) to map the 1.1 million reads which Xenome classed as human but which were not mapped to either genome by Tophat. Most of them were successfully mapped with high quality to the human reference by BLAT (about 90%). BLAT also mapped about 18% of them, with very variable quality, to the mouse reference. This supports our confidence in the accuracy of the Xenome algorithm. From this we can conclude that the in silico classification of sequences is feasible and accurate.
Fig. 2.

Summary of the results with Human cDNA. Each of the classes of reads is divided into those reads assigned to the class only by Xenome (Xenome), only by the Tophat analysis (Tophat) or by both Xenome and the Tophat analysis (Concordant)
Fig. 3.

Summary of the results with Murine cDNA
Fig. 4.

Summary of the results with BM18 xenograft cDNA
The second experiment, using RNA-Seq data from a prostate cancer xenograft into a mouse demonstrates that the classification works on a real mixture. As described above, we performed the same process to partition the reads into classes, then we used the refGene genome coordinates as calculated by Tophat to assign reads to genes, from which we computed an expression level using the fragments per kilobase of transcript per million mapped reads formula (Trapnell et al., 2010):
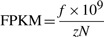
where f is the number of fragments (reads, for single ended data or pairs for paired data), z is the combined length of the exons of the gene and N is the total number of mapped fragments. Although this quantification is peripheral to the technique we are presenting, we have computed expression levels for the purposes of comparing with some qRT-PCR data for the same biological data. The qRT-PCR data were available for 18 genes: ABCG2, ALDH1A1, CD177, DLL1, DLL3, GLI1, GLI2, HES1, JAG1, JAG2, LGR5, NANOG, NOTCH1, NOTCH2, NOTCH3, PTCH1, PTCH2 and SMO. Figure 5 shows the log10_FPKM_ versus the difference of the _C_t for each target gene and the _C_t for actin (which was used as a housekeeping gene). With the exception of NANOG, the two methods correlate reasonably well (the Pearson's correlation coefficient is 0.80). We have investigated the NANOG data, and cannot explain the low FPKM. Whether this is a sequencing issue or a biological variation in the mice is unknown, but the low level of expression does not appear to be related to the behaviour of Xenome or Tophat.
Fig. 5.

Validation of the in silico classification of xenograft RNA-Seq data with qRT-PCR. The horizontal axis shows log10_FPKM_ for the _Xenome_-derived gene expression for the 18 test genes. The vertical axis shows the _C_t value for each gene relative to the C_t of actin. There were two RNA-Seq samples processed (biological replicates), and four replicates of the qRT-PCR. For each gene, an ellipse is shown centered on the mean log10_FPKM in the _x_-axis, and on the mean relative _C_t in the _y_-axis. The horizontal and vertical radii show the variance in the samples
4 DISCUSSION
We have presented a simple read classification method based on Tophat, and our refined classification approach, Xenome. Xenome can be used to efficiently and effectively partition the read set for subsequent processing by tools such as Tophat.
What is not apparent from the results above is the relative behaviour at the level of a single gene. It should be expected that the distribution of ambiguously mapped reads (classed as both) should be non-uniform, since some genes in the two genomes are more highly conserved than others.
The first result we present in Figure 6 on this point is an in silico analysis showing the proportion of each human gene (ignoring introns) covered by _k_-mers that are not classed as human. It is clear that the vast majority of genes contain few or no _k_-mers that are not classed as human.
Fig. 6.

An in silico analysis showing the degree of ambiguity in HG19 refGene, according to the _k_-mer based analysis used by Xenome. In this analysis, k = 25
The fraction of _k_-mers which are ambiguous gives a worst-case view of how Xenome might be expected to perform. In order for a read to be classified as both, all of its _k_-mersmust be of the both class, or there must be at least one _k_-mer from each of the two genomes (which happens less than 2% of the time in the samples we have tried). Conversely, a single host or graft _k_-mer is sufficient to classify the read into the respective class. Therefore for a read to be classified as both, the reference must contain a sufficiently long run of consecutive _k_-mers of class both and/or SNPs and sequencing errors must eliminate all the distinctively host or graft _k_-mers.
The second result we report on this point, presented in Figure 7 is the relative proportion of reads which are classified as both on a per-gene basis. What is evident in this figure is that although there are many genes for which the proportion of both reads is tightly correlated between Tophat and Xenome, there are a large number of genes for which the _Tophat_-based analysis has significantly more both reads. There are 15 591 genes for which there were at least 20 mapped reads in the BM18 xenograft sample. Of these, there were 65 for which Xenome assigned both or ambiguous to at least half the reads mapping to the gene; there were 498 for which the _Tophat_-based analysis assigned both to at least half the reads mapped to the gene. For the most highly conserved genes, there is not much that can be done with this data directly—further signal processing or other data would be required to determine the relative expression in the host and graft.
Fig. 7.

A plot showing the distribution of human genes with respect to the proportion of xenograft reads which are classed as both by the _Tophat_-based analysis and the Xenome analysis. The reads considered are only those mapped by Tophat since Xenome does not yield mappings, so cannot be used to assign reads to genes. Only genes for which at least 20 reads mapped were considered. The horizontal axis corresponds to the number of reads classified as both or ambiguous by Xenome as a proportion of all the reads that might possibly be human (i.e. both, ambiguous or human). The vertical axis corresponds to the number of reads classified as both by the _Tophat_-based analysis, once again, as a proportion of all the reads that might possibly be human
While we have developed Xenome with RNA-Seq on human/mouse xenografts in mind, we anticipate it will be an effective tool for other similar mixtures. For example, capturing the differential methylation around genes between host and graft using MeDIP-Seq may shed light on the interraction between the two.
The need for our technique is substantially motivated by the fact that for a xenograft to be viable there must be very strong homology between the host and graft organisms. This leads to a situation where there is a high probability that a read may map to either genome, and it is this problem that Xenome specifically addresses. A side benefit is that the classification is done independently for each read, and results in groups of reads in each class; each group may then be processed independently with further tools [such as _Tophat_, _Cufflinks_ (Roberts et al., 2011) or others]. Given that many kinds of analysis require global processing of the input data, being able to process a coherent subset of the data can lead to a time/space gain. This benefit extends beyond the sphere of xenografts. For example, there are situations where a parasite or pathogen cannot be cultured independently (for example Chlamydia, and some fungi), so samples will generally contain a mixture of host and pathogen. In some examples, although the pathogen can be cultured independently, there are phenotypic differences between organisms growing in culture and those growing in a host. In both cases, there are benefits to being able to classify the two groups of reads, even though straight mapping based approaches will be less sensitive to cross-talk than xenograft data.
Precise alignment and alignment-free methods represent different points along a spectrum of possible classification techniques. Fundamentally, both rely on establishing homology between a read and the host and/or graft references. By substituting different algorithms for establishing homology (e.g. various alignment algorithms, _k_-mer spectrum methods, etc.), different sensitivity and specificity might be achieved.
Although our current technique is built on simple set-based classification, there is clearly scope to develop statistical models which allow for a more subtle classification procedure. These could, for example, be based on the frequency of _k_-mersof different classes, giving rise to the computation of the likelihood that a read originated from either the host or graft genomes. Indeed, if such likelihoods were used from read alignments (Tophat unfortunately does not produce such scores), a unified model allowing either our current _k_-mer based model or alignments could be used.
A further extension could take into consideration the established homology between genes in the host and graft organisms. Where reads are ambiguous, non-ambiguous reads associated with the same gene homologues could be used to help disambiguate the classification. EM-based methods such as those described in Newkirk et al., (2011); Chung et al., (2011); Hormozdiari et al., (2010) would be a good basis for such an extension. We note however, that this would require significant conceptual changes to Xenome since it requires relatively more precise alignments.
It is instructive to consider a specific example of a gene where the Tophat based and Xenome analyses are very different. For the gene MYH3, in the human cDNA dataset, there are 29 reads classed as human by the _Tophat_-based analysis and 2 713 classed as human by Xenome. All the reads that are thus assigned by Xenome but not by the _Tophat_-based analysis were classed as both by the latter. This is because there is a high level of conservation in this gene between the two species, and the reads therefore aligned to both. Were Tophat to yield meaningful alignment quality scores, a statistical approach of the kind hinted at above may perform similarly to the _k_-mer based approach.
ACKNOWLEDGEMENT
National ICT Australia (NICTA) is funded by the Australian Government's Department of Communications; Information Technology and the Arts; Australian Research Council through Backing Australia's Ability; ICT Centre of Excellence programs.
Funding: Prostate Cancer Foundation of Australia (EDW) and the Victorian Government's Operational Infrastructure Support Program. EDW is supported by an Australian NHMRC Career Development Award [#519539] in part.
Conflict of Interest: none declared.
REFERENCES
- Arbitman Y., et al. 2010 IEEE 51st Annual Symposium on Foundations of Computer Science. Los Alamos California: IEEE Computer Society; 2010. Backyard cuckoo hashing: Constant worst-case operations with a succinct representation; pp. 787–796. [Google Scholar]
- Chung D., et al. Discovering transcription factor binding sites in highly repetitive regions of genomes with multi-read analysis of ChIP-Seq data. PLoS Comput. Biol. 2011;7:e1002111. doi: 10.1371/journal.pcbi.1002111. [DOI] [PMC free article] [PubMed] [Google Scholar]
- Conway T.C., Bromage A.J. Succinct data structures for assembling large genomes. Bioinformatics. 2011;27:479–486. doi: 10.1093/bioinformatics/btq697. [DOI] [PubMed] [Google Scholar]
- Ding L., et al. Genome remodelling in a basal-like breast cancer metastasis and xenograft. Nature. 2010;464:999–1005. doi: 10.1038/nature08989. [DOI] [PMC free article] [PubMed] [Google Scholar]
- Hormozdiari F., et al. Next-generation VariationHunter: combinatorial algorithms for transposon insertion discovery. Bioinformatics. 2010;26:i350–i357. doi: 10.1093/bioinformatics/btq216. [DOI] [PMC free article] [PubMed] [Google Scholar]
- Kent W. BLAT—the BLAST-like alignment tool. Genome Res. 2002;12:656–664. doi: 10.1101/gr.229202. [DOI] [PMC free article] [PubMed] [Google Scholar]
- Lin Y., et al. Comparative studies of de novo assembly tools for next-generation sequencing technologies. Bioinformatics. 2011;27:2031–2037. doi: 10.1093/bioinformatics/btr319. [DOI] [PMC free article] [PubMed] [Google Scholar]
- Li R., et al. De novo assembly of human genomes with massively parallel short read sequencing. Genome Res. 2010;20:265–272. doi: 10.1101/gr.097261.109. [DOI] [PMC free article] [PubMed] [Google Scholar]
- Luby M., Rackoff C. How to construct pseudorandom permutations from pseudorandom functions. SIAM J. Comput. 1988;17:373–386. [Google Scholar]
- McCulloch D., et al. \uppercaseBM18: a novel androgen-dependent human prostate cancer xenograft model derived from a bone metastasis. Prostate. 2005;65:35–43. doi: 10.1002/pros.20255. [DOI] [PubMed] [Google Scholar]
- Newkirk D., et al. AREM: aligning short reads from ChIP-sequencing by expectation maximization. J. Comput. Biol. 2011;18:1495–1505. doi: 10.1089/cmb.2011.0185. [DOI] [PMC free article] [PubMed] [Google Scholar]
- Okanohara D., Sadakane K. Practical entropy-compressed rank/select dictionary. Proceedings of the Workshop on Algorithm Engineering and Experiments (ALENEX'07) 2007 http://www.siam.org/proceedings/alenex/2007/alx07_007okanoharad2.pdf. [Google Scholar]
- Pagh R., Rodler F.F. Cuckoo hashing. J. Algorithms. 2004;51:122–144. [Google Scholar]
- Roberts A., et al. Identification of novel transcripts in annotated genomes using RNA-seq. Bioinformatics. 2011;27:2325–2329. doi: 10.1093/bioinformatics/btr355. [DOI] [PubMed] [Google Scholar]
- Samuels A., et al. Validation of a mouse xenograft model system for gene expression analysis of human acute lymphoblastic leukaemia. BMC Genomics. 2010;11:256. doi: 10.1186/1471-2164-11-256. [DOI] [PMC free article] [PubMed] [Google Scholar]
- Trapnell C., et al. TopHat: discovering splice junctions with RNA-Seq. Bioinformatics. 2009;25:1105–1111. doi: 10.1093/bioinformatics/btp120. [DOI] [PMC free article] [PubMed] [Google Scholar]
- Trapnell C., et al. Transcript assembly and quantification by {RNA-Seq} reveals unannotated transcripts and isoform switching during cell differentiation. Nat. Biotechnol. 2010;28:511–515. doi: 10.1038/nbt.1621. [DOI] [PMC free article] [PubMed] [Google Scholar]
- Wang Y., et al. In silico estimates of tissue components in surgical samples based on expression profiling data. Cancer Res. 2010 doi: 10.1158/0008-5472.CAN-10-0021. [DOI] [PMC free article] [PubMed] [Google Scholar]