Enhancement of Long-Wavelength Sensitivity of Optogenetic Microbial Rhodopsins by 3,4-Dehydroretinal (original) (raw)
. Author manuscript; available in PMC: 2013 Jun 5.
Published in final edited form as: Biochemistry. 2012 May 22;51(22):4499–4506. doi: 10.1021/bi2018859
Abstract
Electrogenic microbial rhodopsins (ion pumps and channelrhodopsins) are widely used to control activity of neurons and other cells by light (optogenetics). Long-wavelength absorption by optogenetic tools is desirable to increase the penetration depth of the stimulus light by minimizing tissue scattering and absorption by hemoglobin. A2 retinal (3,4-dehydroretinal) is a natural retinoid that serves as the chromophore in red-shifted visual pigments of several lower aquatic animals. Here we show that A2 retinal reconstitutes a fully functional archaerhodopsin-3 (AR-3) proton pump and four channelrhodopsin variants (_Cr_ChR1, _Cr_ChR2, _Ca_ChR1 and _Mv_ChR1). Substitution of A1 by A2 retinal significantly shifted the spectral sensitivity of all tested rhodopsins to longer wavelengths without altering other aspects of their function. The spectral shift upon substitution of A1 by A2 in AR-3 was close to that measured in other archaeal rhodopsins. Notably, the shifts in channelrhodopsins were larger than those measured in archaeal rhodopsins and close to those in animal visual pigments with similar absorption maxima of their A1-bound forms. Our results show that chromophore substitution provides a complementary strategy to improve the efficiency of optogenetic tools.
The need for precise targeted control of cell membrane potential can be addressed by using optogenetic tools, genetically encoded molecules activated by light. Microbial rhodopsins, seven-transmembrane proteins from prokaryotes and lower eukaryotes (1) have formed the basis of optogenetic technology. The only additional chemical supplementation that microbial rhodopsins require is all-_trans_-retinal, which naturally occurs in many mammalian tissues. Therefore, microbial rhodopsins, in a fundamental shift from earlier optogenetic approaches, provide a single-component strategy (2-3). Today, microbial rhodopsins have become widely used in neuroscience (4-6) and cardiology research (7), and this technology is expanding to non-excitable cells, such as astrocytes (8).
Rhodopsin ion pumps and channelrhodopsins are two major groups of microbial rhodopsins (9) used in optogenetics to hyperpolarize and depolarize the cell membrane, respectively. Rhodopsin pumps carry out membrane transport of protons or chloride ions coupled to the photocycle, providing a mechanism for utilization of solar energy in prokaryotes. The first such pump, bacteriorhodopsin from Halobacterium salinarum, was identified more than 40 years ago (10), and since then, rhodopsin ion pumps have been discovered in a large range of microorganisms, both pro- and eukaryotic (11). Expression of ion pumps in neurons allows fast silencing of their electrical activity by light-induced membrane hyperpolarization (12). Archaerhodopsin-3 (AR-3; aka Arch) from Halorubrum sodomense (13) is one of the most efficient optogenetic silencing tools (12, 14).
The first channelrhodopsins, ChR1 and ChR2, were found in the green flagellate alga Chlamydomonas reinhardtii and demonstrated to serve as receptors for photomotility behavior in this organism (15-17). Several other channelrhodopsin variants have been identified in related microorganisms (18-20). When expressed in heterologous systems, channelrhodopsins act as light-gated cation channels (hence their common name) (21-22).
Major challenges for optogenetic applications, especially in living animals, are scattering of the stimulating light by biological tissues and its absorption by hemoglobin. Optogenetic tools with long wavelength absorption would exhibit minimal light attenuation from these effects, but most microbial rhodopsins do not fall into this category. Several approaches have been taken to attempt to acquire red-shifted probes to reduce the light-attenuation by scattering and absorption in tissue: (i) searching for natural red-shifted channelrhodopsin variants in different algae (18-20); (ii) chimera construction (23-24); and (iii) site-directed mutagenesis (25-26). All of these approaches have in common modification of the apoprotein, and all have proved somewhat successful, although in some cases a desired spectral shift was accompanied by negative effects such as slowing down of the current kinetics (18), or a decrease in the current amplitude (25).
A2 retinal (3,4-dehydroretinal) is a natural retinoid, its 11-cis form being found in photoreceptor cells of certain invertebrates, fish and amphibians, where it either constitutes the only retinal, or is an additional chromophore to A1 retinal (27-29). The presence of an additional double bond in the ß-ionone ring of the chromophore results in visual pigments that absorb light at longer wavelengths, as compared to those formed with A1 (regular) retinal (30). Variations in A1/A2 ratio cause natural adaptive tuning of spectral sensitivity of vision in the organisms during adaptation to external conditions (for review see (31)). Reconstitution of bleached microbial rhodopsins (bacteriorhodopsin, halorhodopsin, and sensory rhodopsins I and II) in vitro with all-trans A2 retinal also shifts their absorption spectra to longer wavelengths (32-35).
It could be therefore expected that substitution of A2 for A1 retinal would also redshift the spectra of rhodopsin optogenetic probes, but this expectation required direct experimental verification. Moreover, it was not clear to what extent A2 retinal-bound probes would be functional. Finally, the magnitude of the expected spectral shift had to be determined, and its advantage for optogenetic applications estimated. In this study we show that upon addition of A2 retinal, both ion pumps and channelrhodopsins form fully functional pigments with significantly red-shifted absorption. Most importantly, we observed large extensions of spectral sensitivity to longer wavelengths even in the presence of endogenous A1 retinal that naturally occurs in mammalian cells. Our calculations show that out of all tested optogenetic probes the benefits of substitution of A1 by A2 are maximal for AR-3 and two long-wavelength absorbing channelrhodopsin variants, so that the expected tissue penetration depth becomes many fold higher after such substitution. Retinoids easily partition into lipid bilayers and thus do not require the presence of any specific carriers in the cells. Quantitative experiments with mammalian tissue demonstrated that 50% of retinal is absorbed already after ~7 min of perfusion (36). Therefore, chromophore substitution can be considered as a complementary strategy to improve the efficiency of optogenetic tools.
MATERIALS AND METHODS
Recording of charge movements in rhodopsin molecules
The AR-3 coding sequence was received from Dr. E.S. Boyden (Massachusetts Institute of Technology, Boston, MA) and cloned into the E. coli expression vector pET28b(+) under control of an IPTG inducible promoter. E. coli strain BL21(DE3) was used for protein expression. Cells were grown to OD600 = 0.4 and induced in the presence of 5 μM of A1 or A2 all-trans retinal, as described earlier for other microbial rhodopsins (37-38). Cells were harvested after 4 h, washed in distilled water and transferred to low-ionic strength medium (in mM): NaCl 1.5, CaCl2 0.15, MgCl2 0.15, Tris 5, pH 7.2. Photocurrents in suspension of cells were generated by 8-ns laser flashes applied along the direction between two platinum electrodes, as described earlier (39).
Expression and purification of CaChR1
A Pichia pastoris clone that expresses the 7TM domain of _Ca_ChR1 was obtained as described earlier (20). Cells were grown in BMMY (buffered minimal methanol yeast) medium, expression was induced by the addition of 0.5% methanol every 24 h in the presence of 5 MM A1 or A2 all-_trans_-retinal. Cells were grown for two days, harvested by low-speed centrifugation and disrupted by a bead beater. Membrane fragments were collected by centrifugation for 1 h at 48,000 rpm and used in hydroxylamine bleaching and retinal reconstitution experiments, or solubilized by incubation with 2 % dodecyl maltoside for 1 h. The protein was partially purified on a Ni-NTA agarose column (Qiagen, Hilden, Germany).
Absorption spectroscopy
Absorption spectra were recorded on a Cary 4000 spectrophotometer with integrating sphere (Varian, Palo Alto, CA). The absorption spectrum of E. coli cells without induction of expression was subtracted from those expressing A1- or A2-bound AR-3 to correct for scattering and intrinsic protein absorption.
Whole-cell patch clamp recording in HEK293 cells
HEK293 (human embryonic kidney) cells were transfected using the TransPass COS/293 transfection reagent (New England Biolabs, Ipswich, MA). A1 all-_trans_-retinal was added as a stock solution in ethanol at the final concentration of 2.5 μM. A2 all-_trans_-3,4-dehydroretinal was used in final concentrations of 5-25 μM. Measurements were performed 48-72 h after transfection with an Axopatch 200B amplifier (Molecular Devices, Union City, CA). The signals were digitized with a Digidata 1440A using pClamp 10 software (both from Molecular Devices). Patch pipettes with resistances of 2-5 MΩ were fabricated from borosilicate glass and filled with the following solution (in mM): KCl 126, MgCl2 2, CaCl2 0.5, EGTA 5, HEPES 25, pH 7.4. The bath solution contained (in mM): NaCl 150, CaCl2 1.8, MgCl2 1, glucose 5, HEPES 10, pH 7.4. The holding potential was −60 mV. Light excitation was provided by a Polychrome IV light source (T.I.L.L. Photonics GMBH, Grafelfing, Germany) pulsed with a mechanical shutter (Uniblitz Model LS6, Vincent Associates, Rochester, NY; half opening time 0.5 ms). The light intensity was attenuated with the built-in Polychrome system or with neutral density filters. Maximal quantum density at the focal plane of the 40x objective lens was ~2 × 10²² photons × m−2.
A1 all-trans retinal was from Sigma, and A2 all-trans retinal was a gift from Dr. R.K. Crouch, Medical University of South Carolina, Charleston, SC (at least 99% pure as tested by HPLC).
RESULTS
Archaerhodopsin proton pump from Halorubrum sodomense (AR-3)
AR-3 has been recently shown to be the most effective among available ion pumps for silencing neurons (12). First, we analyzed the effect of A2 retinal on the proton pump AR-3 expressed in E. coli cells, since this expression system allows quantitative measurements of absorption and fast charge movements within rhodopsin molecules.
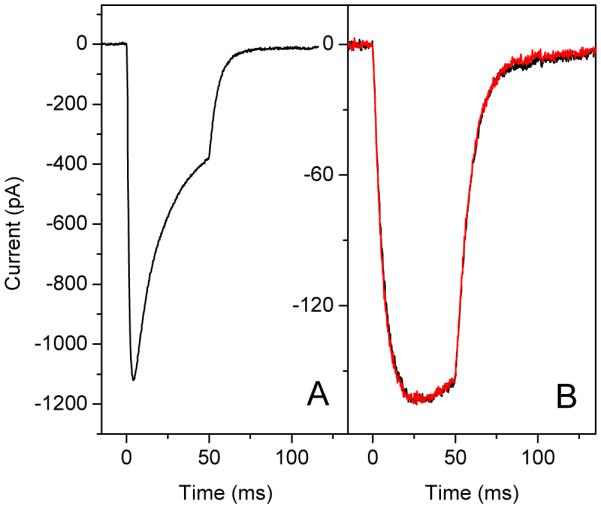
We expressed AR-3 in the presence of A1 or A2 retinal. The absorption spectra, corrected for light scattering and minor differences in the amount of cytochromes caused by expression of a foreign protein are presented in Fig. 1. The absorption maximum of the A2-bound AR-3 in E. coli cells shifted to 592 nm from 561 nm measured in the A1-bound pigment (shift of 31 nm, or 933 cm−1). The shift of the wavelength of half-maximal absorption on the red slope of the spectrum was even greater, from 599 to 639 nm (40 nm, 1045 cm−1). Such widening of the bandwidth along with the shift of the maximum to longer wavelengths has been previously noted in the spectra of animal visual pigments formed with A2 retinal (40). When compared with A1-bound AR-3, the pigment formed with A2 retinal exhibited very similar kinetics of intramolecular charge movements with a slightly faster decay of the fast current associated with proton transfer from the retinylidene Schiff base to the proton acceptor, which corresponds to formation of the M intermediate (the current traces in Fig. 2), and slightly slower reprotonation of the Schiff base (better resolved in the charge traces in Fig. 2).
FIGURE 1.
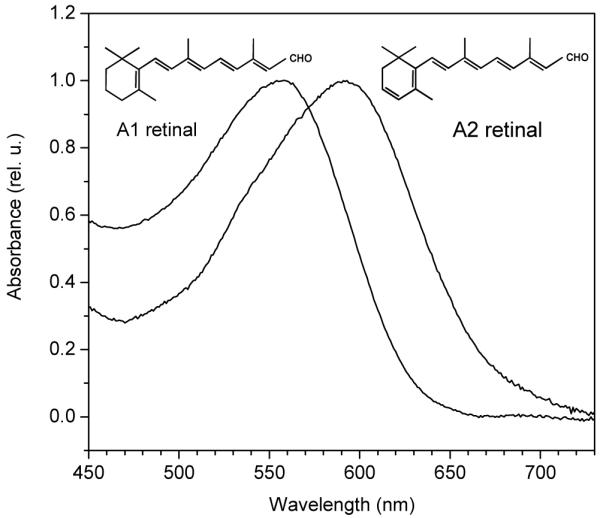
Absorption spectra of E. coli cells expressing the proton pump AR-3 upon reconstitution with A1 or A2 retinal.
FIGURE 2.
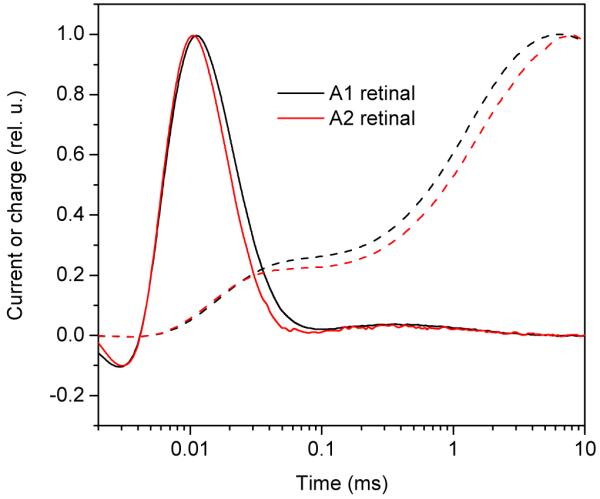
Photoinduced electrical signals by AR-3 expressed in E. coli in the presence of A1 (black traces) or A2 (red traces) retinal. Solid lines, current traces; dashed lines; transmembrane charge transfer (calculated as area under the current traces). Both sets of curves were normalized for easier kinetics comparison.
The spectral sensitivity of photoelectric responses in E. coli cells as well as in HEK293 cells was measured at very low light intensities (in the range where the dependence was close to linear) to avoid distortion and facilitate correction for the number of photons. In the case of continuous light excitation of HEK293 cells only the initial part of the current signals up to 20 ms was measured to minimize the involvement of possible photoreactions of photocycle intermediates. Photocurrents were normalized according to the number of photons in each laser flash or light pulse.
In full agreement with the results of absorption measurements, the action spectrum of the charge movement in A2-bound AR-3 was red-shifted by ~35 nm with a half maximum efficiency at > 640 nm (Fig. 3, solid symbols, solid lines). This confirms that the charge movement registered in a suspension of E. coli cells is generated by the A2-bound AR-3, and not by a pigment fraction formed with trace A1 retinal in our A2 retinal preparation.
FIGURE 3.
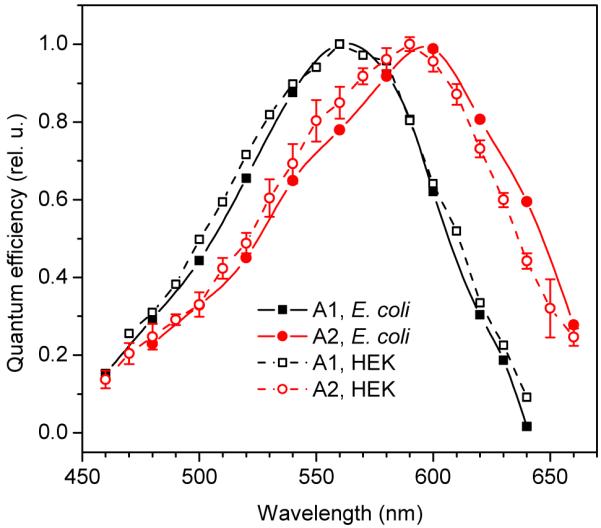
Action spectra of charge movement by AR-3 expressed in E. coli cells (solid symbols and lines) or HEK293 cells (open symbols, dashed lines) in the presence of A1 retinal (black symbols and lines) or A2 retinal (red symbols and lines). Errors bars were of the same magnitude for all spectra, but for presentation purposes are shown only for one of them.
Next we compared A1- and A2-bound AR-3 expressed in HEK293 cells. Light-induced hyperpolarizing currents of A2-bound AR-3 did not significantly differ in the amplitudes and kinetics of corresponding currents generated by AR-3 formed with A1 retinal (data not shown). The action spectra of the photocurrents in HEK cells (Fig. 3, open symbols, dashed lines) were essentially similar to those of charge movement in E. coli cells (Fig. 3, filled symbols, solid lines), but the relative contribution of the short-wavelength shoulder at ~540 nm was stronger. As explained in more detail below, we attribute this contribution to the pigment formed with endogenous A1 retinal present in HEK cells (23).
Channelrhodopsins from green flagellate algae
More than ten native channelopsin sequences have already been cloned from different algae (41), although only a few of them have been so far tested in neurons. _Ca_ChR1 is a variant recently identified in the psychrophilic species C. augustae (20). The maximal sensitivity of A1-bound _Ca_ChR1 at neutral pH is at 520 nm (Fig. 4A, open squares), 35 nm red-shifted compared to that of the previously known _Cr_ChR1 (17). We tested it first out of the channelrhodopsins, because it could be expressed in both animal cells and P. pastoris, from which it could be solubilized and partially purified for absorption spectroscopy (20). The addition of A2 retinal to HEK cells transfected with _Ca_ChR1 led to the appearance of a strongly red-shifted pigment form obvious from the shape of the action spectrum (Fig. 4A, solid symbols). The position of the main maximum shifted only slightly, but a prominent long-wavelength shoulder appeared at the position of ~550 nm, leading to a significant increase in the bandwidth. The long-wavelength slope of the spectrum was shifted from 557 to 589 nm at the level of 50% efficiency (32 nm). Similar results were obtained when absorption spectra of _Ca_ChR1 expressed in Pichia in the presence of A1 or A2 retinal were measured directly (Fig. 4B). It was however unclear whether these spectra also reflected a contribution of the pigment formed with endogenous A1 retinal.
FIGURE 4.

(A) Action spectra of photocurrents generated by _Ca_ChR1 from C. augustae in HEK293 cells incubated with A2 retinal (solid symbols, solid lines), or A1 retinal (open symbols, dashed line, adopted from (20)). Final concentration of A2 retinal was 5 (solid triangles) or 25 (solid squares) μM, that of A1 retinal was 2.5 μM. (B) Absorption spectra of purified _Ca_ChR1 expressed in Pichia cells in the presence of 5 μM of A2 (solid line) or A1 retinal (dashed line).
To answer this question, we carried out hydroxylamine bleaching and retinal reconstitution experiments with _Ca_ChR1 in Pichia membranes. Hydroxylamine cleaves the chromophore from opsin and reacts with free aldehydes in solution to form oximes, and thus can be used to remove retinal from the preparation. Cells were grown in the presence of A1 retinal, and the membrane fraction was isolated and bleached with 10 mM hydroxylamine. The spectral difference between the initial and bleached preparations closely corresponded to the absorption spectrum of purified _Ca_ChR1 expressed in Pichia in the presence of A1, and the bleaching was strongly accelerated by illumination (Supporting Fig. 1). After complete bleaching, hydroxylamine was extensively diluted out by repetitive centrifugation. A1 retinal, A2 retinal, or their 1:1 mixture were added to the membranes at concentrations producing equal absorbance. Reconstitution spectra obtained by subtraction of the spectrum of the bleached preparation from those measured after incubation with retinals are shown in Fig. 5. The reconstitution spectrum obtained with A1 retinal showed a maximum at 520 nm (Fig. 5, black line), whereas that produced with A2 retinal was at 551 nm with a pronounced shoulder at 523 nm (Fig. 5, red line). The relative affinities of _Ca_ChR1 for A1 and A2 retinal could be estimated from the spectrum of _Ca_ChR1 reconstituted with their mixture (Fig. 5, green line). The ratio of the absorbance at the spectral maxima of A2- and A1-reconstituted pigments, and hence the fraction of the A2-reconstituted _Ca_ChR1, was proportional to the fraction of the added A2 retinal (Supporting Fig. 2), showing that _Ca_ChR1 had similar affinities for A1 and A2 retinal. We therefore conclude that the short wavelength band in the spectrum of A2-reconstituted _Ca_ChR1 (Fig. 5, red line) did not result from incorporation of trace A1 retinal in our A2 sample (< 1%), but reflected a vibrational fine structure of the A2 pigment spectrum. Comparison of the reconstitution spectra obtained with A1 and A2 retinal showed that chromophore substitution in _Ca_ChR1 resulted in a redshift of the spectral maximum of ~1080 cm−1, and an increase in the bandwidth from 96 to 125 nm.
FIGURE 5.
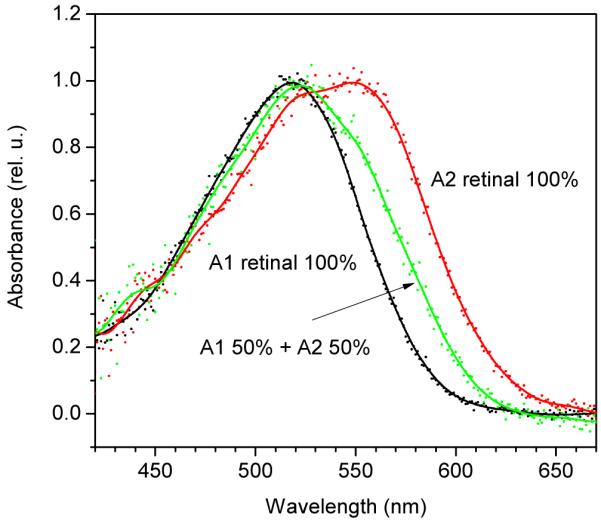
Reconstitution spectra of _Ca_ChR1 in bleached Pichia membranes measured after the addition of A1 retinal (black symbols and line), a mixture of A1 and A2 retinal (green symbols and line), or A2 retinal (red symbols and line). Symbols, experimental data points; lines, 15 nm FFT smoothing of the data. For other details see text.
The relative amplitude of the short-wavelength band in the spectrum of _Ca_ChR1 reconstituted with A2 retinal in vitro (Fig. 5, red line) was significantly lower than that in the action spectrum of photocurrents generated by _Ca_ChR1 in HEK cells incubated with A2 (Fig. 4A, solid symbols, solid lines) and in the absorption spectrum of _Ca_ChR1 purified from Pichia grown in the presence of A2 (Fig.4B, solid line). Our interpretation is that the pigment formed with endogenous A1 retinal in HEK cells and in Pichia contributed to the latter two spectra. The effect of A2 retinal in HEK cells could be increased by elevation of its concentration (compare solid triangles and solid squares in Fig. 4A). From the calibration curve (Supporting Fig. 2) based on the results of reconstitution experiments with A1 retinal, A2 retinal, and their mixture (Fig. 5), the contribution of endogenous A1 retinal to pigment formation in HEK293 cells and Pichia was < 50% when 5 μM A2 retinal was used (Fig. 4A, solid triangles and Fig. 4B), and dropped to < 20% when A2 retinal concentration was increased to 25 μM (Fig. 4A, solid squares).
The concentration of _Ca_ChR1 in Pichia membranes was sufficient for bleaching and retinal reconstitution experiments. We examined the effect of A2 on the spectral properties of three other channelrhodopsins by measuring action spectra of photocurrents generated by them in HEK cells.
_Cr_ChR2 is the channelrhodopsin variant most widely used to activate neuron firing. Its advantages, i.e. high ion conductance and/or expression level in animal cells, are however combined with short-wavelength absorption (the maximum is at 475 nm (42)). Incubation of _Cr_ChR2-transfected HEK cells with A2 retinal caused significant changes in the action spectrum of light-induced currents (Fig. 6). The spectrum measured with A2 retinal (Fig. 6, solid symbols, solid line) showed a strongly pronounced shoulder above 500 nm, so that the position of the long-wavelength slope of the spectrum (assessed by the wavelength of half-maximal response) was redshifted from 501 nm measured with A1 retinal to 533 nm (shift of 32 nm, 1198 cm−1). The action spectrum measured with A1 retinal exhibited a pronounced fine structure (Fig. 6, open symbols), also visible in the absorption spectrum of the purified pigment (43), reflecting the presence of vibrational substates. Vibrational fine structure may also be present in the spectrum of the A2-bound pigment. In this case the long-wavelength shoulder in the action spectrum measured with A2 retinal may signify an enhanced vibrational band, as observed in the spectrum of the A2-reconstituted haloarchaeal sensory rhodopsin II (35). Precise determination of the absorption maximum of the A2-bound _Cr_ChR2 from the action spectrum of photocurrents and, hence, calculation of the red-shift upon substitution with A2 retinal is difficult because of the contribution of endogenous A1 retinal to pigment formation. Nevertheless, a significant red-shift in the position of the long-wavelength slope of the action spectrum in cells incubated with A2 retinal (Fig. 6) is promising for practical optogenetic applications.
FIGURE 6.
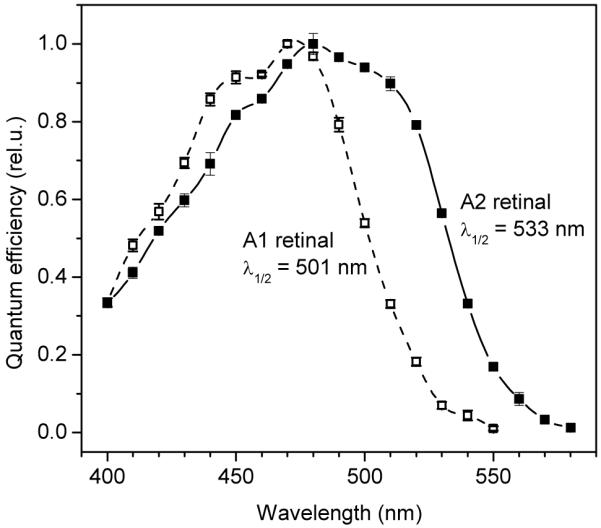
Action spectra of photoinduced currents generated by _Cr_ChR2 in HEK293 cells after incubation with A2 retinal (solid symbols, solid line), or A1 retinal (open symbols, dashed line).
The relative efficiencies of A1- and A2-bound _Cr_ChR2 appear to be similar, since photoelectric currents induced by green light absorbed only by the A2 form reach similar high values (above 1 nA, Fig. 7A) as the currents generated by the A1 pigment. Quantitative determination is difficult because the relative concentrations of the two forms are unknown. Quantitative comparison of the kinetics of the photocurrents generated by A1- and A2-bound _Cr_ChR2 can be done by using low light intensities to avoid saturation effects in the system of two pigments with overlapping absorption. As shown in Fig. 7B, photocurrents generated in response to 440-nm light (absorbed primarily by the A1 form), and to 530-nm light (absorbed essentially by the A2 form) were almost identical. In summary, we conclude that substitution of A1 retinal with A2 retinal does not significantly affect the channel properties of _Cr_ChR2, but shifts its absorption range. Substitution of A2 for A1 retinal also did not affect the kinetics of the photocurrents generated by the three other tested channelrhodopsins (data not shown).
FIGURE 7.
(A) Photoelectric currents generated by _Cr_ChR2 in HEK293 cells incubated with A2 retinal in response to high-intensity stimuli (~1022 photons × m2 × s−1) at 520 nm. (B) Comparison of the current kinetics at low intensity (<1020 photons × m2 × s−1) in response to 440 nm light, mostly absorbed by the A1-bound pigment (black line), and 530 nm light, mostly absorbed by the A2-bound pigment (red line).
Another C. reinhardtii channelrhodopsin, _Cr_ChR1, mediates phototaxis in native algal cells with a spectral maximum at 505 nm (15). Absorption of this pigment is pH-dependent when heterologously expressed and purified from COS cells with an acidic 505-nm form and an alkaline ~463-nm form (17). The action spectrum of _Cr_ChR1-mediated photocurrent in HEK cells incubated with A1 retinal at pH 7.4 had its main maximum at 485 nm with a shoulder at ~510 nm (Fig. 8A, open symbols, dashed line). Incubation with A2 retinal strongly shifted the entire spectrum to longer wavelengths, so that the main peak was at 520 nm and the shoulder was at ~555 nm (Fig. 8A, solid symbols, solid line). We interpret the main maxima and shoulders of both spectra as contributions of, respectively, the alkaline and acidic forms of the A1 and A2 pigments. In this case the A2-induced red-shift of the alkaline form would be ~1,400 cm−1, and that of the acidic form, ~1,600 cm−1. However, these values can be considered only as rough estimates, because the precise positions of the spectral maxima of individual overlapping pigment forms are difficult to determine. Our interpretation that both alkaline and acidic forms were red-shifted upon substitution of A2 for A1 retinal was confirmed by calculation of the difference action spectra measured in response to a pH jump (Supporting Fig. 3). Both A1 and A2 pigments showed the pH-dependent red-shift, and the curve for the A2-bound _Cr_ChR1 was red-shifted ~35 nm from that for the A1 pigment.
FIGURE 8.

Action spectra of photocurrents generated by _Cr_ChR1 (A) or _Mv_ChR1 (B) in HEK293 cells incubated with A2 retinal (solid symbols, solid lines), or A1 retinal (open symbols, dashed lines, adopted from (20) and (19), respectively).
_Mv_ChR1 from M. viride is to date the most red-shifted native channelrhodopsin, with a peak sensitivity at neutral pH at 528 nm (19). The action spectrum of photocurrents measured after the incubation of _Mv_ChR1-transfected cells with A2 retinal had a main maximum at 570 nm (Fig. 8B, solid symbols, solid line), rather than a long-wavelength shoulder as was measured in the spectra for other tested channelrhodopsins (Figs. 4, 6 and 8A). This value can be considered as the lower limit for the spectral maximum of the A2-bound pigment, because a contribution of the pigment formed with endogenous A1 retinal is expected to shift it to shorter wavelengths. Therefore, the magnitude of the A2-induced redshift in _Mv_ChR1 is ≥1400 cm−1. The long-wavelength slope of the spectrum obtained with A2 retinal was shifted from 574 to 614 nm (shift of 40 nm, 1135 cm−1).
DISCUSSION
Our results show that the proton pump AR-3 and four tested channelrhodopsin variants, _Cr_ChR1, _Cr_ChR2, _Ca_ChR1 and _Mv_ChR1, incorporated A2 retinal and produced functional proteins, the spectra of which were significantly red-shifted from those of the corresponding A1 retinal pigments. The magnitude of the A2-induced spectral shift in AR-3 was very close to the shifts measured earlier in other archaeal rhodopsins (≤950 cm−1) (32-34). The magnitude of the A2-induced shift in animal visual pigments depends on the absorption maximum of their A1-bound forms, which varies over a wide spectral range (30, 44-45). The shifts in _Ca_ChR1, _Cr_ChR1 and _Mv_ChR1 were significantly larger than those measured in archaeal rhodopsin pumps and similar to those in animal visual pigments with corresponding absorption maxima of their A1 bound forms. One of the factors that contributes to color tuning in visual rhodopsins is the ring-chain geometry of the chromophore (46). However, the spectral difference between A1- and A2-channelrhodopsins cannot be explained by specific selection for 6-s-cis and 6-s-trans conformations, respectively, because it has been previously shown that C. reinhardtii channelrhodopsins use the 6-s-trans conformation and the 6 s cis conformation of retinal does not form a functional pigment (47-49).
The spectral shifts to longer wavelength observed in all tested rhodopsins upon the addition of A2 retinal are expected to be beneficial for optogenetic applications, especially in live animals, because light scattering decreases with the increase of wavelength. However, light scattering is not the only factor to consider; another, especially significant in brain tissue studies, is absorption by hemoglobin. Out of all tested channelrhodopsins, only _Ca_ChR1 and _Mv_ChR1 formed with A2 retinal showed significant sensitivity to wavelengths above the long-wavelength boundary of hemoglobin absorption (Fig. 9A).
FIGURE 9.

(A) Extension of the long wavelength spectral boundary of the proton pump AR-3 and various channelrhodopsins by incubation with A2 retinal. Bars show the spectral bands with more than 1/e of maximal efficiency for the pigments formed with A1 (blue) or A2 (red) retinal. The absorption spectrum of hemoglobin (oxidized + reduced) is shown for comparison. (B) Theoretical estimation of the total number of actinic photons absorbed over the visible range by the tested rhodopsins at different depths of brain tissue (for more details see text). Solid symbols and lines, pigments formed with A2 retinal; open symbols and dashed lines, pigments with A1 retinal. Black, AR-3; red, _Cr_ChR1; green, _Cr_ChR2; blue, _Ca_ChR1; cyan, _Mv_ChR1.
To estimate the potential benefits of the use of A2 retinal in neuroscience optogenetic applications, we calculated the total number of actinic photons absorbed by the corresponding A2 and A1 pigments over the visible spectral range at different depths of brain tissue. To this end, we multiplied the action spectra of photocurrents recorded in HEK293 cells that express the corresponding opsins incubated with A1 or A2 retinal by the spectral distribution of light intensities derived from absolute values of light attenuation by brain tissue (provided by Dr. Zhun Xu from Dr. Lihong Wang’s laboratory, Washington University at St. Louis, personal communication). The area under resultant curves proportional to the number of photons absorbed by each pigment was plotted in Fig. 9B as a function of the distance from the brain surface. The curves were normalized to the values at the surface to compare attenuation of actinic light for different pigments.
It follows from this calculation that the total absorption of short-wavelength channelrhodopsins (such as _Cr_ChR2) will sharply decrease within the tissue. Substitution of A2 for A1 will not improve significantly the situation, because a decrease in light scattering will be compromised by an increase in hemoglobin absorption. Nevertheless, control of the spectral properties of _Cr_ChR2 by chromophore substitution can be useful in such experiments when the absorption range of _Cr_ChR2 overlaps with excitation or emission wavelengths of fluorescent dyes or FRET measurements (Dr. Erik Jorgensen, University of Utah, personal communication).
According to our calculations, all tested rhodopsins with red-shifted absorption (_Ca_ChR1, _Mv_ChR1, and AR-3) are expected to permit optogenetic activation in deep layers, even when bound to A1 retinal. Substitution of A2 for A1 retinal in these rhodopsins will increase their efficiency significantly (Fig. 9B). The greatest calculated effect was for _Mv_ChR1. At 1 cm depth the total number of photons absorbed by the A2-bound pigment will be 13-fold greater than that absorbed by the A1-bound pigment.
Our measurements demonstrate that A2 retinal can be effectively used to improve the performance of optogenetic tools in cultured cells even in the presence of endogenous A1 retinal, and the calculations show that the benefits will be even greater for intact tissues. The possibility of using A2 retinal in living animals is supported by earlier results obtained with synthetic retinoids. In vitamin A-deprived rats, intraperitoneal injection of a retinal analog resulted in its rapid incorporation into a major fraction of available opsin (50). However, future studies are needed to test if a similar procedure will work for A2 retinal.
Supplementary Material
1_si_001
ACKNOWLEDGMENT
We thank Elena N. Spudich, C. Elizabeth Lane and Li Hai for their help with expression of AR-3 in E. coli and expression and purification of _Ca_ChR1 from P. pastoris. We also thank Rosalie K. Crouch (Medical University of South Carolina, Charleston SC) for her generous gift of 3,4-dehydroretinal, and Edward S. Boyden (Massachusetts Institute of Technology, Boston MA) for the AR-3 gene, and both for valuable discussions.
Footnotes
†
The work was supported by grant R37GM027750 from the National Institute of General Medical Sciences, RC1AG035779 from the National Institute on Aging, the Hermann Eye Fund, and endowed chair AU-0009 from the Robert A. Welch Foundation. The content is solely the responsibility of the authors and does not necessarily represent the official views of the National Institutes on Aging, General Medical Sciences, or the National Institutes of Health.
REFERENCES
- 1.Spudich JL, Yang C-S, Jung K-H, Spudich EN. Retinylidene proteins: structures and functions from archaea to humans. Annu. Rev. Cell Dev. Biol. 2000;16:365–392. doi: 10.1146/annurev.cellbio.16.1.365. [DOI] [PubMed] [Google Scholar]
- 2.Chow BY, Chuong AS, Klapoetke NC, Boyden ES. Synthetic physiology strategies for adapting tools from nature for genetically targeted control of fast biological processes. Methods Enzymol. 2011;497:425–443. doi: 10.1016/B978-0-12-385075-1.00018-4. [DOI] [PMC free article] [PubMed] [Google Scholar]
- 3.Deisseroth K. Optogenetics. Nat. Methods. 2011;8:26–29. doi: 10.1038/nmeth.f.324. [DOI] [PMC free article] [PubMed] [Google Scholar]
- 4.LaLumiere RT. A new technique for controlling the brain: optogenetics and its potential for use in research and the clinic. Brain Stimul. 2011;4:1–6. doi: 10.1016/j.brs.2010.09.009. [DOI] [PubMed] [Google Scholar]
- 5.Schoenenberger P, Scharer YP, Oertner TG. Channelrhodopsin as a tool to investigate synaptic transmission and plasticity. Exp. Physiol. 2011;96:34–39. doi: 10.1113/expphysiol.2009.051219. [DOI] [PubMed] [Google Scholar]
- 6.Yizhar O, Fenno L, Zhang F, Hegemann P, Diesseroth K. Microbial opsins: a family of single-component tools for optical control of neural activity. Cold Spring Harb. Protoc. 2011;2011 doi: 10.1101/pdb.top102. top102. [DOI] [PubMed] [Google Scholar]
- 7.Arrenberg AB, Stainier DY, Baier H, Huisken J. Optogenetic control of cardiac function. Science. 2010;330:971–974. doi: 10.1126/science.1195929. [DOI] [PubMed] [Google Scholar]
- 8.Figueiredo M, Lane S, Tang F, Liu BH, Hewinson J, Marina N, Kasymov V, Souslova EA, Chudakov DM, Gourine AV, Teschemacher AG, Kasparov S. Optogenetic experimentation on astrocytes. Exp. Physiol. 2011;96:40–50. doi: 10.1113/expphysiol.2010.052597. [DOI] [PubMed] [Google Scholar]
- 9.Spudich JL, Jung K-H. Handbook of Photosensory Receptors. Wiley-VCH; Weinheim: 2005. Microbial rhodopsins: phylogenetic and functional diversity; pp. 1–23. [Google Scholar]
- 10.Oesterhelt D, Stoeckenius W. Rhodopsin like protein from the purple membrane of Halobacterium halobium. Nature. 1971;233:149–152. doi: 10.1038/newbio233149a0. [DOI] [PubMed] [Google Scholar]
- 11.Brown L, Jung K. Bacteriorhodopsin-like proteins of eubacteria and fungi: the extent of conservation of the haloarchaeal proton-pumping mechanism. Photochem. Photobiol. Sci. 2006;5:538–546. doi: 10.1039/b514537f. [DOI] [PubMed] [Google Scholar]
- 12.Chow BY, Han X, Dobry AS, Qian X, Chuong AS, Li M, Henninger MA, Belfort GM, Lin Y, Monahan PE, Boyden ES. High-performance genetically targetable optical neural silencing by light-driven proton pumps. Nature. 2010;463:98–102. doi: 10.1038/nature08652. [DOI] [PMC free article] [PubMed] [Google Scholar]
- 13.Mukohata Y, Ihara K, Tamura T, Sugiyama Y. Halobacterial rhodopsins. J. Biochem. 1999;125:649–657. doi: 10.1093/oxfordjournals.jbchem.a022332. [DOI] [PubMed] [Google Scholar]
- 14.Han X, Chow BY, Zhou H, Klapoetke NC, Chuong A, Rajimehr R, Yang A, Baratta MV, Winkle J, Desimone R, Boyden ES. A high-light sensitivity optical neural silencer: development and application to optogenetic control of non human primate cortex. Front. Syst. Neurosci. 2011;5:18. doi: 10.3389/fnsys.2011.00018. [DOI] [PMC free article] [PubMed] [Google Scholar]
- 15.Sineshchekov OA, Jung K-H, Spudich JL. Two rhodopsins mediate phototaxis to low- and high intensity light in Chlamydomonas reinhardtii. Proc. Natl. Acad. Sci. USA. 2002;99:8689–8694. doi: 10.1073/pnas.122243399. [DOI] [PMC free article] [PubMed] [Google Scholar]
- 16.Govorunova EG, Jung K-W, Sineshchekov OA, Spudich JL. Chlamydomonas sensory rhodopsins A and B: Cellular content and role in photophobic responses. Biophys. J. 2004;86:2342–2349. doi: 10.1016/S0006-3495(04)74291-5. [DOI] [PMC free article] [PubMed] [Google Scholar]
- 17.Berthold P, Tsunoda SP, Ernst OP, Mages W, Gradmann D, Hegemann P. Channelrhodopsin-1 initiates phototaxis and photophobic responses in Chlamydomonas by immediate light induced depolarization. Plant Cell. 2008;20:1665–1677. doi: 10.1105/tpc.108.057919. [DOI] [PMC free article] [PubMed] [Google Scholar]
- 18.Zhang F, Prigge M, Beyriere F, Tsunoda SP, Mattis J, Yizhar O, Hegemann P, Deisseroth K. Red-shifted optogenetic excitation: a tool for fast neural control derived from Volvox carteri. Nat. Neurosci. 2008;11:631–633. doi: 10.1038/nn.2120. [DOI] [PMC free article] [PubMed] [Google Scholar]
- 19.Govorunova EG, Spudich EN, Lane CE, Sineshchekov OA, Spudich JL. New channelrhodopsin with a red-shifted spectrum and rapid kinetics from Mesostigma viride. mBio. 2011;2:e00115–00111. doi: 10.1128/mBio.00115-11. [DOI] [PMC free article] [PubMed] [Google Scholar]
- 20.Hou SY, Govorunova EG, Ntefidou M, Lane CE, Spudich EN, Sineshchekov OA, Spudich JL. Diversity of Chlamydomonas channelrhodopsins. Photochem. Photobiol. 2012;88:119–128. doi: 10.1111/j.1751-1097.2011.01027.x. [DOI] [PMC free article] [PubMed] [Google Scholar]
- 21.Nagel G, Ollig D, Fuhrmann M, Kateriya S, Musti AM, Bamberg E, Hegemann P. Channelrhodopsin-1: a light-gated proton channel in green algae. Science. 2002;296:2395–2398. doi: 10.1126/science.1072068. [DOI] [PubMed] [Google Scholar]
- 22.Nagel G, Szellas T, Huhn W, Kateriya S, Adeishvili N, Berthold P, Ollig D, Hegemann P, Bamberg E. Channelrhodopsin-2, a directly light-gated cation-selective membrane channel. Proc. Natl. Acad. Sci. USA. 2003;100:13940–13945. doi: 10.1073/pnas.1936192100. [DOI] [PMC free article] [PubMed] [Google Scholar]
- 23.Wang H, Sugiyama Y, Hikima T, Sugano E, Tomita H, Takahashi T, Ishizuka T, Yawo H. Molecular determinants differentiating photocurrent properties of two channelrhodopsins from Chlamydomonas. J. Biol. Chem. 2009;284:5685–5696. doi: 10.1074/jbc.M807632200. [DOI] [PubMed] [Google Scholar]
- 24.Wen L, Wang H, Tanimoto S, Egawa R, Matsuzaka Y, Mushiake H, Ishizuka T, Yawo H. Opto-current-clamp actuation of cortical neurons using a strategically designed channelrhodopsin. PLoS One. 2010;5:e12893. doi: 10.1371/journal.pone.0012893. [DOI] [PMC free article] [PubMed] [Google Scholar]
- 25.Gunaydin LA, Yizhar O, Berndt A, Sohal VS, Deisseroth K, Hegemann P. Ultrafast optogenetic control. Nat. Neurosci. 2010;13:387–392. doi: 10.1038/nn.2495. [DOI] [PubMed] [Google Scholar]
- 26.Berndt A, Schoenenberger P, Mattis J, Tye KM, Deisseroth K, Hegemann P, Oertner TG. High-efficiency channelrhodopsins for fast neuronal stimulation at low light levels. Proc. Natl. Acad. Sci. USA. 2011;108:7595–7600. doi: 10.1073/pnas.1017210108. [DOI] [PMC free article] [PubMed] [Google Scholar]
- 27.Jokela-Maatta M, Pahlberg J, Lindstrom M, Zak PP, Porter M, Ostrovsky MA, Cronin TW, Donner K. Visual pigment absorbance and spectral sensitivity of the Mysis relicta species group (Crustacea, Mysida) in different light environments. J. Comp. Physiol. A: Neuroethol. Sens. Neural. Behav. Physiol. 2005;191:1087–1097. doi: 10.1007/s00359-005-0039-8. [DOI] [PubMed] [Google Scholar]
- 28.Ala-Laurila P, Donner K, Crouch RK, Cornwall MC. Chromophore switch from 11-cis-dehydroretinal (A2) to 11 cis retinal (A1) decreases dark noise in salamander red rods. J. Physiol. 2007;585:57–74. doi: 10.1113/jphysiol.2007.142935. [DOI] [PMC free article] [PubMed] [Google Scholar]
- 29.Toyama M, Hironaka M, Yamahama Y, Horiguchi H, Tsukada O, Uto N, Ueno Y, Tokunaga F, Seno K, Hariyama T. Presence of rhodopsin and porphyropsin in the eyes of 164 fishes, representing marine, diadromous, coastal and freshwater species - a qualitative and comparative study. Photochem. Photobiol. 2008;84:996–1002. doi: 10.1111/j.1751-1097.2008.00344.x. [DOI] [PubMed] [Google Scholar]
- 30.Dartnall HJ, Lythgoe JN. The spectral clustering of visual pigments. Vision Res. 1965;5:81–100. doi: 10.1016/0042-6989(65)90057-x. [DOI] [PubMed] [Google Scholar]
- 31.Carleton K. Cichlid fish visual systems: mechanisms of spectral tuning. Integr. Zool. 2009;4:75–86. doi: 10.1111/j.1749-4877.2008.00137.x. [DOI] [PubMed] [Google Scholar]
- 32.Tokunaga F, Ebrey T. The blue membrane: the 3-dehydroretinal-based artificial pigment of the purple membrane. Biochemistry. 1978;17:1915–1922. doi: 10.1021/bi00603a018. [DOI] [PubMed] [Google Scholar]
- 33.Spudich JL, McCain DA, Nakanishi K, Okabe M, Shimizu N, Rodman H, Honig B, Bogomolni RA. Chromophore/protein interaction in bacterial sensory rhodopsin and bacteriorhodopsin. Biophys. J. 1986;49:479–483. doi: 10.1016/S0006-3495(86)83657-8. [DOI] [PMC free article] [PubMed] [Google Scholar]
- 34.Lanyi JK, Zimanyi L, Nakanishi K, Derguini F, Okabe M, Honig B. Chromophore/protein and chromophore/anion interactions in halorhodopsin. Biophys. J. 1988;53:185–191. doi: 10.1016/S0006-3495(88)83080-7. [DOI] [PMC free article] [PubMed] [Google Scholar]
- 35.Takahashi T, Yan B, Mazur P, Derguini F, Nakanishi K, Spudich JL. Color regulation in the archaebacterial phototaxis receptor phoborhodopsin (sensory rhodopsin II) Biochemistry. 1990;29:8467–8474. doi: 10.1021/bi00488a038. [DOI] [PubMed] [Google Scholar]
- 36.Zachman RD, Olson JA. Uptake and metabolism of retinol (vitamin a) in the isolated perfused rat liver. J. Lipid Res. 1965;6:27–32. [PubMed] [Google Scholar]
- 37.Jung K-H, Trivedi VD, Spudich JL. Demonstration of a sensory rhodopsin in eubacteria. Mol. Microbiol. 2003;47:1513–1522. doi: 10.1046/j.1365-2958.2003.03395.x. [DOI] [PubMed] [Google Scholar]
- 38.Wang W-W, Sineshchekov OA, Spudich EN, Spudich JL. Spectroscopic and photochemical characterization of a deep ocean proteorhodopsin. J. Biol. Chem. 2003;278:33985–33991. doi: 10.1074/jbc.M305716200. [DOI] [PubMed] [Google Scholar]
- 39.Sineshchekov O, Spudich J. Light-induced intramolecular charge movements in microbial rhodopsins in intact E. coli cells. Photochem. Photobiol. Sci. 2004;3:548–554. doi: 10.1039/b316207a. [DOI] [PubMed] [Google Scholar]
- 40.Bridges CD. Spectroscopic properties of porphyropsins. Vision Res. 1967;7:349–369. doi: 10.1016/0042-6989(67)90044-2. [DOI] [PubMed] [Google Scholar]
- 41.Zhang F, Vierock J, Yizhar O, Fenno LE, Tsunoda S, Kianianmomeni A, Prigge M, Berndt A, Cushman J, Polle J, Magnuson J, Hegemann P, Deisseroth K. The microbial opsin family of optogenetic tools. Cell. 2011;147:1446–1457. doi: 10.1016/j.cell.2011.12.004. [DOI] [PMC free article] [PubMed] [Google Scholar]
- 42.Tsunoda SP, Hegemann P. Glu 87 of channelrhodopsin-1 causes pH-dependent color tuning and fast photocurrent inactivation. Photochem. Photobiol. 2009;85:564–569. doi: 10.1111/j.1751-1097.2008.00519.x. [DOI] [PubMed] [Google Scholar]
- 43.Ritter E, Stehfest K, Berndt A, Hegemann P, Bartl FJ. Monitoring light-induced structural changes of Channelrhodopsin-2 by UV-visible and Fourier transform infrared spectroscopy. J. Biol. Chem. 2008;283:35033–35041. doi: 10.1074/jbc.M806353200. [DOI] [PMC free article] [PubMed] [Google Scholar]
- 44.Honig B, Greenberg AD, Dinur U, Ebrey TG. Visual-pigment spectra: implications of the protonation of the retinal Schiff base. Biochemistry. 1976;15:4593–4599. doi: 10.1021/bi00666a008. [DOI] [PubMed] [Google Scholar]
- 45.Harosi FI. An analysis of two spectral properties of vertebrate visual pigments. Vision Res. 1994;34:1359–1367. doi: 10.1016/0042-6989(94)90134-1. [DOI] [PubMed] [Google Scholar]
- 46.Amora TL, Ramos LS, Galan JF, Birge RR. Spectral tuning of deep red cone pigments. Biochemistry. 2008;47:4614–4620. doi: 10.1021/bi702069d. [DOI] [PMC free article] [PubMed] [Google Scholar]
- 47.Lawson MA, Zacks DN, Derguini F, Nakanishi K, Spudich JL. Retinal analog restoration of photophobic responses in a blind Chlamydomonas reinhardtii mutant. Biophys. J. 1991;60:1490–1498. doi: 10.1016/S0006-3495(91)82184-1. [DOI] [PMC free article] [PubMed] [Google Scholar]
- 48.Zacks DN, Derguini F, Nakanishi K, Spudich JL. Comparative study of phototactic and photophobic receptor chromophore properties in Chlamydomonas reinhardtii. Biophys. J. 1993;65:508–518. doi: 10.1016/S0006-3495(93)81067-1. [DOI] [PMC free article] [PubMed] [Google Scholar]
- 49.Sakamoto M, Wada A, Akai A, Ito M, Goshima T, Takahashi T. Evidence for the archaebacterial-type conformation about the bond between the β-ionone ring and the polyene chain of the chromophore retinal in chlamyrhodopsin. FEBS Lett. 1998;434:335–338. doi: 10.1016/s0014-5793(98)01004-7. [DOI] [PubMed] [Google Scholar]
- 50.Crouch R, Nodes BR, Perlman JI, Pepperberg DR, Akita H, Nakanishi K. Cycloheptatrienylidene analog of 11-cis retinal. Formation of pigment in photoreceptor membranes. Invest. Ophthalmol. Vis. Sci. 1984;25:419–428. [PubMed] [Google Scholar]
Associated Data
This section collects any data citations, data availability statements, or supplementary materials included in this article.
Supplementary Materials
1_si_001