Medical image analysis methods in MR/CT-imaged acute-subacute ischemic stroke lesion: Segmentation, prediction and insights into dynamic evolution simulation models. A critical appraisal (original) (raw)
Abstract
Over the last 15 years, basic thresholding techniques in combination with standard statistical correlation-based data analysis tools have been widely used to investigate different aspects of evolution of acute or subacute to late stage ischemic stroke in both human and animal data. Yet, a wave of biology-dependent and imaging-dependent issues is still untackled pointing towards the key question: “how does an ischemic stroke evolve?” Paving the way for potential answers to this question, both magnetic resonance (MRI) and CT (computed tomography) images have been used to visualize the lesion extent, either with or without spatial distinction between dead and salvageable tissue. Combining diffusion and perfusion imaging modalities may provide the possibility of predicting further tissue recovery or eventual necrosis. Going beyond these basic thresholding techniques, in this critical appraisal, we explore different semi-automatic or fully automatic 2D/3D medical image analysis methods and mathematical models applied to human, animal (rats/rodents) and/or synthetic ischemic stroke to tackle one of the following three problems: (1) segmentation of infarcted and/or salvageable (also called penumbral) tissue, (2) prediction of final ischemic tissue fate (death or recovery) and (3) dynamic simulation of the lesion core and/or penumbra evolution. To highlight the key features in the reviewed segmentation and prediction methods, we propose a common categorization pattern. We also emphasize some key aspects of the methods such as the imaging modalities required to build and test the presented approach, the number of patients/animals or synthetic samples, the use of external user interaction and the methods of assessment (clinical or imaging-based). Furthermore, we investigate how any key difficulties, posed by the evolution of stroke such as swelling or reperfusion, were detected (or not) by each method. In the absence of any imaging-based macroscopic dynamic model applied to ischemic stroke, we have insights into relevant microscopic dynamic models simulating the evolution of brain ischemia in the hope to further promising and challenging 4D imaging-based dynamic models. By depicting the major pitfalls and the advanced aspects of the different reviewed methods, we present an overall critique of their performances and concluded our discussion by suggesting some recommendations for future research work focusing on one or more of the three addressed problems.
Keywords: Acute/subacute ischemic stroke, Segmentation, Prediction, Dynamic evolution simulation, Perfusion/diffusion
Highlights
► Survey of segmentation, prediction and ischemic stroke dynamic evolution modeling ► Common biology/imaging-dependent issues encountered in ischemic stroke lesions ► No image-based macroscopic dynamic model simulating the evolution of acute stroke ► Further recommendations for future medical image-analysis methods applied to stroke
1. Introduction
Stroke is the third leading cause of death in industrialized countries (Bonita, 1992) and a major cause of death worldwide (Sudlow and Warlow, 1997). The commonest type of stroke is an ischemic stroke, resulting from disruption of blood flow within the brain caused by occlusion of an artery. This deprives the brain of oxygen and nutrients and initiates a dynamic sequence of pathophysiological events. Where the blood flow interruption is too severe or for too long, cell death by necrosis or apoptosis occurs and an irreversibly injured infarct core is formed. If the blood supply is less badly disrupted, or the disruption only lasts for a short period of time, then the brain tissue may not be permanently damaged but may survive for a variable period of time in a shut down but viable state that can recover if blood flow is restored quickly enough. This potentially reversibly damaged brain tissue usually surrounds the ischemic lesion core and is referred to as the “ischemic penumbra” (Symon, 1980) (Fig. 1). The neurons in the penumbral tissue are functionally shut down, resulting in loss of neuronal function in all the tissue where blood flow has fallen below the critical level required to sustain neuronal function (hypoperfusion). If the blood flow is not restored then the penumbral tissue will proceed to infarction and the original core lesion will grow to occupy a larger part of the brain with possibly much greater functional disability than if less tissue had been permanently damaged. Since the 1970s, salvage of this penumbral tissue has been the main target of stroke therapy (Astrup et al., 1977, 1981; Wardlaw, 2010).
Fig. 1.
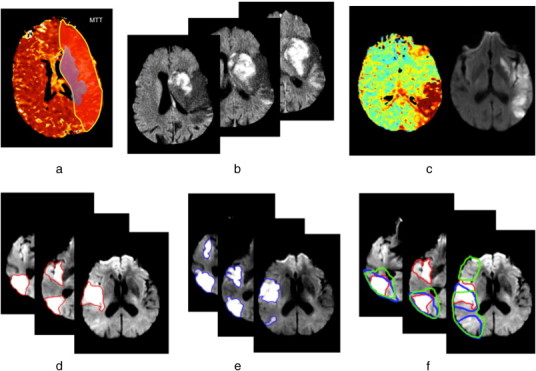
(a) Ischemic penumbra and infarct core at acute time. Red shaded region represents the ischemic penumbra identified using an MTT perfusion map while the blue one represents the infarct core manually delineated on the DWI image. A large area of perfusion/diffusion mismatch is clearly distinguishable. (b) Swelling at acute time of stroke onset observed in a DWI image. A massive swollen infarct occupies most of the MCA territory distorting the right ventricle. (c) An example of the influence of partial reperfusion in penumbra and core evolution patterns. The acute DWI (left) and the acute perfusion TTP map (right) demonstrates the “reverse” mismatch revealing a partial reperfusion where the TTP appears normal in the anterior portion of the MCA territory. (d) Scattered lesion at acute timepoint (3 h). The manually delineated lesion in 3 different axial slices in a DWI image is composed of two topologically separate components. (e) Scattered lesion at a subacute timepoint (6 days). For the same patient showed in (d), the evolution of the spatial boundaries of the manually delineated scattered lesion is shown at a subacute timepoint. (f) Perfusion/diffusion mismatch and the influence of perfusion parameters on the boundary of the visible mismatch. The red contour represents the DWI lesion depicted at an acute timepoint superimposed with both MTT (in blue) and CBF (in green) lesions manually delineated at an acute timepoint.
Identifying effective stroke treatments remains a difficult challenge since it is assumed that the penumbral tissue is only salvageable within the first few hours after onset of ischemia (Wardlaw, 2010). Therefore, the main therapeutic decisions are to quickly recanalize the main blocked artery to prevent the infarct expansion. Imaging methods could play a key role in defining the extent of tissue at risk of infarction if it were possible to define perfusion levels or changes in tissue imaging signatures that indicated viable or non-viable tissue reliably. Indeed, imaging using positron emission tomography (PET) was the first method in humans to demonstrate the existence of penumbral tissue by identifying areas where there was low blood flow but persisting increased oxygen extraction from the blood and ongoing glucose metabolism. In contrast, areas that had progressed beyond the point of no viability showed low flow and no glucose metabolism or oxygen extraction from the blood.
PET is not widely available and is not a practical technique for use in acute stroke. More practical and available methods include computed tomography (CT) or magnetic resonance (MR) with perfusion imaging. These offer considerable opportunities through image processing and analysis methods to quantify the tissue diffusion and perfusion changes precisely and define viable and non-viable tissues. As a result medical image analysis approaches and statistical tools have been explored during the last 15 years to identify different tissue states. Differentiating and spatially localizing dead and salvageable tissue, predicting the final ischemic tissue outcome, and understanding factors that influence the dynamic evolution of infarct core and the penumbra such as lesion swelling, collateral flow pathways and spontaneous reperfusion, are the center of our focus in this review paper.
So far, approaches to these questions have relied on basic thresholding techniques and commonly used standard statistical correlation-based data analysis tools mostly applied to 2D images, such as in Astrup et al. (1981), Na et al. (2004), Olivot et al. (2009) and Shih et al. (2003). These have been used to depict or predict stroke evolution but have resulted in the identification of multiple different thresholds with overlap in values from different studies for lesion core and penumbra (Dani et al., 2012). This was compounded by differences in definitions of non viable and penumbral tissues (18 different definitions of penumbra and 11 of lesion core in studies using CT or MR perfusion imaging (Dani et al., 2012)). Furthermore, it was only fairly recently that the importance of geographical co-location of perfusion and structural images in mapping the evolution of viable–non-viable tissue was recognized (Nagakane et al., 2011). Prior to that, most analyses simply used numeric volume measures.
Medical image analysis has advanced substantially in recent years and we looked beyond the techniques used so far in stroke by identifying studies, such as dynamic evolution models that might be able to handle the more complex problems encountered in typical ischemic stroke image (Duncan and Ayache, 2000). Coalescing spatial and temporal information into models characterizing changes in cancerous lesions suggested that these new approaches might help understand the factors influencing spatiotemporal evolution of other brain diseases like strokes (Duncan and Ayache, 2000). It was these developments that initiated our search for studies exploring more sophisticated image analysis of acute/subacute ischemic stroke. Notably, in the past decade, clinicians primarily used 2D visual and manual assessment of MR/CT images to guide their decisions for patient treatment. However, much more powerful methods that made efficient use of medical image analysis methods and robust computational mathematical frameworks may be available. Failure to use these may delay in advances in stroke.
In this paper, we surveyed the current literature to identify methods to overcome three key barriers to advancing our understanding of ischemic stroke lesion evolution and hence therapy planning at acute and subacute stages: (i) The differentiation of potentially salvageable and permanently damaged brain from normal tissue using automatic/semi-automatic segmentation algorithms. (ii) The prediction of the ischemic tissue fate (progression to infarction or salvage). (iii) Finally to simulate the dynamic evolution of the ischemic region. Hence, we looked for papers that developed new or adapted existing medical image analysis methods to quantify changes in the acute/subacute (3 h to 6 days) ischemic stroke lesion using MR or CT clinical human/animal data and/or synthetic data.
We aimed to:
- highlight the common biologically-dependent or imaging-dependent problems that have to be overcome for any image processing algorithm to successfully quantify or model data acquired in the stroke subjects; such as swelling and spontaneous reperfusion;
- document the state-of-the art of the medical image analysis approaches applied to acute/subacute ischemic stroke tackling segmentation, prediction, or dynamic evolution modeling;
- evaluate the overall performance of any identified methods including a critique of potential limitations and how any key problematic issues have been addressed;
- identify any promising method that has not yet been applied to differentiate tissue state or model lesion evolution in acute stroke.
The remainder of this paper is structured as follows. In Section 2, we will briefly describe commonly used imaging modalities (MR or CT) to diagnose stroke, highlighting the major challenges specific to stroke that image processing algorithms need to incorporate. In Section 3, we describe our literature searching and assessment methods. Section 4 presents the overall results of our search and highlights the essential features of the medical image analysis methods and dynamic evolution models identified in more detail. Finally, we present a critical overall analysis, discussing the major limitations of current methods and revealing new avenues for exploration.
2. Material and methods
2.1. Medical imaging in ischemic stroke
2.1.1. MR and CT imaging as commonly used imaging techniques in stroke: key facts
During the acute phase of ischemic stroke, MR and CT images are commonly used for stroke diagnosis and clinical-decision making. Change in the water content of ischemic tissue occurs rapidly and can be detected as increased signal (restricted diffusivity) on MR diffusion imaging or as reduced attenuation on CT scanning (Moseley et al., 1990). These are conventionally used, despite limitations that have been discussed extensively before, to indicate permanently damaged tissue. They are not perfect but are the best we have at present. Changes in blood flow can be detected as changes in signal or attenuation as a bolus of intravenously injected contrast agent passes through the brain (perfusion weighted imaging, PWI) (Wardlaw, 2010). To determine the final infarct extent, many studies use conventional T1-weighted or T2-weighted MR images at 1 or 3 months post-stroke as a reference standard for the final infarcted tissue. While exploring this variety of MR based diffusion, perfusion and structural imaging tools, it is worth noting that assessing the dynamic visible ischemic tissue changes during the acute/subacute stages requires at least two parameters, with contrast based upon either the diffusion or perfusion physiological phenomenon (Jacobs et al., 2001a; Soltanian-Zadeh et al., 2003; Yuh et al., 1991). Extracting relevant information from these images obtained over the acute/subacute time window, from a medical image analysis perspective, is challenging due primarily to the following imaging-dependent and biology-dependent factors that affect image processing of stroke lesions.
2.1.2. Imaging-dependent issues
2.1.2.1. Frequency and detail of image acquisition
Stroke patients are often very unwell at first presentation. Time is brain, so acute treatments must be initiated as quickly as possible: the imaging must be rapid and not unduly affect patient care or delay treatment. It is not easy to obtain high quality volumetric MR imaging data from some stroke patients, as they are restless, and may not comply even with a 10 minute examination. Hence image acquisition parameters tend to emphasize speed, with as few sequences and slices as possible. Also, it is not possible to perform serial imaging at short time intervals (e.g. every few hours) as this would interfere so much with acute care and would be unethical. Even scanning on alternate days in the first week may be difficult. The net effect is that stroke imaging tends to use sequences that are not optimal for complex image processing in either the spatial or the temporal domains. Although this is listed under imaging-dependent issues, it is actually a simple consequence of the stroke itself, the restraints imposed by treatment delivery, the fact that scanning itself may not be good for the patient, and the characteristics of the older population that stroke tends to affect.
2.1.2.2. Perfusion/diffusion mismatch and the definition of the core and penumbra
At acute/subacute stages, the ability of both DWI (diffusion weighted imaging) and PWI to detect early temporal dynamic tissue changes in either animal or human stroke (Moseley et al., 1990; Le Bihan et al., 1986; Sorensen et al., 1996; Warach et al., 1992) led to the concept of “perfusion–diffusion mismatch” –hypothetically– reflecting salvageable tissue. Several studies (Arenillas et al., 2002; Barber et al., 1998; Coutts et al., 2003; Oppenheim et al., 2001; Rivers et al., 2007; Tong et al., 1998) explored the prognostic potential of the DWI–PWI mismatch, although questions surrounding its validation remained (Wardlaw, 2010; Kane et al., 2007; Ma et al., 2011). The spatial boundaries of the mismatch and its measurement strictly depend on how the penumbra and the core are defined. However, the assumption that the diffusion lesion represents the core whereas abnormalities visible in certain perfusion weighted images include both the core and the penumbra is still applied in many studies (Ford et al., 2012; James et al., 2006; Petrella and Provenzale, 2000). Nevertheless, there is still an ambiguity surrounding the definition of the penumbra using thresholds (Ford et al., 2012). In Fig. 1, we can clearly see how the choice of the perfusion parameters (e.g.: mean transit time (MTT) or cerebral blood flow (CBF)) might alter considerably the spatial boundaries of the detected mismatch. It is also possible to have “reverse mismatch” (Coutts et al., 2003) where the volume of the DW lesion exceeds that of the PWI lesion. This was explained by patients being scanned after spontaneous reperfusion (Coutts et al., 2003; James et al., 2006). Similar variation is found on CT perfusion imaging. It is still unclear which PWI parameter best defines the true limit of salvageable tissue; and will need to be clarified before the mismatch concept can be used reliably.
2.1.2.3. Invisibility at acute stage
Acute ischemic change on CT is subtle and often does not show infarct until 12–24 h after stroke onset (James et al., 2006). Reading an acute CT scan may not be difficult however it is not self-evident as pointed out by Józwiak and Ostrek (2011). Even DWI may not show the acute lesion in all cases (Wardlaw et al., 2007). Expert interpretation is required to identify some acute lesions on CT, but may not be able to accurately define the lesion boundaries.
2.1.2.4. Slice thickness
Most PW and DW images use slice thickness of between 4 mm and 14 mm (Gupta et al., 2008), and often with a gap between slices. Most plain CT is acquired as a thin section (1–2 mm) contiguous volume image, however the signal to noise ratio in such images is too low for diagnostic use in stroke with 3–6 mm reconstructions being more commonly used in stroke diagnosis. Many of the more sophisticated image processing algorithms require volumetric scans with thin contiguous slices otherwise the out of plain image resolution can increase partial volume effects and be misleading when interpreting the image-processing-driven results especially in 3D and 4D models.
2.1.2.5. Choice of perfusion–diffusion parameters
To interpret perfusion data, different parameter maps are estimated. These include, imaged cerebral blood flow (CBF), mean transit time (MTT), time-to-peak (TTP) map and cerebral blood volume (CBV) map (Kane et al., 2007). Each of these produces a different-sized lesion from the same data, with the processing algorithm also influencing the lesion size, even when the same parameter is estimated. Identifying which perfusion parameter should be used remains a key question (Grandin et al., 2002). Similarly, raw diffusion weighted acquisitions can be post-processed in different ways to provide traditional diffusion weighted images, apparent diffusion coefficient (ADC) maps (Na et al., 2004; Moseley et al., 1990), fractional anisotropy (FA) or the diffusion tensors (DT) (Agam et al., 2007).
2.1.2.6. T2-shine through and fogging
The “fogging” effect refers to the tendency of tissue in the initially hyperintense DWI lesion to appear normal between 7 and 14 days (Choi et al., 2011; O'Brien et al., 2004). This makes some lesions almost completely disappear between 7 and 21 days so that the assessment of the final infarct in this time window will underestimate final tissue damage. As fogging is probably associated with reperfusion, this will distort any association between reperfusion treatment and lesion size. T2-shine through may also distort lesion size at subacute stages (Burdette et al., 1999).
2.1.3. Biology-dependent issues
2.1.3.1. Lesion swelling and shrinking
Lesion swelling is commonly observed soon after ischemic stroke, peaking at 3–5 days. Over time, the stroke lesion shrinks as the swelling reduces and tissue damaged by the injury is lost, replaced by cerebrospinal fluid (CSF) leaving an area of cerebromalacea with ex vacuo effect on adjacent structures. From an imaging-based perspective, the swelling can be observed as a “mass effect” where the infarct distorts the adjacent tissues (brain anatomical deformation) e.g. by compressing the ventricles and other CSF spaces (sulcal effacement) or causing midline shift (Fig. 1). Swelling increases the volume of the ischemic tissue even though the anatomical extent remains unchanged. The later ex vacuo effect can result in an underestimation of the actual extent of the final injury (Wardlaw, 2010).
2.1.3.2. Spontaneous reperfusion
Spontaneous reperfusion occurs in about 20% of patients by 24 h and 80% by 5 days and alters tissue outcome (Bang et al., 2008; Rha and Saver, 2007; Zanette et al., 1989). This would alter the dynamic evolution pattern of the ischemic tissue core and the penumbra as shown in Figs. 1 and 2. The lesion fate is also influenced by collateral blood supply which varies considerably between individuals, making the prediction of stroke evolution and tissue fate more complex (Fig. 1). In fact, if the collateral arteries are poor within a specific blood territory, a proximal occlusion of the artery supplying this territory will produce a larger ischemic core and penumbra than a similar occlusion in a patient with good collateral arteries.
Fig. 2.
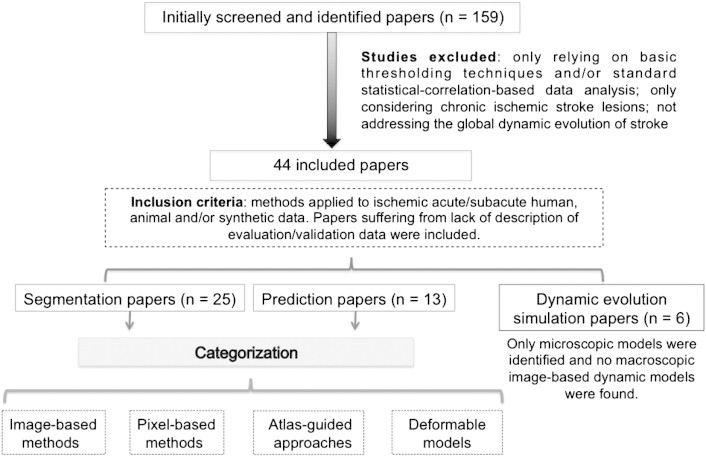
Overall view of the search strategy and paper categorization method.
2.1.3.3. No re-flow phenomenon
No re-flow phenomenon occurs when recanalization of the blocked artery fails to reperfuse the tissue capillaries and is likely to be associated with a worse tissue outcome than if blood flow was fully restored (Ames et al., 1968; Majno et al., 1967; Soares et al., 2009; Wardlaw, 2010). This may occur in up to 50% of patients with large middle cerebral artery (MCA) infarcts (Rivers et al., 2006). Its causes and risk factors remain “unknown” though a putative explanation would be the narrowing of the vessels by the swollen perivascular tissue preventing ischemic tissue reperfusion even if the proximal artery reopens.
2.1.3.4. Scattered lesions
Stroke lesions are rarely seen as single large lesions on acute DWI or final T2 images, but are more often multifocal scattered lesions with more than one topologically connected component (Fig. 1), even though these components may all lie in the same arterial territory. Different biological scenarios have been supposed to explain this phenomenon: one being that a clot has blocked a proximal artery but because there is good collateral supply from adjacent arterial territories, some of the blocked artery territory has not infarcted while some has; another is that a shower of emboli went into one artery and affected different smaller branches within the same territory. Other possibilities are that one single clot entered a proximal artery and stuck for a short time but then the clot broke up and fragments went into distal branches, or that this appearance is possibly due to imaging not showing the true extent of the tissue at any one acute/sub-acute timepoint. It is likely that although similar in appearance on imaging, this phenomenon has different explanations in different patients. No previous studies of mismatch, that we have found, have mentioned this before (Arenillas et al., 2002; Barber et al., 1998; Coutts et al., 2003; Oppenheim et al., 2001; Rivers et al., 2007; Tong et al., 1998; Petrella and Provenzale, 2000), but the practical implication in image processing terms is that most algorithms were designed to cope with one lesion only, not with multiple fragments.
2.2. Literature search and methods
2.2.1. Literature search
We searched the literature using Medline and GoogleScholar from the 1st of January 1986 to the 1st of June 2012 for publications using human, animal and synthetic stroke data in the following areas (Fig. 2):
- –
Segmentation of acute/sub-acute ischemic penumbra and/or core; - –
Prediction of ischemic tissue fate outcome; - –
Dynamic acute ischemic lesion evolution modeling and simulation methods.
We used the following key headings, separately or in combination, to identify relevant papers in these three main research areas: “ischemic stroke”, “middle cerebral artery”, “prediction”, “segmentation”, “tissue identification”, “lesion detection”, “dynamic model”, “dynamic evolution”, “penumbra”, “infarct”, “magnetic resonance imaging (vs. MRI)”, “rats/rodents”, “computed tomography (vs. CT)”, and “perfusion and diffusion”. To expand the search and check for all relevant papers, two additional research layers were performed through reviewing the sub-references of each initially identified paper and then also scanning the references of the sub-references.
2.2.2. Exclusion–inclusion criteria
We excluded studies that only used standard thresholding techniques and/or basic statistical-correlation tools in their analysis of acute/subacute ischemic stroke lesions. We also excluded any studies that definitely only considered chronic lesions. Identified studies that proposed dynamic models simulating the effect of collateral phenomena contributing to the stroke evolution process and not directly addressing the global dynamic evolution of ischemic stroke were also excluded (e.g.: studying the effect of inflammation in ischemic stroke (Lelekov-Boissard et al., 2009)).
We included all research papers using or defining a new image analysis approach or dynamic evolution simulation models that were applied to ischemic acute/sub-acute stroke using human, animal, phantoms or simulated data. We used an inclusive approach so as not to overlook any promising new methods and therefore also included papers with little or no detailed information about the test data such as the acquisition stage (acute, sub-acute, chronic as long as it was not solely chronic) or the number of the recruited patients or simulated data.
2.2.3. Included studies categorization and key features
To help us assess the practicality and reliability of any identified promising methods, we highlighted whether the applied method:
- i.
required user interaction, - ii.
required a training dataset (supervised approach), - iii.
required single or multiple acquisition timepoints, - iv.
addressed the problem of swelling, - v.
addressed reperfusion phenomenon, - vi.
(in segmentation) segmented the ischemic area with or without a distinction between the penumbra and the core, - vii.
(in prediction and dynamic simulation) was assessed using imaging-based outcome, clinical-based outcome or both.
Furthermore, both segmentation and prediction methods can be approached as a classification/clustering problem so we applied a common categorization pattern to the identified ischemic lesion penumbra/core segmentation and ischemic tissue final outcome prediction methods composed from the following categories as introduced by Dawant and Zijdenbos (2000) and Pham et al. (2000) and shown in (Fig. 2):
- –
image-based; - –
pixel-based classification; - –
atlas-guided-approaches; - –
deformable models.
In every included paper, we determined whether the applied method used solely or in combination human, animal and/or synthetic data and the number of the recruited patients, animals or simulations. We also extracted the MR and CT imaging modalities used to build and evaluate the described model.
3. Results
3.1. Paper identification
The initial search identified 159 papers, however, eventually only included 47 papers met the inclusion criteria. These were published between 1998 and 2012. We categorized them into 3 main research fields: segmentation (n = 25, Table 1), prediction (n = 14, Table 2) and dynamic evolution modeling (n = 8, Table 3). Tables 1, 2 and 3 summarize the data extracted from each paper. In both segmentation and prediction methods we found: image-based (n = 9) and pixel-based classification (n = 14), atlas-guided approaches (n = 1) and deformable models (n = 2).
Table 1.
Overview of the segmentation methods presented in 25 papers. In the “data” column, two acronyms are used: C(n,h/a): clinical data, n: number of patients, h: human data, and a: animal data. S(n,h/a): synthetic data, n: number of simulations if known, h: human data, and a: animal data. The fifth column “C” denotes the category of the reviewed method: (I) image-based, (P) pixel-classification based, (A) atlas-based, (D) deformable based segmentation category. The sixth column “U” pinpoints whether a user interaction is needed (Y) or (N) not. The next column “TD” highlights whether a training data is required (Y) or (N) not. T: (S) single acquisition timepoint is required or (M) multiple. Sw: (Y) swelling or (N) no swelling accounted for in the identified method. R: reperfusion process is considered (Y) or (N) not. S: segmented area included ischemic lesion or infarct core (I) and the penumbra (P).
| Paper | Basic method principle | Data | Medical modalities | C | U | TD | T | Sw | R | S |
|---|---|---|---|---|---|---|---|---|---|---|
| Braun et al. (2002) | – Automated, multidimensional 3D histogram-based classification method | C(5,h) S(–) | MR(T2, DWI, ADC) | I | N | N | S | N | N | I |
| Chawla et al. (2009) | – Automatic histogram and wavelet-based 2-level classification algorithm | C(15,h) | CT | P | N | N | S | N | N | I |
| Contin et al. (2010) | – Local statistics | C(1,h) | CT(CBF, CBV, MTT) | I | Y | N | S | N | N | P I |
| Dastidar et al. (2000) | – Semi-automatic thresholding-derived region growing, and decision trees based algorithm | C(40,h) S(5) | MR(T1, T2) | I | Y | N | S | N | N | I |
| Dwyer et al. (2008) | – Semi-automatic hidden Markov random fields | C(3,h) S(–) | MR(T2, FLAIR, DWI, ADC, MTT) | P | Y | N | S | N | N | P |
| Ghosh et al. (2011) | – Hierarchical recursive region splitting using rescaling, histogram and distribution measures | C(51,a) | MR(T2) | I | Y | N | S | N | N | I |
| Hevia-Montiel et al. (2007) | – Nonparametric density estimation approach using edge confidence map | C(15,h) | MR(T2, DWI, ADC) | P | N | N | S | N | N | I |
| Jacobs et al. (2000) | – Multiparameter unsupervised K-means-derived clustering approach | C(22,a) | MR(T1, T2, DWI, ADC) | P | N | N | M | N | N | P I |
| Jacobs et al. (2001a) | – An unsupervised vector tissue model with a K-means-derived clustering technique | C(20,a) | MR(T1, T2, DWI) | P | N | N | M | N | N | I |
| Jacobs et al. (2001b) | – An unsupervised vector tissue model with a K-means-derived clustering technique | C(10,h) | MR(T1, T2, DWI) | P | N | N | M | N | N | I |
| James et al. (2006) | – Thresholding-based approach | C(6,h) S(−) | MR(T2, DWI, CBF, CBV, MTT) | I | Y | N | S | N | N | P I |
| Kabir et al. (2007) | – Multimodal Markov random field (MRF) | C(56,h) | MR(T2, FLAIR, DWI) | P | N | N | S | N | N | I |
| Li et al. (2004) | – Unsupervised adaptive multiscale statistical Bayesian classification and partial volume voxel reclassification | C(20,h) S(−) | MR(DTI) | P | N | N | S | N | N | I |
| Li et al. (2009) | – Unsupervised Mean-shift algorithm | C(19,h) | MR(T2, DWI, ADC) | P | N | N | S | N | N | I |
| Maldjian et al. (2001) | – Anatomical-atlas based segmentation | C(35,h) | CT | A | N | N | S | N | N | I |
| Martel et al. (1999) | – Adaptive thresholding algorithm using Markov random fields and iterative conditional modes (ICM) | C(63,h) S(6) | MR(DWI) | P | Y | Y | S | N | N | I |
| Matesin et al. (2001) | – Symmetry-detection and seeded region-growing algorithm | C(–,h) | CT | I | Y | N | S | N | N | I |
| Meilunas et al. (2003) | – Local means and standard deviations intensity-based segmentation | C(–,h) | CT | I | Y | N | S | N | N | I |
| Prakash et al. (2006) | – Probabilistic neural network for an adaptive (two-level) and Gaussian mixture model | C(13,h) | MR(DWI) | P | N | Y | S | N | N | I |
| Soltanian-Zadeh et al. (2003) | – Unsupervised clustering-based tissue scoring method | C(15,a) | MR(T1, T2, DWI, PDWI) | P | N | N | S | N | N | I |
| Soltanian-Zadeh et al. (2007) | – Improved unsupervised clustering-based tissue scoring method | C(9,a) C(15,h) | MR(T1, T2, DWI, PDWI) | P | N | N | S | N | Y | I |
| Stein et al. (2001) | – 3D statistical and deformable snake-based model | C(6,h) | MR(T2, FLAIR) | D | Y | N | S | N | N | I |
| Usinskas et al. (2002) | – Mean and standard-deviation based segmentation | C(–,h) | CT | I | N | N | S | N | N | I |
| Usinskas et al. (2004) | – Unsupervised thresholding-derived joint features extraction based segmentation | C(–,h) | CT | I | Y | N | S | N | N | I |
| Weinman et al. (2003) | – Nonlinear diffusion scale-space and geometric deformable model with fast marching level sets | C(5,h) | MR(−) | D | Y | N | S | N | N | I |
Table 2.
Overview of ischemic tissue state prediction methods presented in 14 papers. In the “data” column, two acronyms are used: C(n,h/a): clinical data, n: number of patients, h: human data, a: animal data. S(n, h/a): synthetic data, n: number of simulations if known, h: human data, a: animal data. The fifth column “C” denotes the category if the reviewed method: (I) image-based, and (P) pixel-classification based. The sixth column “U” pinpoints whether a user interaction is needed (Y) or (N) not. The next column “TD” highlights whether a training data is required (Y) or (N) not. T: (S) single acquisition timepoint is required or (M) multiple timepoints are required. Sw: (Y) swelling or (N) no swelling accounted for in the identified method. R: reperfusion process is considered (Y) or (N) not. E: (evaluation tools used in the method) (C) clinical-based outcome assessment, (I) image-based outcome assessment; (B) both clinical-based and image-based outcome assessments; (N) none.
| Paper | Basic method principle | Data | Medical modalities | C | U | TD | T | Sw | R | E |
|---|---|---|---|---|---|---|---|---|---|---|
| Bagher-Ebadian et al. (2011) | – Probabilistic neural network for and an adaptive (two-level) Gaussian mixture model | C(13,h) | MR(DWI) | P | N | Y | S | N | N | I |
| Carano et al. (1998) | – Multispectral analysis using 2 unsupervised (K-mean, fuzzy C-mean) and supervised (multivariate Gaussian, k-nearest neighbor) clustering techniques. | C(15,a) | MR(T2, ADC, CBF) | P | N | Y | M | N | Y | I |
| Hevia-Montiel et al. (2008) | – 3D region-growing technique | C(40,h) | MR(ADC, DWI) | I | Y | Y | S | N | N | I |
| Huang et al. (2010) | – Artificial neural network | C(36,a) | MR(T2, ADC, CBF) | P | N | Y | S | N | Y | I |
| Nguyen et al. (2008) | – A generalized linear model (GLM) | C(74,h) | MR(T2, DWI, ADC, CBF, CBV, MTT) | P | N | Y | S | N | N | I |
| Rose et al. (2001) | – Parametric normal classifier algorithm | C(29,h) | MR(T2, DTI, ADC, CBF, CBV, MTT) | P | N | Y | S | N | Y | I |
| Rose et al. (2004) | – Expectation maximization and k-means clustering algorithm | C(14,h) | MR(T2, DWI, ADC, CBF, MTT) | P | N | Y | S | N | N | I |
| Rosso et al. (2009) | – Region-growing based model | C(8,h) | MR(DWI, ADC) | I | Y | N | S | N | Y | I |
| Scalzo et al. (2012) | – Kernel spectral regression model trained on a set of locally extracted and normalized cuboids in MR images with known outcome | C(25,h) | MR(Tmax, ADC, FLAIR) | I | N | Y | M | N | N | I |
| Shen et al. (2004) | – Clustering technique related to k-means | C(6,a) | MR(T2, ADC, CBF) | P | N | N | M | N | N | I |
| Shen et al. (2005) | – Clustering technique related to k-means and generation of probability risk maps | C(6,a) | MR(T2, ADC, CBF) | P | N | Y | M | N | N | I |
| Shen and Duong (2008) | – Clustering technique related to k-means, generation of probability risk maps and considering spatial susceptibility of infarction | C(6,a) | MR(T2, ADC, CBF) | P | N | Y | S | N | Y | I |
| Wu et al. (2001) | – Thresholding and generalized linear model (GLM) algorithms and generating maps of risk of future infarction | C(14,h) | MR(T2, DWI, ADC, CBF, CBV, MTT) | P | N | Y | M | N | Y | I |
| Wu et al. (2007) | – Voxel-based generalized linear model (GLM) | C(8,a) | MR(ADC, CBF, CBV, MTT) | P | N | Y | S | N | Y | I |
Table 3.
Overview of dynamic evolution models presented in 8 papers. The acronym Sw denoted swelling, combined with the acronyms: (Y) swelling or (N) no swelling accounted for in the identified method. R: reperfusion process is considered (Y) or (N) not. None of these studies used medical data or have been assessed using imaging or clinical outcome.
| Paper | Basic method principle | Sw | R |
|---|---|---|---|
| Chapuisat et al. (2008) | – Global phenomenological microscopic dynamic model simulating ischemic stroke evolution. | N | Y |
| Chapuisat et al. (2010) | – Mathematical model simulating the influence of blood flow reduction in final infarct size. | N | N |
| Dronne et al. (2004) | – Mathematical dynamic microscopic model simulating the penumbra evolution. | N | Y |
| Dronne et al. (2006) | – Mathematical dynamic microscopic model simulating the main mechanisms involved in the penumbra development. | Y | N |
| Dumont et al. (2010) | – Reaction–diffusion based model simulating the heterogeneous 3D evolution is ischemia. | Y | N |
| Duval et al. (2002) | – Physiological based model of ischemic stroke. | Y | N |
| Grenier et al. (2010) | – Phenomenological dynamic microscopic model simulating the growth of the dead zone in ischemic stroke. | N | N |
| Louvet et al. (2011) | – Multi-scale reaction–diffusion based numerical model simulating a 2D/3D human ischemic stroke evolution during the first hour. | N | N |
The papers that evaluated the segmentation, prediction and dynamic simulation approaches at the acute/subacute stages of stroke used human (30 papers, 563 subjects) and/or animal (10 papers, 158 rats/rodents) data and/or synthetic data (11 papers, 11 simulations). Among the 11 identified papers using synthetic data, only two mentioned the number of performed simulations (Dastidar et al., 2000; Martel et al., 1999). The number of patients ranged from 1 to 63 (median 15) for segmentation and 8 to 74 (median 19) for prediction. For evaluations using animal data the sample size ranged from 9 to 51 (median 20) for segmentation and 6 to 36 (median 7) for prediction.
We found 8 phenomenological (i.e. inspired from biological phenomena) microscopic dynamic models simulating a biology-based evolution of ischemic stroke (Chapuisat et al., 2008, 2010; Dronne et al., 2004, 2006; Dumont et al., 2010; Duval et al., 2002; Grenier et al., 2010; Anon., 2011) (Table 3). We found no papers that addressed imaging-based macroscopic dynamic models simulating a 4D evolution of acute ischemic stroke using MR or CT data and/or synthetic images. However, we were very keen to include the identified microscopic approaches since they provide clues about what drives the evolution of stroke lesion that can potentially initiate medical image analysis in macroscopic acute ischemic stroke MR/CT imaging-based dynamic modeling. Furthermore, tapping into the potentials of in silico research in medicine relying on accurate and realistic mathematical and computational models would help overcome the need for expensive clinical trials.
3.2. Segmentation methods
We have identified 25 papers addressing the problem of acute/subacute ischemic stroke segmentation: 21 (84%) of these methods were evaluated using patient data and 5 (20%) used animal data (rats or rodents). Synthetic data were also used in 6 (24%) of the reviewed papers. Eighteen (72%) of the segmentation methods were applied to MR structural and/or perfusion/diffusion data and 7 (28%) used CT datasets. One paper (Weinman et al., 2003) did not provide sufficient information about which MR images were used. Only three papers (James et al., 2006; Contin et al., 2010; Jacobs et al., 2000) tackled the problem of segmentation of the penumbra and the infarct core in a distinct way, whereas the remaining papers aimed at segmenting the whole ischemic area or only the infarct core.
3.2.1. Image-based segmentation (36%)
Image-based techniques include thresholding-derived, region-based and edge-based methods (Pham et al., 2000). Two papers (Dastidar et al., 2000; Matesin et al., 2001) used a region-growing approach. Region growing techniques aim to extract a connected region based on intensity information and/or edges, requiring a user to manually select a seed point within the target region. In Dastidar et al. (2000), a previously developed segmentation approach relying on a region-growing technique in Heinonen et al. (1998) was used to evaluate the volumetric measurement of brain infarctions in structural T1W and T2W MRI. For the segmentation of stroke lesions in CT scans, Matesin et al. (2001) proposed an automatic segmentation method also based on a seeded region-growing and using a rule-based expert system yielding a fast labeling of the background, skull, gray, white matter, cerebrospinal fluid, and stroke lesions. Usinskas et al. (2002) and Meilunas et al. (2003) presented unsupervised learning methods based on mean and standard deviation computations to segment ischemic stroke regions in CT images. This approach was extended in Usinskas et al. (2004) by adding more intensity-based analysis tools such as histograms and gray-level co-occurrence matrices.
All of the segmentation methods mentioned above focus on segmenting either the ischemic region or the infarct without highlighting the distinction between the penumbra and the core. This problem was raised by Contin et al. (2010) where a new semi-automatic method based on computation of regional mean and standard deviation and local statistics was developed to identify both the core and the penumbra on acute perfusion CT maps (CBF, CBV, MTT). The algorithm required user interaction to select a seed that was grown according to acceptance criteria. In James et al. (2006), a semi-automated histogram-based segmentation technique was developed to identify both the core and the penumbra and compute the perfusion/diffusion mismatch volume using DWI and PWI maps (CBF, CBV, MTT). In a recent paper (Ghosh et al., 2011), a hierarchical recursive region splitting (HRS) approach addressed ischemic lesion segmentation in animal data with mild, moderate and severe strokes using T2-w images. Using the MR-based signal spectrum, adaptive thresholds were automatically selected leading to promising results when compared with manual segmentations.
Most of the proceeding papers (Table 1) provided little information about the number of patients or stroke severity (Matesin et al., 2001; Meilunas et al., 2003; Usinskas et al., 2002, 2004), and one paper (Contin et al., 2010) used a single patient without reporting any clinical information. All methods used images acquired at one single timepoint and did not address the effect that swelling might have on lesion distortion or volume measurement.
3.2.2. Pixel and voxel-based classification (52%)
Segmentation problems can be addressed using conventional classification methods, by applying supervised approaches requiring machine learning or unsupervised clustering methods to partition the image into separate classes composed of pixels which have similar pre-defined feature values. The commonly used unsupervised techniques are K-means and iterative self-organizing data analysis technique (ISODATA), which is K-means derived with additional splitting and merging steps (Pham et al., 2000). In Braun et al. (2002), another feature-based method was implemented to generate 3D histograms from a representative T2W, DWI and ADC data set leading to an automatic segmentation of cerebral ischemia. We identified three studies (Jacobs et al., 2000, 2001a,b) that applied the ISODATA technique. In Jacobs et al. (2000), multiparametric ISODATA was applied to MR data including T1W, T2W and DWI to discriminate between ischemia-altered and morphologically intact tissue in rats and correlated with histologically identified areas. An improved version proposed in Jacobs et al. (2001b) was also applied to rats, then in Jacobs et al. (2001a) to MR patient data and was correlated with the 3-month final extent on imaging. The multiparametric ISODATA map showed a better localization of the infarcted areas than separately using DWI, ADC and T2 maps at different times after stroke. Based on a comparison between ISODATA-derived damaged tissue volume and DWI-defined (vs. T2WI-defined) volume correlation with the patients' functional outcome after stroke, this method was shown to significantly outperform the basic thresholding techniques which are mostly applied to a single imaging parameter.
ISODATA was used to identify ischemic tissue in similar studies (Soltanian-Zadeh et al., 2003, 2007): in Soltanian-Zadeh et al. (2003) the identification process was extended to using an abnormality scoring system between 0 and 1 in rats, and in Soltanian-Zadeh et al. (2007), an improved version was proposed, applied to rats and extended to human data including the role of reinforced reperfusion in the recovery process. In Hevia-Montiel et al. (2007) a nonparametric clustering strategy using mean-shift algorithm and edge confidence map was developed to identify the lesion core in DW images. A similar approach developed by Li et al. (2009) also a used mean-shift algorithm to identify acute ischemic tissue in ADC maps.
As part of the pixel-based classification techniques, we identified three papers applying Markov random fields (MRF), a statistically-based segmentation model which incorporates information about neighboring voxels (Martel et al., 1999; Kabir et al., 2007; Dwyer et al., 2008). Martel et al. combined an adaptive thresholding algorithm with MRF to model relationships between adjacent pixels. They obtained a semi-automatic segmentation by maximizing the a posteriori (MAP) probability using the iterated conditional modes (ICM) and applied to DT-MRI to measure the infarct volume.
In Kabir et al. (2007) a multimodal MRF model including T2, FLAIR and DWI modalities was used to automatically segment the infarct. The method developed by Dwyer et al. (2008) is among the few existing methods which aim to quantify the perfusion/diffusion mismatch. Perfusion (MTT), diffusion (DWI, ADC) and (T2, FLAIR) data were used in the hidden MRF model combined with an automated contralateral identification to discriminate normal tissue from penumbral non-infarcted tissue leading to a quantification of the salvageability of the hypoperfused tissue. It was also pointed out that the use of hidden MRF showed considerable improvement over basic thresholding techniques. Both the infarct core and contralateral mirror tissue were used as seed regions to initialize the segmentation. A new unsupervised approach, which accounted for the partial volume effect based on adaptive multiscale statistical Bayesian classification and applied to DT-MRI data, was proposed by Li et al. (2004). A different approach presented by Prakash et al. (2006), based on a probabilistic neural network and an adaptive Gaussian mixture model, segmented infarct in DW images. All the previous methods were applied to MR images. For CT data, we only found one paper (Chawla et al., 2009): Chawla et al. proposed an automatic histogram and wavelet-based two-level classification scheme to depict acute and chronic ischemic lesions separately.
Within this category, only one paper (Soltanian-Zadeh et al., 2007) addressed the phenomenon of reperfusion, only one paper (Martel et al., 1999) required a training data set and three papers (Jacobs et al., 2000, 2001a,b) required more than one acquisition timepoint. Although these methods applied more sophisticated techniques, the phenomenon of swelling in acute/subacute ischemic stroke was not addressed.
3.2.3. Atlas-based segmentation (4%)
We identified one paper (Maldjian et al., 2001) that used an atlas as anatomical reference to specifically register the target vascular territory during the segmentation process. This automatic method used CT scans of 20 normal subjects and 15 patients to identify potential areas of acute middle cerebral artery infarct. Although the quality of registration to the anatomical atlas was evaluated as excellent, the spatial identification of some infarcts' boundaries did not fit the ground truth observations. The integration of an anatomical atlas in the algorithm may be helpful in determining the anatomical extent of the swollen ischemic area, however the swelling phenomenon was not addressed.
3.2.4. Deformable model-based segmentation (8%)
Deformable models are formulated as an energy-minimization problem using closed parametric curves or surfaces whose spatial deformation is guided by internal and external forces (Pham et al., 2000). We found two publications that applied deformable models to segmentation of stroke data. The first explored the intensity variations commonly observed within stroke lesions to define a new confidence-based model targeting a robust segmentation of ischemic lesions in MR images and an accurate estimation of the lesion volume (Weinman et al., 2003). This model combined nonlinear diffusion scale-space with a snake-based deformable model. Although the method led to overall satisfactory results, it cannot be applied to cases with scattered lesions (Fig. 1) since the segmented lesions are meant to slowly blend together at a certain scale. In the cases where the technique failed to identify the ischemic lesion, user interaction was required to adjust the confidence level. In a second paper, Stein et al. (2001) introduced a 3D hybrid statistical snake-based deformable model to segment stroke lesions and estimate their volumes. Similar to the previous paper, the results were promising especially when some of the limitations of the snakes were addressed by integrating additional statistical information. However the model assumed that the lesion was a smooth one-connected spatial component, which would not apply to many acute ischemic lesions which are disconnected. The algorithm also required user interaction to initialize the snakes. The major limitations of these methods are derived from the small sample of patients used for evaluation (5 in Weinman et al. (2003) and 6 in Stein et al. (2001)), and the lack of information about the severity and the variability of stroke in terms of its location, topological connectivity and swelling.
3.3. Prediction methods
We found 14 papers (Table 2) describing methods to predict the ultimate tissue fate at acute and/or subacute stages of ischemic stroke: 8/14 (57%) of the identified papers used human ischemic stroke data and 6/14 (43%) used animal data, and MR data were used. In 12 papers (86%) a learning phase, using a training dataset was required, and the techniques described in 5 (36%) papers were based on the acquisition of observations at more than one timepoint. Although the learning phase might impede the development of a fully automatic approach, the reduction in the use of external interaction was only achieved in two papers (Hevia-Montiel et al., 2008; Rosso et al., 2009). Unlike the segmentation methods described in Section 3.2, the phenomenon of reperfusion was addressed in 7 (50%) of the prediction-based papers. Nonetheless, the effect of lesion swelling was constantly overlooked and only final infarct images were used to evaluate the different predictive models (Table 2). For a more consistent analysis of the prediction papers, we adopted the same categorization previously used to classify the segmentation methods.
3.3.1. Image-based prediction (21%)
In this category, we identified only two papers (Hevia-Montiel et al., 2008; Rosso et al., 2009) relying on region-growing approaches. In Hevia-Montiel et al. (2008), a 3D nonparametric region-growing technique was applied to ADC maps to extract brain areas more likely to infarct in human acute stroke. The algorithm output was assessed using DW imaging-based final observed outcome and gave promising results. Making the assumption that DW images represent the infarct core and that ADC lesion represents the salvageable penumbra in Rosso et al. (2009), a thresholding-driven region-growing algorithm was initialized using DW acute lesion boundary and “grown” into the ADC lesion, yielding the final infarct volume. The growth of the initially smoothed 3D boundary was controlled by an energy-index minimization terminated when reaching a pre-set cut-off ADC value. Both of these papers used ADC and DW images, however, the effect of recanalization on the prediction process was only investigated in Rosso et al. (2009). A different non-linear learning approach was recently presented by Scalzo et al. (2012), which hypothesized that locally extracted cuboids (voxel in a cube, surrounded by the regional distribution of image intensities) reveal the dynamic evolution of ischemic tissue and its ultimate fate. In a framework where kernel spectral regression is as well-performing as the support vector machines (SVM), adaptive boosting (AdaBoost) and decision trees, the authors chose it to predict ischemic voxel fate using time-to-maximum (Tmax) or ADC images as input and compared to final FLAIR intensity outcome. Using a leave-one-out crossvalidation as evaluation tool, the outcome was better predicted using Tmax images.
3.3.2. Pixel and voxel-based prediction (79%)
Within this category, generalized linear models (GLM) were used in three papers (Nguyen et al., 2008; Wu et al., 2001, 2007). In Wu et al. (2001), a supervised learning model combining both diffusion and perfusion data was developed to predict tissue outcome in human ischemic stroke determined by a pixel-by-pixel risk of infarction map where both low risk and high risk of infarction areas were depicted and compared according to pre-selected multimodal predictive parameters. The evaluation of this perfusion–diffusion based predictive model using the two-month follow-up T2 image demonstrated vastly better performance when compared to standard thresholding techniques. In a subsequent paper (Wu et al., 2007), a GLM-predicted infarction risk map using four MR modalities (ADC, CBF, CBV, MTT) in rat reperfused/nonreperfused stroke was generated. A recent extension of the GLM integrated additional spatial correlation information in Nguyen et al. (2008), was applied to human structural, perfusion and diffusion data and compared to a spatial autoregression model (SAR) which individually outperformed GLM in the majority of cases.
For clustering K-means derived methods, we identified six papers (Carano et al., 1998; Rose et al., 2001, 2004; Shen et al., 2004, 2005; Shen and Duong, 2008). In Carano et al. (1998), a multiparametric analysis using two unsupervised (K-means, fuzzy C-means) and two supervised (multivariate Gaussian, k-nearest neighbor) clustering techniques were used to classify ischemic tissue fate based on ADC maps, CBF maps and T2 in a rat stroke model. An additional evaluation of the outperformance of K-means, using correlation coefficient to postmortem infarct size, was highlighted when compared to both multivariate Gaussian and k-nearest neighbor supervised methods. In Rose et al. (2001), a parametric normal classifier algorithm used quantitative and relatives perfusion measures (CBF and CBV) and diffusion data (DWI) to predict the spatial location and size of infarcted MTT tissue. Expectation maximization and K-means clustering algorithm to predict tissue outcome were used in Rose et al. (2004), and investigated whether bolus-delay-corrected dynamic susceptibility perfusion MRI measures lead to a better estimation of the infarct volume in human ischemic stroke. Both diffusion and perfusion maps were used to implement the predictive model and the 30-day T2W final lesion was used to validate its accuracy. In Shen et al. (2004) a K-means driven improved ISODATA cluster analysis was used to track the dynamic change of ischemic tissue within the core and the penumbra and predict its ultimate outcome in rats. The ADC map when combined with the CBF map was used to determine the “mismatch fate” with the T2W lesion as the final infarcted region. This approach was improved in Shen et al. (2005) by generating probability maps of risk of future infarction using different combinations of input data (only ADC, only CBF or both ADC and CBF). An alternative improvement of this model taking into account vascular regional susceptibility to infarction was proposed in Shen and Duong (2008) where an additional training-based supervised learning stage was used in the model to draw probability-of-infarction profiles based on ADC and CBF maps. Furthermore, both scenarios of spontaneous reperfusion and non-reperfusion were considered to build a more robust and reliable predictive model.
We found two recent studies (Bagher-Ebadian et al., 2011; Huang et al., 2010) based on artificial neural networks (ANN). In Bagher-Ebadian et al. (2011), the final extent of the 3-month T2-lesion was predicted using T1W, T2W, DW and PW training images at the acute timepoint. In Huang et al. (2010), six different conditions to predict the final tissue outcome by training an ANN and testing it using the leave-one-out approach were defined. Spatial infarction incidence map and nearest-neighborhood information were fed into the model to guide the training process. The model prediction performance was also compared with the previous animal models of Shen et al. (2005) and Shen and Duong (2008) and gave a similar performance.
Almost half of the methods were evaluated using animal stroke data and using the same data as that in which the algorithm had been developed or trained. As shown in Table 2, the technique described in Shen et al. (2004) (and its subsequent developments in Shen et al. (2005) and Shen and Duong (2008)) all used data obtained from 6 rats not clarifying if the same or different rats were used. Although the results were promising, achieving a similar level of accuracy and precision in human stroke is unlikely because of its increased complexity compared to animal models. As in segmentation methods, the induced swelling was not considered in any of the identified predictive approaches.
3.4. Dynamic evolution models
We found eight papers (Table 3) that provided more insights into the dynamic progression of the infarct core and the spatio-temporal evolution of the penumbral region in acute/subacute ischemic stroke (Chapuisat et al., 2008, 2010; Dronne et al., 2004, 2006; Duval et al., 2002; Grenier et al., 2010) and that addressed different key phenomena influencing the patterns of dynamic evolution of both animal and human ischemic strokes.
A simplified mathematical dynamic model depending on a set of key parameters involved in the hyperacute phase of ischemic stroke was described in Duval et al. (2002). The key factors involved in initiating the cascade of ischemic events were identified using MRI and PET quantitative data and translated into equations simulating a voxel-per-voxel early ischemic stroke episode and investigating the influence of the edema on the penumbra evolution. Subsequently, through depicting the relevant components in the process of stroke evolution observed in human and animal strokes, a formal 2D microscopic dynamic model was presented (Dronne et al., 2004). The global model was built by combing two or more of ten sub-models, each denoting a key factor in evolving stroke (tissue reactions, ionic movements, edema development, glutamate excitotoxicity, spreading depression, NO synthesis, inflammation, necrosis, apoptosis, and reperfusion). A dynamic model describing the spatio-temporal evolution of the penumbra after a permanent occlusion or reperfusion was simulated by merging three dynamic sub-models. Another microscopic dynamic model was developed in Dronne et al. (2006) that focused on ion movement in gray matter that was considered to trigger cell swelling and shrinking. They ran different simulations for severe and moderate ischemic strokes, analyzing the effect of some ion channel blockers on the development of cytotoxic edema.
A dynamic phenomenological model, that simulated the propagation of spreading depression (SD) in a 2D brain following energy reduction caused by local ischemia and taking into account the recovery mechanism through reperfusion, was presented in Chapuisat et al. (2008). A set of mathematical multiparametric equations was defined considering cell death by apoptosis or necrosis. Through solving these equations, the model attempted to simulate the pattern of local ischemia using empirically set parameters.
The role of the duration and the intensity of CBF reduction on the final size of the ischemic core and on cell death by necrosis or apoptosis was investigated in Chapuisat et al. (2010). Various ischemic conditions were identified and translated into ordinary and partial differential equations. The evaluation of the suggested mathematical model was evaluated using in silico experiments. In Grenier et al. (2010), the dynamic growth of the ischemic lesion core was modeled using a set of ordinary differential equations and used to explore the influence of the mode of cell death (by necrosis or apoptosis) on the final infarct size. Unlike previous dynamic models, for the first time, the mathematical reaction–diffusion equation extensively used to model biological phenomena and brain diseases (Murray, 2002) was newly adapted to simulate ischemic stroke evolution in realistic 3D geometry of the human brain and differentiate ischemic evolution in white and gray matter (Dumont et al., 2010), based on the model of Dronne et al. (2006). The “realistic” tag associated to the approach stems from differentiating the dynamic evolution of ischemia in gray and white matter as the authors used 10 reaction–diffusion equations in gray matter and 5 in white matter to simulate the propagation of tissue-damaging waves. This new simulative model was built upon an efficient numerical scheme to solve the partial differential equations (PDE) using a multithreaded reaction solver. Later on, going back to hypothesizing a simple homogenous geometry of the brain (made only of gray matter), the first hour of 2D/3D human ischemic stroke evolution was simulated using a new numerical scheme to solve multi-scale reaction–diffusion equations (Anon., 2011), where the reaction term was also inspired from Dronne et al. (2006). The multi-scale reaction diffusive waves were formulated based on the main ionic mechanisms controlling cell death in stroke with 19 unknowns to estimate and solve on simplified brain geometry due to the limitations of the used adaptive mesh refinement techniques.
All of these dynamic models were evaluated through launching a set of simulations using different physiological values depicted from the literature (Table 3). None of the models were validated using imaging-based or clinical-based assessment or simulated the evolution of synthetic or real stroke lesions on MR or CT images. None of these papers also included an MR or CT image of an ischemic stroke. In addition, these models used simplified assumptions, such as hypothesizing a 1D or 2D homogeneous brain (Chapuisat et al., 2008; Dronne et al., 2004) and not considering the diffusion of the ionic species (Dronne et al., 2006). Moreover, all of the reviewed dynamic models are based on hypotheses drawn from different publications without considering the significant information that could be extracted from MR/CT images such as anatomical boundaries and lesion topological and shape properties. Unlike all the previously reviewed prediction and segmentation methods, the phenomenon of swelling was addressed in three papers (Dronne et al., 2006; Dumont et al., 2010; Duval et al., 2002) and two papers (Chapuisat et al., 2008; Dronne et al., 2004) addressed the possible effects of reperfusion.
4. Discussion
We have performed an extensive search to identify image analysis methods and mathematical models applied to acute/subacute ischemic lesions in human, animal and/or synthetic data. We identified 47 papers within 3 different objectives: segmentation of dead and/or salvageable tissue, prediction of final ischemic tissue outcome and dynamic modeling with simulation of ischemia evolution. Most of the medical image analysis and computational models in acute/subacute ischemic stroke firstly considered the penumbra and core tissue segmentation problem and secondly the prediction of the final irreversible damage. In this review paper, through identifying studies that tackled both of these problems, we presented a common categorization to provide an overview of the approaches that have been proposed and their major drawbacks. Taking into account the limitations of the thresholding approaches (Pham et al., 2000) as being blind to spatial characteristics of an image, very sensitive to image artifacts and difficult to apply to multi-channel images, we excluded all studies that only relied on basic thresholding techniques and/or standard statistical-correlation-based data analysis. Tools aimed at clinical practice such as the RAPID software (Straka et al., 2010), which attempt to automatically segment both acute core and penumbra to estimate their volumetric mismatch, were also excluded because of the use of absolute or relative thresholds. Relying on PWI/DWI threshold values has been demonstrated to be a misleading factor in measuring both perfusion and diffusion abnormalities (Dani et al., 2012). Segmentation and prediction methods that do not incorporate a non-rigid or deformable registration to account for the induced acute swelling, may be expected to yield somewhat erratic results, due to the variation in the mass effect between patients.
Reviewing the 47 included papers, we noticed that these did not, in general, consider the underlying biology and imaging-dependent issues related to ischemic stroke evolution and the tissue fate. Indeed, swelling and all other aspects of lesion and peri-lesion tissue distortion were completely overlooked in all the prediction and segmentation methods, although it was integrated in the mathematical equations in one dynamic model with simplistic assumptions (Dronne et al., 2006) (Table 3). Another key phenomenon that can alter the dynamic evolution process of acute ischemia is spontaneous or therapeutic reperfusion. Since segmentation methods are used to determine spatial boundaries of the core and/or penumbral regions at a specific fixed timepoint, the reperfusion is not to be included as a varying parameter in the method. The reperfusion problem was only highlighted in 7 prediction methods (50%) and in one dynamic model (Dronne et al., 2004).
Additionally none of the described segmentation, prediction and dynamic evolution methods accounted for the number of connected components comprising the overall lesion. In fact, one might need to use different mathematical-driven approaches when tackling the problem of segmenting or predicting outcome in lesions made up of one-connected-component versus multiple connected-components. In the majority of the prediction methods described, the visible lesion on the T2W image at 3-months after stroke was considered as the ground truth for determining outcome. The problems of T2-shine through and fogging were not mentioned in any of the papers that used DW weighted imaging. All of these are common MR/CT imaging features of stroke and will distort the interpretation of lesion progression in the subacute phase using image analysis methods unless considered in the design of the method.
Looking at the performance of the included papers, most of the approaches described seemed to perform better than the basic thresholding techniques, paving the way for more promising segmentation and prediction methods. Most studies in segmentation and prediction used the same models: K-means derived approaches such as ISODATA 8 (32%), region growing based approaches 4 (16%) and GLM 3 (12%). Many groups presented results in later papers that built upon models described in earlier papers but with improvements to overcome their main limitations and that seemed in some cases to be more promising (e.g.: (Shen and Duong, 2008; Huang et al., 2010) in prediction). However, it is difficult to assess the performance of these approaches, or the superiority of one over another, due to repeated use of the same dataset, the wide variety of evaluation methods applied in animal, human and synthetic data, the wide range of combinations of perfusion and diffusion measures and the variation in the point at which the modeling builds up the ischemic pattern and the assumptions on which the model depends.
Regarding the need for external user interaction, 11 (44%) of the segmentation and 2 (14%) prediction methods required user interaction promoting for fully automatic approaches. From a data-driven perspective, 11 (79%) of the prediction approaches and 2 (8%) of the segmentation methods required training data. These supervised approaches can present a stumbling block to the wider clinical adoption of such techniques.
Ideally, predicting and modeling the dynamic evolution of acute stroke would be achieved relying on one single MR/CT image acquisition at the acute timepoint. Five (36%) of the predictive approaches needed time series (longitudinal) data rather defeating the purpose of trying to predict lesion change. Most segmentation and prediction methods lacked validation datasets and some only used synthetic data for validation. Another issue is the paucity of data available for development and testing with 8 (32%) of the segmentation (vs. 4 (29%) of the prediction) methods used less than 15 patients or only synthetic data. Five papers did not provide any information about the number of patients. None of the dynamic models were assessed using animal or human data. Only image-based outcome assessments were used so it is unclear how these relate to the more clinically-relevant functional outcomes. A better assessment would combine both the image-based and clinical-based outcomes. Some papers provided no validation of their method (Kabir et al., 2007). Interestingly, in the prediction imaging-based category, the kernel spectral regression technique presented in Scalzo et al. (2012) was demonstrated to be more efficient when compared to the basic linear regression model since with its nonlinearity it captures more the complexity of intensity-based spatial evolution of stroke.
From a medical image analysis perspective, only three papers (Weinman et al., 2003; Maldjian et al., 2001; Stein et al., 2001) out of 25 dealing with segmentation did not rely on image-driven or pixel classification based approaches. For prediction, all of the included studies belong to one of these approaches. These image-driven and pixel classification-based approaches offer a limited framework for incorporating strong prior information to improve segmentation. Furthermore, a major weakness of these classifiers is the partial volume effects and intensity inhomogeneities in the images (Pham et al., 2000). Out of all of the identified prediction and segmentation methods, only one (Li et al., 2004) dealt with the partial volume effects. Also the performance of parametric classifiers is dictated by the underlying statistical characteristics of the training data which increase the probability of obtaining biased results especially when using the same datasets in successive publications with incremental improvements. Again this may reflect the small number of datasets available to researchers because of the difficulty of collecting such data, meaning that separate cases cannot be used for development or training and validation.
Additional problems arising from the ISODATA technique (Soltanian-Zadeh et al., 2003, 2007; Jacobs et al., 2000; Shen et al., 2004) include its instability when applied to noisy images, artifacts and dependence on the assumption of normality for the distribution of clustered data (Bagher-Ebadian et al., 2011). Perfusion data, for example, are not normally distributed indicating a fundamental flaw in this assumption. All these factors can be misleading during the pixel-by-pixel based classification (vs. prediction). Interestingly, Contin et al. pointed out the scarce literature regarding the segmentation of ischemia in perfusion CT images, reflecting that this imaging facility is left out of consideration of medical image analyses.
Some of the included studies involved an empirical estimation of various parameters such as the use of 19 ordinary differential equations with 30 parameters to estimate in Dronne et al. (2006) and 17 in Chapuisat et al. (2010). This is prohibitively time consuming and increases the computational load. The problem of how to estimate automatically any initial or fixed parameter values is still unsolved in many of the approaches. For example, when using artificial neural networks (Huang et al., 2010) the optimal number of hidden nodes and training epochs is not straightforward to determine.
Most of the dynamic models hypothesized a simple geometry of the brain: 1D or a square brain (Chapuisat et al., 2008), 2D matrix (Chapuisat et al., 2010) and that brain tissue was homogenous (e.g.: only gray matter (Dronne et al., 2006; Anon., 2011)). In some prediction papers, spherical lesion simulations were used to validate the developed method (Shen and Duong, 2008). All these assumptions stray widely from the true characteristics of the brain, the ischemic stroke lesion and its evolution process. Finally, it is worth noting that all the issues highlighted for prediction algorithms also apply to imaging-based or microscopic-based dynamic models.
The latter discussion reveals that ischemic stroke lesions are complex, with wide variation in, and relative unpredictability of their spatiotemporal evolution. Many promising new drugs emerging from preclinical testing have failed in clinical trials (Duval et al., 2002). There are many reasons for this, but one factor may be some misconceptions or perhaps oversimplification of our understanding of the acute ischemic stroke lesion evolution process. It is important that neuroimaging modalities and subsequent analysis techniques, like MRI and CT, properly address the key imaging-derived or biology-derived problems that are inherent to ischemic stroke, though few if any do. It may be that the image analysis community has deliberately avoided acute ischemic stroke, recognizing the difficulty of dealing with thick section, non-contiguous image slices in a disease that causes marked tissue distortion, appears and disappears over time, and most often consists of disconnected parts rather than a single lesion. In this light, more integrated approaches that unite the image processing and clinical communities are needed if any of these potentially promising methods are to realize their potential. To our knowledge, a book chapter, by Ghosh et al. (2012), was the first to touch on previous computational noninvasive stroke analysis methods used to segment penumbral and infarcted tissue and to address tissue fate prediction. Others are starting to realize the importance of adopting alternative approaches to the traditional volume measurement or threshold delineated lesions studied so far. However, the majority of the biology-dependent and imaging-dependent issues weren't addressed in Ghosh et al. (2012).
In addition to including key biological phenomena like swelling, collateral flow and reperfusion and addressing the previously described imaging-derived problems, further difficulties lying ahead include, for example, the ongoing debate concerning the use of perfusion/diffusion mismatch (Rivers et al., 2006; Chemmanam et al., 2010). Although this problem might seem to be on the periphery of the main focus of this critical appraisal, it cannot be ignored when tackling prediction or dynamic simulation of image-based ischemic lesion evolution. Unlike other brain diseases which might succinctly rely on one unique modality to extract the required information on evolution, ischemic stroke lesions cannot be properly understood without a “good combination” of both structural images and perfusion maps. The absence of any prediction model using CT data (Table 2) indicates unresolved issues for the future, like the subtle tissue attenuation changes during the hyperacute stage (Brott et al., 1989; Kalafut et al., 2000; Muir et al., 2007; Wardlaw et al., 1998). Lesion enhancement methods might help overcome this major challenge (Takahashi et al., 2005; Tsai et al., 2005). Nevertheless, a potential combination of both CT and CT-perfusion (CTP) might tweak the results of the prediction methods as a more acutely accessible method. Finally, valid lesion evolution or outcome prediction models would have to take into account differences in the biological properties of gray and white matter, which are overlooked by all methods so far. Even in segmentation methods, Shen et al. pointed out that segmentation of ischemia and its progression quantification require segmentation of white and gray matter (Shen and Duong, 2008).
We also found a key untapped potential in that there was no image-based macroscopic dynamic model simulating the evolution of acute/subacute stroke. We tried to locate microscopic mathematical-driven dynamic models based on a set of partial and ordinary differential equations focusing on the stroke evolution process. These microscopic dynamic models can inform the development of macroscopic imaging-based dynamic models in acute ischemic stroke as has occurred previously in other brain diseases (Duncan and Ayache, 2000). Setting the bridge between microscopic and macroscopic ischemic progress simulations would need a translation of the phenomenological equations into imaging-derived equations where the variables can be measured using perfusion, diffusion or structural images. The great strides made in the microscopic simulation field of ischemia spatio-temporal progress, where more realistic models were developed reproducing the dynamics observed on MRI images in stroke patients (Dumont et al., 2010), led to more promising results. However, the fed information into the equations is not directly related to visually-measurable (or imaging-derived) quantities on medical images (e.g.: lesion boundary, shape, intensity etc.), as it uses the decrease of the ionic currents through the ionic pumps. Although it was also mentioned that the experimental results were consistent with observations on MRI images, no patient data evaluating this consistency proved it right. Including the diffusion term into the phenomenological models in Dumont et al. (2010) and Anon. (2011)) showed interesting results. Nevertheless, the precision of the predictive power of the simulations was doomed by the expensive integration numerical scheme of the diffusion term as the spatial discretization increased.
The era of stratified medicine and stroke treatment targeted to the individual is emerging. An ultimate goal of our review is to create new patient-specific mathematical and medical image analysis methods that account for the considerable individual variability between stroke patients. We believe that spatio-temporal MR/CT imaging-based dynamic models, that our paper shows do not currently exist for ischemic stroke, will further a more complete understanding of how the DWI core and the penumbra continuously and dynamically evolve. In the long term, novel patient-specific dynamic models that predict the evolution of the core and the penumbra from a single timepoint are possible. Going back to the “ambiguity” that may be surrounding the definition of the ischemic lesion core using DWI or other measures, this may be resolved once a 4D dynamic model adequate to capture the ischemic lesion optimally has been developed. Such a 4D approach will theoretically overcome the major limitations of current 2D or 3D approaches, if the lessons learned in the fields of tumor modeling can be applied to stroke. Spatio-temporal imaging-based dynamic modeling when applied to large representative populations of stroke, will also help identify common patterns of lesion evolution which may in turn help to refine our understanding and definitions of the core and penumbra.
Such lines of research should be drawn to allow development, initial independent validation and then further wider evaluation in clinically relevant populations of any new methods. This requires access to large datasets and both clinical-based and imaging-based outcome validation criteria. With this in mind and in a context where “time is brain”, the computational time of any new method is also a critical challenge requiring a more robust and efficient computational framework. A brief summary of these key recommendations for any future research work aimed at tackling any one of these three medical image-analysis problems in ischemic stroke, and considering the key problematic issues cited above, is highlighted in Table 4. The recommendations link both of the fields of image processing and MR-CT analysis in the hope of honing new innovative models that can tackle the major challenges in acute/subacute ischemia and further a growing interest in a variety of possibilities, which are at present untapped because of the complexity of ischemic stroke.
Table 4.
Recommendations for future research work addressing the segmentation of the dead and/or salvageable acute/subacute ischemic tissue, prediction of its final outcome and the simulation of an image-based dynamic evolution of ischemic stroke lesions.
| Category | Segmentation | Prediction | Dynamic evolution simulation |
|---|---|---|---|
| Setting clear targets | –Segmentation of the ischemic acute/subacute lesion core (supposedly dead) and/or the penumbra (supposedly salvageable), both presumably predefined in an adequate way. | –Prediction of the final outcome of the ischemic acute/subacute salvageable tissue (penumbra). | –Simulation of an imaging-based dynamic evolution of acute/subacute ischemic stroke (with or without distinction between spatio-temporal behavior of dead and salvageable tissue boundaries). |
| Datasets and imaging modalities | –Variability of the ischemic lesions to segment whether when choosing perfusion or diffusion data. –The segmentation algorithm can use perfusion and/or diffusion data. | –The combination of both perfusion and diffusion data is needed to develop realistic predictive and dynamic models. –Ideally, the developed approach would rely on one unique acquisition timepoint at acute stage instead of using time series (longitudinal) data. –Structural T1, T2 and FLAIR are commonly used to reveal the final imaging-based tissue outcome. –The use of MR angiography (MRA) as efficient tool to include the location of the occlusion in the predictive/simulating model. | |
| –Provide information about the recruited patients (number, age, stroke severity, “abnormal” blood territory, etc.) and about the how synthetic data was simulated. –Better use both of the clinical and the simulated data. | |||
| Problematic issues and key challenges to consider | –Considering reperfusion phenomenon might not be considered since segmentation methods are used to determine spatial boundaries of the core and/or penumbral regions at a specific fixed timepoint. | –Distinguish between the evolution of ischemic stroke in both white and gray matter as they have different hemodynamic behaviors. –Account for reperfusion in its four possible states: (1) natural spontaneous reperfusion without using collateral arteries, (2) spontaneous reperfusion using collateral arteries, (3) no reflow phenomenon, (4) reinforced reperfusion through thrombolysis. –Explore more the predictive power of the perfusion/diffusion mismatch and its influence on the dynamic behavior of ischemic strokes. –Find a good combination of diffusion and perfusion maps to use in the predictive/dynamic model. –Avoid oversimplified hypotheses about brain geometry (1D, 2D) and heterogeneity (e.g.: considering the brain as homogenous tissue). | |
| –Take into account swelling and shrinking processes to avoid drawing unrealistic conclusions about lesion spatial, temporal and volumetric evolution patterns. –Consider the case of scattered ischemic lesions when developing segmentation algorithms and when estimating or predicting an evolution scenario. –Use medical-image pre-processing tools to “remove” partial volume effect due to slice thickness in stroke data. –Improve the computational speed of the developed approach. –Avoid user interaction and aim for a fully automatic approaches. | |||
| Evaluation criteria | –Use various evaluation tools (e.g.: dice formula) to assess the accuracy and the precision of segmentation method. | –Use both clinical-based and image-outcome based evaluation tools to assess the outcome of both dynamic and prediction models. |
5. Conclusion
We present an overview of medical image analysis and mathematical models tackling problems of segmentation, prediction and dynamic evolution simulation in acute ischemic stroke using animal, human and/or synthetic data published to date. The field of ischemic stroke modeling is mined with difficulties for the image analyst like spontaneous reperfusion, the “no re-flow phenomenon”, and early mass effect followed by shrinkage induced by the stroke. None of the identified methods addressed these issues, and several disregarded them all. As further improvements, including anatomical spatial information and tissue heterogeneity (e.g.: gray and white matter), and accounting for partial volume effects induced by thick image slices may be considered. Taking into account the site of the arterial occlusion using MR angiograms (MRA) will be important in determining the biology-dependent factors driving the evolution of both infarct and penumbra and potentially more accurately predicting their final outcome (Phan et al., 2009).
An automatic segmentation method that would also predict ischemic tissue fate, and simulate the probable further evolution of the infarct core and the surrounding penumbra is a major goal that could be used to support stroke treatment. New levels of sophistication and several alternative approaches are required in medical image analysis to handle the complexity and the biological variability of acute ischemic stroke. Most of these issues have not even been considered or resolved. This lack of attention to acute ischemic stroke from an image-processing and computational perspective is underlined by the limited number of the studies on segmentation, prediction and dynamic simulation. One major aim of this review paper was to draw attention to challenges provided by stroke and the untapped potential of dynamic imaging-based models. Some medical image analysis methods developed to detect tissue abnormality in other diseases appear promising for applying to acute ischemic stroke (Erus et al., 2010; Seo et al., 2009; Studholme et al., 2006). This would promote better understanding of the different patterns of lesion evolution and provide insights into new treatment possibilities. Failure to recognize and address the difficulties is likely to delay progress in the field. Ultimately, image analysis applied to stroke may enable the selection of patients who will more likely benefit from thrombolytic treatment at a reduced risk of hemorrhage; thereby improving the efficacy and safety of this treatment.
Footnotes
☆
This is an open-access article distributed under the terms of the Creative Commons Attribution-NonCommercial-ShareAlike License, which permits non-commercial use, distribution, and reproduction in any medium, provided the original author and source are credited.
Contributor Information
Islem Rekik, Email: islem.rekik@gmail.com.
Stéphanie Allassonnière, Email: stephanie.allassonniere@polytechnique.edu.
Trevor K. Carpenter, Email: trevor.carpenter@ed.ac.uk.
Joanna M. Wardlaw, Email: joanna.wardlaw@ed.ac.uk.
References
- Agam G., Weiss D., Soman M., Arfanakis K. 2007. Probabilistic Brain Lesion Segmentation in DT-MRI; pp. 89–92. [Google Scholar]
- Ames A., III, Wright R.L., Kowada M., Thurston J.M., Majno G. Cerebral ischemia. II. The no-reflow phenomenon. The American Journal of Pathology. 1968;52:437–453. [PMC free article] [PubMed] [Google Scholar]
- Anon. EDP Sciences. 2011. New resolution strategy for multi-scale reaction waves using time operator splitting and space adaptive multiresolution: application to human ischemic stroke, volume 34. [Google Scholar]
- Arenillas J.F., Rovira A., Molina C.A., Grivé E., Montaner J., Alvarez-Sabín J. Prediction of early neurological deterioration using diffusion- and perfusion-weighted imaging in hyperacute middle cerebral artery ischemic stroke. Stroke. 2002;33:2197–2203. doi: 10.1161/01.str.0000027861.75884.df. [DOI] [PubMed] [Google Scholar]
- Astrup J., Symon L., Branston N.M., Lassen N.A. Cortical evoked potential and extracellular K + and H + at critical levels of brain ischemia. Stroke. 1977;8:51–57. doi: 10.1161/01.str.8.1.51. [DOI] [PubMed] [Google Scholar]
- Astrup J., Siesjö B.K., Symon L. Thresholds in cerebral ischemia — the ischemic penumbra. Stroke. 1981;12:723–725. doi: 10.1161/01.str.12.6.723. [DOI] [PubMed] [Google Scholar]
- Bagher-Ebadian H., Jafari-Khouzani K., Mitsias P.D., Lu M., Soltanian-Zadeh H., Chopp M., Ewing J.R. Predicting final extent of ischemic infarction using artificial neural network analysis of multi-parametric MRI in patients with stroke. PloS One. 2011;6:e22626. doi: 10.1371/journal.pone.0022626. [DOI] [PMC free article] [PubMed] [Google Scholar]
- Bang O.Y., Saver J.L., Buck B.H., Alger J.R., Starkman S., Ovbiagele B., Kim D., Jahan R., Duckwiler G.R., Yoon S.R., Viñuela F., Liebeskind D.S., UCLA Collateral Investigators Impact of collateral flow on tissue fate in acute ischaemic stroke. Journal of Neurology, Neurosurgery, and Psychiatry. 2008;79:625–629. doi: 10.1136/jnnp.2007.132100. [DOI] [PMC free article] [PubMed] [Google Scholar]
- Barber P.A., Darby D.G., Desmond P.M., Yang Q., Gerraty R.P., Jolley D., Donnan G.A., Tress B.M., Davis S.M. Prediction of stroke outcome with echoplanar perfusion- and diffusion-weighted MRI. Neurology. 1998;51:418–426. doi: 10.1212/wnl.51.2.418. [DOI] [PubMed] [Google Scholar]
- Bonita R. Epidemiology of stroke. Lancet. 1992;339:342–344. doi: 10.1016/0140-6736(92)91658-u. [DOI] [PubMed] [Google Scholar]
- Braun J., Bernarding J., Koennecke H.-C., Wolf K.-J., Tolxdorff T. Feature-based, automated segmentation of cerebral infarct patterns using T2- and diffusion-weighted imaging. Computer Methods in Biomechanics and Biomedical Engineering. 2002;5:411–420. doi: 10.1080/1025584021000011082. [DOI] [PubMed] [Google Scholar]
- Brott T., Marler J.R., Olinger C.P., Adams H.P., Jr., Tomsick T., Barsan W.G., Biller J., Eberle R., Hertzberg V., Walker M. Measurements of acute cerebral infarction: lesion size by computed tomography. Stroke. 1989;20:871–875. doi: 10.1161/01.str.20.7.871. [DOI] [PubMed] [Google Scholar]
- Burdette J.H., Elster A.D., Ricci P.E. Acute cerebral infarction: quantification of spin-density and T2 shine-through phenomena on diffusion-weighted MR images. Radiology. 1999;212:333–339. doi: 10.1148/radiology.212.2.r99au36333. [DOI] [PubMed] [Google Scholar]
- Carano R.A., Takano K., Helmer K.G., Tatlisumak T., Irie K., Petruccelli J.D., Fisher M., Sotak C.H. Determination of focal ischemic lesion volume in the rat brain using multispectral analysis. Journal of Magnetic Resonance Imaging. 1998;8:1266–1278. doi: 10.1002/jmri.1880080614. [DOI] [PubMed] [Google Scholar]
- Chapuisat G., Dronne M.A., Grenier E., Hommel M., Gilquin H., Boissel J.P. A global phenomenological model of ischemic stroke with stress on spreading depressions. Progress in Biophysics and Molecular Biology. 2008;97:4–27. doi: 10.1016/j.pbiomolbio.2007.10.004. [DOI] [PubMed] [Google Scholar]
- Chapuisat G., Dronne M.-A., Grenier E., Hommel M., Boissel J.-P. In silico study of the influence of intensity and duration of blood flow reduction on cell death through necrosis or apoptosis during acute ischemic stroke. Acta Biotheoretica. 2010;58:171–190. doi: 10.1007/s10441-010-9100-2. [DOI] [PubMed] [Google Scholar]
- Chawla M., Sharma S., Sivaswamy J., Kishore L. Engineering in Medicine and Biology Society, 2009. EMBC 2009. Annual International Conference of the IEEE. IEEE. 2009. A method for automatic detection and classification of stroke from brain CT images; pp. 3581–3584. [DOI] [PubMed] [Google Scholar]
- Chemmanam T., Campbell B.C.V., Christensen S., Nagakane Y., Desmond P.M., Bladin C.F., Parsons M.W., Levi C.R., Barber P.A., Donnan G.A., Davis S.M., EPITHET Investigators Ischemic diffusion lesion reversal is uncommon and rarely alters perfusion–diffusion mismatch. Neurology. 2010;75:1040–1047. doi: 10.1212/WNL.0b013e3181f39ab6. [DOI] [PubMed] [Google Scholar]
- Choi P., Srikanth V., Phan T. “Fogging” resulting in normal MRI 3 weeks after ischaemic stroke. BMJ Case Reports. 2011;2011 doi: 10.1136/bcr.04.2011.4110. [DOI] [PMC free article] [PubMed] [Google Scholar]
- Contin L., Beer C., Bynevelt M., Wittsack H., Garrido G. IWSSIP International Conference. 2010. Semi-automatic segmentation of core and penumbra regions in acute ischemic stroke: preliminary results. [Google Scholar]
- Coutts S.B., Simon J.E., Tomanek A.I., Barber P.A., Chan J., Hudon M.E., Mitchell J.R., Frayne R., Eliasziw M., Buchan A.M., Demchuk A.M. Reliability of assessing percentage of diffusion–perfusion mismatch. Stroke. 2003;34:1681–1683. doi: 10.1161/01.STR.0000078840.96473.20. [DOI] [PubMed] [Google Scholar]
- Dani K.A., Thomas R.G.R., Chappell F.M., Shuler K., Muir K.W., Wardlaw J.M. Systematic review of perfusion imaging with computed tomography and magnetic resonance in acute ischemic stroke: heterogeneity of acquisition and postprocessing parameters: a translational medicine research collaboration multicentre acute stroke imaging study. Stroke. 2012;43:563–566. doi: 10.1161/STROKEAHA.111.629923. [DOI] [PubMed] [Google Scholar]
- Dastidar P., Heinonen T., Ahonen J.P., Jehkonen M., Molnár G. Volumetric measurements of right cerebral hemisphere infarction: use of a semiautomatic MRI segmentation technique. Computers in Biology and Medicine. 2000;30:41–54. doi: 10.1016/s0010-4825(99)00022-0. [DOI] [PubMed] [Google Scholar]
- Dawant B., Zijdenbos A. Image segmentation. Handbook of Medical Imaging. 2000;2:71–127. [Google Scholar]
- Dronne M.-A., Boissel J.-P., Grenier E., Gilquin H., Cucherat M., Hommel M., Barbier E., Bricca G. Mathematical modelling of an ischemic stroke: an integrative approach. Acta Biotheoretica. 2004;52:255–272. doi: 10.1023/B:ACBI.0000046597.53669.ff. [DOI] [PubMed] [Google Scholar]
- Dronne M.-A., Boissel J.-P., Grenier E. A mathematical model of ion movements in grey matter during a stroke. Journal of Theoretical Biology. 2006;240:599–615. doi: 10.1016/j.jtbi.2005.10.023. [DOI] [PubMed] [Google Scholar]
- Dumont T., Duarte M., Descombes S., Dronne M., Massot M., Louvet V. Submitted to Bulletin of Math, Biology. 2010. Simulation of human ischemic stroke in realistic 3D geometry: a numerical strategy. (Available on HAL ( http://hal.archives-ouvertes.fr/hal-00546223)) [Google Scholar]
- Duncan J., Ayache N. Medical image analysis: progress over two decades and the challenges ahead, pattern analysis and machine intelligence. IEEE Transactions on. 2000;22:85–106. [Google Scholar]
- Duval V., Chabaud S., Girard P., Cucherat M., Hommel M., Boissel J.P. Physiologically based model of acute ischemic stroke. Journal of Cerebral Blood Flow and Metabolism. 2002;22:1010–1018. doi: 10.1097/00004647-200208000-00013. [DOI] [PubMed] [Google Scholar]
- Dwyer M.G., Bergsland N., Saluste E., Sharma J., Jaisani Z., Durfee J., Abdelrahman N., Minagar A., Hoque R., Munschauer F.E., III, Zivadinov R. Application of hidden Markov random field approach for quantification of perfusion/diffusion mismatch in acute ischemic stroke. Neurological Research. 2008;30:827–834. doi: 10.1179/174313208X340987. [DOI] [PubMed] [Google Scholar]
- Erus G., Zacharaki E., Bryan N., Davatzikos C. Computer Vision and Pattern Recognition Workshops (CVPRW), 2010 IEEE Computer Society Conference on. IEEE. 2010. Learning high-dimensional image statistics for abnormality detection on medical images. pp. 139–145. [Google Scholar]
- Ford A., An H., Lin K.V. Defining the ischemic penumbra using hyperacute neuroimaging: deriving quantitative ischemic thresholds. Translational Stroke Research. 2012:1–7. doi: 10.1007/s12975-012-0181-x. [DOI] [PMC free article] [PubMed] [Google Scholar]
- Ghosh N., Recker R., Shah A., Bhanu B., Obenaus S.A. Automated ischemic lesion detection in a neonatal model of hypoxic ischemic injury. Journal of Magnetic Resonance Imaging. 2011;33:772–781. doi: 10.1002/jmri.22488. [DOI] [PubMed] [Google Scholar]
- Ghosh N., Sun Y., Bhanu C.T. Computational analysis: a bridge to translational stroke treatment. Translational Stroke Research. 2012:881–909. [Google Scholar]
- Grandin C.B., Duprez T.P., Smith A.M., Oppenheim C., Peeters A., Robert A.R., Cosnard G. Which MR-derived perfusion parameters are the best predictors of infarct growth in hyperacute stroke? comparative study between relative and quantitative measurements. Radiology. 2002;223:361–370. doi: 10.1148/radiol.2232010673. [DOI] [PubMed] [Google Scholar]
- Grenier E., Bresch D., Dronne M., Hommel M., Boissel J. A phenomenological model of the growth of the necrotic area in ischemic stroke. Mathematical and Computer Modelling. 2010;51:1011–1025. [Google Scholar]
- Gupta V., Prakash B., Nowinski W.L. Automatic and rapid identification of infarct slices and hemisphere in DWI scans. Academic Radiology. 2008;15:24–39. doi: 10.1016/j.acra.2007.07.024. [DOI] [PubMed] [Google Scholar]
- Heinonen T., Dastidar P., Kauppinen P., Malmivuo J., Eskola H. Semi-automatic tool for segmentation and volumetric analysis of medical images. Medical & Biological Engineering & Computing. 1998;36:291–296. doi: 10.1007/BF02522473. [DOI] [PubMed] [Google Scholar]
- Hevia-Montiel N., Rosso C., Chupin N., Deltour S., Bardinet E., Dormont D., Samson Y., Baillet S. Automatic prediction of infarct growth in acute ischemic stroke from MR apparent diffusion coefficient maps. Academic Radiology. 2008;15:77–83. doi: 10.1016/j.acra.2007.07.007. [DOI] [PubMed] [Google Scholar]
- Hevia-Montiel N., Jiménez-Alaniz J.R., Medina-Bañuelos V., Yáñez-Suárez O., Rosso C., Samson Y., Baillet S. Robust nonparametric segmentation of infarct lesion from diffusion-weighted MR images. Conference Proceedings IEEE Engineering in Medicine and Biology Society. 2007;2007:2102–2105. doi: 10.1109/IEMBS.2007.4352736. [DOI] [PubMed] [Google Scholar]
- Huang S., Shen Q., Duong T.Q. Artificial neural network prediction of ischemic tissue fate in acute stroke imaging. Journal of Cerebral Blood Flow and Metabolism. 2010;30:1661–1670. doi: 10.1038/jcbfm.2010.56. [DOI] [PMC free article] [PubMed] [Google Scholar]
- Jacobs M.A., Knight R.A., Soltanian-Zadeh H., Zheng Z.G., Goussev A.V., Peck D.J., Windham J.P., Chopp M. Unsupervised segmentation of multiparameter MRI in experimental cerebral ischemia with comparison to T2, diffusion, and ADC MRI parameters and histopathological validation. Journal of Magnetic Resonance Imaging. 2000;11:425–437. doi: 10.1002/(sici)1522-2586(200004)11:4<425::aid-jmri11>3.0.co;2-0. [DOI] [PubMed] [Google Scholar]
- Jacobs M.A., Zhang Z.G., Knight R.A., Soltanian-Zadeh H., Goussev A.V., Peck D.J., Chopp M. A model for multiparametric MRI tissue characterization in experimental cerebral ischemia with histological validation in rat: part 1. Stroke. 2001;32:943–949. doi: 10.1161/01.str.32.4.943. [DOI] [PubMed] [Google Scholar]
- Jacobs M.A., Mitsias P., Soltanian-Zadeh H., Santhakumar S., Ghanei A., Hammond R., Peck D.J., Chopp M., Patel S. Multiparametric MRI tissue characterization in clinical stroke with correlation to clinical outcome: part 2. Stroke. 2001;32:950–957. doi: 10.1161/01.str.32.4.950. [DOI] [PubMed] [Google Scholar]
- James J.R., Yoder K.K., Osuntokun O., Kalnin A., Bruno A., Morris E.D. A supervised method for calculating perfusion/diffusion mismatch volume in acute ischemic stroke. Computers in Biology and Medicine. 2006;36:1268–1287. doi: 10.1016/j.compbiomed.2005.05.007. [DOI] [PubMed] [Google Scholar]
- Józwiak R., Ostrek A.P. Conceptual improvements in computer-aided diagnosis of acute stroke. Journal of Medical Informatics & Technologies Selected full texts. 2011;17:191–199. [Google Scholar]
- Kabir Y., Dojat M., Scherrer B., Forbes F., Garbay C. Multimodal MRI segmentation of ischemic stroke lesions. Conference Proceedings IEEE Engineering in Medicine and Biology Society. 2007;2007:1595–1598. doi: 10.1109/IEMBS.2007.4352610. [DOI] [PMC free article] [PubMed] [Google Scholar]
- Kalafut M.A., Schriger D.L., Saver J.L., Starkman S. Detection of early CT signs of > 1/3 middle cerebral artery infarctions: interrater reliability and sensitivity of CT interpretation by physicians involved in acute stroke care. Stroke. 2000;31:1667–1671. doi: 10.1161/01.str.31.7.1667. [DOI] [PubMed] [Google Scholar]
- Kane I., Carpenter T., Chappell F., Rivers C., Armitage P., Sandercock P., Wardlaw J. Comparison of 10 different magnetic resonance perfusion imaging processing methods in acute ischemic stroke: effect on lesion size, proportion of patients with diffusion/perfusion mismatch, clinical scores, and radiologic outcomes. Stroke. 2007;38:3158–3164. doi: 10.1161/STROKEAHA.107.483842. [DOI] [PubMed] [Google Scholar]
- Le Bihan D., Breton E., Lallemand D., Grenier P., Cabanis E., Laval-Jeantet M. MR imaging of intravoxel incoherent motions: application to diffusion and perfusion in neurologic disorders. Radiology. 1986;161:401–407. doi: 10.1148/radiology.161.2.3763909. [DOI] [PubMed] [Google Scholar]
- Lelekov-Boissard T., Chapuisat G., Boissel J.-P., Grenier E., Dronne M.-A. Exploration of beneficial and deleterious effects of inflammation in stroke: dynamics of inflammation cells. Philosophical Transactions. Series A, Mathematical, Physical, and Engineering Sciences. 2009;367:4699–4716. doi: 10.1098/rsta.2009.0184. [DOI] [PubMed] [Google Scholar]
- Li W., Tian J., Li E., Dai J. Robust unsupervised segmentation of infarct lesion from diffusion tensor MR images using multiscale statistical classification and partial volume voxel reclassification. NeuroImage. 2004;23:1507–1518. doi: 10.1016/j.neuroimage.2004.08.009. [DOI] [PubMed] [Google Scholar]
- Li M., Ai L., He H., Zheng Z., Lv B., Li W., Yi J. Proceedings of SPIE. 2009. Segmentation of infarct in acute ischemic stroke from MR apparent diffusion coefficient and trace-weighted images. [Google Scholar]
- Ma H.K., Zavala J.A., Churilov L., Ly J., Wright P.M., Phan T.G., Arakawa S., Davis S.M., Donnan G.A. The hidden mismatch: an explanation for infarct growth without perfusion-weighted imaging/diffusion-weighted imaging mismatch in patients with acute ischemic stroke. Stroke. 2011;42:662–668. doi: 10.1161/STROKEAHA.110.593236. [DOI] [PubMed] [Google Scholar]
- Majno G., Ames A., Chiang J., Wright R. No reflow after cerebral ischemia. Lancet. 1967;290:569–570. [Google Scholar]
- Maldjian J.A., Chalela J., Kasner S.E., Liebeskind D., Detre J.A. Automated CT segmentation and analysis for acute middle cerebral artery stroke. AJNR. American Journal of Neuroradiology. 2001;22:1050–1055. [PMC free article] [PubMed] [Google Scholar]
- Martel A., Allder S., Delay G., Morgan P., Moody A. Medical Image Computing and Computer-Assisted Intervention–MICCAI'99. Springer. 1999. Measurement of infarct volume in stroke patients using adaptive segmentation of diffusion weighted MR images. pp. 22–31. [Google Scholar]
- Matesin M., Loncaric S., Petravic D. Proceedings of the 2nd International Symposium on. IEEE. 2001. A rule-based approach to stroke lesion analysis from CT brain images. Image and Signal Processing and Analysis, 2001. ISPA 2001. pp. 219–223. [Google Scholar]
- Meilunas M., Usinskas A., Kirvaitis R., Dobrovolskis R. Automatic contouring of segmented human brain ischemic stroke region on CT images. Mathematical Modelling and Analysis. 2003;8:43–50. [Google Scholar]
- Moseley M., Kucharczyk J., Mintorovitch J., Cohen Y., Kurhanewicz J., Derugin N., Asgari H., Norman D. Diffusion-weighted MR imaging of acute stroke: correlation with T2-weighted and magnetic susceptibility-enhanced MR imaging in cats. American Journal of Neuroradiology. 1990;11:423–429. [PMC free article] [PubMed] [Google Scholar]
- Muir K.W., Baird-Gunning J., Walker L., Baird T., McCormick M., Coutts S.B. Can the ischemic penumbra be identified on noncontrast CT of acute stroke? Stroke. 2007;38:2485–2490. doi: 10.1161/STROKEAHA.107.484592. [DOI] [PubMed] [Google Scholar]
- Murray J. Mathematical Biology, Volume 2. Springer; 2002. [Google Scholar]
- Na D.G., Thijs V.N., Albers G.W., Moseley M.E., Marks M.P. Diffusion-weighted MR imaging in acute ischemia: value of apparent diffusion coefficient and signal intensity thresholds in predicting tissue at risk and final infarct size. AJNR. American Journal of Neuroradiology. 2004;25:1331–1336. [PMC free article] [PubMed] [Google Scholar]
- Nagakane Y., Christensen S., Brekenfeld C., Ma H., Churilov L., Parsons M.W., Levi C.R., Butcher K.S., Peeters A., Barber P.A., Bladin C.F., De Silva D.A., Fink J., Kimber T.E., Schultz D.W., Muir K.W., Tress B.M., Desmond P.M., Davis S.M., Donnan G.A., EPITHET Investigators EPITHET: positive result after reanalysis using baseline diffusion-weighted imaging/perfusion-weighted imaging co-registration. Stroke. 2011;42:59–64. doi: 10.1161/STROKEAHA.110.580464. [DOI] [PubMed] [Google Scholar]
- Nguyen V., Pien H., Menenzes N., Lopez C., Melinosky C., Wu O., Sorensen A., Cooperman G., Ay H., Koroshetz W. Stroke tissue outcome prediction using a spatially-correlated model. Program and Proceedings of PPIC. 2008;8:238–241. [Google Scholar]
- O'Brien P., Sellar R.J., Wardlaw J.M. Fogging on T2-weighted MR after acute ischaemic stroke: how often might this occur and what are the implications? Neuroradiology. 2004;46:635–641. doi: 10.1007/s00234-004-1230-2. [DOI] [PubMed] [Google Scholar]
- Olivot M.V.S.M.L.R.M., Mlynash J.M., Albers G. Optimal Tmax threshold for predicting penumbral tissue in acute stroke. Stroke. 2009;40:469–475. doi: 10.1161/STROKEAHA.108.526954. [DOI] [PMC free article] [PubMed] [Google Scholar]
- Oppenheim C., Grandin Y., Samson C., Smith A., Duprez T., Marsault C., Cosnard G. Is there an apparent diffusion coefficient threshold in predicting tissue viability in hyperacute stroke? Stroke. 2001;32:2486–2491. doi: 10.1161/hs1101.098331. [DOI] [PubMed] [Google Scholar]
- Petrella J.R., Provenzale J.M. MR perfusion imaging of the brain: techniques and applications. AJR. American Journal of Roentgenology. 2000;175:207–219. doi: 10.2214/ajr.175.1.1750207. [DOI] [PubMed] [Google Scholar]
- Pham D., Xu C., Prince J. Current methods in medical image segmentation 1. Annual Review of Biomedical Engineering. 2000;2:315–337. doi: 10.1146/annurev.bioeng.2.1.315. [DOI] [PubMed] [Google Scholar]
- Phan T., Donnan G., Srikanth V., Chen J., Reutens D. Heterogeneity in infarct patterns and clinical outcomes following internal carotid artery occlusion. Archives of Neurology. 2009;66:1523. doi: 10.1001/archneurol.2009.259. [DOI] [PubMed] [Google Scholar]
- Prakash K.N. Bhanu, Gupta V., Bilello M., Beauchamp N.J., Nowinski W.L. Identification, segmentation, and image property study of acute infarcts in diffusion-weighted images by using a probabilistic neural network and adaptive Gaussian mixture model. Academic Radiology. 2006;13:1474–1484. doi: 10.1016/j.acra.2006.09.045. [DOI] [PubMed] [Google Scholar]
- Rha J.-H., Saver J.L. The impact of recanalization on ischemic stroke outcome: a meta-analysis. Stroke. 2007;38:967–973. doi: 10.1161/01.STR.0000258112.14918.24. [DOI] [PubMed] [Google Scholar]
- Rivers C.S., Wardlaw J.M., Armitage P.A., Bastin M.E., Carpenter T.K., Cvoro V., Hand P.J., Dennis M.S. Do acute diffusion- and perfusion-weighted MRI lesions identify final infarct volume in ischemic stroke? Stroke. 2006;37:98–104. doi: 10.1161/01.STR.0000195197.66606.bb. [DOI] [PubMed] [Google Scholar]
- Rivers C.S., Wardlaw J.M., Armitage P.A., Bastin M.E., Hand P.J., Dennis M.S. Acute ischemic stroke lesion measurement on diffusion-weighted imaging—important considerations in designing acute stroke trials with magnetic resonance imaging. Journal of Stroke and Cerebrovascular Diseases. 2007;16:64–70. doi: 10.1016/j.jstrokecerebrovasdis.2006.11.003. [DOI] [PubMed] [Google Scholar]
- Rose S.E., Janke A.L., Griffin M., Strudwick M.W., Finnigan S., Semple J., Chalk J.B. Improving the prediction of final infarct size in acute stroke with bolus delay-corrected perfusion MRI measures. Journal of Magnetic Resonance Imaging. 2004;20:941–947. doi: 10.1002/jmri.20216. [DOI] [PubMed] [Google Scholar]
- Rose S.E., Chalk J.B., Griffin M.P., Janke A.L., Chen F., Mclachan G.J., Peel D., Zelaya F.O., Markus H.S., Jones D.K. MRI based diffusion and perfusion predictive model to estimate stroke evolution. Magnetic Resonance Imaging. 2001;19(8):1043–1053. doi: 10.1016/s0730-725x(01)00435-0. [DOI] [PubMed] [Google Scholar]
- Rosso C., Hevia-Montiel N., Deltour S., Bardinet E., Dormont D., Crozier S., Baillet S., Samson Y. Prediction of infarct growth based on apparent diffusion coefficients: penumbral assessment without intravenous contrast material. Radiology. 2009;250:184–192. doi: 10.1148/radiol.2493080107. [DOI] [PubMed] [Google Scholar]
- Scalzo F., Hao Q., Hu J.A. Regional prediction of tissue fate in acute ischemic stroke. Annals of Biomedical Engineering. 2012:1–11. doi: 10.1007/s10439-012-0591-7. [DOI] [PMC free article] [PubMed] [Google Scholar]
- Seo H., Milanfar P. IEEE International Symposium on. IEEE. 2009. A non-parametric approach to automatic change detection in MRI images of the brain. Biomedical Imaging: From Nano to Macro, 2009. ISBI'09. pp. 245–248. [Google Scholar]
- Shen Q., Duong T.Q. Quantitative prediction of ischemic stroke tissue fate. NMR in Biomedicine. 2008;21:839–848. doi: 10.1002/nbm.1264. [DOI] [PMC free article] [PubMed] [Google Scholar]
- Shen Q., Ren H., Fisher M., Bouley J., Duong T.Q. Dynamic tracking of acute ischemic tissue fates using improved unsupervised ISODATA analysis of high-resolution quantitative perfusion and diffusion data. Journal of Cerebral Blood Flow and Metabolism. 2004;24:887–897. doi: 10.1097/01.WCB.0000124321.60992.87. [DOI] [PMC free article] [PubMed] [Google Scholar]
- Shen Q., Ren H., Fisher M., Duong T.Q. Statistical prediction of tissue fate in acute ischemic brain injury. Journal of Cerebral Blood Flow and Metabolism. 2005;25:1336–1345. doi: 10.1038/sj.jcbfm.9600126. [DOI] [PMC free article] [PubMed] [Google Scholar]
- Shih L.C., Saver J.L., Alger J.R., Starkman S., Leary M.C., Vinuela F., Duckwiler G., Gobin Y.P., Jahan R., Villablanca J.P., Vespa P.M., Kidwell C.S. Perfusion-weighted magnetic resonance imaging thresholds identifying core, irreversibly infarcted tissue. Stroke. 2003;34:1425–1430. doi: 10.1161/01.STR.0000072998.70087.E9. [DOI] [PubMed] [Google Scholar]
- Soares B.P., Chien J.D., Wintermark M. MR and CT monitoring of recanalization, reperfusion, and penumbra salvage: everything that recanalizes does not necessarily reperfuse! Stroke. 2009;40:S24–S27. doi: 10.1161/STROKEAHA.108.526814. [DOI] [PubMed] [Google Scholar]
- Soltanian-Zadeh H., Pasnoor M., Hammoud R., Jacobs M.A., Patel S.C., Mitsias P.D., Knight R.A., Zheng Z.G., Lu M., Chopp M. MRI tissue characterization of experimental cerebral ischemia in rat. Journal of Magnetic Resonance Imaging. 2003;17:398–409. doi: 10.1002/jmri.10256. [DOI] [PubMed] [Google Scholar]
- Soltanian-Zadeh H., Bagher-Ebadian H., Ewing J.R., Mitsias P.D., Kapke A., Lu M., Jiang Q., Patel S.C., Chopp M. Multiparametric iterative self-organizing data analysis of ischemic lesions using pre- or post-Gd T1 MRI. Cerebrovascular Diseases. 2007;23:91–102. doi: 10.1159/000097044. [DOI] [PubMed] [Google Scholar]
- Sorensen A.G., Buonanno F.S., Gonzalez R.G., Schwamm L.H., Lev M.H., Huang-Hellinger F.R., Reese T.G., Weisskoff R.M., Davis T.L., Suwanwela N., Can U., Moreira J.A., Copen W.A., Look R.B., Finklestein S.P., Rosen B.R., Koroshetz W.J. Hyperacute stroke: evaluation with combined multisection diffusion-weighted and hemodynamically weighted echo-planar MR imaging. Radiology. 1996;199:391–401. doi: 10.1148/radiology.199.2.8668784. [DOI] [PubMed] [Google Scholar]
- Stein B., Lisin D., Horowitz J., Riseman E., Whitten G. Medical Image Computing and Computer-Assisted Intervention–MICCAI 2001. Springer. 2001. Statistical and deformable model approaches to the segmentation of MR imagery and volume estimation of stroke lesions. pp. 829–836. [Google Scholar]
- Straka M., Albers G., Bammer R. Real-time diffusion–perfusion mismatch analysis in acute stroke. Journal of Magnetic Resonance Imaging. 2010;32:1024–1037. doi: 10.1002/jmri.22338. [DOI] [PMC free article] [PubMed] [Google Scholar]
- Studholme C., Drapaca C., Iordanova B., Cardenas V. Deformation-based mapping of volume change from serial brain MRI in the presence of local tissue contrast change. IEEE Transactions on Medical Imaging. 2006;25:626–639. doi: 10.1109/TMI.2006.872745. [DOI] [PubMed] [Google Scholar]
- Sudlow C.L., Warlow C.P. Comparable studies of the incidence of stroke and its pathological types: results from an international collaboration. international stroke incidence collaboration. Stroke. 1997;28:491–499. doi: 10.1161/01.str.28.3.491. [DOI] [PubMed] [Google Scholar]
- Symon L. The relationship between CBF, evoked potentials and the clinical features in cerebral ischaemia. Acta Neurologica Scandinavica. Supplementum. 1980;78:175–190. [PubMed] [Google Scholar]
- Takahashi N., Lee Y., Tsai D.-Y., Ishii K., Kamio S. Improvement in visibility and detectability of early sign of acute stroke in nonenhanced CT images by using an adaptive partial smoothing filter. Nihon Hoshasen Gijutsu Gakkai Zasshi. 2005;61:1531–1541. doi: 10.6009/jjrt.kj00004010674. [DOI] [PubMed] [Google Scholar]
- Tong D.C., Yenari M.A., Albers G.W., O'Brien M., Marks M.P., Moseley M.E. Correlation of perfusion- and diffusion-weighted MRI with NIHSS score in acute (< 6.5 hour) ischemic stroke. Neurology. 1998;50:864–870. doi: 10.1212/wnl.50.4.864. [DOI] [PubMed] [Google Scholar]
- Tsai D.-Y., Lee Y., Takahashi N. An adaptive enhancement algorithm for CT brain images. Conf Proc IEEE Eng Med Biol Soc. 2005;4:3398–3401. doi: 10.1109/IEMBS.2005.1617207. [DOI] [PubMed] [Google Scholar]
- Usinskas E., Pranckeviciene A., Wittenberg T., Hastreiter P., Tomandl B. Automatic ischemic stroke segmentation using various techniques, neural network and soft computing. Springer. 2002:498–503. [Google Scholar]
- Usinskas A., Dobrovolskis R., Tomandl B. Ischemic stroke segmentation on ct images using joint features. Informatica. 2004;15:283–290. [Google Scholar]
- Warach S., Li W., Ronthal M., Edelman R.R. Acute cerebral ischemia: evaluation with dynamic contrast-enhanced MR imaging and MR angiography. Radiology. 1992;182:41–47. doi: 10.1148/radiology.182.1.1727307. [DOI] [PubMed] [Google Scholar]
- Wardlaw J.M. Neuroimaging in acute ischaemic stroke: insights into unanswered questions of pathophysiology. Journal of Internal Medicine. 2010;267:172–190. doi: 10.1111/j.1365-2796.2009.02200.x. [DOI] [PubMed] [Google Scholar]
- Wardlaw J.M., Lewis S.C., Dennis M.S., Counsell C., McDowall M. Is visible infarction on computed tomography associated with an adverse prognosis in acute ischemic stroke? Stroke. 1998;29:1315–1319. doi: 10.1161/01.str.29.7.1315. [DOI] [PubMed] [Google Scholar]
- Wardlaw J.M., Farrall A.J., Perry D., von Kummer R., Mielke O., Moulin T., Ciccone A., Hill M., Acute Cerebral CT Evaluation of Stroke Study (ACCESS) Study Group Factors influencing the detection of early CT signs of cerebral ischemia: an internet-based, international multiobserver study. Stroke. 2007;38:1250–1256. doi: 10.1161/01.STR.0000259715.53166.25. [DOI] [PubMed] [Google Scholar]
- Weinman J., Bissias G., Horowitz J., Riseman E., Hanson A. Nonlinear diffusion scale-space and fast marching level sets for segmentation of MR imagery and volume estimation of stroke lesions. Medical Image Computing and Computer-Assisted Intervention—MICCAI. 2003;2003:496–504. [Google Scholar]
- Wu O., Koroshetz W.J., Ostergaard L., Buonanno F.S., Copen W.A., Gonzalez R.G., Rordorf G., Rosen B.R., Schwamm L.H., Weisskoff R.M., Sorensen A.G. Predicting tissue outcome in acute human cerebral ischemia using combined diffusion- and perfusion-weighted MR imaging. Stroke. 2001;32:933–942. doi: 10.1161/01.str.32.4.933. [DOI] [PubMed] [Google Scholar]
- Wu O., Sumii T., Asahi M., Sasamata M., Ostergaard L., Rosen B.R., Lo E.H., Dijkhuizen R.M. Infarct prediction and treatment assessment with MRI-based algorithms in experimental stroke models. Journal of Cerebral Blood Flow and Metabolism. 2007;27:196–204. doi: 10.1038/sj.jcbfm.9600328. [DOI] [PubMed] [Google Scholar]
- Yuh W.T., Crain M.R., Loes D.J., Greene G.M., Ryals T.J., Sato Y. MR imaging of cerebral ischemia: findings in the first 24 hours. AJNR. American Journal of Neuroradiology. 1991;12:621–629. [PMC free article] [PubMed] [Google Scholar]
- Zanette E.M., Fieschi C., Bozzao L., Roberti C., Toni D., Argentino C., Lenzi G.L. Comparison of cerebral angiography and transcranial Doppler sonography in acute stroke. Stroke. 1989;20:899–903. doi: 10.1161/01.str.20.7.899. [DOI] [PubMed] [Google Scholar]