Ubiquitously transcribed genes use alternative polyadenylation to achieve tissue-specific expression (original) (raw)
A majority of human genes use alternative cleavage and polyadenylation to generate mRNA transcripts that differ in the lengths of their 3′ untranslated regions (UTRs). Here, Lianoglou et al. develop a sequencing method, 3′-seq, to measure 3′ UTR isoform expression across diverse human tissues and isogenic transformation systems. The analyses reveal that during transformation and differentiation, single-UTR genes typically change their mRNA abundance levels, while multi-UTR genes change 3′ UTR isoform ratios to achieve tissue specificity. This study offers surprising new insights into how cell type-specific gene expression is achieved.
Keywords: alternative polyadenylation, tissue-specific regulation of gene expression, transcriptome analysis, 3′ UTR isoform, gene regulation, computational biology
Abstract
More than half of human genes use alternative cleavage and polyadenylation (ApA) to generate mRNA transcripts that differ in the lengths of their 3′ untranslated regions (UTRs), thus altering the post-transcriptional fate of the message and likely the protein output. The extent of 3′ UTR variation across tissues and the functional role of ApA remain poorly understood. We developed a sequencing method called 3′-seq to quantitatively map the 3′ ends of the transcriptome of diverse human tissues and isogenic transformation systems. We found that cell type-specific gene expression is accomplished by two complementary programs. Tissue-restricted genes tend to have single 3′ UTRs, whereas a majority of ubiquitously transcribed genes generate multiple 3′ UTRs. During transformation and differentiation, single-UTR genes change their mRNA abundance levels, while multi-UTR genes mostly change 3′ UTR isoform ratios to achieve tissue specificity. However, both regulation programs target genes that function in the same pathways and processes that characterize the new cell type. Instead of finding global shifts in 3′ UTR length during transformation and differentiation, we identify tissue-specific groups of multi-UTR genes that change their 3′ UTR ratios; these changes in 3′ UTR length are largely independent from changes in mRNA abundance. Finally, tissue-specific usage of ApA sites appears to be a mechanism for changing the landscape targetable by ubiquitously expressed microRNAs.
Protein expression is determined by the rate of transcription and by post-transcriptional processes that lead to changes in mRNA transport, stability, and translational efficiency. These post-transcriptional processes are mediated by RNA modifications, secondary structure, microRNAs (miRNAs), and RNA-binding proteins that recognize regulatory elements located in the 3′ untranslated regions (UTRs) of transcripts (Bartel 2004; Sonenberg and Hinnebusch 2009; Darnell 2010; Ascano et al. 2012; Meyer et al. 2012; Vogel and Marcotte 2012). It was recently discovered that a large fraction of human genes generate alternative mRNA isoforms that differ in the length of their 3′ UTRs due to the recognition of alternative cleavage and polyadenylation (ApA) sites (Tian et al. 2005; Flavell et al. 2008; Sandberg et al. 2008; Ji et al. 2009; Mayr and Bartel 2009). As a consequence, changes in the relative abundance of 3′ UTR isoforms determine whether the regulatory elements that enable post-transcriptional regulation are largely present or absent from the mRNA. It has been shown for specific genes that the shorter mRNA isoforms escape regulation by miRNAs and other RNA-binding proteins and can produce as much as 40-fold more protein (Mayr and Bartel 2009). There are reports in the literature that show that the longer mRNA isoforms can produce more protein or that both mRNA isoforms produce comparable amounts of protein (Ranganathan et al. 1995; An et al. 2008). However, in the majority of tested genes, the shorter mRNA isoforms produce more protein (Wiestner et al. 2007; Sandberg et al. 2008; Mayr and Bartel 2009; Singh et al. 2009; Akman et al. 2012; Martin et al. 2012; Bava et al. 2013). Thus, induction of widespread changes in the ratio of ApA isoform abundance is a gene regulatory process that can have extensive consequences for gene expression, as it sets the stage for post-transcriptional regulation.
The first transcriptome-wide studies on ApA reported that proliferation or oncogenic transformation was associated with a shift toward generation of shorter mRNA isoforms, whereas differentiation seemed to correlate with lengthening of 3′ UTRs (Flavell et al. 2008; Sandberg et al. 2008; Ji et al. 2009; Mayr and Bartel 2009; Elkon et al. 2012, 2013; Lin et al. 2012; Tian and Manley 2013). Furthermore, specific tissues appeared to produce overall shorter or longer 3′ UTRs (Zhang et al. 2005; Ramskold et al. 2009; Shepard et al. 2011; Li et al. 2012; Smibert et al. 2012; Ulitsky et al. 2012). Recently, several 3′ end sequencing methods were published. Whereas Derti et al. (2012) showed that their protocol is quantitative with respect to mRNA abundance levels, none of the protocols was established to be quantitative with respect to 3′ UTR isoform expression (Fu et al. 2011; Jan et al. 2011; Derti et al. 2012; Elkon et al. 2012; Lin et al. 2012; Hoque et al. 2013). In the present study, we performed a quantitative and statistically rigorous analysis of alternative 3′ UTR isoform expression across a large number of human tissues as well as in isogenic cell transformation experiments and uncovered a far more complex picture of ApA than in these early reports.
Using 3′-seq, we built an atlas of human polyadenylation (pA) cleavage events that contains a large majority of functional pA sites. We extensively validated our sequencing results and demonstrate that the number of isoforms detected as well as the relative abundance ratio of alternative 3′ UTR isoforms is consistent with results obtained by Northern blots. We then applied a new computational approach to identify significant tissue- and condition-specific differences in 3′ UTR isoform levels that takes into account changes in mRNA level and the variation between biological replicates. This comprehensive analysis revealed that the generation of alternative 3′ UTR isoforms is a characteristic of ubiquitously transcribed genes that are involved in diverse gene regulatory processes and are distinct from the classical housekeeping genes that generate single UTRs. However, like housekeeping genes, this new class of ubiquitously transcribed genes is less stringently regulated at the transcriptional level. Instead, ubiquitously transcribed multi-UTR genes use differential abundance of their 3′ UTR isoforms to achieve tissue- and context-dependent expression. They also have permissive proximal pA sites that enable readthrough transcription to allow inclusion of 3′ UTR regulatory elements. A large fraction of proximal pA sites show a wide range of usage across tissues, suggesting that they are highly regulated to either allow or prevent post-transcriptional regulation. We also demonstrate that differentiation or transformation leads to changes in mRNA abundance of single-UTR genes as well as alterations in 3′ UTR isoform levels of multi-UTR genes. These changes are specific to the conditions analyzed, and, remarkably, both groups of genes are involved in the pathways and processes characteristic of the new cell state, even though multi-UTR genes largely do not alter mRNA levels. If alternative 3′ UTRs indeed confer differential protein expression, alterations in mRNA abundance and changes in 3′ UTR isoform ratios cooperate in accomplishing the activated expression program. Although we have been able to measure transcriptome-wide mRNA expression levels for more than a decade, deconvolving mRNA length from abundance has only recently been made possible through directed sequencing methods like 3′-seq. Our analysis identifies a key component of gene expression programs—the global changes in 3′ UTR isoform expression—that has been largely invisible until now.
Results
The 3′ cleavage events of genes are the same across tissues
We hypothesized that the differential usage of 3′ UTR isoforms is a coordinated gene expression program to regulate protein levels. To uncover the extent of this potential regulatory program, we set out to quantitatively map the 3′ ends of mRNAs in diverse human tissues and cell lines at single-nucleotide resolution. To this end, we developed a next-generation sequencing protocol called 3′-seq (Fig. 1A) and applied it to 14 human samples, including testis, ovary, brain, breast, skeletal muscle, naïve B cells, embryonic stem (ES) cells, and human cell lines (NTERA2, HeLa, MCF7, MCF10A, and HEK293) (Supplemental Table 1). In total, we obtained 98 million reads uniquely mapping to the genome, with the vast majority mapping to known 3′ UTRs (Supplemental Fig. 1A). We implemented a computational pipeline (see the Supplemental Material) to identify peaks representing 3′ ends and removed peak events due to internal priming (Supplemental Fig. 1B). We focused our analysis on mRNA 3′ ends that mapped to annotated 3′ UTRs or were located within 5 kb downstream from RefSeq gene annotations and found 2187 genes to have longer 3′ UTRs (>20 nucleotides [nt]; median, 1870 nt) than annotated. For seven of these genes, we tested by Northern blot analysis whether the 3′ ends were connected to the upstream genes and confirmed them for all seven genes (Supplemental Fig. 1C; data not shown). This shows that our data can be used to reannotate human 3′ UTRs. We used the 3′ UTR lengths from our atlas for downstream analyses.
Figure 1.
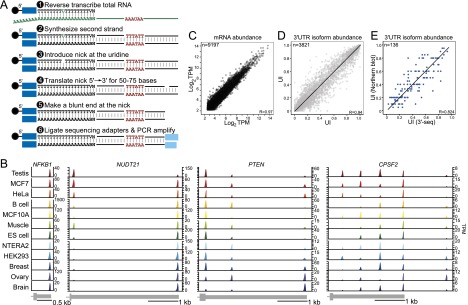
3′-Seq generates a quantitative transcriptome-wide atlas of pA cleavage events. (A) 3′-Seq protocol. Total RNA was reverse-transcribed with an oligo(dT) primer extended at the 5′ end by a sequencing adapter bound to magnetic beads. The oligo(dT) primer contained a uridine. After second strand synthesis, a nick was introduced at the uridine, and nick translation was used to shift the nick ∼50–75 nt away from the 3′ end. At the new position of the nick, a blunt end was created, and the second sequencing adapter was ligated. After ∼10 cycles of PCR and gel purification, the library was sequenced. (B) Atlas of pA cleavage events. mRNA transcript abundance across human tissues and cell lines is shown; for example, genes with one, two, three, or five 3′ UTR isoforms. The peaks report the abundance of each isoform in transcripts per million (TPM). The gene model is drawn to scale and shows the terminal exon. (C) 3′-Seq is reproducible at the level of mRNA abundance. mRNA levels of biological replicate samples are shown in TPM. TPM is calculated using all reads that map to the 3′ UTR of a given gene. (D) 3′-Seq is reproducible at the level of 3′ UTR isoform abundance. The UTR index (UI) of replicate samples is shown. The UI reflects the fraction of reads mapping to a given pA site out of all of the reads mapping to the 3′ UTR. (E) Correlation of the UI as measured by 3′-seq and Northern blot analyses of 136 genes.
To identify the human genes that generate single or multiple 3′ UTRs, we generated an atlas of cleavage events (80,371 3′ ends for 13,718 genes) from all of our samples. In previous reports, the number of genes considered to have multiple 3′ UTRs ranged from 30% to 79% (Derti et al. 2012; Lin et al. 2012; Hoque et al. 2013; Tian and Manley 2013). The fraction of genes with multiple 3′ UTRs highly depends on the criteria used to count read evidence as an ApA event. To empirically determine the appropriate stringency for filtering out lowly expressed events, we applied different filtering thresholds to determine the number of 3′ UTR isoforms of each gene (Supplemental Fig. 1D; Supplemental Table 2) and compared them with the number of isoforms obtained by Northern blot analyses for 16 randomly chosen genes (seven single-UTR and nine multi-UTR genes) (Supplemental Fig. 1E). Although the detection threshold of the Northern blots can vary, we generally detect isoforms expressed at 3 TPM (transcripts per million). If we apply no TPM filter and count every peak obtained by 3′-seq as a 3′ UTR isoform, we regard 10,828 out of 13,718 genes to have multiple 3′ UTRs (79%), which is consistent with previous reports (Derti et al. 2012; Hoque et al. 2013). However, all seven genes that are defined to have single 3′ UTRs as detected by Northern blot analysis were misclassified and would be considered multi-UTR genes. When we require peaks to be present at a minimum expression level of 3 TPM with >10% of 3′ UTR reads mapping to a given ApA site in at least a single sample, we classify 7020 out of 13,718 genes as multi-UTR genes (51%). With this filtering threshold, all but one gene from the Northern blot analysis are classified correctly (Supplemental Fig. 1D,E; Supplemental Table 2).
Visualization of 3′ UTR isoform expression across all samples shows that the locations of functional pA sites are shared across all samples, even for events expressed at very low levels (Supplemental Fig. 1D). To identify truly tissue-specific events, we required the event to be expressed at a minimum of 10% of 3′ UTR reads without any reads mapping at this position in other samples. Only 119 out of 27,932 events are flagged as truly tissue-specific events by this criterion (0.4%). Even if we allow up to three reads at the position in other samples, we found only 3.1% of events to be expressed only in a single tissue. This demonstrates that truly tissue-specific events are rare. Thus, our atlas of cleavage events revealed that the number of 3′ UTR isoforms generated by a gene and the locations of the corresponding cleavage events are largely tissue-independent. However, the relative expression of the 3′ UTR isoforms varied extensively across tissues (Fig. 1B; Supplemental Fig. 1D–F).
3′-Seq generates a quantitative transcriptome-wide atlas of ApA events
Our major goal was to study differences in 3′ UTR isoform expression across tissues and in isogenic cell transformation experiments. For our statistical analyses, we focused on robustly transcribed protein-coding genes (TPM > 5.5, when considering all of the reads mapping to their 3′ UTRs) and analyzed events that comprised at least 20% of all of the reads mapping to the 3′ UTR in a single tissue. However, we also kept events if they were present at lower levels in the majority of tissues (≥75% of samples) analyzed. When comparing these results with the results obtained by Northern blots for 136 genes, we confirmed the number and locations of 3′ cleavage events in 94% of cases. To validate that 3′-seq is quantitative at the level of mRNA abundance, we correlated our data with published RNA sequencing (RNA-seq) data (Pearson's correlation coefficient, R = 0.68–0.83) (Supplemental Fig. 1G). Using biological duplicates, we showed that our method was highly reproducible at the level of mRNA abundance (Pearson's correlation coefficient, R = 0.97) (Fig. 1C; Supplemental Fig. 1H). We observed a slightly higher variability at the level of individual 3′ UTR isoform abundance, which we also detected in replicates using Northern blots (R = 0.94) (Fig. 1D; Supplemental Fig. 1H). This indicates that the greater variability does not originate from our sequencing protocol. To validate that 3′-seq is quantitative at the level of isoform abundance, we compared the 3′ UTR isoform ratios of >100 genes obtained by both 3′-seq and Northern blot analysis and found that the isoform expression ratios correlated quantitatively (R = 0.82) (Fig. 1E).
To assess the significant differences in 3′ UTR isoform levels between samples, we used a generalized linear model (GLM) for read counts mapping to cleavage events. The model adjusts for differences in library size and allows us to test for significant differences in isoform abundance while taking into account differential mRNA levels and the variation in isoform levels between biological replicates. To do so, we modified a method (see the Supplemental Material) that was initially developed to identify differential exon inclusion due to alternative splicing from RNA-seq data (Anders et al. 2012). To visualize the 3′ UTR isoform expression pattern of genes, we calculated the fraction of reads mapping to a given pA site out of all of the reads mapping to the 3′ UTR. This statistic, which we call the “UTR index” (UI), reflects the relative abundance of a given 3′ UTR isoform.
The genes that change their 3′ UTR isoform ratios during transformation are specific to the pathways activated
Our goal was to study differences in 3′ UTR isoform expression across tissues and cell types. We used two isogenic cell transformation experiments to examine differences between cell types that are each induced by a single factor. We investigated the changes in 3′ UTR isoform expression due to oncogenic transformation by expressing constitutively active HRAS (G12V) in the breast epithelial cell line MCF10A. To compare the 3′ UTR isoform expression changes due to a transformation event that does not lead to cancer, we infected naïve B cells with Epstein-Barr virus (EBV), which leads to the generation of immortalized B lymphoblastoid cells (B-LCLs). Naïve B cells do not proliferate, whereas B-LCLs show an activated and highly proliferative phenotype (Carter et al. 2002). Comparing B cells before and after EBV transformation showed that this transition is associated with widespread changes in 3′ UTR isoform levels (n = 374, FDR [false discovery rate]-adjusted P < 0.1) (Fig. 2A; see the Supplemental Material), with 55% of the genes affected shifting toward expression of shorter 3′ UTRs and 45% shifting toward expression of longer 3′ UTRs. HRAS expression in MCF10A cells leads to activation of the Ras pathway and to oncogenic transformation of these cells (Supplemental Fig. 2A,B). Expression of activated HRAS in MCF10A cells results in significant changes in the 3′ UTR expression pattern (n = 252, FDR-adjusted P < 0.1) toward shortening (64%) as well as lengthening (36%) (Fig. 2B). Interestingly, the genes that significantly changed the 3′ UTR isoform levels upon transformation by EBV for the most part did not change their 3′ UTR isoform levels upon transformation by HRAS (Fig. 2C,D) and vice versa. This suggests that the genes that significantly change their 3′ UTR isoform expression ratios are cell type- and pathway-specific.
Figure 2.

Transformation results in alterations of mRNA levels and in changes of 3′ UTR length in different groups of genes that function in the same biological processes. (A) Difference in the relative abundance of 3′ UTR isoforms of naïve B cells before and after transformation with EBV. The plot shows the difference in the UI between two samples (the UI in B-LCLs minus the UI in naïve B cells; _Y_-axis) as a function of mRNA abundance (mean log2 TPM of B-LCLs and naïve B cells; _X_-axis) for all jointly expressed multi-UTR genes. The statistically significant ApA events based on GLM analysis (FDR-adjusted P < 0.1) are shown in color. (B) Difference in the relative abundance of 3′ UTR isoforms of MCF10A cells before and after transformation with HRAS (MCF10A + HRAS, MCF10AR). The plot axes are similar to those in A. (C) Plot as in A, but the statistically significant ApA events from B, which are expressed in B cells and B-LCLs, are shown in blue. (D) Plot as in B, but the statistically significant ApA events from A, which are expressed in MCF10A and MCF10AR, are shown in blue. (E) Changes in mRNA levels versus changes in ApA isoform abundance in naïve B cells before and after EBV transformation. The plot shows the fold change in mRNA levels (_X_-axis) versus the difference in the relative abundance of 3′ UTR isoforms (_Y_-axis). Genes that significantly change their mRNA levels and genes that significantly change their 3′ UTR isoform levels are color-coded. The genes that change both mRNA levels and 3′ UTR length are depicted in black. (F) As in E but for MCF10A before and after HRAS transformation. (G, top) Venn diagram showing genes that change mRNA abundance during EBV transformation (FDR-adjusted P < 0.05). Single-UTR genes are enriched among the genes that change mRNA abundance (Fisher's exact test, P < 10−16). (Bottom) Venn diagram showing the overlap of multi-UTR genes that change their mRNA abundance and those that change their 3′ UTR isoform expression. (H) As in G but for HRAS transformation. Single-UTR genes are enriched among the genes that change mRNA abundance (Fisher's exact test, P < 10−16). (I) GO analysis for genes that change mRNA levels and genes that change 3′ UTR isoform levels in naïve B cells before and after EBV transformation. _P_-values were obtained after background correction using the union of all genes expressed in either B-LCLs or naïve B cells. The most significant GO categories are shown. All significant GO terms are listed in Supplemental Table 3. (J) As in I but for MCF10A before and after HRAS transformation. The most significant GO categories are shown. All significant GO terms are listed in Supplemental Table 4.
Changes in mRNA levels and 3′ UTR length happen in different groups of genes but function in the same biological processes
In addition to measuring 3′ UTR isoform abundance, our data allow us to determine mRNA levels by summing up all of the reads that fall into the 3′ UTR of a given gene. To identify significant changes in mRNA levels that occur during transformation, we used DESeq, a standard method to assess differential mRNA abundance (Anders and Huber 2010). Remarkably, in both isogenic transformation systems, the majority of genes that significantly changed their mRNA levels (FDR-adjusted P < 0.05) were genes with single 3′ UTRs. During EBV transformation, 831 genes significantly changed their mRNA levels, and 540 of them have single 3′ UTRs (65%), whereas during HRAS transformation, 710 genes changed their mRNA levels, with 515 of them having single 3′ UTRs (73%) (Fig. 2G,H). The enrichment of single-UTR genes in the group of genes that changed mRNA abundance levels is highly significant (Fisher's exact test, P < 10−16 in each comparison). Furthermore, the multi-UTR genes that changed their mRNA levels and the genes that changed their 3′ UTR length upon transformation showed very little overlap (Fig. 2E–H). The overlap of the two groups of genes is not higher than what would be expected by chance (HRAS transformation, χ2 = 3.2, P = 0.07; EBV transformation, χ2 = 0.2, P = 0.6), which suggests that the two processes are largely independent.
Given that the genes that change their 3′ UTR isoform ratios and the genes that change their mRNA levels are different, we wondered whether the gene products function in different processes. We performed gene ontology (GO) analysis using background correction for all of the genes expressed in the analyzed cell types. Surprisingly, both groups of genes mostly function in the same pathways and cellular processes (Fig. 2I,J; Supplemental Tables 3, 4). When comparing the functional categories of B cells before and after EBV transformation, only two GO categories were found exclusively in either group. The genes that changed their mRNA levels are involved in proliferation, whereas the genes that changed their 3′ UTR isoform ratios are enriched for factors responsible for mRNA processing and splicing. All of the other functional categories are found in both groups and consisted of factors that regulate transcription, apoptosis, ubiquitination, and protein transport. Both groups are also enriched in members of diverse signaling pathways. Pathways responsible for immune response, cytokine production, and B-cell activation—specifically B-cell receptor activation and NF-κB and MAP kinase signaling—were affected (Supplemental Table 3), as was reported previously for mRNA abundance changes (Carter et al. 2002). These functional categories reflect the highly activated and proliferative nature of B-LCL compared with naïve B cells.
Expression of active HRAS in MCF10A cells was reported to lead to phenotypic changes resembling the epithelial-to-mesenchymal transition (EMT) (Huber et al. 2004; Morel et al. 2008). EMT is associated with an increase in cellular migration and activated TGF-β signaling (Fuxe and Karlsson 2012). Indeed, genes that are characteristic of EMT, such as TGFB1 or ZEB2, were up-regulated (130-fold and sevenfold, respectively), while CDH1 was down-regulated (sevenfold) at the transcriptional level. Interestingly, the genes that changed their UTR length are enriched in genes associated with cellular migration. PAFAH1B1 or RAC1 did not change its mRNA levels after HRAS activation (P = 0.7 and P = 0.3) but showed an increase in abundance of the shorter 3′ UTR isoforms (Supplemental Fig. 2C). Thus, these genes might contribute to the phenotypic changes observed after oncogenic transformation through a change in ApA. Furthermore, changes in ApA may be necessary for oncogenic transformation. One such example is RALA, a gene that was shown to be required for Ras-driven transformation (Lim et al. 2005). The mRNA levels of RALA did not change in our system (P = 0.9), but oncogenic transformation is associated with increased abundance of the shorter 3′ UTR isoform, which is associated with an increase in RALA protein levels (Supplemental Fig. 2C,D). Besides RALA and RAC1, additional members of the Ras GTPase signaling pathway and genes that function in RNA processing and splicing change their 3′ UTR length during HRAS-mediated transformation. The enrichment of the same functional categories in the genes that change their mRNA levels and the genes that change their 3′ UTR isoform levels was not due to the few genes that changed both mRNA length and mRNA abundance. When we omitted these genes from the analysis, the majority of enriched GO categories did not change (Supplemental Tables 3, 4).
mRNA level and mRNA length provide independent information on gene expression
We extended our analysis to seven samples derived from normal tissues and examined the relationship between changes in mRNA levels and changes in 3′ UTR lengths. We focused our analysis on the multi-UTR genes that are expressed in at least six out of the seven tissues (n = 3100). To identify the genes that differ significantly in the 3′ UTR isoform expression pattern across these tissues, we applied our statistical model to all seven tissue samples (see the Supplemental Material). We found that about two-thirds (63.2%; n = 1958) of genes showed a significantly different 3′ UTR isoform expression pattern across tissues (FDR-adjusted P < 0.1). We call these genes “polyadeno-modulated” (pAM) multi-UTR genes (Fig. 3A). The genes whose ApA isoform levels do not vary significantly across different tissues we call non-pAM (NpAM) genes (FDR-adjusted _P_ > 0.1) (Fig. 3B). We visualized the UTR expression pattern by plotting the UI for each pAM gene in each tissue (Fig. 3C, middle panel). Plotting the corresponding mRNA levels in the same order (Fig. 3C, left panel) suggests that the pattern of mRNA levels and the pattern of 3′ UTR isoform levels are independent. We then tested this hypothesis and asked whether a gene that changes its mRNA abundance level across our tissues has a higher probability of also changing its 3′ UTR isoform expression pattern. We found that this is not the case because the ApA profile was similar in genes that change or do not change their mRNA levels (TPM fold change ≥ log2 2.5; Mann-Whitney test, P > 0.1 in each tissue) (Fig. 3D). We obtained the same result when we tested the probability of change in mRNA levels of pAM or NpAM genes. There was no significant difference for differential mRNA levels across the tissue samples in pAM or NpAM genes (Mann-Whitney test, P = 0.08) (Fig. 3E). Again, we observed that genes with single 3′ UTRs change their mRNA levels significantly more often than genes with multiple 3′ UTRs (Mann-Whitney test, P < 10−9) (Fig. 3E).
Figure 3.

ApA isoform levels in ubiquitously transcribed genes are tissue-specific and independent of mRNA levels. (A) An example of a pAM gene is shown (TRAPPC3). Details as in Figure 1B. (B) An example of an NpAM gene is shown (SUPT4H1). Details as in Figure 1B. (C, left panel) mRNA levels. Shown is the quantile-normalized mRNA abundance in TPM for all jointly expressed pAM genes (n = 1958). Each row corresponds to a gene, and each column corresponds to a tissue sample. mRNA levels are color-coded (see the legend), with yellow corresponding to high TPM levels and purple corresponding to low TPM levels. The ordering of the rows is described in the middle panel. (Middle panel) UI across tissues. Shown is the UI for all the genes from the left panel in the same order. The UI is color-coded (see the legend), with red corresponding to a high UI (high fraction of the short isoform) and blue corresponding to a low UI (high fraction of the long isoform). The color-coded bar to the right of the heat map indicates the tissue that shows an increased fraction of shorter or longer 3′ UTR isoforms. The color used for each tissue corresponds to the indicated tissues in the right panel. (Right panel) Significantly enriched GO terms for genes that generate a higher fraction of the shorter 3′ UTR isoforms in a specific tissue. All significant GO terms are listed in Supplemental Table 5. (D) The distribution of the UI in each tissue is independent of a change in mRNA levels across all seven tissues. A change in mRNA abundance was recorded if the range in mRNA levels across the seven tissue samples was log2TPM ≥ 2.5. Genes were split into two groups (those with a change in mRNA abundance [n = 1853–2196] and those without a change in mRNA abundance [n = 825–990]), and the distribution of the UI for each group was plotted. A Mann-Whitney test was performed comparing the two groups for each tissue separately, and in each case, the distributions were not significantly different (P > 0.1). The distribution is shown using box plots. (Horizontal line) Median; (box) 25th through 75th percentile; error bars indicate range. The tissue samples are indicated with letters. (T) testis; (Bc) B cells; (S) skeletal muscle; (ES) ES cells; (Br) breast; (O) ovary; (Bn) brain. (E) In genes with single 3′ UTRs, a significantly higher fraction of genes shows a change in mRNA levels [range of log2 TPM ≥ 2.5 across seven tissues] than in multi-UTR genes (Mann-Whitney test, P < 10−9). NpAM and pAM genes show a comparable fraction of genes that change their mRNA levels across the seven tissues (Mann-Whitney test, P < 0.08). (F) Difference in abundance of 3′ UTR isoforms between the brain and ES cells. The plot shows the difference in the UI of two samples (the UI in the brain minus UI in ES cells; _Y_-axis) as a function of mRNA abundance (mean log2 TPM of brain and ES cells; _X_-axis) for all jointly expressed genes. The statistically significant ApA events (FDR-adjusted P < 0.1) are color-coded. (G) Difference in the abundance of 3′ UTR isoforms between naïve B cells and ES cells. The plot is as described in F. (H) Heat map showing the significantly different ApA events (FDR-adjusted P < 0.1) between six differentiated tissues and ES cells. Shown are all jointly expressed genes. Each row corresponds to a gene. (Red) Higher fraction of the shorter 3′ UTR isoform observed in the differentiated tissue; (blue) higher fraction of the longer 3′ UTR isoform observed in the differentiated tissue; (white) no significant difference in 3′ UTR isoform levels between ES cells and a given differentiated tissue.
Ubiquitously transcribed genes that predominantly express shorter 3′ UTR isoforms in a single tissue are involved in tissue-specific processes
Visualization of the 3′ UTR expression pattern (Fig. 3C) shows that about half of the pAM genes produce a tissue-restricted pattern. These genes have similar 3′ UTR ratios across the majority of tissues but show increased expression of the shorter (or longer) 3′ UTR isoforms in a single tissue (Fig. 3C, middle panel, top half). We performed GO analysis to examine whether these genes are enriched in specific functional categories. Using as background all ubiquitously transcribed multi-UTR genes, we found that pAM genes are highly enriched for genes that function during diverse steps of gene regulation (see below) but were also enriched for genes involved in tissue-specific processes. Strikingly, the GO categories representing tissue-specific processes were associated with the pAM genes that show a tissue-specific 3′ UTR expression pattern (Fig. 3C, right panel; Supplemental Table 5). Genes that express a higher fraction of the shorter 3′ UTR isoforms specifically in B cells (n = 260) function during leukocyte activation or NF-κB signaling or are involved in cytokine production. The NF-κB signaling pathway plays a crucial role during immune and inflammatory responses (Bonizzi and Karin 2004; Hoffmann and Baltimore 2006). The genes that express a higher fraction of shorter UTRs only in skeletal muscle (n = 53) are members of the insulin signaling pathway and are involved in vesicle-mediated transport using SNARE interactions. These genes play important roles in insulin-mediated glucose uptake in skeletal muscles (Grusovin and Macaulay 2003). Genes that express a higher fraction of shorter 3′ UTRs in ES cells (n = 24) but not in other tissues are involved in proliferation and transcription repression. Finally, the genes that express a higher fraction of shorter mRNA isoforms in the testis (n = 495) are involved in processes that are typical for spermatogenesis, such as sexual reproduction or gamete generation (Wrobel and Primig 2005). They also play a role in developmental signaling pathways, including hormone-mediated signaling or Wnt signaling, or are important for early embryogenesis (Buechling and Boutros 2011). In the breast (n = 0), ovary (n = 3), or brain (n = 7), we only detected a few genes that showed a higher fraction of shorter 3′ UTRs in a specific tissue and thus did not analyze them further.
The genes that express a higher fraction of the longer 3′ UTR isoforms specifically in B cells (n = 123) or the brain (n = 141) did not show enrichment of particular GO terms. The other tissues had <15 genes that expressed a higher fraction of the longer 3′ UTRs in a specific tissue and were not further analyzed. It is remarkable that all of the genes that were analyzed with respect to tissue-specific 3′ UTR isoform levels are present in many tissues (in at least six out of seven tissues). Despite their ubiquitous transcription, we found enrichment for genes that function in tissue-specific processes if the 3′ UTR isoform ratio is shifted toward increased abundance of the shorter isoform in a tissue-specific manner. These data suggest that changing the relative abundance of 3′ UTR isoforms is a coordinated process that may represent an additional layer of regulation to achieve tissue-specific protein expression of ubiquitously transcribed genes.
The genes that have significantly shorter or longer 3′ UTRs in differentiated tissues compared with ES cells are specific to each tissue
It was reported previously that differentiation is associated with general lengthening of 3′ UTRs (Ji et al. 2009; Shepard et al. 2011; Elkon et al. 2013). We therefore investigated whether there are genes that show a higher fraction of longer 3′ UTR isoforms in the majority of differentiated tissues compared with ES cells. We performed pairwise comparisons of 3′ UTR isoform expression between ES cells and all of the other six tissues (Fig. 3F–H; Supplemental Fig. 3A–D). The majority of genes (85%–89%) that show differences in the 3′ UTR isoform expression pattern between ES cells and the breast (n = 47), ovary (n = 73), or brain (n = 401) (Fig. 3F) shift toward expression of the longer isoforms in the differentiated tissues. However, when we compared the differences in 3′ UTR isoform pattern between ES cells and the testis (n = 610), we found that 91% of the genes that showed a significant difference in their ApA pattern had increased levels of the shorter 3′ UTR isoforms in testis. In naïve B cells (n = 482) (Fig. 3G) or skeletal muscle (n = 147), we observed changes toward both shortening and lengthening (59%–61% of genes that change their ApA pattern express shorter 3′ UTRs in B cells or muscle tissue compared with ES cells). The vast majority of genes that changed their 3′ UTR isoform expression pattern when we compared differentiated tissues with ES cells are specific to the comparison analyzed and are not shared across tissues (Fig. 3H). Only a single gene (NUFIP2) was found to have longer 3′ UTRs in all differentiated tissues compared with ES cells. This argues against an ApA-based differentiation signature and highlights again the tissue specificity of 3′ UTR isoform abundance that seems to be a reflection of the specific gene expression program active in a given cell type.
Progressive weakening of proximal pA sites is associated with increased mRNA expression breadth
We then addressed whether there are global trends in the 3′ UTR isoform expression pattern in different tissue samples. Across the seven tissue samples, 2682 genes belonged to the pAM genes. In 89% (n = 2392), the significant change in isoform abundance occurs at the first functional pA site. We therefore focused our analyses on the genes that are regulated at the first pA site in the 3′ UTR. Again, we visualized the 3′ UTR isoform expression pattern of genes by plotting the UI. However, we altered our analysis such that we only considered the reads that map to the first pA site out of all of the reads mapping to the 3′ UTR. Therefore, we termed it instead the “short UTR index” (SUI). The larger the value of the SUI, the more the short 3′ UTR isoform is expressed.
We noticed that a large majority of genes (72%) that are transcribed in only a single tissue have a single 3′ UTR, whereas the majority of ubiquitously transcribed genes have multiple 3′ UTRs (Fig. 4A). In our analyses, we describe a gene as ubiquitous if the mRNA is present in at least six out of the seven tissues; in contrast, we use the term tissue-restricted if it is detectable in three or less tissues. The fraction of multi-UTR genes (χ2 = 101.4; P < 10−16) and therefore the fraction of pAM genes (χ2 = 175.0; P < 10−16) are highly enriched in widely transcribed genes compared with genes present in only a few tissues (Fig. 4A; Supplemental Fig. 4A, contingency tables). When we compared the average SUI of widely transcribed genes with the average SUI of tissue-restricted genes, we found that a substantial number of widely transcribed genes use the first pA sites only to a small extent (Mann-Whitney test, P < 10−16) (Supplemental Fig. 4B). We observed progressive readthrough transcription at the proximal pA site with increased expression breadth (Fig. 4B). This is illustrated in Figure 4C. Moreover, we detected a correlation between the number of tissues a gene is transcribed in and the number of 3′ UTR isoforms (Pearson's correlation coefficient, R = 0.26, P < 10−16) (Fig. 4D). Widely transcribed genes generate significantly more 3′ UTR isoforms than genes expressed in a few tissues (Mann-Whitney test, P < 10−18). This finding is not due to a sampling bias that might occur by counting genes more often when they are widely expressed (Supplemental Fig. 4C). The permissive proximal pA sites are also seen in genes with two 3′ UTR isoforms with wider expression. When only considering genes with two 3′ UTR isoforms, we still observed a decreased usage of the proximal pA sites (Mann-Whitney test, P < 10−13) (Supplemental Fig. 4D). A permissive first pA site is recognized less and results in readthrough transcription and subsequent recognition of the next functional pA site. This allows a higher fraction of transcripts of a gene to be regulated by elements located in the distal part of the 3′ UTR. If the decrease in recognition of the first pA site is extended to the second pA site, readthrough transcription will also happen at the second site, which results in genes with three or more 3′ UTR isoforms. This increase in the number of 3′ UTR isoforms is accompanied by an increase in the total 3′ UTR length (Fig. 4E). A lower number of reads mapping to the proximal pA site in ubiquitously transcribed genes compared with more tissue-restricted genes was observed in all samples analyzed (tissues as well as cell lines) (Fig. 4C; Supplemental Fig. 4E,F) and suggests that the presence of a permissive proximal pA site in ubiquitously transcribed genes is a general phenomenon.
Figure 4.

Ubiquitously transcribed genes are enriched in multi-UTR genes and show significantly less usage of their proximal pA sites than tissue-restricted genes. (A) Fraction of single, NpAM, or pAM genes stratified by the number of tissues in which a gene is transcribed. (B) Cumulative distribution of the SUI of all multi-UTR genes stratified by the number of tissues in which a gene is transcribed. The distribution of the SUI between ubiquitous and tissue-restricted genes is significantly different (Kolmogorov-Smirnoff [KS] test, P < 10−16). (_C_) Illustration of the median 3′ UTR isoform expression pattern of multi-UTR genes that generate two isoforms stratified by the number of tissues in which a gene is transcribed (expression breadth). (_Left_ panel) Median UI for all multi-UTR genes transcribed in two, four, or seven tissue samples. (_Middle_ panel) Median UI for the same genes in the testis. (_Right_ panel) Median UI for the same genes in the brain. Only values for the most proximal and distal pA sites are shown. A gene model depicting the terminal exon is shown _below_. (_D_) Fraction of genes with one, two, three, or more than three 3′ UTR isoforms stratified by the number of tissues in which a gene is transcribed. (_E_) Distribution of 3′ UTR length stratified by the number of 3′ UTR isoforms observed for a gene. Box plots were plotted as in Figure 3D. (_F_) Distribution of the SUI of all multi-UTR genes expressed in a given tissue. Box plots were plotted as in Figure 3D. (_G_) Distribution of the SUI of ubiquitously expressed NpAM and pAM genes. pAM genes were identified using an FDR-adjusted _P_ < 0.1, whereas the shown NpAM genes have an FDR-adjusted _P_ > 0.6. (H) Distribution of the SUI of tissue-restricted and ubiquitously expressed NpAM genes. NpAM genes were identified using an FDR-adjusted P > 0.6. The significance of the difference in the SUI distributions has _P_-values that range between P = 0.002 and P = 10−9 (Mann-Whitney test), depending on the tissue. Box plots were plotted as in Figure 3D.
The ranking of tissues by their ApA profile reflects the magnitude of escape from targeting by post-transcriptional regulation through elements in the distal 3′ UTRs
When investigating global trends in 3′ UTR isoform abundance, we noticed large differences in the distribution of the SUI of all multi-UTR genes across distinct tissue samples (Fig. 4F). When we ranked the tissue samples according to the overall SUI, we observed “the shortest” 3′ UTRs in the testis, which means that the testis generates the highest fraction of shorter UTR isoforms. In the brain, we observed “the longest” 3′ UTRs. We then asked whether these shifts in 3′ UTR isoform expression are global shifts or whether they result from larger changes in ApA that affect a limited number of genes. To distinguish between the two scenarios, we plotted the distribution of the SUI for NpAM and pAM genes separately. The ranking of tissues by their ApA profile was even more pronounced in pAM genes, but the usage of the first pA site in NpAM genes was similar across all tissues (Fig. 4G). The SUI distribution of widely transcribed pAM genes is significantly different (Kruskal-Wallis test, χ2 = 949.3; P < 10−16). Although the SUI distribution in widely transcribed NpAM genes varies slightly across the seven tissues (Kruskal-Wallis test, χ2 = 16.2; P = 0.013), the variation of the SUI in the NpAM genes appears to be minor compared with the highly significant difference in the ApA profile of pAM genes (Fig. 4G). This finding argues against a “tissue factor” that would determine a tissue-specific propensity of ApA site recognition.
The result suggests that the differences in ApA between tissues are not due to global shifts in 3′ UTR isoform abundance because NpAM genes were not affected. We then tested whether the first pA sites of ubiquitously transcribed NpAM genes are also more permissive. We found that the proximal pA sites in NpAM genes that are ubiquitously transcribed are used significantly less than the first pA sites in more tissue-restricted genes (Mann-Whitney test, P < 0.002). As can be seen in Figure 4H, the default recognition of the first pA sites in widely transcribed genes is ∼0.25, which means that ∼25% of the primary transcripts from a gene recognize the first pA site regardless of the tissue the gene is expressed in. In genes that are more tissue-restricted, the default recognition is ∼0.45. Thus, genes that are transcribed in many tissues allow more of their primary transcripts to read through the first pA sites to include the regulatory elements located in the distal part of the 3′ UTR (illustrated in Fig. 4C).
pAM genes form a unique class of genes
It is not surprising that genes with single 3′ UTRs carry out different functions than genes with multiple 3′ UTRs. However, it is more surprising that pAM and NpAM genes consist of different functional classes of genes. Across our data sets, ubiquitously transcribed genes with single 3′ UTRs are predominantly involved in energy metabolism, protein biosynthesis, or cell-to-cell communication and include extracellular and secreted proteins as well as cell surface receptors (Fig. 5A; Supplemental Table 6). pAM genes mostly function in protein or RNA transport and are components of signaling pathways such as TGF-β or MAP kinase signaling. The strongest enrichment was found for genes that play a role in diverse aspects of gene regulation and include factors that regulate transcription, RNA processing, and ubiquitination (Fig. 5A; Supplemental Table 7). Unexpectedly, NpAM genes are enriched in GO categories that are mostly found in genes with single 3′ UTRs. For example, they contain cell surface receptors and ion channels and are involved in protein biosynthesis. They are also enriched in transcription factors, which is the only GO category shared with pAM genes (Fig. 5A; Supplemental Table 8). Therefore, it seems that NpAM genes form an intermediate category between single-UTR and pAM genes.
Figure 5.

pAM genes are regulated at the post-transcriptional level by miRNAs as well as through differential ApA site usage. (A) Enriched GO terms in ubiquitously transcribed single-UTR, NpAM, and pAM genes. All significant GO terms are listed in Supplemental Tables 6–8. (B) 3′ UTR length in ubiquitously transcribed single-UTR, NpAM, and pAM genes. Box plots were plotted as in Figure 3D. (C) Median 3′ UTR length in single-UTR, NpAM, and pAM genes. The horizontal bars show the median distance from the stop codon to the distal pA sites. The red line depicts the median distance from the stop codon to the proximal pA sites. (D) Range of the SUI at a given pA site across the seven tissue samples in NpAM and pAM genes. (E) Relative frequency of the pA hexamer sequence in ubiquitously transcribed single-UTR, NpAM, and pAM genes at the proximal (or only) pA sites. (F) Conservation score in the 400 nt surrounding the proximal pA site in ubiquitously transcribed NpAM and pAM genes. pAM genes with an increased fraction of the shorter 3′ UTR isoform in a single tissue (TS short; Fig. 3C, top half) are shown separately (red). As a control, the conservation score at a random position within the 3′ UTR is shown. Conservation was calculated using phastCons tracks from 46 vertebrates (see the Supplemental Material). (G, left panel) Enrichment of conserved miRNA-binding sites for ubiquitously transcribed genes in the distal compared with the proximal part of the 3′ UTR of pAM genes. Each black dot shows the negative log _P_-value for the enrichment statistic for a miRNA (binomial test) (see the Supplemental Material). All broadly conserved miRNA seed families as well as miRNAs that are expressed in the seven tissues are included in the analysis (92 miRNAs total) (Supplemental Table 9). As a control, the same enrichment statistics are shown for conserved seed matches for 10,000 randomly generated miRNA seeds with the same nucleotide composition as the true miRNAs (gray dots). miRNAs are ordered along the _X_-axis by decreasing significance of enrichment. The dotted lines show the cutoff using an FDR = 0.1 or FDR = 0.25 (bold) relative to the empirical null model (see the Supplemental Material). (Middle panel) As in the left panel but enrichment of conserved miRNA-binding sites for ubiquitously transcribed NpAM genes comparing the distal and the proximal part of the 3′ UTR. In this comparison, none of the miRNAs was significantly enriched at an FDR-corrected empirical _P_-value threshold of P < 0.25. Therefore, we placed a single horizontal line above the top-ranked miRNA to indicate that all of the miRNAs fall below the 0.25 FDR threshold. (Right panel) As in left panel but enrichment of conserved miRNA-binding sites for ubiquitously transcribed genes with single 3′ UTRs compared with the distal part of the 3′ UTR of pAM genes. (H) Model for different modes of the tissue-specific miRNA/target interaction in single-UTR and multi-UTR genes (see the text). Features are as in C.
NpAM genes also form an intermediate category with respect to 3′ UTR length. Genes with multiple 3′ UTRs have longer 3′ UTRs than genes with single 3′ UTRs. Within the group of multi-UTR genes, the 3′ UTR of pAM genes (median = 2569 nt) is more than fourfold longer than the 3′ UTR of single-UTR genes (median = 596 nt), whereas NpAM genes have an intermediate length (median = 1859 nt) (Fig. 5B). Interestingly, the median distance from the stop codon to the first pA site is comparable in length between single-UTR and NpAM genes (median = 618 nt) but is only half as long in pAM genes (median = 296 nt) (Fig. 5C). Thus, pAM genes have a different genomic architecture from NpAM genes that may predispose them to be regulated post-transcriptionally.
Not only does the location of the proximal pA site differ between pAM and NpAM genes, but also the range of usage across tissues (Fig. 5D). Whereas the SUI of a particular proximal pA site differs <0.2 in NpAM genes, it differs up to 0.98 (median = 0.44) in pAM genes. In multi-UTR genes, the difference in the SUI is independent of the hexamer sequence of the pA site (pAM vs. NpAM, Mann-Whitney test, P = 0.4) (Fig. 5E). However, the distribution of the hexamers found at the end of single-UTR genes is enriched for the canonical pA sequence and is significantly different from the distribution at proximal pA sites (single-UTR vs. multi-UTR, Mann-Whitney test, P < 10−16) (Fig. 5E; Tian et al. 2005). Because of the similar distribution of the hexamer sequence in multi-UTR genes, the regulatory elements surrounding the proximal pA sites might be responsible for the difference in usage between pAM and NpAM genes. This is consistent with a higher sequence conservation in the vicinity of the proximal pA sites of pAM genes (Fig. 5F). pAM genes not only are more conserved surrounding the proximal pA sites but show a higher conservation throughout (Supplemental Fig. 5A), but proximal 3′ UTRs are more highly conserved than distal 3′ UTRs (Supplemental Fig. 5B).
Tissue-specific miRNAs target constitutively expressed 3′ UTRs, whereas ubiquitously expressed miRNAs target regulatable 3′ UTRs
Compared with NpAM genes, pAM genes have longer 3′ UTRs, are more highly conserved, and contain more miRNA-binding sites. After correcting for length and conservation, the distal 3′ UTRs of pAM genes are still enriched for conserved miRNA-binding sites compared with their proximal 3′ UTRs (Fig. 5G). This enrichment was not seen in NpAM genes (Fig. 5G). We compared the miRNAs that target the 3′ UTRs of single isoform genes, which we consider to have constitutively expressed 3′ UTRs, with the miRNAs that target the distal 3′ UTRs of pAM genes, which are the regulatable 3′ UTRs (Fig. 5G). Strikingly, seven out of eight miRNAs that preferentially target single-UTR genes are reported to be expressed in a tissue-restricted fashion. On the other hand, nine out of 12 miRNAs whose target sites are enriched in the distal 3′ UTRs of pAM genes are considered to be widely expressed (Supplemental Table 10; Wienholds et al. 2005; Landgraf et al. 2007). The distinct binding pattern of tissue-specific and ubiquitously expressed miRNAs is illustrated in our model of miRNA/target interaction (Fig. 5H). Our data suggest that the tissue-specific miRNA/target interaction of genes with constitutively expressed 3′ UTRs is accomplished by the tissue-specific expression of the miRNAs. In contrast, ubiquitously transcribed multi-UTR genes are mostly targeted by ubiquitously expressed miRNAs. The tissue specificity of the miRNA/target interaction with respect to these genes seems to be achieved through ApA, which allows either inclusion or exclusion of the miRNA-binding sites.
Discussion
To regulate protein expression levels, single-UTR genes typically change their mRNA levels, whereas multi-UTR genes change their 3′ UTR ratios
We analyzed gene and 3′ UTR isoform expression in seven samples derived from a wide range of human tissue types and observed that about half (51%) of all human genes generate more than one 3′ UTR isoform when focusing on robustly expressed isoforms. We found that the majority of genes with single 3′ UTRs are transcribed in a tissue-restricted manner, whereas ubiquitously transcribed genes typically generate multiple 3′ UTRs. Here, we use the term “ubiquitous” if a gene is expressed in at least six out of seven tissues. These genes may not be truly ubiquitous but are certainly present across a wide range of tissue types.
Classical housekeeping genes are single-UTR genes that are ubiquitously expressed and involved in protein biosynthesis and energy metabolism (Eisenberg and Levanon 2003; Zhu et al. 2008). In contrast, ubiquitously transcribed multi-UTR genes have a unique genomic architecture and function in signaling, transport, and diverse aspects of gene regulation. Analyzing isogenic samples before and after transformation, we found that the majority of genes that changed their mRNA levels were single-UTR genes. Multi-UTR genes were significantly less likely to change their mRNA levels but instead changed their 3′ UTR isoform ratios. We found that differentiation or transformation leads to changes in mRNA levels and 3′ UTR length in different groups of genes that nevertheless function in the same key pathways and biological processes. This suggests that the changes in protein expression levels that result from the activation of a gene expression program are accomplished through transcriptional changes that affect mRNA abundance of genes with single 3′ UTRs and through ApA site choice together with post-transcriptional regulation of constitutively transcribed multi-UTR genes.
Ubiquitously transcribed multi-UTR genes have permissive proximal pA sites to enable post-transcriptional regulation by 3′ UTR elements as well as tissue-specific pA site usage
Our data suggest that instead of developing more elaborate regulation at the transcriptional level, multi-UTR genes evolved a genomic architecture to permit post-transcriptional regulation. Multi-UTR genes have much longer 3′ UTRs than single-UTR genes. Moreover, especially in pAM genes, the proximal pA sites are located close to the stop codon to allow a larger fraction of the 3′ UTR to be regulated at the level of pA site usage. We further found that with increasing breadth of mRNA expression, proximal pA sites become progressively more permissive to allow readthrough transcription. As a consequence, regulatory elements in the distal part of the 3′ UTR are included in the message.
By default, permissive proximal pA sites enable a large fraction of primary transcripts to undergo post-transcriptional gene regulation. However, this extensive regulation by 3′ UTR elements might not be desired in every gene and every cell type. Differential usage of the proximal pA site may be a way to avoid this regulation. Across different tissue samples, we observed that about two-thirds of multi-UTR genes show significant differences in usage of the first pA sites and thus can potentially escape post-transcriptional regulation. There is a higher frequency of noncanonical hexamer signals at the proximal pA sites of multi-UTR genes than in single-UTR genes, and these noncanonical signals were shown to be weaker pA sites (Wickens and Stephenson 1984; Yoon et al. 2012). However, the 3′ UTRs of pAM genes are more highly conserved, their distal UTR regions are enriched for miRNA-binding sites, and the regions surrounding their proximal pA signals are more conserved relative to NpAM genes. This suggests a model in which multi-UTR genes first evolved permissive proximal pA sites to allow transcriptional readthrough, and then pAM genes acquired regulatory elements near their proximal pA sites to regulate their usage as well as miRNA-binding sites in the distal UTR to enable post-transcriptional regulation.
However, since we analyzed steady-state levels of mRNAs, we cannot entirely distinguish whether higher expression of shorter 3′ UTR isoforms is due to increased usage of the proximal pA sites or increased degradation of the longer 3′ UTR isoforms. We found several hints that suggest that the majority of regulation seen in our data is due to differences in usage of pA sites and not differential degradation by regulatory elements in the 3′ UTR. For example, we found that the distal 3′ UTRs of pAM genes are enriched in ubiquitously expressed miRNAs; therefore, these transcripts have the same chance to be targeted by miRNAs irrespective of the tissue. We also observed tissue-specific and bidirectional changes in isoform abundance of pAM genes, not unidirectional degradation of the longer isoform. Furthermore, in the ovary or brain, the pAM genes predominantly express the longer 3′ UTR isoforms that are known targets for ubiquitously expressed miRNAs or for the highly expressed brain-specific miRNA miR-124. Despite miRNA expression, these genes are highly abundant at the mRNA level. We speculate that perhaps, in these tissues, miRNAs predominantly affect translation regulation, whereas in the testis, B cells, or muscle, they might also affect the half-life of the mRNAs. Furthermore, it seems unlikely that the wide variation of 3′ UTR isoform expression ratios displayed by pAM genes could be entirely explained by miRNA-mediated mRNA degradation, whose effects on transcript levels tend to be modest (Baek et al. 2008; Selbach et al. 2008; Loeb et al. 2012). Finally, we observed that ubiquitously transcribed genes that express a higher fraction of the shorter 3′ UTR isoforms in a particular tissue are enriched in tissue-specific pathways and processes. This suggests that the expression program is trying to increase the protein abundance of these genes, consistent with increased usage of the first pA sites. This agrees with reports that demonstrate increased protein expression associated with increased abundance of shorter 3′ UTR isoforms (Wiestner et al. 2007; Sandberg et al. 2008; Mayr and Bartel 2009; Singh et al. 2009; Akman et al. 2012; Martin et al. 2012; Bava et al. 2013). Although higher levels of the shorter 3′ UTR isoforms correlate with higher protein levels in the vast majority of genes tested, there are exceptions. Sometimes, the alternative isoforms produce the same amount of protein, and sometimes the longer isoform produces more protein (An et al. 2008). BDNF generates two isoforms that differ in length by 3000 nt but produce the same amount of protein. However, the longer isoform was shown to be necessary for localization of BDNF to the synapse (An et al. 2008). It is possible that the primary function of increased expression of the longer 3′ UTR isoforms in the brain and other tissues is not the differential regulation of protein levels but the subcellular localization of mRNAs.
The 3′ UTR isoform expression pattern is tissue-specific and reflects the active gene expression program
Initially, we designed our isogenic transformation systems to investigate changes in 3′ UTR isoform abundance due to proliferation or oncogenic transformation. However, in every experimental system, the induction of proliferation is associated with changes in activation of signaling pathways. For example, T- or B-cell activation leads to T- or B-cell receptor signaling accompanied by proliferation (Carter et al. 2002; Bonizzi and Karin 2004). Even contact inhibition or serum starvation induces signaling pathways and is associated with metabolic alterations and gene expression changes (Coller et al. 2006). Therefore, it is impossible to distinguish between differences in 3′ UTR isoform expression due to proliferation or due to diverse changes in signaling.
However, with our isogenic transformation systems, we did investigate the changes in 3′ UTR isoform expression between different cell types. When comparing oncogenic transformation with nononcogenic transformation, we did not find a higher number of differentially regulated ApA events or the appearance of new ApA events in the HRAS-transformed cells. Furthermore, instead of finding the expected unidirectional shifts in 3′ UTR isoform levels, we found changes in both directions and, more strikingly, that the genes that significantly changed their 3′ UTR length were specific to the condition analyzed. This specificity of the alterations in ApA isoform expression was also observed when comparing ES cells and several differentiated tissues.
We implemented a systematic computational approach to build an atlas of human pA cleavage events and used a principled statistical procedure to test for significant differences in 3′ UTR isoform expression on a gene-by-gene basis while taking into account the variation between biological replicates. Such an approach has not yet been applied to the analysis of 3′-seq data. Taking into account the variation observed in replicates reduces the number of false positive ApA events that are regarded to be differentially expressed. By examining only the statistically significant differences in isoform abundance, our analyses show that only a minority of genes changes their 3′ UTR isoform expression between two cell types, but the changes in ApA occur toward shortening as well as lengthening and are gene-specific and cell type-specific. Within each pairwise comparison, on average, ∼10% (mean, 298 genes; range, 47–610) of the genes that have the potential to change their 3′ UTR isoform expression pattern do so. Nevertheless, >3000 multi-UTR genes showed significant differences in their 3′ UTR isoform expression pattern across our samples. The set of genes that changed their ApA isoform levels in the different tissue or cell type comparisons was involved in the pathways specific to the cell type analyzed. Together with the changes that happen at the level of mRNA abundance, the changes in ApA execute the activated gene expression program. This makes it unlikely that the gene- and tissue-specific 3′ UTR isoform expression changes can be explained by overexpression or down-regulation of a single factor (Kaida et al. 2010; Berg et al. 2012; Jenal et al. 2012; Martin et al. 2012).
When measuring the median expression of the shorter 3′ UTR isoforms across tissues, we found that the testis overall had the shortest 3′ UTRs, whereas the brain had the longest 3′ UTRs (Smibert et al. 2012). At first glance, it appeared as if these differences were due to global shifts in 3′ UTR isoform expression, but we demonstrated that the pronounced overall shortening of 3′ UTRs in the testis is due to extensive changes in 3′ UTR isoform expression of a subset of genes. We identified about a third of all jointly expressed genes to have very similar ratios in 3′ UTR isoform expression across all tissues. Our data suggest that NpAM and pAM genes are different groups of genes, and it seems that not all multi-UTR genes have yet evolved the regulatory elements to change the usage of their proximal pA sites.
Different mechanisms enable short-term versus permanent changes in ApA isoform expression
Our study design and experimental approach differ from most recently published reports regarding global changes in ApA isoform expression. Most of these studies performed acute perturbations of signaling pathways and analyzed the changes in 3′ UTR isoform expression after 8–72 h (Flavell et al. 2008; Sandberg et al. 2008; Ji et al. 2009, 2011; Berg et al. 2012; Elkon et al. 2012; Jenal et al. 2012; Martin et al. 2012). In contrast, the changes in ApA isoform expression in our transformation systems were analyzed after 4–6 wk, as it takes ∼6 wk to generate B-LCLs and several weeks to fully transform MCF10A cells with activated HRAS. Thus, when we profiled isogenic systems after transformation, they had achieved a new steady state in their gene expression program, and the permanent ApA changes that we observed appear to be quite different from the short-term changes reported by others, as we did not find a correlation of mRNA levels of PABPN1 or U1 snRNA with overall 3′ UTR isoform expression across the tissue or cell line samples presented here (data not shown). Nevertheless, short-term changes in ApA isoform expression in a particular system might well be explained largely by the up-regulation or down-regulation of a single factor (Kaida et al. 2010; Berg et al. 2012; Jenal et al. 2012; Martin et al. 2012).
The number of 3′ UTR isoforms generated from a gene is tissue- and context-independent
Unique to our study is the extensive validation of the results obtained by 3′-seq using an independent method. This helped to establish evidence-based thresholds for filtering the data to distinguish between single-UTR and multi-UTR genes. We demonstrated that a different stringency in filtering can dramatically change the number of genes regarded as having multiple 3′ UTRs. However, for some genes, it will be a matter of opinion whether a cleavage event is counted if it is consistently used at very low levels. Ultimately, the stringency of the filters will depend on the goal of the study. Although 3′ end sequencing is a new method to globally measure mRNA levels and 3′ UTR isoform abundance, this study is the first that made sure that the relative isoform expression ratios observed by sequencing actually reflect the ratios present in a sample. It is not guaranteed that a new sequencing method is quantitative at the level of isoform expression (Supplemental Fig. 1I,J). The quantitative nature of our 3′-seq protocol revealed that the locations of functional pA signals are largely tissue- and context-independent, but their relative UTR isoform abundance varies extensively. Thus, the dominant 3′ UTR isoform of a gene is cell type-dependent.
Taken together, our data demonstrated that, in addition to mRNA levels, 3′ UTR isoform abundance provides independent information on gene expression. Moreover, we found that the generation of mRNA isoforms that differ in their 3′ UTR length is a characteristic of widely transcribed genes. These genes are highly enriched for members of signaling pathways and factors involved in different gene regulatory processes. They are present in the majority of cell types because they are involved in general processes but are nevertheless highly regulated. Instead of using transcriptional regulation, these genes primarily use post-transcriptional regulation and a change in 3′ UTR isoform ratio as an alternative mechanism to adjust their protein levels in a tissue-specific manner. The changes that happen at the mRNA abundance level cooperate with the changes in ApA to accomplish the gene expression program active in a given cell type.
Materials and methods
3′-Seq samples
The following cell lines were purchased from American Type Culture Collection and cultured as indicated: HEK293, HeLa, MCF10A, MCF7, and NTERA2. The RNA of the human ES cell line H9 (SSEA4+ FACS-sorted) was a gift from Lorenz Studer (Memorial Sloan-Kettering Cancer Center). Untouched, uncultivated human naïve B cells (CD27−/CD20+ > 97%) were obtained using the naïve B-cell isolation kit (Miltenyi) after Ficoll separation from buffy coats from two different healthy donors. From one of the donors, EBV-immortalized B-LCLs were generated. Naïve B cells were infected with EBV and treated once with 1 μM cyclosporin A to kill any remaining T cells. After ∼6 wk, B-LCLs were obtained that were 100% CD19+. Total RNA from the testis, ovary, brain, breast, and skeletal muscle was purchased (Ambion). MCF10A cells expressing HRAS (G12V) were generated using retroviral vectors (pMSCV; Clontech). HRAS (G12V) was PCR-amplified (Pfu UltraII, Stratagene) from a region spanning 18 base pairs (bp) upstream of the start codon until the stop codon and was cloned into pMSCVneo as described before (Mayr and Bartel 2009). The construct was transfected with Lipofectamine 2000 (Invitrogen) together with plasmids for VSV-G and MCV into HEK293T cells. Supernatant containing viral particles was harvested 48 h later, and MCF10A cells were transduced. Neomycin (400 μg/mL) was added 24 h later. Marker-selected populations obtained after ∼4 wk were sequenced (single-end 50-bp reads).
3′-Seq protocol
Total RNA was isolated using Tri-reagent (Ambion) and DNase-treated (Ambion). An oligo(dT) primer containing a VN-anker, a uridine, the sequence of the sequencing adapter, and biotin (/5BiosG/CAGACGTGTGCTCTTCCGATCTTTTTTTTrUTTTTTTTTVN) was attached to streptavidin-coated magnetic beads (Invitrogen, M280). Total RNA was incubated for 5 min at 65°C, followed by incubation with the coated magnetic beads for 10 min at 45°C. First strand synthesis was carried out using SuperScript III reverse transcriptase (Invitrogen) at 50°C. The enzyme was inactivated by incubation for 15 min at 70°C. Second strand synthesis was carried out using second strand synthesis buffer (Invitrogen), dNTPs, DNA polymerase I (New England Biolabs), Escherichia coli ligase (New England Biolabs), and RNase H (Invitrogen). To exchange the buffers and remove enzymes from the previous step, we treated the samples with Pronase (Roche). We introduced a nick at the position of the uridine with RNase HII (New England Biolabs). Then, nick translation was carried out with DNA polymerase I (New England Biolabs) and dNTPs for 8 min at 8°C. The reaction was stopped by the addition of EDTA. At the new position of the nick, we created a blunt end using T7 exonuclease, mung bean nuclease, and Klenow enzyme (New England Biolabs). Previously annealed Illumina TruSeq sequencing adapters (Ad1, 5′-AATGATACGGCGACCACCGAGATCTACACTCTTTCCCTACACGACGCTCTTCCGATCT-3′; and Ad2, 5′-AGATCGGAAGAGCGTCGTGTAGGGAAAGAGTGTAGATCTCGGTGGTCGCCGTAT-3′) were then blunt-end-ligated. The magnetic beads were suspended in 39 μL of H2O. Five microliters of beads was used in a PCR reaction. Ten to 13 cycles of PCR were carried out with Phusion polymerase (New England Biolabs), a forward primer (5′-AATGATACGGCGACCACCGAGATC-3), and one of the Illumina TruSeq barcode reverse primers. For preparation of the library, six PCR reactions were performed and run on 8% TBE gels (Invitrogen), and the smear between 160 bp and 220 bp was cut out, gel-extracted, ethanol-precipitated, analyzed by Bioanalyzer (Agilent), and sequenced on Illumina HiSeq machines. A detailed protocol of 3′-seq is available on the author's Web page (http://www.mskcc.org/research/lab/christine-mayr/protocols).
Northern blots, Western blots, soft agar assays
Northern blots, Western blots, and soft agar assays were performed as described previously (Mayr et al. 2007; Mayr and Bartel 2009). Northern blots were quantified using Multi Gauge version 3.2. The antibodies used for Western blots were anti-H-Ras (1:500; Santa Cruz Biotechnology, sc-520), anti-RALA (1:1000; Abcam, sc126627), and anti-β-Actin (1:10,000; Sigma, A2066). Three independent soft agar assays, each in triplicate, were performed for MCF10A and MCF10AR and analyzed at day 28.
3′-Seq computational analyses
A detailed description of 3′-seq computational analyses is available in the Supplemental Material. Briefly, reads were aligned, and peaks due to internal priming (Supplemental Fig. 1B) as well as low usage events were removed. To identify significant changes in 3′ UTR isoform expression, we repurposed a recently published method named DEXSeq that was originally developed to identify differential exon usage between conditions using RNA-seq data (Anders et al. 2012). To identify significant changes in mRNA abundance levels from 3′-seq, we applied the DESeq package (Anders and Huber 2010), a method widely used for assessing differential gene expression from RNA-seq data.
The 3′-seq data were deposited in the Sequence Read Archive of NCBI (SRP029953). Direct links to the processed 3′-seq data are available on our Web page (http://cbio.mskcc.org/leslielab/ApA/atlas).
Acknowledgments
We thank Iestyn Whitehouse (Memorial Sloan-Kettering Cancer Center) for help with establishing the 3′-seq protocol and are grateful to Omar Hamdani, Jessica Johnson, and Elizabeth Lau, who helped with the Northern blots. We also thank the sequencing facilities of Rockefeller University, Memorial Sloan-Kettering Cancer Center, and Columbia University for sequencing our samples. We thank Iestyn Whitehouse, Richard White, Johanna Joyce, and members of the laboratory for critical reading of the manuscript. This work was funded by the NIH grants U01-CA164190 (to C.M. and C.S.L.) and U24-CA143840 (to C.S.L.), the Starr Cancer Consortium (to C.S.L. and C.M.), and the Sidney Kimmel Foundation (to C.M.). S.L. designed and performed the computational analysis. V.G. performed some of the experiments. J.L.Y. performed part of the miRNA analysis. C.S.L. designed the computational analysis. C.M. designed the study and performed the experiments and some of the analyses. S.L. contributed to writing the manuscript, and C.S.L. and C.M. wrote the manuscript.
Footnotes
Supplemental material is available for this article.
References
- Akman BH, Can T, Erson-Bensan AE 2012. Estrogen-induced upregulation and 3′-UTR shortening of CDC6. Nucleic Acids Res 40: 10679–10688 [DOI] [PMC free article] [PubMed] [Google Scholar]
- An JJ, Gharami K, Liao GY, Woo NH, Lau AG, Vanevski F, Torre ER, Jones KR, Feng Y, Lu B, et al. 2008. Distinct role of long 3′ UTR BDNF mRNA in spine morphology and synaptic plasticity in hippocampal neurons. Cell 134: 175–187 [DOI] [PMC free article] [PubMed] [Google Scholar]
- Anders S, Huber W 2010. Differential expression analysis for sequence count data. Genome Biol 11: R106. [DOI] [PMC free article] [PubMed] [Google Scholar]
- Anders S, Reyes A, Huber W 2012. Detecting differential usage of exons from RNA-seq data. Genome Res 22: 2008–2017 [DOI] [PMC free article] [PubMed] [Google Scholar]
- Ascano M, Hafner M, Cekan P, Gerstberger S, Tuschl T 2012. Identification of RNA–protein interaction networks using PAR-CLIP. Wiley Interdiscip Rev RNA 3: 159–177 [DOI] [PMC free article] [PubMed] [Google Scholar]
- Baek D, Villen J, Shin C, Camargo FD, Gygi SP, Bartel DP 2008. The impact of microRNAs on protein output. Nature 455: 64–71 [DOI] [PMC free article] [PubMed] [Google Scholar]
- Bartel DP 2004. MicroRNAs: Genomics, biogenesis, mechanism, and function. Cell 116: 281–297 [DOI] [PubMed] [Google Scholar]
- Bava FA, Eliscovich C, Ferreira PG, Minana B, Ben-Dov C, Guigo R, Valcarcel J, Mendez R 2013. CPEB1 coordinates alternative 3′-UTR formation with translational regulation. Nature 495: 121–125 [DOI] [PubMed] [Google Scholar]
- Berg MG, Singh LN, Younis I, Liu Q, Pinto AM, Kaida D, Zhang Z, Cho S, Sherrill-Mix S, Wan L, et al. 2012. U1 snRNP determines mRNA length and regulates isoform expression. Cell 150: 53–64 [DOI] [PMC free article] [PubMed] [Google Scholar]
- Bonizzi G, Karin M 2004. The two NF-κB activation pathways and their role in innate and adaptive immunity. Trends Immunol 25: 280–288 [DOI] [PubMed] [Google Scholar]
- Buechling T, Boutros M 2011. Wnt signaling signaling at and above the receptor level. Curr Top Dev Biol 97: 21–53 [DOI] [PubMed] [Google Scholar]
- Carter KL, Cahir-McFarland E, Kieff E 2002. Epstein-Barr virus-induced changes in B-lymphocyte gene expression. J Virol 76: 10427–10436 [DOI] [PMC free article] [PubMed] [Google Scholar]
- Coller HA, Sang L, Roberts JM 2006. A new description of cellular quiescence. PLoS Biol 4: e83. [DOI] [PMC free article] [PubMed] [Google Scholar]
- Darnell RB 2010. HITS-CLIP: Panoramic views of protein–RNA regulation in living cells. Wiley Interdiscip Rev RNA 1: 266–286 [DOI] [PMC free article] [PubMed] [Google Scholar]
- Derti A, Garrett-Engele P, Macisaac KD, Stevens RC, Sriram S, Chen R, Rohl CA, Johnson JM, Babak T 2012. A quantitative atlas of polyadenylation in five mammals. Genome Res 22: 1173–1183 [DOI] [PMC free article] [PubMed] [Google Scholar]
- Eisenberg E, Levanon EY 2003. Human housekeeping genes are compact. Trends Genet 19: 362–365 [DOI] [PubMed] [Google Scholar]
- Elkon R, Drost J, van Haaften G, Jenal M, Schrier M, Vrielink JA, Agami R 2012. E2F mediates enhanced alternative polyadenylation in proliferation. Genome Biol 13: R59. [DOI] [PMC free article] [PubMed] [Google Scholar]
- Elkon R, Ugalde AP, Agami R 2013. Alternative cleavage and polyadenylation: Extent, regulation and function. Nat Rev Genet 14: 496–506 [DOI] [PubMed] [Google Scholar]
- Flavell SW, Kim TK, Gray JM, Harmin DA, Hemberg M, Hong EJ, Markenscoff-Papadimitriou E, Bear DM, Greenberg ME 2008. Genome-wide analysis of MEF2 transcriptional program reveals synaptic target genes and neuronal activity-dependent polyadenylation site selection. Neuron 60: 1022–1038 [DOI] [PMC free article] [PubMed] [Google Scholar]
- Fu Y, Sun Y, Li Y, Li J, Rao X, Chen C, Xu A 2011. Differential genome-wide profiling of tandem 3′ UTRs among human breast cancer and normal cells by high-throughput sequencing. Genome Res 21: 741–747 [DOI] [PMC free article] [PubMed] [Google Scholar]
- Fuxe J, Karlsson MC 2012. TGF-β-induced epithelial–mesenchymal transition: A link between cancer and inflammation. Semin Cancer Biol 22: 455–461 [DOI] [PubMed] [Google Scholar]
- Grusovin J, Macaulay SL 2003. Snares for GLUT4—mechanisms directing vesicular trafficking of GLUT4. Front Biosci 8: d620–d641 [DOI] [PubMed] [Google Scholar]
- Hoffmann A, Baltimore D 2006. Circuitry of nuclear factor κB signaling. Immunol Rev 210: 171–186 [DOI] [PubMed] [Google Scholar]
- Hoque M, Ji Z, Zheng D, Luo W, Li W, You B, Park JY, Yehia G, Tian B 2013. Analysis of alternative cleavage and polyadenylation by 3′ region extraction and deep sequencing. Nat Methods 10: 133–139 [DOI] [PMC free article] [PubMed] [Google Scholar]
- Huber MA, Azoitei N, Baumann B, Grunert S, Sommer A, Pehamberger H, Kraut N, Beug H, Wirth T 2004. NF-κB is essential for epithelial–mesenchymal transition and metastasis in a model of breast cancer progression. J Clin Invest 114: 569–581 [DOI] [PMC free article] [PubMed] [Google Scholar]
- Jan CH, Friedman RC, Ruby JG, Bartel DP 2011. Formation, regulation and evolution of Caenorhabditis elegans 3′UTRs. Nature 469: 97–101 [DOI] [PMC free article] [PubMed] [Google Scholar]
- Jenal M, Elkon R, Loayza-Puch F, van Haaften G, Kuhn U, Menzies FM, Oude Vrielink JA, Bos AJ, Drost J, Rooijers K, et al. 2012. The poly(A)-binding protein nuclear 1 suppresses alternative cleavage and polyadenylation sites. Cell 149: 538–553 [DOI] [PubMed] [Google Scholar]
- Ji Z, Lee JY, Pan Z, Jiang B, Tian B 2009. Progressive lengthening of 3′ untranslated regions of mRNAs by alternative polyadenylation during mouse embryonic development. Proc Natl Acad Sci 106: 7028–7033 [DOI] [PMC free article] [PubMed] [Google Scholar]
- Ji Z, Luo W, Li W, Hoque M, Pan Z, Zhao Y, Tian B 2011. Transcriptional activity regulates alternative cleavage and polyadenylation. Mol Syst Biol 7: 534. [DOI] [PMC free article] [PubMed] [Google Scholar]
- Kaida D, Berg MG, Younis I, Kasim M, Singh LN, Wan L, Dreyfuss G 2010. U1 snRNP protects pre-mRNAs from premature cleavage and polyadenylation. Nature 468: 664–668 [DOI] [PMC free article] [PubMed] [Google Scholar]
- Landgraf P, Rusu M, Sheridan R, Sewer A, Iovino N, Aravin A, Pfeffer S, Rice A, Kamphorst AO, Landthaler M, et al. 2007. A mammalian microRNA expression atlas based on small RNA library sequencing. Cell 129: 1401–1414 [DOI] [PMC free article] [PubMed] [Google Scholar]
- Li Y, Sun Y, Fu Y, Li M, Huang G, Zhang C, Liang J, Huang S, Shen G, Yuan S, et al. 2012. Dynamic landscape of tandem 3′ UTRs during zebrafish development. Genome Res 22: 1899–1906 [DOI] [PMC free article] [PubMed] [Google Scholar]
- Lim KH, Baines AT, Fiordalisi JJ, Shipitsin M, Feig LA, Cox AD, Der CJ, Counter CM 2005. Activation of RalA is critical for Ras-induced tumorigenesis of human cells. Cancer Cell 7: 533–545 [DOI] [PubMed] [Google Scholar]
- Lin Y, Li Z, Ozsolak F, Kim SW, Arango-Argoty G, Liu TT, Tenenbaum SA, Bailey T, Monaghan AP, Milos PM, et al. 2012. An in-depth map of polyadenylation sites in cancer. Nucleic Acids Res 40: 8460–8471 [DOI] [PMC free article] [PubMed] [Google Scholar]
- Loeb GB, Khan AA, Canner D, Hiatt JB, Shendure J, Darnell RB, Leslie CS, Rudensky AY 2012. Transcriptome-wide miR-155 binding map reveals widespread noncanonical microRNA targeting. Mol Cell 48: 760–770 [DOI] [PMC free article] [PubMed] [Google Scholar]
- Martin G, Gruber AR, Keller W, Zavolan M 2012. Genome-wide analysis of pre-mRNA 3′ end processing reveals a decisive role of human cleavage factor I in the regulation of 3′ UTR length. Cell Rep 1: 753–763 [DOI] [PubMed] [Google Scholar]
- Mayr C, Bartel DP 2009. Widespread shortening of 3′UTRs by alternative cleavage and polyadenylation activates oncogenes in cancer cells. Cell 138: 673–684 [DOI] [PMC free article] [PubMed] [Google Scholar]
- Mayr C, Hemann MT, Bartel DP 2007. Disrupting the pairing between let-7 and Hmga2 enhances oncogenic transformation. Science 315: 1576–1579 [DOI] [PMC free article] [PubMed] [Google Scholar]
- Meyer KD, Saletore Y, Zumbo P, Elemento O, Mason CE, Jaffrey SR 2012. Comprehensive analysis of mRNA methylation reveals enrichment in 3′ UTRs and near stop codons. Cell 149: 1635–1646 [DOI] [PMC free article] [PubMed] [Google Scholar]
- Morel AP, Lievre M, Thomas C, Hinkal G, Ansieau S, Puisieux A 2008. Generation of breast cancer stem cells through epithelial–mesenchymal transition. PLoS ONE 3: e2888. [DOI] [PMC free article] [PubMed] [Google Scholar]
- Ramskold D, Wang ET, Burge CB, Sandberg R 2009. An abundance of ubiquitously expressed genes revealed by tissue transcriptome sequence data. PLoS Comput Biol 5: e1000598. [DOI] [PMC free article] [PubMed] [Google Scholar]
- Ranganathan G, Ong JM, Yukht A, Saghizadeh M, Simsolo RB, Pauer A, Kern PA 1995. Tissue-specific expression of human lipoprotein lipase. Effect of the 3′-untranslated region on translation. J Biol Chem 270: 7149–7155 [DOI] [PubMed] [Google Scholar]
- Sandberg R, Neilson JR, Sarma A, Sharp PA, Burge CB 2008. Proliferating cells express mRNAs with shortened 3′ untranslated regions and fewer microRNA target sites. Science 320: 1643–1647 [DOI] [PMC free article] [PubMed] [Google Scholar]
- Selbach M, Schwanhausser B, Thierfelder N, Fang Z, Khanin R, Rajewsky N 2008. Widespread changes in protein synthesis induced by microRNAs. Nature 455: 58–63 [DOI] [PubMed] [Google Scholar]
- Shepard PJ, Choi EA, Lu J, Flanagan LA, Hertel KJ, Shi Y 2011. Complex and dynamic landscape of RNA polyadenylation revealed by PAS-Seq. RNA 17: 761–772 [DOI] [PMC free article] [PubMed] [Google Scholar]
- Singh P, Alley TL, Wright SM, Kamdar S, Schott W, Wilpan RY, Mills KD, Graber JH 2009. Global changes in processing of mRNA 3′ untranslated regions characterize clinically distinct cancer subtypes. Cancer Res 69: 9422–9430 [DOI] [PMC free article] [PubMed] [Google Scholar]
- Smibert P, Miura P, Westholm JO, Shenker S, May G, Duff MO, Zhang D, Eads BD, Carlson J, Brown JB et al. 2012. Global patterns of tissue-specific alternative polyadenylation in Drosophila. Cell Rep 1: 277–289 [DOI] [PMC free article] [PubMed] [Google Scholar]
- Sonenberg N, Hinnebusch AG 2009. Regulation of translation initiation in eukaryotes: Mechanisms and biological targets. Cell 136: 731–745 [DOI] [PMC free article] [PubMed] [Google Scholar]
- Tian B, Manley JL 2013. Alternative cleavage and polyadenylation: The long and short of it. Trends Biochem Sci 38: 312–320 [DOI] [PMC free article] [PubMed] [Google Scholar]
- Tian B, Hu J, Zhang H, Lutz CS 2005. A large-scale analysis of mRNA polyadenylation of human and mouse genes. Nucleic Acids Res 33: 201–212 [DOI] [PMC free article] [PubMed] [Google Scholar]
- Ulitsky I, Shkumatava A, Jan C, Subtelny AO, Koppstein D, Bell G, Sive H, Bartel D 2012. Extensive alternative polyadenylation during zebrafish development. Genome Res 22: 2054–2066 [DOI] [PMC free article] [PubMed] [Google Scholar]
- Vogel C, Marcotte EM 2012. Insights into the regulation of protein abundance from proteomic and transcriptomic analyses. Nat Rev Genet 13: 227–232 [DOI] [PMC free article] [PubMed] [Google Scholar]
- Wickens M, Stephenson P 1984. Role of the conserved AAUAAA sequence: Four AAUAAA point mutants prevent messenger RNA 3′ end formation. Science 226: 1045–1051 [DOI] [PubMed] [Google Scholar]
- Wienholds E, Kloosterman WP, Miska E, Alvarez-Saavedra E, Berezikov E, de Bruijn E, Horvitz HR, Kauppinen S, Plasterk RH 2005. MicroRNA expression in zebrafish embryonic development. Science 309: 310–311 [DOI] [PubMed] [Google Scholar]
- Wiestner A, Tehrani M, Chiorazzi M, Wright G, Gibellini F, Nakayama K, Liu H, Rosenwald A, Muller-Hermelink HK, Ott G, et al. 2007. Point mutations and genomic deletions in CCND1 create stable truncated cyclin D1 mRNAs that are associated with increased proliferation rate and shorter survival. Blood 109: 4599–4606 [DOI] [PMC free article] [PubMed] [Google Scholar]
- Wrobel G, Primig M 2005. Mammalian male germ cells are fertile ground for expression profiling of sexual reproduction. Reproduction 129: 1–7 [DOI] [PubMed] [Google Scholar]
- Yoon OK, Hsu TY, Im JH, Brem RB 2012. Genetics and regulatory impact of alternative polyadenylation in human B-lymphoblastoid cells. PLoS Genet 8: e1002882. [DOI] [PMC free article] [PubMed] [Google Scholar]
- Zhang H, Lee JY, Tian B 2005. Biased alternative polyadenylation in human tissues. Genome Biol 6: R100. [DOI] [PMC free article] [PubMed] [Google Scholar]
- Zhu J, He F, Song S, Wang J, Yu J 2008. How many human genes can be defined as housekeeping with current expression data? BMC Genomics 9: 172. [DOI] [PMC free article] [PubMed] [Google Scholar]