Predicting the X-ray lifetime of protein crystals (original) (raw)
Significance
Most atomic-resolution protein structures are determined by growing protein crystals, then exposing them to intense X-ray beams. The pattern of scattered X-rays can be used to find the atomic structure of the protein. A major drawback of this technique is that absorbed X-rays damage the fragile protein crystals. We present a method for determining how long a protein crystal will last in the X-ray beam, and for evaluating specific data-collection strategies in terms of how many data are acquired per unit damage caused. By way of example, we show that a small change in the typical experimental geometry can allow large crystals to be exposed for longer, giving better data quality and resulting in lower levels of damage.
Abstract
Radiation damage is a major cause of failure in macromolecular crystallography experiments. Although it is always best to evenly illuminate the entire volume of a homogeneously diffracting crystal, limitations of the available equipment and imperfections in the sample often require a more sophisticated targeting strategy, involving microbeams smaller than the crystal, and translations of the crystal during data collection. This leads to a highly inhomogeneous distribution of absorbed X-rays (i.e., dose). Under these common experimental conditions, the relationship between dose and time is nonlinear, making it difficult to design an experimental strategy that optimizes the radiation damage lifetime of the crystal, or to assign appropriate dose values to an experiment. We present, and experimentally validate, a predictive metric diffraction-weighted dose for modeling the rate of decay of total diffracted intensity from protein crystals in macromolecular crystallography, and hence we can now assign appropriate “dose” values to modern experimental setups. Further, by taking the ratio of total elastic scattering to diffraction-weighted dose, we show that it is possible to directly compare potential data-collection strategies to optimize the diffraction for a given level of damage under specific experimental conditions. As an example of the applicability of this method, we demonstrate that by offsetting the rotation axis from the beam axis by 1.25 times the full-width half maximum of the beam, it is possible to significantly extend the dose lifetime of the crystal, leading to a higher number of diffracted photons, better statistics, and lower overall radiation damage.
Given an adequately diffracting crystal, radiation damage is the dominant cause of failure for macromolecular crystallography (MX) experiments (1), and overcoming this problem has been one of the major motivations for the development of new methods. By way of illustration: over the last 11 years at beamline 8.3.1 of the Advanced Light Source (ALS), more than 1,000 structures have been solved and deposited into the Protein Data Bank, but more than 25,000 datasets were collected. Similar dataset-to-deposition ratios have been reported elsewhere (2, 3). A retrospective analysis of the ALS 8.3.1 data reveals that radiation damage played a dominant role in the failure to obtain phases for structure solution by anomalous dispersion methods. Indeed, if radiation damage did not exist, investigators could simply keep collecting data until any desired signal-to-noise ratio was attained.
Much of the recent excitement over serial femtosecond crystallography with X-ray Free Electron Lasers (XFELs) has been due to the vast gains in the diffraction/damage ratios demonstrated (4). Despite these major advances, the technology for these systems is not yet mature, and the linear nature of the XFEL facilities limits the number of end stations, greatly reducing capacity compared with a traditional synchrotron source. Synchrotron-based MX is thus likely to remain the dominant method for structural determination in the coming years, and there is a pressing need to improve how we deal with radiation damage to maintain the maximum utility of synchrotron based MX in the XFEL era.
Even at XFELs, there appears to be some kind of radiation damage present (5). Radiation damage is unavoidable, but it is also not the ultimate problem: the challenge is that radiation damage remains difficult to predict. Most experienced investigators know that subjecting a protein crystal to a lower dose will give them less radiation damage, but it will also give them less diffraction, and striking the appropriate balance is the key to success. This paper presents a method for optimizing this ratio, allowing the best data to be gained from a given diffracting crystal volume.
Once macromolecular crystals have been obtained, structural biologists working on challenging samples are often presented with a handful of well-diffracting crystals among a much larger population of poorly diffracting ones. Under these common conditions, it is vital to collect data as efficiently as possible from this available crystal volume. A prerequisite to optimizing the experimental protocol is knowing the effective crystal lifetime available for data collection. Diffracted intensity is known to decay with dose (6, 7), relative B factor  is known to increase (8), and protocols exist for determining dose tolerance under carefully controlled conditions (9). However, when collecting data with the goal of solving challenging new structures, these results are often of limited use (10), because the optimally efficient even-dose case (11) is often not experimentally achievable. The reason for this is the absence of a suitable model that takes into account the effect of the uneven distribution of dose throughout the crystal volume during an experiment, where the maximum dose at the intersection of the beam and the rotation axes can often be more than an order of magnitude greater than the average dose within the diffracting volume (11).
The recently developed program raddose-3D (12) allows users to simulate the progression of the absorbed energy that eventually leads to damage during data collection. The raw output of this calculation is a dose field, which reports the dose at each point in the crystal, at each time step during data collection: typically 106 volume elements, and hundreds of time steps. This raw output is, in itself, of limited use, because it does not directly inform the experimenter about the likely damage state of his or her crystal. To achieve this, aggregate metrics describing the dose state of the crystal in a succinct way must be calculated. Two intuitive metrics are the average dose for the whole crystal volume (AD-WC); i.e., the total absorbed energy divided by the mass of the whole crystal, and the maximum dose: the highest dose reached at any point in the crystal volume. Maximum dose, assuming a well-aligned beam and rotation axis, is the metric output by previous versions of raddose (13–15) when using the Gaussian beam profile (GAUSS) keyword to define the beam profile, a worst-case estimate for the dose.
Diffraction-Weighted Dose
During an MX experiment, the crystal has a dose state which constantly evolves as it is moved (typically through rotation) in the beam. Metrics such as AD-WC and maximum dose blindly deal with the state of the whole crystal after the entire data collection is complete, only reporting the final dose state of the crystal globally, and not taking into account which part of the crystal is relevant during the exposure being considered. These dose metrics can be conceptualized as simple weighting schemes: AD-WC weights each volume element equally, irrespective of what role it has played during the data collection, and maximum dose weights the most highly exposed volume element by 1, and all others by 0.
To fully use the time and space resolved description of the dose state provided by raddose-3D, we propose a metric against which to quantify radiation damage: diffraction-weighted dose (DWD). DWD combines information from the aggregation of dose within each volume element of the crystal up to a given time, with the way the crystal is being exposed at that moment. This is necessary because the region within a crystal that is most damaged and the region from where data are currently being collected do not necessarily colocalize. For example, a crystal may have half its volume highly damaged from a previous dataset, then have a subsequent dataset collected from a fresh region, and yet in each case, average dose metrics would only reflect the final dose state of the crystal, not its history. For this simple case, it would be possible to consider the crystal as two separate halves, but in the general case, a helical scan may be performed (12, 16), and/or wedges may overlap or be collected in the same region several times. It is thus necessary to consider how much fluence (photons/unit area) each part of the crystal receives during each image, and how damaged each of these parts is at that time.
For an MX experiment, DWD is a function of the spatial distribution of the dose state and the exposure of the crystal over a short time step. Mathematically, we define the DWD for the angular range exposed between time  as
as
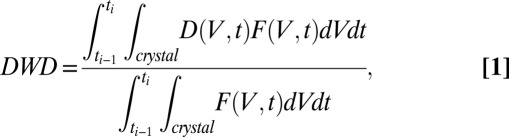
where t is the experimental coordinate, which is proportional to the goniometer angle for a constant rotation rate. Here,  is the total cumulative dose (MGy) at position V:
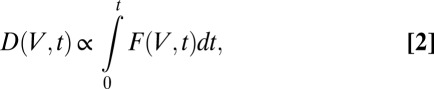
where  is the flux density at position V, and experimental coordinate t:

where  is the intensity of the beam at the surface of the crystal at the
  coordinates associated with position V (a function of the beam profile and total flux). Also,
  is the absorption coefficient of the crystal; and depth is the distance along the beam axis from the front face of the crystal to position V. Thus,
  is the weighting function, which to first order corresponds to how much the volume element V contributes to the diffraction pattern at time t. The numerator is then normalized by the weighting function, leaving the units of DWD as MGy, unchanged from the units of dose.
DWD is a more sophisticated weighting scheme, which is calculated image by image: at every step, the dose at each of the volume elements that make up the crystal is weighted by how much that volume element has contributed to the current image being considered. This means that if highly damaged regions of the crystal are not exposed for an image, they will not affect the DWD, and each region contributes proportionally to the effect it will have on the diffraction image being considered. In essence, DWD represents the effective average dose that is observed in the diffraction pattern, i.e., the average dose in the diffracting crystal volume from which the photons making up a given image have scattered.
Results
To test the effectiveness of DWD at predicting intensity loss under a variety of dose contrast conditions, the total diffraction efficiency of 15 cryocooled crystals of bovine pancreatic insulin were evaluated by subjecting each crystal to a series of low-dose probe datasets interspersed by high-dose burn exposures at beamline ID14-4 at the European Synchrotron Radiation Facility (ESRF), Grenoble (17). Probe and burn exposures are defined in the materials and methods. The 15 crystals were aligned face on using the minikappa goniometer available at ID14-4 (18), and irradiated under three beam conditions, in-line profiles for which are shown in Fig. S1, with four crystals in the large beam (leading to an even dose profile), six in the medium beam (leading to an uneven dose profile), and five in the small beam (leading to a highly uneven dose profile). Using the data for which the total summed mean intensity was at least 0.4 times the original diffracted intensity (so that the crystal was not so damaged that the data had little biological relevance) (6), the normalized intensity decay ( , where
  is the average intensity of the _n_th dataset, and
  the average intensity of the first dataset), and relative B factor (8) were then calculated for each probe dataset. These data were used to evaluate different aggregate dose metrics, derived from the dose fields generated by raddose-3D, to identify a metric that faithfully predicted damage progression, irrespective of the beam condition.
To robustly test dose metrics, accurate estimation of dose was vital. A custom input module for raddose-3D was written that uses experimentally determined beam profiles in the model. In addition, crystals were carefully chosen to be highly cuboid, allowing accurate characterization of their size and orientation via the online microscope. Full details are provided in Materials and Methods.
Fig. 1 A–C shows the  data for all crystals, and the dose required to reduce the mean summed diffraction intensity to 0.5 of its initial value (half-dose,
  ) calculated using all of the datasets for each beam condition are shown in the left-hand side of Table 1. For each column, dose has a different meaning, depending on the method (AD-WC, maximum dose, or DWD) used to calculate it. It is clear that, for AD-WC and maximum dose, there is a high level of scatter, and a factor of 2 variation in the
  . In contrast, when the data are plotted against DWD, the observed scatter in Fig. 1_C_ is significantly reduced, and there is only a very small variation between the
  for each of the beam conditions (0.1-MGy range, as shown in Table 1). This important result shows that, for the biologically relevant
 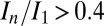 regime, DWD is an effective strategy-invariant measure of radiation damage, as reported by
  . Thus, if the decay rate
  of a crystal is known—for example by characterizing a poorly diffracting crystal volume—it is possible to use raddose-3D with DWD to estimate the ultimate
  for a given data-collection strategy on a particular crystal under any beam condition and data-collection strategy.
Fig. 1.

(A–C) Plots of dose against  for the three beam conditions. DWD (C) is clearly invariant to dose distribution. (D–F) Plots of dose against
  for the three beam conditions. The trends for
  are not as stark as for
  , but there is still a reduced spread in the DWD plot, particularly compared with that of maximum dose. In all cases, data and fits are limited to the biologically relevant regime
  > 0.4. The symbols indicate individual crystals, and the colors the different beam types (contrast strategies).
Table 1.
The  values for the
  data shown in Fig. 1 A–C, and
  values for the
  data for the three beam classes shown in Fig. 1 D–F
The  results shown in Fig. 1 D–F also reveal a qualitative reduction in the scatter with DWD, and there appears to be a systematic trend in the sensitivities of the crystals as a function of dose contrast: the
  of the crystals exposed with the smaller beams appear to increase at a lower rate with DWD than those for the larger beams. There is, however, no clear trend in the average coefficients of sensitivity,
  , shown in the right-hand side of Table 1. The lack of any systematic effects in the
  data can be explained by considering the theoretical relationship between the Wilson B factor and relative B:
  . In essence,
  is the resolution dependence of the intensity loss with dose, as opposed to the total loss of intensity, and so is sensitive to the change in intensity of the weaker, high-resolution reflections. It is possible that this has a different effect dependent on the dose contrast, because the data from any given dose contrast regime is a superposition of diffraction from all of the different damage states of the macromolecule that contribute to the image, and each state has its own resolution-dependent intensity function. It is thus not surprising that
  is more sensitive to how these dose states are combined than is
  , and a more physically complete weighting scheme may resolve this discrepancy.
DWD Strategies.
Having established DWD as a powerful tool for predicting crystal lifetime as measured by  , it is possible to use the ratio of elastically scattered photons (i.e., diffraction plus diffuse scatter) to DWD as a measure of how effectively a given data-collection strategy maximizes the diffracted intensity per unit dose; we call this metric the diffracted dose efficiency (DDE). As an example of the application of this DDE metric, a strategy where the crystal rotation and beam axes are deliberately offset from one another was investigated for its effect on spreading dose more evenly through a crystal volume. Offsetting the rotation axes spreads the central point of maximum dose where the beam and rotation axes would normally intersect into a torus around the rotation axis, creating a more even dose profile during exposure.
To quantitatively predict the effect of an offset rotation axis, simulations were performed for a wide variety of crystal–beam size combinations using a Gaussian beam profile, and with offsets ranging from 1/4 of the beam FWHM to 2 beam FWHM. The limiting case of a beam much smaller than the crystal ( FWHM beam, 400-μm crystal edges) is shown in Fig. 2_A_. This shows, first, that below 360° a larger rotation range (at constant total exposure) yields more diffracted photons per unit damage; and, second, that beyond around 180° of data collection, there is a significant advantage to be gained in offsetting the rotation and beam axes, with potential improvements in DDE of around 30%. In contrast, when the relative beam and crystal sizes are closer to one another, this effect is less pronounced, or even nonexistent. Fig. 2_B_ shows the results for similar simulations with the same beam size, but with a cube-shaped crystal of edge length 60 μm, and in this case the greatest improvement is for a 15-μm offset, and the larger offsets (> 25 μm) lead to a decrease in the DDE. This is because under these conditions the central region of the crystal is not effectively used, so that the edges must be excessively exposed to gain the same diffraction yield. Additional simulations for intermediate crystal sizes from 20 to 200 μm are shown in Fig. S2 as a reference for the experimenter. Based on the simulations, the following recommendations can be made, assuming a Gaussian beam profile:
- i) For crystals with size of the same order as the beam, there is little to be gained from offsetting, but it is worth noting that for a larger data-collection rotation angle, above around 180°, offsetting does improve the DDE.
- ii) For crystals with edges of lengths greater than 3× the beam FWHM, offsetting the crystal rotation axis by approximately 1 to 1.25 beam FWHM, and collecting for 360° or more can offer a 30% improvement in DDE, with larger improvements possible for larger crystals.
Fig. 2.
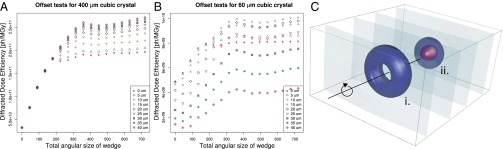
DDE simulations (A, B) and dose isosurface for the offset experiment (C). (A) DDE as a function of total rotational range and beam–rotation axis offset for a 400-μm edge crystal (20× the beam FWHM, which was 20 × 20 μm). Two things are to be noted: offsetting starts being advantageous after 180° and improves DDE significantly for rotation ranges greater than around 360°, and the maximum benefit is reached at around 25-μm offset, or 1.25 beam FWHM. (B) DDE against rotation angle for a 60-μm edge crystal (3× the beam FWHM). In this case, the benefits of offsetting are smaller, and too much offset can lead to a decrease in DDE due to inefficient use of the central region of the crystal. (C) Dose isosurface map for the experimental validation of the offset strategy (i) compared with the standard strategy (ii). Isosurfaces are at 0.1 (light blue), 5 (dark blue), and 10 MGy (red). Note how there is no 10-MGy isosurface for the offset strategy, despite a similar level of diffraction yield because this strategy results in a lower peak dose. This provides a visual explanation of how the offset strategy effectively increases the DDE.
Offset Experiment
A proof of concept experiment was performed to validate the results of these offset predictions. Using ESRF beamline ID14-4, a very large 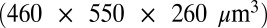 crystal of bovine pancreatic insulin was exposed in two locations with a beam of approximate size
 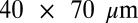 , vertical by horizontal (beam shape shown in Fig. S3). This large crystal, after a face on alignment with the minikappa goniometer (18, 19), allowed both strategies to be evaluated on the same crystal, minimizing any effect of nonisomorphism. A first 180° low-dose probe oe dataset (80-kGy whole dataset average of the imagewise DWD values) was taken in each of two positions, followed by a high-resolution high-dose dataset: in the first position, this was performed with the beam and rotation axes well aligned (“standard” strategy), and in the second, with them offset by 1.25 beam FWHM (50 μm). To have similar DWD for each of the high-dose datasets, the standard strategy was exposed for a total of 126 s, and the offset strategy for 162 s. A subsequent 180° probe oe dataset was then collected from each location to evaluate the damage state of the crystal after it had been subjected to the high-dose datasets. The dose for each wedge is shown in Table 2, highlighting how, compared with the well-aligned strategy, a 25% higher elastic yield, and 10% lower DWD can be achieved for the offset high-resolution and final probe oe dose sets, respectively. A dose isosurface map of the final dose state of the crystal is shown in Fig. 2_C_, demonstrating the effect of the offset strategy on the spatial distribution of dose.
Table 2.
Progression of dose for the offset experiment
| Wedge | Total time* (s) | Elastic yield (ph) | DWD (MGy) | AD-WC (MGy) | Maximum dose (MGy) |
|---|---|---|---|---|---|
| P1-S | 5.4 | 5.5 × 10¹⁰ | 0.08 | 0.02 | 0.75 |
| P1-O | 5.4 | 5.5 × 10¹⁰ | 0.08 | 0.04 | 0.75 |
| HD-O | 162 | 159 × 1010 | 1.86 | 0.58 | 7.89 |
| HD-S | 126 | 128 × 1010 | 2.00 | 1.01 | 18.4 |
| P2-S | 5.4 | 5.5 × 10¹⁰ | 3.81 | 1.03 | 19.1 |
| P2-O | 5.4 | 5.5 × 10¹⁰ | 3.44 | 1.05 | 19.1 |
The processed data, the statistics for which are presented in Table 3, show very comparable quality for the first probe oe in each position, as expected. Comparing the high-dose datasets, the offset strategy has significantly better high-resolution statistics, as shown by the _R_meas and  in the high-resolution shell (0.19 vs. 0.24 and 19.3 vs. 16.2, respectively). This is expected, because the offset strategy was exposed for 30% longer, and has a 25% higher diffraction yield. The radiation damage caused by the high-dose datasets is evaluated by the second probe oe datasets, where the relative diffraction efficiency
  is 0.79 for the second standard probe oe and 0.85 for the second offset probe oe, indicating that the radiation damage was actually lower in the more highly exposed offset position. Data-collection statistics for the second probe oe datasets in each position are fairly similar, with the notable exception of the high-resolution CC1/2, which is significantly better for the offset than the standard position: 0.79 vs. 0.597, revealing another potential data quality advantage of more effective dose spreading.
Table 3.
Data-collection statistics for the offset experiments
| Wedge | _R_meas | Total observations | Total unique | Completeness (%) | Mean  |
_CC_1/2 | Multiplicity |
|---|---|---|---|---|---|---|---|
| P1-S | 0.055 (0.51) | 286,835 (10,686) | 13,850 (622) | 99.5 (92.1) | 32.0 (6.2) | 0.999 (0.956) | 20.7 (17.2) |
| P1-O | 0.063 (0.472) | 286,324 (10,311) | 13,995 (612) | 99.3 (90.1) | 29.3 (6.5) | 0.999 (0.962) | 20.5 (16.8) |
| HD-O | 0.069 (0.194) | 533,285 (21,417) | 13,266 (641) | 95.3 (93.7) | 49.8 (19.3) | 0.998 (0.995) | 40.2 (33.4) |
| HD-S | 0.066 (0.239) | 543,159 (21,351) | 13,482 (632) | 96.6 (92.8) | 47.7 (16.2) | 0.999 (0.990) | 40.3 (33.8) |
| P2-S | 0.061 (1.24) | 292,034 (10,717) | 14,113 (637) | 99.3 (89.5) | 26.4 (2.9) | 1.00 (0.597) | 20.7 (16.8) |
| P2-O | 0.062 (1.312) | 289,768 (103,83) | 14,095 (621) | 99.4 (89.8) | 25.7 (2.8) | 1.00 (0.790) | 20.6 (16.7) |
Discussion
The current DWD model operates under the first-order assumption that a unit volume contributes to the diffraction in proportion to how much it is exposed, irrespective of its current dose state; i.e., with a constant diffraction efficiency throughout the experiment. Although elastic yield—diffraction plus diffuse scatter—is independent of damage state (radiation damage cannot change the fundamental elastic cross-sections of atoms), the diffraction from a unit volume will decay with increasing dose due to global damage effects (20). In the high-dose limit, a unit volume contributes only background, and no diffraction (21). The constant diffraction efficiency model used here appears robust for the higher  range of damage states associated with biological fidelity. This is demonstrated by the consistent behavior of
  across the three highly different dose contrast regimes used in the systematic study.
Using this result, the strategies used in the offset experiments were designed to lead to similar final DWD states, and thus similar values of  . In the experiment, the
  for the second probe oe in the offset position was 0.85, and the second probe oe in the standard position 0.79. The offset strategy thus not only allowed the crystal to be exposed to more photons, but also reduced the final damage state, exceeding our expectations. Scatter in
  values can be due to intrinsic variation in crystal quality (22), which was mitigated in our systematic study by using a large number of crystals (15) to average out these effects. Another explanation for the
  scatter could be that the current weighting scheme used for DWD does not fully model the subtle effects due to inhomogeneous dose distribution such as a spatially uneven loss of diffraction efficiency or differential unit cell expansion in areas of higher and lower dose. A possible manifestation of this is the significantly better outer shell _CC_1/2 found in the offset second probe oe, which could be due to the more homogeneous dose profile giving more consistent data quality, leading to a higher half-dataset correlation.
The work presented here has relied upon morphologically optimized crystals, and for the routine use of these concepts, online 3D imaging of the crystal and 2D imaging of the beam will be needed. Crystal-imaging techniques have been achieved at a proof of concept level (23, 24), and the technology for routine 2D beam profiles already exists at many synchrotrons, because it is required to characterize the beam. DWD provides an important and immediate application for these technologies, and thus further motivates their routine implementation.
The next generation of MX strategy and data-processing pipelines will be able to make use of more precise goniometry and effective 3D profiling of the crystal (16, 23) to experimentally restrain parameters that have historically been refined empirically during data processing. DWD is an example of the power of a more macroscopic description of the MX experiment, and the current form of DWD has been shown to effectively allow the modeling of intensity loss independent of strategy choice and beam profile: it is thus a powerful way to assign a “dose” number to any image in any given MX experiment. Combined with an image-by-image estimate of the elastic yield, this could prove a pathway toward experimentally restraining the scaling of multiple images into a single set of reflection intensities, which is a key part of the MX pipeline (25).
DWD not only allows predictive modeling of crystal X-ray lifetime, but by using DDE as an optimization metric, it also allows effective comparisons of multiple putative strategies under different beam conditions, enabling the amount of diffraction that can be achieved from a limited volume of well-diffracting crystal to be maximized. This has been demonstrated with an offset strategy example, where it was possible to use a 30% higher exposure time, leading to 25% higher diffraction yield, better data-processing statistics, and lower final damage state. The better-than-expected final damage state shows that our predictions based on DDE are conservative, and that with more refinement of the weighting scheme, it may be possible to achieve even higher levels of improvement in the efficient use of precious crystal volume.
These results represent a major advance in long-term efforts to use the information output from improved instrumentation developed over the last decade to better inform data collection and analysis. By allowing the predictive calculation of radiation damage, and enabling the efficiency of various strategies to be compared, DWD presents a vital step toward eliminating radiation damage as a cause of failure in structure solution.
Materials and Methods
Crystallization.
Crystals of bovine pancreatic insulin were grown by the hanging-drop vapor diffusion method, with a well solution of 0.425 M Na2HPO4 at pH 10.4. These conditions were highly optimized to produce morphologically cuboid crystals. Protein drops were made up of 4 μL 12.5 mg/mL insulin in 0.02 M Na2HPO4 and 0.01 M Na3 EDTA, added to 4-μL well solution. Crystals grew in 24–36 h. Morphologically suitable crystals larger than 100 μm3 in size from the population of platelike and cubic crystals were selected, and cryoprotected for 2 min in a solution of identical concentration to that of the well solution, but with 30% vol/vol glycerol substituted for water, before being flash cooled in liquid nitrogen.
Dose Calculation.
Doses were calculated using raddose-3D (12), with additional functionality added to output DWD, and to handle the explicit experimentally measured profile of the beam of 13.2-keV photons. Two-dimensional beam profiling was carried out on ESRF beamline ID14-4 using a high-speed online 8-bit CCD detector with an effective pixel size of 5 μm, combining a SONY XC-HR50 camera with a scintillator directly in the beam path, placed in front of the ADSC Q315r diffraction detector, to provide a quantitative map of the beam profile in a portable graymap file. Absolute values of the flux were obtained using an in-line silicon diode (diode i1) located downstream of the slits and the shutter, before the sample, which measures the flux indirectly via the current produced by electron emission from a 25-μm-thick aluminum foil placed in-line at 45° to the beam (17). The flux calibration was verified against the 500-μm-thick silicon diode used for its original calibration (26), placed in the sample position, and found to be in good agreement. Measurements of _I_1 were subsequently recorded both before and after each crystal was irradiated, and experiments were timed so that they did not take place during a storage ring top-up, ensuring consistent levels of flux throughout. The minikappa goniometer available on ID14-4, and the Strategy for Aligning Crystals software (19) was used to reorient the morphologically cuboid crystals either so that they were face on, or so that the orientation angles input to raddose-3D could be determined by inspection of several online microscope images. A new version of raddose-3D (v1.1), outputting DWD, is available on request from the corresponding author.
Experimental Validation of DWD.
The probe datasets were low-dose full datasets collected over the same 60° angular range. Burn exposures were high-dose single 360° images. Total exposure time per probe wedge was at least 15 times less than per burn image for all beam conditions. Data were processed using the Collaborative Computational Project No. 4 suite (27) with a standardized script being used to call each program for maximum control over data-processing parameters, ensuring identical treatment of all crystals. Mosflm (28) was run manually, with the space group set to I213, and an identical orientation matrix and starting parameters throughout the processing of data for all datasets from that particular crystal. Postrefinement and integration were then performed for each probe dataset. After sorting with sortmtz, the data were scaled using scala (25), with a resolution limit of 1.8 Å in all cases. A small number of the high-dose datasets failed to process when certain errors exceeded the thresholds used by mosflm or scala. These were omitted from the subsequent analysis to ensure that all full datasets were processed in an identical fashion. Data processing statistics for all 15 crystals can be found in Tables S1, S2, and S3. Relative B factors were calculated separately by merging all of the output files from ctruncate using cad, then scaling together these internally scaled datasets using scaleit to give relative isotropic B factors. R (www.r-project.org) was used to generate plots and to perform statistical analyses. Values of _D_1/2 and S AD were calculated by performing a linear fit on the data from all datasets for each beam condition that had an I n/_I_1 value above 0.4.
Offset Simulations.
Simulations were performed in raddose-3D (12) with a Gaussian beam of 20 × 20 μm2 FWHM, collimated to 40 × 40 μm2, with a crystal resolution of 2 μm per pixel edge. Wedges were calculated for a total angular range 0°–720° in steps of 45° (i.e., 0°–45°, 0°–90°, 0°–135°, etc.), with beam offsets of 0–40 μm (0–2 times the beam FWHM), in steps of 5 μm (0.25 FWHM). The simulations were then run for cubic crystals with edges of length 20–400 μm (1 to 5 FWHM), in steps of 20 μm for 20–100 μm, plus 200 and 400 μm. Default absorption and attenuation coefficients based on an average crystal composition at 12.4 keV were used, along with a nominal flux of 5 × 10¹¹ ph/s. Results, presented as fractions of beam FWHM, can then be applied to any general beam–crystal size combination.
Offset Experiment.
The probe oe datasets comprised 180 nonoffset 1° images, separated along the goniometer axis by 273 μm, with the beam attenuated to 0.43 × 10¹² ph/s. All data were collected at beamline ID14-4 at the ESRF. The high-dose datasets comprised 720 sequential 0.5° images, to a total of 126 s for the standard, and 162 s for the offset strategy, with the beam at 1.4 × 10¹² ph/s. Times were set to create approximately equal total DWD for each of the high-resolution datasets. A second set of probe oe datasets was subsequently collected. Data were integrated in mosflm, then scaled with the resolution range fixed to 1.45–40 Å using aimless.
Supplementary Material
Supporting Information
Acknowledgments
The authors thank Markus Gerstel for his great assistance in the development of the program raddose-3D, and Arwen Pearson for valuable discussions during the development of this work. O.B.Z. was funded by a studentship through the University of Oxford Engineering and Physical Sciences Research Council Life Science Interface Doctoral Training Centre. J.M.H. is funded by the National Institutes of Health (GM073210, GM082250, and GM094625) and the Department of Energy:Integrated Diffraction Analysis Technologies Contract DE-AC02-05CH11231 with Lawrence Berkeley National Laboratory. Beamtime at ESRF ID14-4 was provided through the Radiation Damage Block Allocation Group.
Footnotes
The authors declare no conflict of interest.
*This Direct Submission article had a prearranged editor.
References
- 1.Garman EF. Radiation damage in macromolecular crystallography: What is it and why should we care? Acta Crystallogr D Biol Crystallogr. 2010;66(Pt 4):339–351. doi: 10.1107/S0907444910008656. [DOI] [PMC free article] [PubMed] [Google Scholar]
- 2.Chruszcz M, Wlodawer A, Minor W. Determination of protein structures—A series of fortunate events. Biophys J. 2008;95(1):1–9. doi: 10.1529/biophysj.108.131789. [DOI] [PMC free article] [PubMed] [Google Scholar]
- 3.Monaco S, et al. Automatic processing of macromolecular crystallography X-ray diffraction data at the ESRF. J Appl Cryst. 2013;46(Pt 3):804–810. doi: 10.1107/S0021889813006195. [DOI] [PMC free article] [PubMed] [Google Scholar]
- 4.Chapman HN, et al. Femtosecond X-ray protein nanocrystallography. Nature. 2011;470(7332):73–77. doi: 10.1038/nature09750. [DOI] [PMC free article] [PubMed] [Google Scholar]
- 5.Lomb L, et al. Radiation damage in protein serial femtosecond crystallography using an x-ray free-electron laser. Phys Rev B. 2011;84(21):214111. doi: 10.1103/PhysRevB.84.214111. [DOI] [PMC free article] [PubMed] [Google Scholar]
- 6.Owen RL, Rudiño-Piñera E, Garman EF. Experimental determination of the radiation dose limit for cryocooled protein crystals. Proc Natl Acad Sci USA. 2006;103(13):4912–4917. doi: 10.1073/pnas.0600973103. [DOI] [PMC free article] [PubMed] [Google Scholar]
- 7.Leal RM, Bourenkov G, Russi S, Popov AN. A survey of global radiation damage to 15 different protein crystal types at room temperature: A new decay model. J Synchrotron Radiat. 2013;20(Pt 1):14–22. doi: 10.1107/S0909049512049114. [DOI] [PMC free article] [PubMed] [Google Scholar]
- 8.Kmetko J, Husseini NS, Naides M, Kalinin Y, Thorne RE. Quantifying X-ray radiation damage in protein crystals at cryogenic temperatures. Acta Crystallogr D Biol Crystallogr. 2006;62(Pt 9):1030–1038. doi: 10.1107/S0907444906023869. [DOI] [PubMed] [Google Scholar]
- 9.Leal RMF, et al. Experimental procedure for the characterization of radiation damage in macromolecular crystals. J Synchrotron Radiat. 2011;18(Pt 3):381–386. doi: 10.1107/S0909049511002251. [DOI] [PMC free article] [PubMed] [Google Scholar]
- 10.Krojer T, von Delft F. Assessment of radiation damage behaviour in a large collection of empirically optimized datasets highlights the importance of unmeasured complicating effects. J Synchrotron Radiat. 2011;18(Pt 3):387–397. doi: 10.1107/S0909049511008235. [DOI] [PMC free article] [PubMed] [Google Scholar]
- 11.Zeldin OB, Gerstel M, Garman EF. Optimizing the spatial distribution of dose in X-ray macromolecular crystallography. J Synchrotron Radiat. 2013;20(Pt 1):49–57. doi: 10.1107/S0909049512044706. [DOI] [PubMed] [Google Scholar]
- 12.Zeldin OB, Gerstel M, Garman EF. RADDOSE-3D: Time- and space-resolved modelling of dose in macromolecular crystallography. J Appl Cryst. 2013;46(4):1225–1230. [Google Scholar]
- 13.Murray JW, Garman EF, Ravelli RBG. X-ray absorption by macromolecular crystals: The effects of wavelength and crystal composition on absorbed dose. J Appl Cryst. 2004;37:513–522. [Google Scholar]
- 14.Paithankar KS, Owen RL, Garman EF. Absorbed dose calculations for macromolecular crystals: Improvements to RADDOSE. J Synchrotron Radiat. 2009;16(Pt 2):152–162. doi: 10.1107/S0909049508040430. [DOI] [PubMed] [Google Scholar]
- 15.Paithankar KS, Garman EF. Know your dose: RADDOSE. Acta Crystallogr D Biol Crystallogr. 2010;66(Pt 4):381–388. doi: 10.1107/S0907444910006724. [DOI] [PMC free article] [PubMed] [Google Scholar]
- 16.Evans G, Axford D, Waterman D, Owen RL. Macromolecular microcrystallography. Crystallogr Rev. 2011;17:105–142. [Google Scholar]
- 17.McCarthy AA, et al. A decade of user operation on the macromolecular crystallography MAD beamline ID14-4 at the ESRF. J Synchrotron Radiat. 2009;16(Pt 6):803–812. doi: 10.1107/S0909049509035377. [DOI] [PMC free article] [PubMed] [Google Scholar]
- 18.Brockhauser S, Ravelli RBG, McCarthy AA. The use of a mini-κ goniometer head in macromolecular crystallography diffraction experiments. Acta Crystallogr D Biol Crystallogr. 2013;69(Pt 7):1241–1251. doi: 10.1107/S0907444913003880. [DOI] [PMC free article] [PubMed] [Google Scholar]
- 19.Brockhauser S, White KI, McCarthy AA, Ravelli RBG. Translation calibration of inverse-kappa goniometers in macromolecular crystallography. Acta Crystallogr A. 2011;67(Pt 3):219–228. doi: 10.1107/S0108767311004831. [DOI] [PMC free article] [PubMed] [Google Scholar]
- 20.Meents A, Gutmann S, Wagner A, Schulze-Briese C. Origin and temperature dependence of radiation damage in biological samples at cryogenic temperatures. Proc Natl Acad Sci USA. 2010;107(3):1094–1099. doi: 10.1073/pnas.0905481107. [DOI] [PMC free article] [PubMed] [Google Scholar]
- 21.Blake C, Phillips D. Effects of X-irradiation on single crystals of myoglobin. In: Eklund S, editor. Proceedings of the Symposium on the Biological Effects of Ionizing Radiation at the Molecular Level. Vienna: International Atomic Energy Agency; 1962. pp. 183–191. [Google Scholar]
- 22.Pozharski E. On the variability of experimental data in macromolecular crystallography. Acta Crystallogr D Biol Crystallogr. 2012;68(Pt 9):1077–1087. doi: 10.1107/S0907444912020100. [DOI] [PMC free article] [PubMed] [Google Scholar]
- 23.Brockhauser S, Di Michiel M, McGeehan JE, McCarthy AA, Ravelli RBG. X-ray tomographic reconstruction of macromolecular samples. J Appl Cryst. 2008;41:1057–1066. [Google Scholar]
- 24.Khan I, et al. Confocal microscopy on the beamline: Novel three-dimensional imaging and sample positioning. J Appl Cryst. 2012;45(Pt 5):936–943. doi: 10.1107/S002188981203470X. [DOI] [PMC free article] [PubMed] [Google Scholar]
- 25.Evans P. Scaling and assessment of data quality. Acta Crystallogr D Biol Crystallogr. 2006;62(Pt 1):72–82. doi: 10.1107/S0907444905036693. [DOI] [PubMed] [Google Scholar]
- 26.Owen RL, Holton JM, Schulze-Briese C, Garman EF. Determination of X-ray flux using silicon pin diodes. J Synchrotron Radiat. 2009;16(Pt 2):143–151. doi: 10.1107/S0909049508040429. [DOI] [PMC free article] [PubMed] [Google Scholar]
- 27.Winn MD, et al. Overview of the CCP4 suite and current developments. Acta Crystallogr D Biol Crystallogr. 2011;67(Pt 4):235–242. doi: 10.1107/S0907444910045749. [DOI] [PMC free article] [PubMed] [Google Scholar]
- 28.Leslie A, Powell H. In: Evolving Methods for Macromolecular Crystallography. NATO Science Series. Read R, Sussman J, editors. Vol 245. The Netherlands: Springer, Houten; 2007. pp. 41–51. [Google Scholar]
Associated Data
This section collects any data citations, data availability statements, or supplementary materials included in this article.
Supplementary Materials
Supporting Information