Quantitative Analysis of rRNA Modifications Using Stable Isotope Labeling and Mass Spectrometry (original) (raw)
Abstract
Post-transcriptional RNA modifications that are introduced during the multistep ribosome biogenesis process are essential for protein synthesis. The current lack of a comprehensive method for a fast quantitative analysis of rRNA modifications significantly limits our understanding of how individual modification steps are coordinated during biogenesis inside the cell. Here, an LC-MS approach has been developed and successfully applied for quantitative monitoring of 29 out of 36 modified residues in the 16S and 23S rRNA from Escherichia coli. An isotope labeling strategy is described for efficient identification of ribose and base methylations, and a novel metabolic labeling approach is presented to allow identification of MS-silent pseudouridine modifications. The method was used to measure relative abundances of modified residues in incomplete ribosomal subunits compared to a mature 15N-labeled rRNA standard, and a number of modifications in both 16S and 23S rRNA were present in substoichiometric amounts in the preribosomal particles. The RNA modification levels correlate well with previously obtained profiles for the ribosomal proteins, suggesting that RNA is modified in a schedule comparable to the association of the ribosomal proteins. Importantly, this study establishes an efficient workflow for a global monitoring of ribosomal modifications that will contribute to a better understanding of mechanisms of RNA modifications and their impact on intracellular processes in the future.
Introduction
Post-transcriptional RNA modifications are ubiquitous in biology, with more than 100 different types being found in cellular RNAs, including tRNA, rRNA (rRNA), small nuclear RNA, and mRNA. rRNA is the most abundant noncoding RNA inside the cell, bearing from 10 to 200 RNA methylations and pseudouridines depending on the species. The ribosomes from Escherichia coli have a total of 36 modified nucleotides resulting from the action of at least 29 known protein enzymes (22 methyltransferases and 7 pseudouridine synthases) that carry out site-specific modifications (Table 1).1 Based on a few studies investigating the functional role of individual rRNA modifications, they are generally considered to stabilize local structure of the ribosome, affect its translational activity and modulate antibiotic drug resistance.2 While providing selective benefits for cell-survival, many of the rRNA modification enzymes found in bacteria and yeast are dispensable. In higher organisms, however, deficiency in a single modified nucleoside can cause severe morphological defects and embryonic lethality.3 Moreover, deficiency or mutations in small nucleolar RNA genes, guiding rRNA modifications in eukaryotes, have been implicated in congenital diseases4,5 and different types of cancer in humans.6,7
Table 1. E. coli ribosomal RNA Modifications and Modification Enzymes.
| modification | enzyme | substrateb | seen by LC-MSc |
|---|---|---|---|
| 16S RNAa | |||
| Ψ (516) | RsuA | 30S | +++ |
| m7G(527) | RsmG | 30S | +++ |
| m2G(966) | RsmD | 30S or 16S+S7+S19 | +++ |
| m5C(967) | RsmB | 16S | +++ |
| m2G(1207) | RsmC | 30S | +++ |
| m4C(1402) | RsmH | 30S | +++ |
| Cm(1402) | RsmI | 30S | |
| m5C (1407) | RsmF | 30S | +++ |
| m3U(1498) | RsmE | 30S | +++ |
| m2G(1516) | RsmJ | 30S | +++ |
| m62A(1518) | RsmA | 30S | +++ |
| m62A(1519) | RsmA | 30S | +++ |
| 23S RNAa | |||
| m1G(745) | RlmA | 23S | +++ |
| Ψ (746) | RluA | 23S | +++ |
| m5U(747) | RlmC | unknown | +++ |
| Ψ (955) | RluC | 23S | – |
| m6A(1618) | RlmF | partially deproteinized 50S | +++ |
| m2G(1835) | RlmG | 23S | +++ |
| Ψ (1911) | RluD | 50S | +++ |
| m3Ψ(1915) | RluD | 50S | +++ |
| RlmH | 70S | ||
| Ψ (1917) | RluD | 50S | +++ |
| m5U(1939) | RlmD | 23S | +++ |
| m5C(1962) | RlmI | 23S | +++ |
| m6A(2030) | RlmJ | 23S | +++ |
| m7G(2069) | RlmKL | 23S | ++ |
| Gm(2251) | RlmB | unknown | +++ |
| m2G(2445) | RlmKL | 23S | + |
| hU(2449) | unknown | unknown | + |
| Ψ (2457) | RluE | unknown | – |
| Cm(2498) | RlmM | 23S | +++ |
| ho5C(2501) | unknown | unknown | +++ |
| m2A(2503) | RlmN | 23S | +++ |
| Ψ (2504) | RluC | 23S | +++ |
| Um(2552) | RlmE | 50S | +++ |
| Ψ (2580) | RluC | 23S | – |
| Ψ (2604) | RluF | unknown | – |
| Ψ (2605) | RluB | unknown | – |
The bacterial ribosome is a complex macromolecular machine consisting of the small (30S) and large (50S) subunits, in which core rRNA components 16S and 23S, respectively, are bound to a total of 54 ribosomal proteins. The modification of rRNA is carried out during the ribosome biogenesis process where it is coupled to a series of steps, including rRNA folding, binding of ribosomal proteins, and RNA processing. These steps are tightly coordinated in space and time to produce accurate and efficient protein synthesis machinery, essential for growth and division of every living cell.
The complete set of methyltransferases and pseudouridine synthases have been successfully identified in E. coli. Using recombinant modification enzymes, their substrate specificity has been characterized in vitro (Table 1), demonstrating that some enzymes prefer naked rRNA (16S or 23S),8,9 while others modify the assembled subunits (30S, 50S)10−13 or even complete ribosomes (70S)13 (Table 1). Despite recent progress in biochemical and structural characterization of rRNA modifying enzymes, how individual rRNA modification steps are integrated into the entire ribosome biogenesis process is poorly understood. One of the main reasons that mechanistic studies of rRNA modifications inside the cell remain limited is that accurate and efficient detection and quantification of post-transcriptional modifications are technically difficult.
Historically, discovery and localization of the new RNA modifications have been carried out using a reverse transcriptase primer extension technique, relying on premature stops of the enzyme at the modified site of interest.14 The major disadvantage of this method is that it is not amenable to quantitative analysis. Additionally, many known modifications (e.g., pseudouridine, 5-methylcytosine, 7-methylguanine) do not generate a reverse transcriptase stop, requiring modification-specific chemical derivatization.14 Another approach is based on P1 nuclease digestion of RNA with subsequent TLC or HPLC separation of the resulting nucleotide products.15,16 Taking advantage of different migration of modified and unmodified residues, radio labeling or UV detection is then used to measure their relative stoichiometry. Recently, this technique was applied to analyze E. coli rRNA modifications present in incompletely assembled ribosomal particles that accumulated as a result of antibiotic treatment.16 In this study, however, reliable quantitative characterization was obtained only for those modified nucleosides which were resolved as individual chromatographic peaks. Furthermore, the method was not suitable for analysis of nonunique modifications, found at two or more positions in the 16S or 23S RNA molecule.
Mass spectrometry has recently become practical for oligonucleotide analysis and in the last 10 years has played a primary role in the identification of new post-transcriptional modifications.17−19 A bottom-up approach, in which nucleotide-specific ribonucleases (RNase T1, A) produce RNA fragments of the size amenable for MALDI or LC-MS detection, has been widely used.20,21 Furthermore, applicability of tandem MS analysis to RNA has been demonstrated providing sequence characterization of oligonucleotide fragments.22 Despite these successes, MS detection of pseudouridines remains a big challenge in the field. To distinguish pseudouridine from its structural isomer uridine, protocols based on chemical derivatization of pseudouridines with acrylonitrile23 and carbodiimide24 reagents have been reported. While these approaches have been useful to identify new pseudouridines,17 incomplete or nonspecific derivatization was often observed and would likely complicate pseudouridine quantification. In addition, several laboratories took advantage of the tandem MS to design a method for identification and reference free quantitative profiling of pseudouridines via pseudouridine specific fragmentation products.25,26 Furthermore, to our best knowledge, there are only a few published studies where MS was applied for quantitative analysis of RNA.27,28 The most recent work describes a convenient workflow for identification and relative quantification of RNA using stable isotope labeling with 15N.28 By combining the light (14N) and heavy (15N) rRNA isolated from E. coli, the authors reliably identified nucleolytic fragments bearing all known base and ribose methylated residues in 16S RNA. In summary, existing technologies and approaches for MS analysis of RNA provide an excellent platform for development of new applications which would enable mechanistic studies of RNA modifications inside living cells.
Our laboratory has utilized stable isotopic labeling and quantitative MS (qMS) analysis of ribosomal proteins to characterize the ribosome assembly process in vitro and in vivo.29,30 In these analyses, protein identification and quantitation were based on finding unique pairs of 14N- and 15N-labeled peptides from a tryptic digest of ribosomal proteins. A robust and powerful least-squares Fourier transform convolution (LS-FTC) method was introduced to fit observed isotope distributions from each of the nitrogen species, providing relative quantitation with exceptional precision.31 The present study expands this qMS framework to establish a tool for a global monitoring of RNA modifications in bacterial ribosomes. Modifications are profiled via their signature nucleolytic fragments using 14N and 15N masses for their identification. In conjunction with new metabolic labeling strategies introduced for analysis of RNA methylations and pseudouridines, 80% of all modified nucleotides in the rRNA of E. coli were identified and quantified. The method was applied to measure relative levels of rRNA modifications present in the distribution of preribosomal particles in an E. coli cell lysate. The data reveal groups of RNA residues that are modified at different points during assembly, providing new insights into the global picture of ribosome biogenesis in bacteria. In general, the proposed method should be applicable for quantitative analysis of rRNA and other RNA modifications in a wide variety of systems, to better understand RNA modification processes, their functions, and their implication in diseases.
Experimental Procedures
Cell Cultures, Metabolic Labeling and rRNA Isolation
E. coli MRE-600 cultures were grown at 37 °C in M9 minimal medium supplemented with trace amounts of vitamins and minerals. Cells were grown to midexponential phase with _A_600 reaching 0.5–0.8. Cells were chilled by adding ice directly to the culture, then harvested by centrifugation. Cell lysis was carried out using a Mini-BeadBeater (Biospec Products) in nondissociating buffer A (10 mM MgCl2, 100 mM NH4Cl, 20 mM Tris-HCl (pH = 7.8), 0.5 mM EDTA, 6 mM 2-mercaptoethanol), and cell debris was removed by two consecutive rounds of centrifugation. Ribosomal particles were separated by loading cell lysate on top of a 10–40% (w/w) sucrose gradient, prepared in buffer A, and centrifugation of the gradient in a SW-32 rotor (Beckman Coulter) at 26 000 rpm for 18 h at 4 °C. After gradient fractionation using _A_260 detection, rRNA from each individual fraction was extracted using Trizol reagent (Invitrogen) and isopropanol precipitated in the presence of 20 μg/mL of glycogen. RNA pellets were redissolved in DEPC treated water and additionally purified by dialysis or by rapid spin filtration using Amicon Ultra 30K MWCO columns (Millipore). RNA samples were stored frozen in water at −20 °C or lyophilized.
In a similar manner, 15N-labeled ribosomes were prepared for use as an external standard in MS experiments, by cell growth in M9 minimal medium with 0.5 g/L 15N-ammonium sulfate as the nitrogen source. Cell lysis was carried out in Buffer B (1 mM MgCl2, 100 mM NH4Cl, 20 mM Tris-HCl (pH = 7.8), 0.5 mM EDTA, 6 mM 2-mercaptoethanol) with a low Mg2+ concentration to dissociate ribosomal subunits and prevent their reassociation during ultracentrifugation. Sucrose fractions containing separated 30S and 50S particles were analyzed using 1.2% agarose gel electrophoresis. Fractions containing pure 16S or 23S RNA were combined and processed as described above.
For metabolic labeling of rRNA methyl groups, cells were grown in the presence of 50 mg/L of CD3-methionine (Cambridge Isotope Laboratories). For metabolic labeling of pseudouridines, cells were grown in the presence of 25 mg/L 5,6-D-uracil (Cambridge Isotope Laboratories). Methionine (Δ_metA) and pyrimidine (Δ_pyrC) auxotrophs obtained from the Keio knockout collection32 were initially used to confirm rRNA labeling. A set of titration experiments using the Δ_pyrC_ strain was performed to determine the minimum required concentration of 5,6-D-uracil in the M9 medium. At 25 mg/L, uptake of 5,6-D-uracil was shown to inhibit de novo pyrimidine biosynthesis in the wild-type cells harvested at 0.5–0.8 A600, and MS peaks corresponding to unlabeled pyrimidines were not detected.
RNA MS
For LC-MS analysis, 10 pmol of rRNA sample was mixed with 15N-labeled 16S or 23S RNA isolated from 70S ribosomes, in an ∼1:1 molar ratio, based on A260 measurements. The rRNA mixture was suspended in 25 mM ammonium acetate (pH = 5.8) and then denatured at 90 °C for 3 min, followed by rapid cooling on ice. The RNA digestion reaction was carried out using one of three commercially available ribonucleases: RNase A (30 units), T1 (50 units), or U2 (1 unit) for 1 h at 55 °C in a 5 μL volume. Complete digestion with RNase T1 (cleaves at G) or RNase A (cleaves at U and C) resulted in rRNA fragments with 3′-phosphate termini and no missed cleavages. RNase U2 digestion was carried out using a limiting concentration of enzyme, resulting in partial cleavages of the phosphodiester backbone after A and G residues, with 0–2 missed cleavages and either 2′-3′-cyclic (∼70–80% of all observed) phosphate or 3′-linear phosphate termini. Digestion products were analyzed on Agilent Q-TOF G6520B or ESI-TOF G1969A mass spectrometers with an electrospray ionization source coupled to an Agilent-1100/1200 chromatography system. Nucleolytic fragments were separated on an XBridge C18 column (Waters) using buffer A (15 mM ammonium acetate, pH = 8.8) and buffer B (15 mM ammonium acetate, pH = 8.8 and 50% acetonitrile). HPLC separation consisted of the following steps: (1) isocratic elution with 1% buffer B for 5 min, (2) a linear gradient from 1% to 15% buffer B over 40 min, (3) column washing with 100% B for 25 min, and (4) column equilibration with 1% B for 30 min. Data were recorded over the 400–1700 m/z range using negative or positive ionization.
LC-MS Data Processing
An experimental peak list, obtained using Agilent Qualitative Analysis software, was compared against a theoretical digest containing predicted rRNA nucleolytic fragments and corresponding monoisotopic m/z values for both 14N- and 15N-labeled fragments. An in-house Perl script was used to generate a series of theoretical digest files to account for different ribonuclease cleavage patterns, isotope labeling strategies, and positive or negative ionization modes. A typical theoretical digest comprised nucleolytic fragments with both linear and cyclic phosphates at the 3′ terminus, up to 3 missed cleavages and charge states in the 1–4 range. Due to the high degree of sequence conservation between the seven E. coli rRNA operons, sequences of 23S and 16S from a single operon (rRNA) were used. For a singly modified oligonucleotide fragment, both modified and unmodified versions were included in the theoretical digest. When multiple modifications were present, all possible combinations of modifications were included in the digest. Assignment of 14N–15N peak pairs was performed by matching experimentally observed and predicted 14N and 15N m/z values, using a 50 ppm mass threshold for matching. Additionally, 14N and 15N peaks corresponding to the same rRNA fragment were required to elute within 0.1 min of each other and to exhibit the same charge state.
Peaks with multiple identities were excluded, unless the presence of a modified residue is suspected. Further analysis was carried out to confirm their identification, including fractional spike analysis, analysis of deletion strains for rRNA modifying enzymes, and metabolic labeling (Table S1). For each of the identified 14N–15N peak pairs, their isotope distributions, averaged over a 0.2 min retention time window, were extracted. Extracted mini-spectra were fit to theoretical isotope distributions using in-house software which implements a previously reported LS-FTC method.31 Resulting least-squares fits were visually inspected and filtered to eliminate data with low signal-to-noise ratio or spectral overlaps that are hard to resolve. The fit parameters for the 14N and 15N amplitudes were used for relative quantification of rRNA fragment levels in the 14N sample with respect to the 15N external standard. Fractional RNA levels (f) were calculated as f = _A_14/(_A_14 + _A_15), where _A_14 and _A_15 are peak amplitudes for the sample and the standard. Hierarchical clustering of the RNA modification and protein levels were carried out using Pearson correlation distance metric implemented in Gene Cluster 3.0 software,33 and the resulting dendrograms and heat maps were visualized using Java TreeView.34
Results
Quantitative MS Method for Monitoring of rRNA
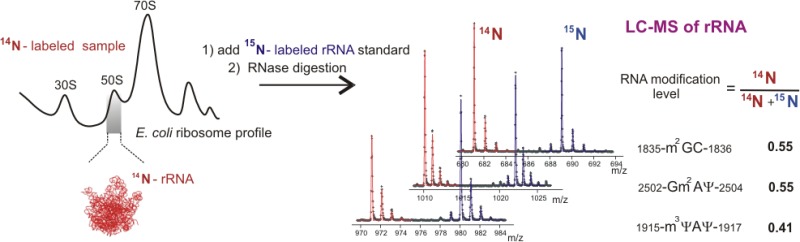
The workflow of the qMS approach used to detect and quantify rRNA modification is schematically illustrated in Figure 1. Briefly, bacterial cells are separately grown in minimal media supplemented with 14N- or 15N-labeled ammonium sulfate as the sole source of nitrogen. Using sucrose gradient ultracentrifugation (black traces, Figure 1), 70S ribosomes, 50S and 30S subunits, and preribosomal particles are isolated from the cell lysate, followed by rRNA extraction and purification. The 16S or 23S rRNA isolated from mature 15N-ribosomes is added as an external standard, and the combined mixture is digested with a nucleotide-specific ribonuclease T1, U2, or A prior to LC-MS analysis. Pairs of the co-eluting 14N- and 15N-labeled ribooligonucleotide fragments are identified by matching their experimentally observed masses and charge states to a theoretical digest of the rRNA sequence. After the LC-MS peak profiles are extracted, the isotope distributions are fitted using LS-FTC approach,31 and the resulting amplitudes are used for quantification. RNA level parameters are calculated for each of the uniquely identified fragments as a fraction of 14N isotopologue compared to the 15N standard.
Figure 1.
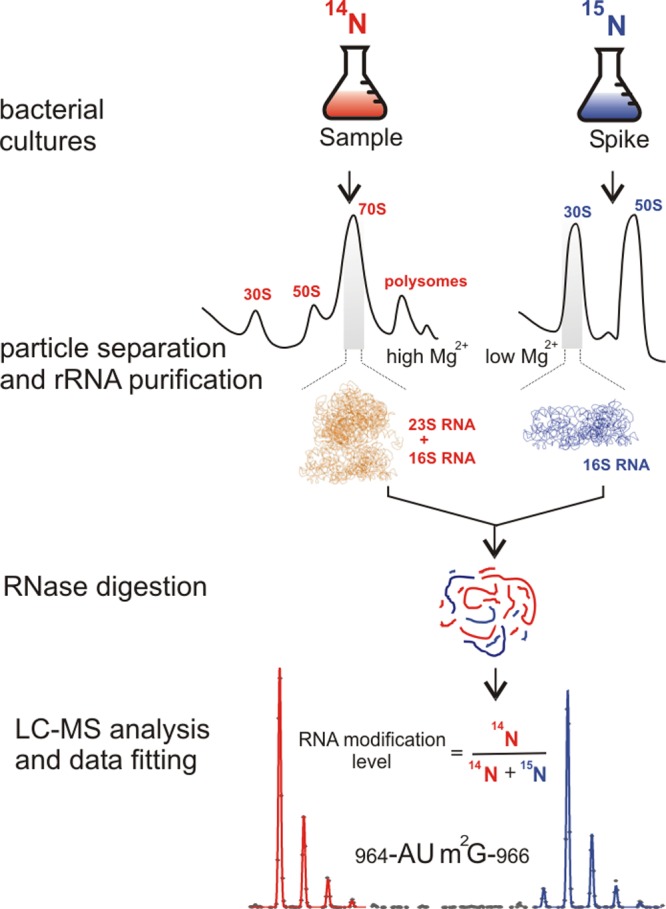
The qMS workflow for analysis of rRNA modifications. In a typical rRNA modification inventory experiment, rRNA isolated from a sample of interest (14N, red) is mixed with 15N-labeled external standard (blue), containing mature 16S or 23S rRNA. After ribonuclease cleavage, the mixture is submitted to LC-MS analysis. Pairs of 14N and 15N peaks are detected, and their masses are used for assignment. Experimental peaks are fitted to their theoretical isotope distributions, and obtained amplitudes are used to calculate the relative amounts of rRNA modifications present in the 14N-sample.
Qualitative and Quantitative Analysis of rRNA LC-MS Data
To illustrate the approach, a control experiment was performed where 14N- and 15N-labeled 16S RNA were mixed in a 1:1 ratio, and the fragments from T1 digestion were analyzed on an ESI-TOF instrument after a reverse-phase chromatographic separation. The LC-MS chromatogram exhibits over 150 14N–15N peak pairs co-eluting over 25 min of the LC gradient (Figure 2A). For instance, one of the signature 16S RNA fragments 1518-(m62A)(m62A)CCUG-1523 was found in two different charge-state isoforms, as shown in the red and cyan boxes in Figure 2A. High-resolution contour plots and raw data in the m/z dimension (Figure 2B) for the triply charged species show that isotopic envelopes of the 14N and 15N peaks are well resolved and that the LC-MS traces can be precisely fit using LS-FTC (green trace, Figure 2B).
Figure 2.

LC-MS separation and data fitting. Results of the control experiment in which 14N- and 15N-labeled and individually purified 16S RNA were mixed in a 1:1 molar ratio and digested with ribonuclease T1. (A) Low-resolution contour plot of the LC-MS run, showing pairs of the co-eluting 14N/15N rRNA fragments. Data were collected using negative ionization mode. (B) High-resolution LC-MS peak profiles (box 1), MS isotope distributions (red dots), and their least-squares fits (green traces) for a representative 16S fragment (box1 in A). (C) Ambiguity of peak identification as a function of the mass tolerance parameter (ppm). MS peaks were matched against the 16S theoretical digest (described in D), and the fraction of experimental peaks assignable to more than one rRNA fragment was calculated. Peak identification was carried out using m/z values for 14N-labeled fragments only (black); m/z for both 14N- and 15N-labeled fragments and assuming that fragments should elute within 0.1 min of each other (red); using 14N and 15N m/z and charge state (z) of the two species (blue). (D) Excerpt of the RNase T1 theoretical digest containing predicted 16S RNA fragments and their monoisotopic m/z values in the ‘vicinity’ of (m62A)(m62A)CCUG (gray box). Digest includes RNA species with charges 1–4, with 0–2 missed cleavages and either linear or cyclic (>p) phosphate at 3′ terminus. List is sorted by 14N m/z values. m – is a methyl group, >p – cyclic phosphate (otherwise linear), and * marks compositionally nonunique RNA fragments included as a single entry. (E) Histogram of RNA level values calculated for all 16S rRNA fragments identified in the control experiment.
To identify experimentally observed 14N–15N peak pairs, the masses were compared to the masses of the theoretically predicted 16S RNA fragments. Assignment based on matching monoisotopic m/z values for the 14N-labeled species alone may be insufficient, especially when mass accuracy is low or when a theoretical digestion list becomes more complex. For example, when mass accuracy of the MS instrument falls below ∼30 ppm, the 14N peak shown in Figure 2B can be assigned to either (m62A)(m62A)CCUG or ACGGGU (Figure 2D). However, the ambiguity of peak identification is reduced significantly when both 14N and 15N m/z values are considered. This is illustrated by Figure 2C, where the fraction of the experimental peaks with multiple possible identities as a function of the mass tolerance parameter is shown. The Agilent MS instruments used in this study routinely achieve mass accuracy in the 5–30 ppm range, which permits unambiguous identification of at least 99.7% of all 16S RNA peaks observed in the control experiment (Figure 2C, gray area). Additional MS/MS analysis could in principle be used to resolve compositional isomers that are frequently present in the rRNA digest (Figure 2D, marked by *). However, the limited number of modified fragments present in the rRNA digest makes MS/MS identification largely unnecessary for the purpose of identification and quantification of modifications. There were a few compositional ambiguities during assignment of the modified fragments, and several different approaches were used to confirm their identification (Figure S1 and Table S1).
In this work, a previously described LS-FTC method for analysis of proteomic data has been adapted for quantification of rRNA. Using sequence and isotope composition of the assigned RNA fragment, the theoretical mass spectrum is fit to the experimental data points, by varying baseline, mass offset, and the width and amplitude of the peaks.31 Since all the isotopic peaks in the 14N and 15N distributions contribute to the fit, LS-FTC delivers a high precision of quantification, and minor peak overlaps can be resolved. Furthermore, the method can be readily adapted to a variety of isotope labeling strategies. For instance, 15N peaks were fit using the 15N isotope enrichment as an adjustable parameter, and the resulting value of 99.3%, determined from multiple measurements, provided excellent fits to the data shown in Figure 2B. Finally, amplitudes of the 14N and 15N peaks (_A_14 and _A_15) resulting from least-squares fitting were used to calculate fractional RNA levels (f) for each identified 16S RNA fragment, where f = _A_14/(_A_14 + _A_15). The values were found to cluster tightly around the expected value of 0.5 (<_f_> = 0.52 ± 0.02), demonstrating accurate and reproducible quantification (Figure 2E).
Metabolic Labeling Approaches for Identification of rRNA Methylations and Pseudouridines
In E. coli rRNA, the majority of modified residues are base and ribose methylations and pseudouridinylations. Methylated nucleotides exhibit a distinct mass shift of 14 Da that makes them readily observable using MS, however, the pseudouridine substitutions are isobaric. To enable identification of pseudouridines and confirm assignment of the methylated rRNA fragments, 15N isotope labeling was combined with two new metabolic labeling approaches.
First, we demonstrated that rRNA methyl groups can be selectively deuterated by growing cells in the medium supplemented with CD3-methionine. Methionine serves as the precursor for the _S_-adenosyl-methionine, the cosubstrate and methyl group donor used by cellular methyltransferases. As a result, every rRNA fragment exhibited a characteristic +3 Da shift per methyl group in the MS spectrum (Figure 3A). The supplemental CD3-methionine concentration in the minimal medium was apparently sufficient to completely inhibit biosynthesis of unlabeled methionine, and the use of an methionine auxotrophic strain was not required to observe complete metabolic labeling of rRNA methyl groups.
Figure 3.

Metabolic labeling approaches for rRNA modifications analysis. CD3-methionine (A) and 5,6-D-uracil (B) labeling results in characteristic mass shifts for methylated and pseudouridinylated rRNA fragments. Mass spectra for 23S: 1915-(m3Ψ)AΨ-1917 fragment are shown. 23S 15N-labeled spike was prepared by growing cells in 15N-ammonium sulfate (red); in 15N-ammonium sulfate with CD3-14N-methionine (blue) or in 15N-ammonium sulfate with 5,6-D-14N-uracil (cyan) added to the M9 medium. Δ_N_ is the number of 15N-labeled nitrogen atoms. Isotope distributions were fitted using 99.3% of 15N isotope enrichment (red); 99.3% of 15N and 98.5% of D (cyan), as was determined empirically. Using CD3-14N-methionine, some amount of the methionine amino group was scrambled leading to a reduced fraction of 15N labeling, which was adjusted to 98.0% for 15N and 99.3% for D (blue).
Pseudouridine is a structural isomer of uridine, which significantly complicates their discrimination by MS. In the next set of experiments, we demonstrated that supplementing the minimal medium with 5,6-D-uracil results in complete labeling of rRNA pyrimidines with a characteristic +2 Da mass shift for every cytidine or uridine residue. In addition, metabolic labeling with 5,6-D-uracil enables observation of pseudouridines because the pseudouridylation reaction results in the exchange of the 5-deuteron with solvent, providing a convenient −1 Da mass shift that distinguishes uridine from pseudouridine (Figure 3B). Indeed, for a number of unique rRNA fragments where pseudouridine is found in the proximity of a methylated residue, the expected −1 Da mass shift per pseudouridine was observed. For example, the 14N mass for the metabolically labeled (m3Ψ)AΨ (976 Da, Figure 3B, cyan) is −2 Da compared to the calculated mass for (m3U)AU (978 Da, not observed), but +2 Da compared to the mass of unlabeled (m3Ψ)AΨ (974 Da, Figure 3B, red).
Overall, by carrying out these metabolic labeling experiments using 16S and 23S RNA we confirmed identification of the methylated fragments based initially on 14N/15N m/z measurements and, most importantly, identified a number of fragments bearing pseudouridines. The comprehensive summary on MS identification of modified rRNA fragments that were systematically observed in this study is given in Table 2. Combining results from different RNase treatments, RNA fragments 2–11 nucleotides long were obtained. Notably, some modifications can be monitored using only one enzyme (e.g., 16S: m2G(1207) and 23S: m5C(1962)), while others can be analyzed independently using two or three nucleases. Furthermore, due to the high density of the modified residues in certain regions of the 16S and 23S RNA, a number of observed fragments bear multiple modifications. Thus, in 16S RNase A product 1513-AGG(m2G)G(m62A)(m62A)C-1520, m2G(1516) is physically linked to modified nucleotides m62A(1518) and m62A(1519).
Table 2. 16S and 23S Nucleolytic Fragments Used in Analysis of Ribosomal Modifications.
| modification | RNase | sequencea | observed 14N m/zb | Δ15Nc | ΔCD3c | Δ5,6-Dc |
|---|---|---|---|---|---|---|
| 16S RNA | ||||||
| Ψ(516) | T1 | 516-ΨG-517 * | 670.098 | +7 | +0 | –1 |
| A | 515-GΨ-516 * | 670.100 | +7 | +0 | –1 | |
| U2 | 516-ΨG > p-517 * | 652.081 | +7 | +0 | –1 | |
| m7G(527) | T1 | 525-CC(m7G)CG-529 | 819.637 | +19 | +3 | +0 |
| A | 527-(m7G)C-528 * | 683.130 | +8 | +3 | +0 | |
| U2 | 524-GCC(m7G)>p-527 | 658.112 | +16 | +3 | +0 | |
| m2G(966), m5C(967) | T1 | 964-AU(m2G)-966 * | 507.087 | +12 | +3 | +0 |
| T1 | 967-(m5C)AACG-971 | 823.645 | +21 | +3 | –1 | |
| A | 966-(m2G)(m5C)-967 * | 697.145 | +8 | +6 | –1 | |
| U2 | 965-U(m2G)>p-966 * | 666.102 | +7 | +3 | +0 | |
| U2 | 967-(m5C)AA > p-969 | 489.589 | +13 | +3 | –1 | |
| m2G(1207) | A | 1206-G(m2G)C-1208 | 514.593 | +13 | +3 | +0 |
| m4Cm(1402) | T1 | 1402-(m4Cm)CCG-1405 | 436.416 | +14 | +6 | +0 |
| U2 | 1402-(m4Cm)CCG > p-1405 | 645.112 | +14 | +6 | +0 | |
| m5C(1407) | T1 | 1406-U(m5C)ACACCAUG-1415 | 1066.511 | +36 | +3 | –1 |
| U2 | 1406-U(m5C)A > p-1408* | 478.082 | +10 | +3 | –1 | |
| m3U(1498) | T1 | 1498-(m3U)AACAAG-1504 | 1153.190 | +30 | +3 | +0 |
| A | 1497-G(m3U)AAC-1501 | 824.138 | +20 | +3 | +0 | |
| U2 | 1498-(m3U)AA > p-1500 | 979.152 | +12 | +3 | +0 | |
| m2G(1516), m62A(1518), m62A(1519) | T1 | 1518-(m62A)(m62A)CCUG-1523 | 997.683 | +23 | +12 | +0 |
| A | 1513-AGG(m2G)G(m62A)(m62A)C-1520 | 921.184 | +38 | +15 | +0 | |
| U2 | 1518-(m62A)(m62A)CCUG > p-1523 | 659.452 | +23 | +12 | +0 | |
| 23S RNA | ||||||
| m1G(745), Ψ(746), m5U(747) | T1 | 739-ACUAAU(m1G)Ψ (m5U)G-748 | 1627.241 | +36 | +6 | –2 |
| A | 745-(m1G)Ψ-746* | 684.114 | +7 | +3 | –1 | |
| U2 | 744-U(m1G)Ψ (m5U)G > p-748 | 819.115 | +16 | +6 | –2 | |
| m6A(1618) | T1 | 1614- ACAC(m6A)G-1619 | 988.171 | +26 | +3 | +0 |
| A | 1618- (m6A)GGU-1621 | 679.614 | +17 | +3 | +0 | |
| U2 | 1617- C(m6A)G > p-1619 | 497.587 | +13 | +3 | +0 | |
| m2G(1835) | A | 1835- (m2G)C-1836 * | 683.129 | +8 | +3 | +0 |
| Ψ(1911), m3Ψ(1915), Ψ(1917) | T1 | 1911-ΨAAC(m3Ψ)AΨAACG-1921 | 1184.515 | +42 | +3 | –3 |
| A | 1915-(m3Ψ)AΨ-1917 | 974.145 | +9 | +3 | –2 | |
| U2 | 1914-C(m3Ψ)A > p-1916* | 478.079 | +10 | +3 | –1 | |
| m5U(1939) | T1 | 1936-AAA(m5U)UCCUUG-1945 | 1067.160 | +34 | +3 | –1 |
| A | 1935-GAAA(m5U)-1939 | 836.145 | +22 | +3 | –1 | |
| U2 | 1939- (m5U)UCCUUG > p-1945 | 1097.638 | +19 | +3 | –1 | |
| m5C(1962) | T1 | 1960-AC(m5C)UG-1964 | 541.757 | +18 | +3 | –1 |
| m6A(2030) | T1 | 2030- (m6A)AG-2032 | 518.601 | +15 | +3 | +0 |
| A | 2029- G(m6A)AGAU-2034 | 1008.669 | +27 | +3 | +0 | |
| U2 | 2030- (m6A)A > p-2031 | 673.133 | +10 | +3 | +0 | |
| m7G(2069) | A | 2069- (m7G)AAC-2072 | 447.753 | +18 | – | +0 |
| Gm(2251) | A | 2250-G(Gm)GGC-2254 | 859.645 | +23 | +3 | +0 |
| U2 | 2251-(Gm)G > p-2252* | 705.131 | +10 | +3 | +0 | |
| Cm(2498), ho5C(2501) | A | 2497-A(Cm)C-2499 * | 486.594 | +11 | +3 | +0 |
| U2 | 2498-(Cm)CU(ho5C)G > p-2502 | 799.117 | +16 | +3 | –1 | |
| m2A(2503), Ψ(2504) | T1 | 2503-(m2A)ΨG-2505 * | 507.087 | +12 | – | –1 |
| A | 2502-G(m2A)Ψ-2504 | 507.090 | +12 | – | –1 | |
| Um(2552) | T1 | 2551-C(Um)G-2553 | 989.154 | +10 | +3 | +0 |
| A | 2552-(Um)GU-2554 | 495.576 | +9 | +3 | +0 | |
| U2 | 2551-C(Um)G > p-2553 | 486.076 | +10 | +3 | +0 |
Another important issue is the uniqueness of the identified fragments. Obtaining m/z values for 14N/15N pairs enabled reliable assignment for most of rRNA fragments (Table 2). In addition, the 5,6-D labeling protocol helped to assign fragments with pseudouridines, and in a number of cases to distinguish between compositional isomers such as 16S: 964-AU(m2G)-966 and 23S: 2503-(m2A)ΨG-2505, as described in Table S1. In principle, due to high sequence redundancy, identification of short modified nucleolytic fragments (2–3 nt) can be a challenge in long and extensively modified molecules like rRNA. For instance, two isobaric fragments 16S: 527-(m7G)C-528 and 23S: 1835-(m2G)C-1836 exhibit different retention times. To assign these fragments, spiking the sample with either 15N-labeled 16S or 23S RNA was sufficient to demonstrate matching of one of the two fragments but not the other (Figure S1A). The possibility that observed peaks resulted from the singly methylated derivative of 16S: 966-(m2G)(m5C)-967 is unlikely, since only mature and presumably fully modified rRNA is used for a spike.
Furthermore, 5,6-D-uracil labeling protocol was also useful to distinguish between isobaric fragments that instead of a pseudouridine modification carry a methyl group at the C5 position of the cytosine or uracil (Table 2, −1 Da Δ5,6-D shift for 16S: m5C(1407) and 23S: m5U(1939)). For instance, two nonunique 16S fragments 966-(m2G)(m5C)-967 and 1401-G(m4Cm)-1402 bear C5 or N4 cytosine methylations. The two methylations were distinguished by the loss of the 5-deuteron to accommodate C5-methyl resulting in a −1 Da shift in the spectrum (Figure S1B), and the observed peak at 695 Da (Figure S1B) was assigned to 966-(m2G)(m5C)-967. In fact, the expected 1401- G(m4Cm)-1402 fragment was not observed at all, most likely because RNase A cleavage at the 2′-O-methylated sites is ineffective (Table 2, Cm(2498) and Um(2552)). Finally, genetic deletions of the individual modification enzymes were used to confirm identification of a number of small rRNA fragments, including 23S: 745-(m1G)Ψ-746 and compositionally nonunique 23S: 2251-(Gm)G-2252 (Figure S1C-D).
A number of modified fragments predicted by the theoretical digestion and corresponding to about 20% of all rRNA modifications were either never observed in our LC-MS data sets or their quantitative analysis was difficult (Table 1). The residues include five pseudouridine modifications from 23S (Table S2), 23S methylation m2G(2445), and hU(2449) dihydrouridine (Figure S1E). To attain complete modification coverage in the future, one may try to expand the repertoire of sequence-specific nucleases and pursue other chromatography approaches to improve separation of rRNA digestion products and remove spectral interference from the co-eluting products.
In summary, MS analysis of the specific RNase digestion products combined with metabolic labeling approaches enabled efficient and reliable identification of about of 80% of all modified nucleotides in E. coli rRNA. Among them are 23 out of 24 methylated residues and 6 out of 11 pseudouridines (Tables 1 and 2).
Quantitative Analysis of RNA Modifications in Ribosomal and Preribosomal Particles
Sucrose gradient ultracentrifugation with a subsequent fractionation is a well-established method to separate mature ribosomes (70S) from the small (30S) and the large (50S) subunits and their precursor particles. To determine the presence of ribosomal modifications in these particles, RNA modification inventory experiments were carried out using cell lysate from wild-type bacterial cells that was resolved on a sucrose density gradient. Each fraction across the gradient containing variable amounts of 14N particles was spiked individually with mature, fully modified 15N-labeled 16S or 23S RNA to attain ∼1:1 molar ratio of 14N to15N RNA. RNA abundances with respect to the spike (RNA level, f) were calculated for every unique rRNA fragment found. To account for different amounts of the 15N standard added to each fraction, initial RNA levels for modified fragments (RNA modification level, _f_mod) were scaled to the level of unmodified rRNA fragments present in the fraction (total rRNA level, _f_total). The total rRNA level (_f_total) used for normalizations was calculated by averaging RNA levels (f) for 3–15 unmodified compositionally unique 16S or 23S fragments (Figure S2). Throughout the gradient, unnormalized rRNA levels (f) could vary between 0.2 and 0.7 with a 0.015–0.04 deviation from the average. To cover all modifications, each fraction was subjected to treatment by at least two nucleases, unless only small amounts of rRNA were isolated. For some modifications, independent measurements using fragments from different RNase treatments were obtained (Table 2), and their average values are reported.
Normalized RNA levels depicted in Figures 4 and 5 suggest that rRNA isolated from sucrose fractions corresponding to 30S and 70S peaks contains a complete set of 16S and 23S modifications (normalized _f_mod ≈ 1, data for 16S in the 70S peak are not shown). Major changes in the stoichiometry of the RNA modifications (i.e., normalized _f_mod < 1) were observed at the leading edges of the 30S and 50S peaks, where according to prior work30 assembly intermediates are found. Most likely, early 30S and 50S fractions contain a heterogeneous mixture of the cosedimenting ribosomal particles, and the data report on the average relative amounts of the modified fragments in these particles.
Figure 4.

Inventory of 16S RNA modifications in wild-type E. coli ribosomes. Relative abundances of the 16S modifications with respect to the external standard are shown for the fractions collected across the 30S peak. RNA modification levels (_f_mod) were normalized to amounts of unmodified rRNA fragments measured in each fraction (_f_total). (A) Three distinct groups of rRNA modifications are shown in red, yellow, and cyan. Data for fragments reporting on m2G(1516) and m62A(1518), m62A(1519) abundances (Table 2) were combined. (B) Schematic of the 16S secondary structure with its structural domains colored to map groups of RNA modifications.
Figure 5.
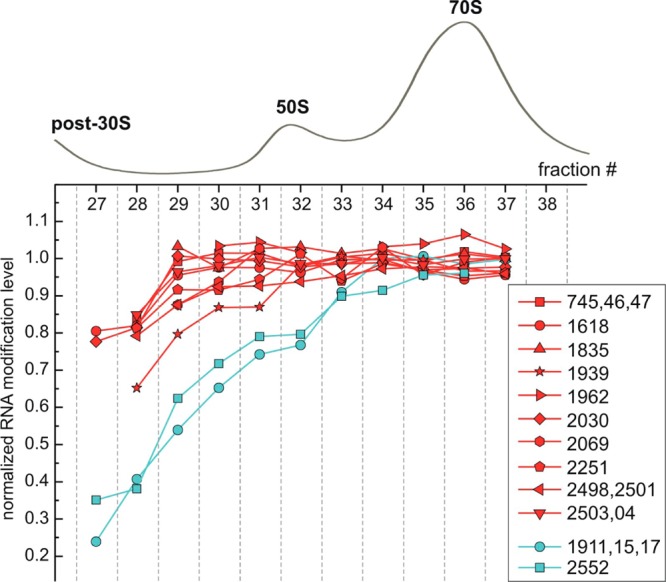
Inventory of 23S RNA modifications in wild-type E. coli ribosomes. Normalized RNA modification levels (_f_mod/_f_total) across the 50S and 70S peaks. Two distinct groups of 23S modifications are colored red and cyan. For residues that are physically linked due to digestion: m1G(745), Ψ(746), m5U(747); Ψ(1911), m3Ψ(1915), Ψ(1917); Cm(2498), ho5C(2501); and m2A(2503), Ψ(2504) (Table 2), inventory data were combined. RNA levels calculated using individual nucleolytic fragments corresponding to these residues were found to be within the measurement error, and their averaged values are shown.
16S inventory profiles obtained from a single sucrose gradient (Figure 4A) and from two more replicate experiments (Figure S3) suggest presence of at least three groups of modifications with high (red), medium (yellow), and low (cyan) abundances in the pre-30S fractions. When these groups of modifications were mapped on to the rRNA structure, they were found to correlate with domain organization of the 16S molecule (Figure 4B). For the large ribosomal subunit, RNA levels calculated across 50S and 70S peaks of a given sucrose gradient (Figure 5) reveal two groups of RNA modifications. This result is further supported by the cluster analysis carried out using data from four replicate inventory experiments (Figure S4). The vast majority of 23S modifications are highly abundant in the pre-50S fractions (red group), with a small distinct group (cyan) of modifications that are depleted and reach their stoichiometric levels only in the 70S region. Unlike 16S RNA, these results have no obvious correlations to the secondary or tertiary structure of the large subunit (see Discussion).
Inventory of the ribosomal proteins, obtained earlier using the same E. coli strain,30 describes protein composition of 30S and 50S assembly intermediates. The data suggest that in general, less mature intermediates (i.e., bound to a smaller number of the ribosomal proteins) sediment slower than more mature (i.e., heavier) particles (from left to right on the gradient), and we expect that RNA modifications occurring earlier during assembly should be more abundant in the pre-30S and pre-50S fractions than modifications occurring later. To better understand when individual RNA modification steps might occur on the assembly pathway, we analyzed dependencies between ribosomal proteins and RNA modification profiles. To see the correlations, protein and RNA modification level data obtained from two different sucrose gradients were aligned (Figure 6). Normalized levels calculated for a subset of ribosomal proteins which mark early (S4/L24), intermediate (S7/L5), and late (S2/L16) stages of subunits assembly were coclustered with a subset of RNA data for modifications representing each of the groups shown in Figures 4 and 5. This analysis reveals similarities between protein profiles and RNA modifications profiles across 30S and 50–70S fractions (Figure 6). For the 30S subunit (Figure 6A), the profile for residue m7G(527) correlates to S4 abundances suggesting that m7G(527) is modified early on the assembly pathway. Similarly, m2G(1207) profile correlates to the profile for the intermediately binding S7, and the profiles for residues m2G(1516), m62A(1518), and m62A(1519) correlate to the profile for the late binding S2, indicating that these modifications are taking place at intermediate and late stages of ribosome assembly. In the 50S subunit (Figure 6B), profiles for residues m6A(2030), m5U(1939), and Cm(2498) correlate to the protein levels for the early (L24) and intermediate (L5) binders, suggesting that the majority of 23S modifications are carried out relatively early on the pathway. In contrast, Ψ(1911), m3Ψ(1915), Ψ(1917) residues are modified much later, likely when protein assembly is complete, as these modifications reach their stoichiometric level further on the gradient (in the 70S peak) than the late binding L16 protein.
Figure 6.

Inventory analysis of rRNA modifications and ribosomal proteins. Relative levels of RNA modifications and ribosomal proteins for the subset of the small (A) and large (B) ribosomal subunit components are shown as a heat map. RNA and protein data were obtained from two separate experiments, ribosome sedimentation traces were aligned, and data linearly interpolated to account for the difference in a number of collected fractions. Protein levels have been previously reported.30 Here, values for the intermediate (S7/L5) and late (S2/L16) binding proteins were normalized to those of the primary binders (S4 or L24).
Discussion
A New qMS Approach for Efficient Quantitative Monitoring of rRNA Modifications
Sensitivity, accuracy of mass determination, and automation of MS-based methods make them attractive for studying post-transcriptional modifications that are not amenable to direct RNA sequencing analysis. Shifts in the mass of an oligonucleotide fragment caused by most types of RNA modifications can be easily resolved by modern mass spectrometers, making MS highly suitable for identification and sequence placement of the new residues. Expanding the applicability of MS for quantitative profiling of known RNA modifications, we have introduced an efficient method based on stable isotope labeling and precise fitting of the isotope distributions. The method enabled quantitative characterization of rRNA modifications in a scope that to our knowledge has not been previously achieved.
The presence of both 14N- and 15N-labeled species assures reliable assignment of nucleolytic fragments and can be used for analysis of complex fragment mixtures resulting from RNA digestion. Simplicity of sample preparation is such that separation of 16S and 23S molecules preceding LC-MS run is not required, as 15N-labeled 16S or 23S RNA is used to selectively spike one of the two RNAs. Furthermore, automation of essentially every step during LC-MS data analysis, including peak picking, peak identification, and fitting allowed us to acquire information over hundreds of RNA peaks from a single LC-MS run. Finally, accurate and reproducible quantification results were obtained using the LS-FTC algorithm, which enabled us to fit RNA isotope distributions from a number of different labeling experiments and account for variations in the degree of isotope enrichment or metabolic scrambling (Figure 3).
Pseudouridines and methylations are the most abundant ribosomal modifications in all domains of life. Isotope labeling strategies described in this work do not interfere with the metabolic machinery of the cell and provide powerful means for future investigation of RNA modifications. Using a deuterated methionine analog, one can selectively monitor methylated nucleosides in virtually any cellular RNA. Using 5,6-D-uracil, efficient and uniform labeling of cellular pyrimidines was achieved permitting convenient monitoring of pseudouridines concurrently with other modifications. In comparison with previously used derivatization approaches adapted for MS-based identification of pseudouridines,23,24 metabolic labeling is more efficient as it does not involve additional separation steps which increase the amount of rRNA sample required for analysis.
Ribosomal RNA Is Modified at Different Points on the Assembly Pathway
Using the described qMS method, extensive data sets were collected to quantify levels of RNA modifications present in preribosomal particles isolated from wild-type E. coli. Inventory experiments were carried out across 30S and 50S regions of the sucrose gradient, and several replicate experiments were performed to provide independent assessment of reproducibility and to compensate for occasionally missing data points. Gradual increases in RNA modification levels toward the 30S and 50S peaks correspond to accumulation of the RNA modifications in the fractions which contain more mature subunits. Moreover, observed correlations between ribosomal proteins and RNA modification profiles across the gradient suggest that rRNA is modified at different time points on the assembly pathways and that assembly and RNA modification might be intimately related temporally and functionally.
By concatenating results from multiple sucrose gradients (Figures S3 and S4), RNA profiles were used to determine groups of residues modified at different stages on the assembly pathway. For the 30S subunit, three groups of early, [m7G(527)]; intermediate, [m2G(966), m5C(967), m2G(1207)]; and late, [m4Cm(1402), m5C(1407), m3U(1498), m2G(1516), m62A(1518), m62A(1519)] modifications emerged. Curiously, these groups are localized in the individual structural domains of the 30S subunit: the 5′ body domain, the 3′ head domain, and 3′ minor domain correspondingly (Figure 4B). This is consistent with an overall picture of 30S subunit assembly in vivo and in vitro, which proceeds by its structural domains in a 5′ to 3′ direction.30,35,36 Previously reported in vitro biochemical analyses indicate that the preferable substrate for most of the 30S modification enzymes is the assembled subunit, rather than naked 16S RNA (Table 1). To reconcile these analyses with the data obtained here, we suggest that rather than complete assembly of the 30S particle, binding of at least a subset of the ribosomal proteins which promote structural organization of the specific 30S domains is necessary and sufficient for RNA modifications to take place. Thus, in vitro, the 30S ribosome serves as a better mimic of the native substrates for the modification enzymes than 16S RNA, but it is likely that the true in vivo substrates for the modification enzymes are partially assembled ribosomes with partial native structure.
To some degree, our inventory data are consistent with in vivo results previously obtained by the reverse-phase chromatography analysis of rRNA nucleosides.16 In that study, m4Cm(1402) was postulated as an intermediate (see Figure S3 for discussion) and m3U(1498), m62A(1518), m62A(1519) as late assembly modifications. Surprisingly, these modifications are present at a low level in the 30S subunit which might be caused by differences in growth conditions and cell lysis between our study and the previous work.
The RNA level profile for the 30S pseudouridine Ψ(516) is not shown, as corresponding fragments exhibited abnormally high levels in the pre-30S region of the gradient. This suggests that other pseudouridines are present in these fractions, perhaps from different RNAs, and more work needs to be done to determine their origin. Furthermore, our qMS method has difficulty measuring intermediate modification states of residues or nucleolytic fragments expected to undergo multiple modifications. For instance, detecting whether base and ribose methylations of m4Cm(1402) occur at drastically different points during assembly would be challenging. Similarly, detection of m2G(1516) is limited to a single RNase A fragment (Table 2), where m2G(1516) is linked to m62A(1518) and m62A(1519). Most likely, G1516 is methylated not later than A1518 and A1519, since m62A(1518) and m62A(1519) residues were monitored independently by RNase A and T1 fragments and equivalent abundance profiles were obtained. In the future, more detailed investigation of m4Cm(1402) or m2G(1516) could be performed using qMS and bacterial strains carrying deletions of rsmH/rsmI and rsmA genes.
For 50S, inventory profiles were used to characterize [m1G(745), Ψ(746), m5U(747), m6A(1618), m2G(1835), m5U(1939), m5C(1962), m6A(2030), m7G(2069), Gm(2251), Cm(2498), ho5C(2501), m2A(2503) and Ψ(2504)] as early stage modifications and [Ψ(1911), m3Ψ(1915), Ψ(1917) and Um(2552)] as late. A closer examination of our qMS data sets also suggests that Cm(2498) and m5U(1939) might have been modified at an early to intermediate stage of 50S assembly (see Figure S4 for discussion), consistent with previous in vivo results suggesting that Cm(2498) is methylated at an intermediate point along the assembly pathway.16 However, more data are needed to fully confirm this observation.
Unlike the 30S subunit, it is difficult to reconcile structural positioning of the modified 50S nucleotides with their modification order. For example, both m2G(1835) and m3Ψ(1915) are surface exposed residues, though the first is modified early during subunit assembly and the second much later. Likewise, Gm(2251) and Um(2552) form the core of the peptidyl transferase center, but Gm(2251) is abundant and Um(2552) is depleted in the fractions corresponding to 50S intermediates (Figure 5). This discrepancy might be a consequence of the much more intricate assembly landscape characteristic of the large subunit30 or regulatory roles that individual enzymes (or their products) might play in biogenesis.2 In fact, results from a few previously published studies emphasize that rRNA modification enzymes, such as RsmA (aka KsgA),37 RluD,38 and RlmE (aka RrmJ),11,39 may act as assembly chaperones, check point, or quality control markers. These essentially unknown functions of the RNA modification machinery might play key roles in shaping the whole biogenesis process.
The obtained 23S modification profiles are fully consistent with results of in vitro modification assays (Table 1), suggesting that most 23S enzymes recognize their targets when the RNA is free in solution, with the exception of RlmE (Um-2552), RluD (Ψ-1911, 15, 17), and RlmH (m3Ψ-1915), which act on the fully assembled 50S or even 70S particles.11−13 Detailed investigations of RluD- and RlmH-dependent modifications in vivo and in vitro suggest that pseudouridylations of 1911, 1915, and 1917 occur at the stage of completion of the 50S assembly and Ψ(1915) is methylated during or after subunit joining.12,13,40 As in case of the 16S residue m4Cm(1402), qMS may not resolve the RluD and RlmH steps, as the corresponding modifications are monitored using the same nucleolytic fragments (Table 2), requiring more in depth analyses.
Figure 6 provides the first illustration of how individual modification steps are integrated into the existing framework for the 30S and 50S subunit assembly. These and previously published data strongly suggest that RNA modification processes are tightly coupled to the binding of the individual or groups of proteins.41 We envision that future protein and RNA modification qMS analyses will be fruitful to decipher detailed dependencies between these steps. In particular, this method offers the opportunity to analyze the relationship of rRNA modifications to the roles of the ribosome assembly factors using deletion strains or other perturbations to ribosome assembly.
Conclusion
The data presented here demonstrate feasibility of a new qMS approach for efficient and accurate monitoring of rRNA modifications. Relative amounts of individual RNA modifications were measured in the incompletely assembled ribosomal particles, providing insights into the relative order of the individual rRNA modification steps. This work lays a foundation for more in depth studies of rRNA modifications in bacterial and eukaryotic systems, where the proposed metabolic labeling schemes should be applicable. Future experiments will undoubtedly lead to a better understanding of the mechanisms and functions of individual modification steps in ribosome biogenesis and translation.
Acknowledgments
We would like to thank Dr. Michael Sykes for assistance with software changes to allow analysis of RNA mass spectrometry data and Dr. Dipali Sashital and Dr. Christine Beuck for providing critical comments during manuscript preparation. This work was supported by a grant from the NIH (R37-GM053757 to J.R.W).
Supporting Information Available
Supplemental data on RNA fragment identification and inventory of 16S and 23S modifications are included. This material is available free of charge via the Internet at http://pubs.acs.org.
The authors declare no competing financial interest.
Funding Statement
National Institutes of Health, United States
Supplementary Material
References
- Machnicka M. A.; Milanowska K.; Osman Oglou O.; Purta E.; Kurkowska M.; Olchowik A.; Januszewski W.; Kalinowski S.; Dunin-Horkawicz S.; Rother K. M.; Helm M.; Bujnicki J. M.; Grosjean H. Nucleic Acids Res. 2013, 41, D262–267. [DOI] [PMC free article] [PubMed] [Google Scholar]
- Sergiev P.; Golovina A.; Prokhorova I.; Sergeeva O.; Osterman I.; Nesterchuk M.; Burakovsky D.; Bogdanov A.; Dontsova O. In Ribosomes; Rodnina M., Wintermeyer W., Green R., Eds.; Springer: Vienna: 2011, p 97–110. [Google Scholar]
- Higa-Nakamine S.; Suzuki T.; Uechi T.; Chakraborty A.; Nakajima Y.; Nakamura M.; Hirano N.; Kenmochi N. Nucleic Acids Res. 2012, 40, 391–398. [DOI] [PMC free article] [PubMed] [Google Scholar]
- Cavaillé J.; Buiting K.; Kiefmann M.; Lalande M.; Brannan C. I.; Horsthemke B.; Bachellerie J. P.; Brosius J.; Hüttenhofer A. Proc. Natl. Acad. Sci. U.S.A. 2000, 97, 14311–14316. [DOI] [PMC free article] [PubMed] [Google Scholar]
- Ruggero D.; Grisendi S.; Piazza F.; Rego E.; Mari F.; Rao P. H.; Cordon-Cardo C.; Pandolfi P. P. Science 2003, 299, 259–262. [DOI] [PubMed] [Google Scholar]
- Dong X. Y.; Rodriguez C.; Guo P.; Sun X.; Talbot J. T.; Zhou W.; Petros J.; Li Q.; Vessella R. L.; Kibel A. S.; Stevens V. L.; Calle E. E.; Dong J. T. Hum. Mol. Genet. 2008, 17, 1031–1042. [DOI] [PMC free article] [PubMed] [Google Scholar]
- Dong X. Y.; Guo P.; Boyd J.; Sun X.; Li Q.; Zhou W.; Dong J. T. J. Genet. Genomics 2009, 36, 447–454. [DOI] [PMC free article] [PubMed] [Google Scholar]
- Tscherne J. S.; Nurse K.; Popienick P.; Michel H.; Sochacki M.; Ofengand J. Biochemistry 1999, 38, 1884–1892. [DOI] [PubMed] [Google Scholar]
- Purta E.; O’Connor M.; Bujnicki J. M.; Douthwaite S. Mol. Microbiol. 2009, 72, 1147–1158. [DOI] [PubMed] [Google Scholar]
- Kimura S.; Suzuki T. Nucleic Acids Res. 2010, 38, 1341–1352. [DOI] [PMC free article] [PubMed] [Google Scholar]
- Bügl H.; Fauman E. B.; Staker B. L.; Zheng F.; Kushner S. R.; Saper M. A.; Bardwell J. C.; Jakob U. Mol. Cell 2000, 6, 349–360. [DOI] [PubMed] [Google Scholar]
- Vaidyanathan P. P.; Deutscher M. P.; Malhotra A. RNA 2007, 13, 1868–1876. [DOI] [PMC free article] [PubMed] [Google Scholar]
- Ero R.; Leppik M.; Liiv A.; Remme J. RNA 2010, 16, 2075–2084. [DOI] [PMC free article] [PubMed] [Google Scholar]
- Motorin Y.; Muller S.; Behm-Ansmant I.; Branlant C. Methods Enzymol. 2007, 425, 21–53. [DOI] [PubMed] [Google Scholar]
- Grosjean H.; Droogmans L.; Roovers M.; Keith G. Methods Enzymol. 2007, 425, 55–101. [DOI] [PubMed] [Google Scholar]
- Siibak T.; Remme J. RNA 2010, 16, 2023–2032. [DOI] [PMC free article] [PubMed] [Google Scholar]
- Mengel-Jørgensen J.; Jensen S. S.; Rasmussen A.; Poehlsgaard J.; Iversen J. J.; Kirpekar F. J. Biol. Chem. 2006, 281, 22108–22117. [DOI] [PubMed] [Google Scholar]
- Guymon R.; Pomerantz S. C.; Ison J. N.; Crain P. F.; McCloskey J. A. RNA 2007, 13, 396–403. [DOI] [PMC free article] [PubMed] [Google Scholar]
- Havelund J. F.; Giessing A. M.; Hansen T.; Rasmussen A.; Scott L. G.; Kirpekar F. J. Mol. Biol. 2011, 411, 529–536. [DOI] [PubMed] [Google Scholar]
- Suzuki T.; Ikeuchi Y.; Noma A.; Sakaguchi Y. Methods Enzymol. 2007, 425, 211–229. [DOI] [PubMed] [Google Scholar]
- Hossain M.; Limbach P. A. Anal. Bioanal. Chem. 2009, 394, 1125–1135. [DOI] [PubMed] [Google Scholar]
- Andersen T. E.; Kirpekar F.; Haselmann K. F. J. Am. Soc. Mass Spectrom. 2006, 17, 1353–1368. [DOI] [PubMed] [Google Scholar]
- Mengel-Jørgensen J.; Kirpekar F. Nucleic Acids Res. 2002, 30, e135. [DOI] [PMC free article] [PubMed] [Google Scholar]
- Durairaj A.; Limbach P. A. Anal. Chim. Acta 2008, 612, 173–181. [DOI] [PMC free article] [PubMed] [Google Scholar]
- Pomerantz S. C.; McCloskey J. A. Anal. Chem. 2005, 77, 4687–4697. [DOI] [PubMed] [Google Scholar]
- Addepalli B.; Limbach P. A. J. Am. Soc. Mass Spectrom. 2011, 22, 1363–1372. [DOI] [PMC free article] [PubMed] [Google Scholar]
- Meng Z.; Limbach P. A. Anal. Chem. 2005, 77, 1891–1895. [DOI] [PubMed] [Google Scholar]
- Waghmare S. P.; Dickman M. J. Anal. Chem. 2011, 83, 4894–4901. [DOI] [PubMed] [Google Scholar]
- Bunner A. E.; Trauger S. A.; Siuzdak G.; Williamson J. R. Anal. Chem. 2008, 80, 9379–9386. [DOI] [PMC free article] [PubMed] [Google Scholar]
- Chen S. S.; Williamson J. R. J. Mol. Biol. 2012, 425, 767–679. [DOI] [PMC free article] [PubMed] [Google Scholar]
- Sperling E.; Bunner A. E.; Sykes M. T.; Williamson J. R. Anal. Chem. 2008, 80, 4906–4917. [DOI] [PMC free article] [PubMed] [Google Scholar]
- Baba T.; Ara T.; Hasegawa M.; Takai Y.; Okumura Y.; Baba M.; Datsenko K. A.; Tomita M.; Wanner B. L.; Mori H. Mol. Syst. Biol. 2006, 2, 2006.0008. [DOI] [PMC free article] [PubMed] [Google Scholar]
- Eisen M. B.; Spellman P. T.; Brown P. O.; Botstein D. Proc. Natl. Acad. Sci. U.S.A. 1998, 95, 14863–14868. [DOI] [PMC free article] [PubMed] [Google Scholar]
- Saldanha A. J. Bioinformatics 2004, 20, 3246–3248. [DOI] [PubMed] [Google Scholar]
- Talkington M. W.; Siuzdak G.; Williamson J. R. Nature 2005, 438, 628–632. [DOI] [PMC free article] [PubMed] [Google Scholar]
- Mulder A. M.; Yoshioka C.; Beck A. H.; Bunner A. E.; Milligan R. A.; Potter C. S.; Carragher B.; Williamson J. R. Science 2010, 330, 673–677. [DOI] [PMC free article] [PubMed] [Google Scholar]
- Connolly K.; Rife J. P.; Culver G. Mol. Microbiol. 2008, 70, 1062–1075. [DOI] [PMC free article] [PubMed] [Google Scholar]
- Gutgsell N. S.; Deutscher M. P.; Ofengand J. RNA 2005, 11, 1141–1152. [DOI] [PMC free article] [PubMed] [Google Scholar]
- Tan J.; Jakob U.; Bardwell J. C. J. Bacteriol. 2002, 184, 2692–2698. [DOI] [PMC free article] [PubMed] [Google Scholar]
- Leppik M.; Peil L.; Kipper K.; Liiv A.; Remme J. FEBS J 2007, 274, 5759–5766. [DOI] [PubMed] [Google Scholar]
- Weitzmann C.; Tumminia S. J.; Boublik M.; Ofengand J. Nucleic Acids Res. 1991, 19, 7089–7095. [DOI] [PMC free article] [PubMed] [Google Scholar]
Associated Data
This section collects any data citations, data availability statements, or supplementary materials included in this article.