Microscopic mechanism of DNA damage searching by hOGG1 (original) (raw)
Abstract
The DNA backbone is often considered a track that allows long-range sliding of DNA repair enzymes in their search for rare damage sites in DNA. A proposed exemplar of DNA sliding is human 8-oxoguanine (oG) DNA glycosylase 1 (hOGG1), which repairs mutagenic oG lesions in DNA. Here we use our high-resolution molecular clock method to show that macroscopic 1D DNA sliding of hOGG1 occurs by microscopic 2D and 3D steps that masquerade as sliding in resolution-limited single-molecule images. Strand sliding was limited to distances shorter than seven phosphate linkages because attaching a covalent chemical road block to a single DNA phosphate located between two closely spaced damage sites had little effect on transfers. The microscopic parameters describing the DNA search of hOGG1 were derived from numerical simulations constrained by the experimental data. These findings support a general mechanism where DNA glycosylases use highly dynamic multidimensional diffusion paths to scan DNA.
INTRODUCTION
The most fundamental process in all of biology is the encounter of two or more molecules to form a specific complex. It is critical that such binding events occur within a time frame dictated by the survival needs of the organism. In the case of oxidative DNA damage to the human genome, rare 8-oxoguanine (oG) bases must be located and removed by human 8-oxoguanine DNA glycosylase 1 (hOGG1) in a time constraint that is dictated by the next DNA replication event; the penalty for being slow is deleterious mutations that will be permanently fixed in the genome (1–3). In general, such highly efficient damage recognition is the essential hallmark of DNA base excision repair (BER) glycosylases, the enzymes that initiate the BER cascade (4–6).
The general phenomenon of rapid protein encounter with specific DNA-binding sites is typically explained by the process of ‘facilitated diffusion’, where the protein associates nonspecifically with the DNA chain and then reduces the search volume (time) by remaining in the vicinity of the DNA chain until the target is located (7–12). Unlike transcription factors or other DNA-binding proteins, which only have to locate a specific site, DNA repair glycosylases like hOGG1 must rapidly encounter and inspect each base in the genome in the process of efficiently locating their damage targets (3,5). This distinct cellular function of glycosylases places entirely different evolutionary restraints on the thermodynamic and kinetic properties of the enzyme-nucleic acid interaction. Thus in order to understand specific recognition by DNA glycosylases, and the molecular basis for genome preservation, it is imperative to understand how these enzymes track along DNA chains (5).
Obtaining a fundamental understanding of facilitated diffusion requires a measurement method capable of detecting transient diffusive states of an enzyme as it tracks along the DNA chain. Such diffusive states may comprise complexes where the enzyme appears continuously associated with the DNA (we refer to these events as associative transfers, but they are often called DNA sliding) (8,13), as well as transiently dissociated states where the enzyme is still very near to the DNA chain and poised to rebind with high probability (dissociative transfers, often referred to as hopping) (8,13). Although single-molecule methods could in principle detect such states, current single molecule imaging may not possess the required time and spatial resolution to resolve weakly bound and transiently dissociated enzyme molecules (14–16). To shed light on the diffusive states involved in DNA chain tracking by hOGG1, we now apply our recently described ‘molecular clock’ method (17). This approach reveals that hOGG1 uses associative and dissociative pathways to travel between oG sites in DNA, but neither pathway shows the expected characteristics of classical DNA sliding.
MATERIALS AND METHODS
Oligonucleotide and protein reagents
Oligonucleotides were purchased from Integrated DNA Technologies (www.idtdna.com), Midland (www.oligos.com) or Eurofins (www.operon.com) and purified by denaturing polyacrylamide gel electrophoresis. hOGG1 and human apurinic/apyrimidinic endonuclease 1 (APE1) were prepared as described (18–20). T4 polynucleotide kinase, terminal transferase, T4 DNA ligase, NtBbvCI, BamHI-HF and HindIII-HF were purchased from New England Biolabs. [γ-32P] ATP and 3′-deoxyadenosine 5′-[α-32P] triphosphate were purchased from Perkin Elmer. 5-Iodoacetamidofluorescein (5-IAF) was ordered from Invitrogen.
Sequences of oligonucleotides
[* marks the position of the 32P label(s) in each substrate]
90mer (S5)
5′ - *GGT ATC TGT AG G ATG CGC TCA CAA TTC CAC ACA ATG CTG AGG AAT TTC oGCT C TC oGCT CCT TGC TGA GGC ATA CAG TGT CGA CT AT T GCCA* -3′
90mer (S10)
5′ - *GGT ATC TGT AG G ATG CGC TCA CAA TTC CAC ACA ATG CTG AGG AAT TTC oGCT CCT ATT TCoG CTC CTT GCT GAG GCA TAC AGT GTC GAG CCA* -3′
90mer (S15)
5′ - TCC ATC TGT A GC TCA CAA TTC CAC ACA ATG CTG AGG AAT TTC oG CT CCT *TG T G AAT TTC oG CT CCT TGT GAA TTT CTA CAG TGT CGA GCCGA -3′
90mer (S20)
5′ - *GGT ATC CGC TCA CAA TTC CAC ACA ATG CTG AGG AAT TTC oGCT CCT TGT AG G ATG A AT TTC oGCT CCT TGC TGA GGC ATA CAG TGT CGA GCC* -3′
110mer (S40)
5′ - *GGT ATC CGC TCA CAA TTC CAC ACA ATG CTG AGG AAT TTC oGCT CCT TGT AGG ATG AAT TTC CT CCT TGT AGG ATG AAT TTC oGCT CCT TGC TGA GGC ATA* -3′
122mer (S80)
5′ - ATG CTG AGG AAT TTC oGCT CCT TGT AGG ATG A*AA TGA GTC TCA CAT C ATT CA TAT TCC ATC TGT A GC TCA CAA TTC CAC ACA ATG CTG AGG AAT TTC oGCT CCT TGT AGG GAG ACA TGA CGG CT -3′
248mer (S156)
5′ - *ATC GTA CAT TTA TGC TAG ACT GGT ATC CGC TCA CAA TTC CAC ACA ATG CTG AGG AAT TTC oGCT CCT TGT AGG ATG AAT TTC GCT CCT TGC TGA GGC ATA CAG TGT GCT ACC TAG CTG AGC TCA ACT CTA AGT CAT ATC CAT TGC ATA TTC CAT TCC GGG TAT CCG CTC ACA ATT CCA CAC AAT GCT GAG GAA TTT CGC TCC TTG TCT GAG GAA TTT CoGC TCC TTG TAG AGG CAT ACA GTG TCG AGC CA* -3′
90mer (S10opp)
5′ - TCC ATC TGT A GC TCA CAA TTC CAC ACA ATG CTG AGG AAT TTC oGCT CCT *TAA AGC GAA ATT CCT CAG CGA ATC AGG GAT GCT GTC GAG CGA -3′
3′ - AGG TAG ACA TCG AGT GTT AAG GTG TGT TAC GAC TCC TTA AAG CGA GGA ATT TCoG CTT TAA GGA GTC GCT TAG TCC CTA CGA CAG CTC GCT -5′
90mer (S15Fluor)
5′ - TCC ATC TGT A GC TCA CAA TTC CAC ACA ATG CTG AGG AAT TTC oGCT CCT TGT (Fluor)GAA TTT CoGC TCC TTG TGA ATT TCT ACA GTG TCG AGC CGA -3′
Nonspecific DNA (nsDNA)
5′ - TGC GAC TAT GCG CCT -3′
3′ - ACG CTG ATA CGC GGA-Fam-5′
31mer (S0)
5′ - *ATG CTG AGG AAT TTC oGCT CCT TGT AGG ATG A -3′
Chase DNA (chDNA)
5′ - GCG GCC AAA ϕ AA AAA GCG C -3′
3′ - CGC CGG TTT A TT TTT CGC G -5′
(ϕ - tetrahydrofuran abasic site mimic)
Site transfer assay for substrates with both oG on the same DNA strand
In the standard assay, double 3′, 5′-end-32P-labeled substrates (S_N_ in Figure 1A, where N is the site spacing in base pairs; the labeling procedure is described in Supplemental Information) are reacted with hOGG1 under initial rate multiple-turnover conditions with DNA at least in 20-fold excess, such that statistically each DNA molecule only sees one hOGG1 molecule. Each reaction contained 20 nM 32P-labeled duplex DNA substrate in buffer A (20 mM TrisCl pH 8.0, 1 mM EDTA, and 1 mM DTT, 47 mM NaCl, 0.1 mg/mL BSA and 15% DMSO), in a total volume of 50 μl. DMSO was required to increase the solubility of the trap and controls were performed to establish that the hOGG1 activity is unaltered in the presence of 15% DMSO (Supplementary Figure S1). The reaction was initiated by the addition of 1 μl of hOGG1 to a final concentration of 1 nM and incubated at 37°C. At each time point, 6 μl of the reaction mixture was removed and quenched with equal volume of formamide loading buffer (FLB) containing 200 mM NaOH. All samples were heated at 95°C for at least 5 min before gel loading. The fragments were resolved on denaturing polyacrylamide gels (6% gels for S80, S156, S15Fluor; 10% gels for S5, S10, S15, S20, S40). The gels were dried and exposed overnight to a storage phosphor screen and imaged with a Storm 840 phosphorimager (Molecular Dynamics).
Figure 1.
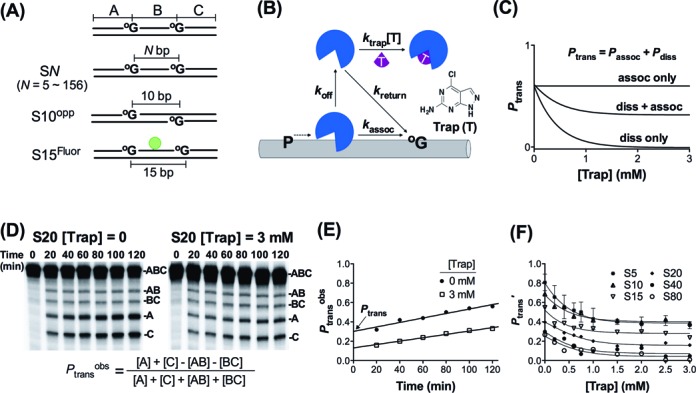
Molecular clock method and measurement of dissociative and associative site transfer pathways. (A) DNA substrates used in this study. Substrates had target site spacings in the range 5–156 bp. (B) The molecular clock assay uses a trap (T) to capture enzyme molecules that have dissociated from DNA during the process of transferring between two target sites. Thus, transfers that occur by associative and dissociative pathways can be resolved. (C) Simulated experimental outcomes for the molecular clock assay. Since the probability of trapping a dissociated enzyme depends on the trap concentration, the contribution of the dissociative pathway decreases in a hyperbolic fashion with increasing trap concentration. If an associative pathway also exists, a plateau level of trap resistant transfers will be reached.(D) Separation of base excision products of substrate S20 in the presence and absence of trap by denaturing polyacrylamide gel electrophoresis. Typically, substrates were 5′ 32P labeled. Reactions contained S20 (20 nM) and hOGG1 (1 nM). At each time point _P_transobs = ([A] + [C] - [AB] - [BC])/([A] + [C] + [AB] + [BC]) was calculated. (E) Linear extrapolation of _P_transobs to zero time gives the true _P_trans. (F) Trap and spacing dependence of _P_trans′. _P_trans′ is calculated by dividing _P_trans by the oG excision efficiency (E = 0.85).
For experiments containing the hOGG1 trap, various concentrations of trap stock were prepared in DMSO and added to the reaction to give final concentrations in the range of 0.2–3 mM. The trap was found to be soluble in 15% DMSO at concentrations up to 5 mM but concentrations less than 3 mM were typically used (determined by UV absorbance). The site transfer assay was otherwise performed as described above in the absence of trap. The trap stock was analyzed for group I and II metals by inductively coupled plasma mass spectrometry (ICP-MS) at the University of Georgia Center for Applied Isotope Studies to ensure that the effects are due to the trap and not bystander salt ions (http://www.uga.edu/cais). The analysis revealed a stoichiometry of one K+ per molecule trap and all other ions were at trace or undetectable levels. The K+ contribution is negligible given the ≥ 47 mM monovalent cation concentrations in the assay. All gel images were quantified using QuantityOneTM (Bio-Rad). The fraction of productive intramolecular transfers at each time point (_P_transobs) were calculated using Equation ((1)) if DNA substrate was end labeled, or using Equation ((2)) if the DNA substrate was internally labeled in the B segment (the numerator in equation ((1)) is equal to [B]) (21). The limiting value for _P_trans at time zero was obtained by linear extrapolation (18,17). _P_trans was measured in at least three experiments at [trap] = zero. _P_assoc was obtained by averaging at least three measurements at high [trap] in the limiting plateau region (2.5–3.0 mM trap). _P_diss was calculated by the difference _P_diss = _P_trans - _P_assoc. These values can be found in Table 1 (prime notation indicates correction by oG excision efficiency, _P_′ = P/E).
Table 1. Measured values for _P_trans′, _P_assoc′ and _P_diss′*.
| DNA substrate | _P_trans′ | _P_assoc′ | _P_diss′ |
|---|---|---|---|
| S5 | 0.81 ± 0.09 | 0.39 ± 0.03 | 0.42 ± 0.09 |
| S10 | 0.69 ± 0.08 | 0.40 ± 0.04 | 0.29 ± 0.09 |
| S15 | 0.55 ± 0.03 | 0.28 ± 0.05 | 0.27 ± 0.06 |
| S20 | 0.40 ± 0.11 | 0.16 ± 0.06 | 0.24 ± 0.13 |
| S40 | 0.28 ± 0.08 | 0.07 ± 0.08 | 0.21 ± 0.11 |
| S80 | 0.27 ± 0.03 | 0.04 ± 0.05 | 0.22 ± 0.06 |
| S156 | 0.04 ± 0.03 | 0.00 ± 0.09 | 0.04 ± 0.11 |
| S10opp | 0.41 ± 0.02 | 0.16 ± 0.08 | 0.25 ± 0.08 |
| S15Fluor | 0.56 ± 0.08 | 0.18 ± 0.05 | 0.38 ± 0.09 |
 |
(1) |
|---|
 |
(2) |
|---|
Site transfer assay for S10opp
The above site transfer assay was not applicable for S10opp because when the oG's are on opposite DNA strands, single or double cleavage of the substrate results in identical products on a denaturing polyacrylamide gel, thereby obscuring the required information needed to calculate _P_trans. Thus, the assay was modified by engineering nicking sites opposite to both oG's, allowing the duplex cleavage products to be resolved by nondenaturing polyacrylamide gel electrophoresis.
The assay was performed as described above, except for the postreaction treatment2. At each time point, 6 μl of the reaction mixture was taken out and quenched with equal volume of 5 mM trap in 40% DMSO on ice. This approach was shown to quench the reaction as effectively as alkaline FLB, but allows subsequent digestion of the product DNA with a nicking endonuclease/APE1 cocktail. To each sample (12 μl) was added 12 μl of 1U/μl NtBbvCI and 2.4 nM of human apurinic/apyrimidinic endonuclease (APE) in buffer B (5 mM TrisCl pH = 8.0, 1 mM DTT, 50 mM NaCl, 5 mM MgCl2, 0.1 mg/mL BSA) followed by incubation at 37°C for 2 h. The fragments were then resolved on 8% nondenaturing polyacrylamide gels at 4°C. The gel was dried and exposed overnight to a storage phosphor screen and imaged with a Storm 840 phosphorimager.
Site transfer assay with S15Fluor
S15Fluor was designed with relatively short 15 bp spacing between the two oG so that a significant portion of hOGG1 transfers will follow the associative pathway (∼50% from Table 1). Spacings shorter than 15 bp are not possible because the fluorescein roadblock would likely perturb target site binding. To confirm this substrate design, we modeled the published crystal structure of hOGG1 with oG containing DNA (PDB: 2NOH (22), DNA length was computationally extended using Discovery Studio 3.5) to show that modification of the phosphate backbone with fluorescein at a position 7 bp 5′ or 3′ from the oG site did not overlap with the bound hOGG1 protein (Supplementary Figure S5A). S15Fluor was prepared by reacting its single phosphorothioate (diastereomeric) with 5-iodoacetamidofluorescein (5-IAF). In a 100 μL reaction, 204 pmol of d(TCC ATC TGT AGC TCA CAA TTC CAC ACA ATG CTG AGG AAT TTC oGCT CCT TGT ThGAA TTT CoGC TCC TTG TGA ATT TCT ACA GTG TCG AGC CGA), where (Th) indicates the phosphorothioate site, was incubated with excess 5-IAF (a pinch of the powder was directly added to the reaction without weighing, final concentration was ∼6.6 mM) in 100 mM TrisCl (pH = 6.8) at 37°C overnight. The labeled DNA was then purified away from excess 5-IAF by a Bio-Rad P30 centrifugal gel filtration column. The concentration of the fluorescein-labeled DNA was determined on a 10% denaturing polyacrylamide gel by comparing to several concentrations of a fluorescein-labeled 15mer DNA standard. UV absorbance at 491 nm can also be used to roughly determine the fluorescein-labeled DNA concentration prior to gel loading. The total DNA concentration was determined by UV absorbance at 260 nm. By these methods, we estimate that the fluorescein labeling efficiency was about 30%. (Since only the labeled molecules are observed in the assay, 100% labeling efficiency is not required.) The site transfer assay contained 400 nM of S15Fluor in buffer A and 10 nM hOGG1. Six microliter aliquots were removed and quenched in 6 μL of FLB at time points in the range 10–210 min. All samples were heated at 95°C for at least 5 min before gel loading. The fragments were resolved on a 6% denaturing polyacrylamide gel (see Supplementary Figure S5C). The gel was dried and exposed overnight to a storage phosphor screen and imaged with a Typhoon 8600 phosphorimager (GE Healthcare). _P_transobs was calculated by Equation (2). In this approach, the internal B fragment is conveniently labeled by fluorescein allowing the use of Equation ((2)) to obtain _P_trans, _P_assoc and _P_diss.
RESULTS
Development of a ‘molecular clock’ for hOGG1 facilitated site transfers
We recently introduced a new kinetic partitioning approach called the ‘molecular clock’ that allows characterization of the lifetimes and physical properties of otherwise invisible diffusive states involved in facilitated diffusion (Figure 1B) (23,24,17). A preliminary requirement to use this approach is to identify an active site-directed ligand that can efficiently trap enzyme molecules that have dissociated from the DNA during the process of transferring between two target sites in DNA. Importantly, the method allows separation of the total probability that an enzyme molecule will transfer between two sites (_P_trans) into two categories: transfers that involve at least one trappable dissociation event (_P_diss, the dissociative pathway) and those that proceed by no trappable dissociations (_P_assoc, the associative pathway) (Figure 1C). The method is agnostic with respect to the nature of the associative pathway, and therefore, other experiments must be performed to ascertain its characteristics (see below). A suitable active site trap for hOGG1 was identified in a screening effort (Figure 1B). This 8-oxoguanine analogue was superior to oG because of its increased solubility in aqueous buffers and its properties are detailed in Supplementary Information and Supplementary Figures S1 and S2.
hOGG1 transfers between oG sites using two pathways
The probabilities for hOGG1 to transfer between two oG sites spaced 5–156 bp apart were measured in a site cleavage assay that generates distinct DNA fragments depending on whether one or both oG sites are excised in a single enzyme encounter (Figure 1A and D). The amount of facilitated transfer (_P_transobs = _P_diss + _P_assoc) is determined by quantifying the amounts of doubly excised products (bands A and C, Figure 1D), which reflect facilitated transfer between sites, relative to singly excised products (bands AB and BC), which indicate aborted transfer events (23,24,17,18). (See equation in legend to Figure 1D and references (17,18,21,7) for further details). Since _P_transobs is time dependent (because eventually all of the DNA is cleaved into fragments A and C) the true _P_trans values must be obtained by extrapolation of _P_transobs to zero time (Figure 1E). In addition, _P_trans depends on the fraction of hOGG1 molecules that successfully transfer to the second site and then remain there long enough to excise oG (the excision efficiency E). Therefore, the true probability for site transfer is obtained by _P_trans′ = _P_trans/E, where 0 ≤ E ≤ 1 (see Supplementary Information and Supplementary Figure S3) (18,23,24,17). For hOGG1, E = 0.85 ± 0.03 at the standard salt concentration of 47 mM, indicating that most transfers lead to site excision.
Plots of the total transfer probability (_P_trans′) against [trap] for site spacings of 5–156 bp revealed the key features of the transfer mechanism (Figure 1F). In the absence of trap _P_trans′ decreased from 0.81 to 0 with increasing site spacing, providing an upper limit of <156 bp for detectable facilitated transfers by any pathway (Table 1). With increasing concentration of trap _P_trans′ decreased in the expected hyperbolic manner indicating that trappable transfers were occurring (Figure 1F) (23,24,17). In addition, a clear nonzero plateau was reached for site spacings less than or equal to 20 bp revealing that untrappable transfers were also occurring. Thus, dissociative (_P_diss) and associative (_P_assoc) pathways coexist at spacings less than 20 bp. In contrast, at ≥40 bp spacing _P_trans′ approached zero as the trap concentration was increased, indicating that when transferring over ≥40 bp hOGG1 always makes at least one dissociative transfer step. The possibility that intermolecular collision with other DNA chains might influence the site transfer results is statistically improbable given the low concentration of DNA (20 nM) and the short 3 ms binding lifetime of hOGG1.
We found that _P_assoc′ plateaued at a value of 0.40 for both S10 and S5 rather than continuing to increase (Figure 1F). This result may arise from the fact that these site spacings are equal to or less than the DNA footprint of hOGG1 (∼10 bp) (25,26). Since hOGG1 induces extensive DNA bending, associative transfers may be inhibited over such short spacings because of the time required for relaxation of the DNA structure, requiring dissociation and subsequent rebinding to reach the nearby site. This explanation is consistent with the observed increase in total transfers (_P_trans′) as the site spacing is decreased from 10 to 5 bp (Figure 1F).
If the associative pathway was due to DNA sliding, it would be expected to show a weak sensitivity to increasing salt concentration (23,24,17). However, we found that _P_diss and _P_assoc both diminished as the salt concentration was increased from 47 to 107 mM (Supplementary Figure S4A and Table S1). Further experiments established that the reduced site transfer probabilities could be entirely accounted for by a salt-dependent decrease in the oG excision efficiency (E) (Supplementary Figures S4B, S4C, S4D). Accordingly, the salt dependence of _P_trans′ reveals nothing about the nature of site transfer itself and instead shows that at a physiological salt concentration hOGG1 binds and rebinds its target site many times in local microscopic encounter events before successful base excision occurs.
Strand sliding does not exceed 7 bp
In order to explore the nature of the associative pathway, we designed two DNA substrates (Figure 2). The first substrate (S10opp) has two oG sites located on opposite strands 10 bp apart and allows testing of whether associative transfers can occur when sites are positioned on separate strands (Figure 2A). The second substrate (S15Fluor) was engineered to test whether transfer between closely spaced sites on the same strand requires continuous contact with the phosphate backbone. Thus, we inserted a single phosphorothioate group in the intervening strand segment between two sites and covalently modified it with fluorescein iodoacetamide (Figure 2B). The site of the modification was chosen to be far enough way from the hOGG1-binding sites such that direct inhibition of target site binding would not occur (Supplementary Figure S5A). In addition, the internal fluorescent label provides a convenient and direct signal for detection of the internal B fragment resulting from two site cleavage events.
Figure 2.
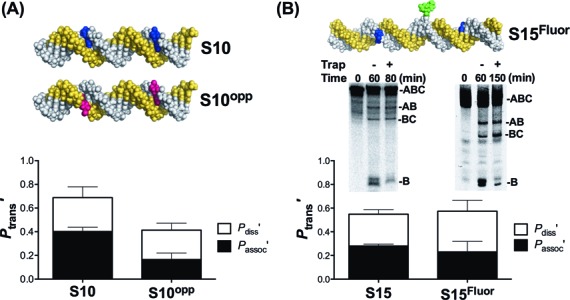
Associative transfers persist with target sites on opposite strands and when the phosphate backbone is blocked. **(A)**oG sites were placed on opposite DNA strands (S10opp) and the transfer probabilities were measured. (B) Fluorescein iodoacetamide was used to modify a single phosphorothioate linkage in the phosphate backbone connecting two oG sites separated by 15 bp (S15Fluor) and the transfer probabilities were measured and compared with an identical substrate without the block. In these measurements the internal B fragment is labeled. The two B bands result from the different mobilities of the β and δ elimination products derived from base treatment of the abasic reaction product. See Supplementary Figure S4B and S4C for full time courses.
We found that S10opp and S15Fluor both had associative transfer pathways (Figure 2). The overall transfer probability for S10opp (_P_trans′) was one-third lower than S10, which can be largely attributed to their different associative transfer probabilities. Specifically, both substrates had indistinguishable values for _P_diss′ ∼ 0.27, but _P_assoc′ for S10opp was reduced to a level about 40% of that observed with S10 (_P_assoc′ = 0.16 ± 0.08 and 0.40 ± 0.04, respectively) (Figure 2A). These data show that an untrappable associative-type of pathway still persists with S10opp even though hOGG1 must dissociate from one DNA strand, rotationally reorient 180o and then reassociate with the other DNA strand during transfer. With S15Fluor, the total transfers were identical as compared to the unmodified substrate S15 (_P_trans′ ∼ 0.55), and the associative transfers were only slightly decreased (_P_assoc′ = 0.18 ± 0.05 and 0.28 ± 0.05, respectively) (Figure 2B). Thus, associative transfers between two sites positioned on a single strand only 15 bp apart can occur in the presence of a covalent roadblock that prevents continuous contact with the phosphate backbone. At the very least these findings require a pathway for associative transfer that does not involve continuous contact with the phosphate backbone (‘sliding’) for distances longer than seven phosphate linkages (the position of the roadblock) (23,27,28). We note that the data in Figure 2 provide further strong evidence against intermolecular collision with other DNA chains because the site transfer probabilities were independent of DNA concentration in the range 20–400 nM.
Numerical simulations of hOGG1 site transfer
We used Monte Carlo simulations to model the experimental site transfer data for hOGG1. This approach does not require the use of force constants, but instead, is robustly constrained by the site spacing dependences of _P_trans′ and _P_assoc.′ as well as the physical and stochastic properties of diffusion (Supplementary Information and Supplementary Figures S6–S9). In addition, numerical methods allow interpretation of the bulk-averaged properties in terms of simulated single-particle behaviors that can then be compared with previous single-molecule studies of hOGG1 (29,30). Given the experimental findings, we employed a model for facilitated diffusion that utilizes a 2D random walk on the DNA surface punctuated with 3D dissociative transfers and the method is briefly described in the legend to Figure 3A.
Figure 3.
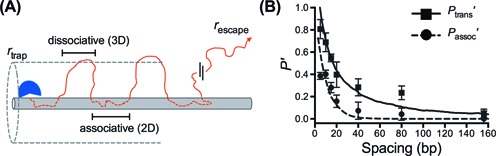
Monte Carlo simulations of site transfer using a combined 2D-3D model. (A) In the simulations, a protein trajectory begins with a random walk on the DNA surface (associative transfers), which are exited with a probability _p_exit that is determined from empirically modeling the experimental associative transfer data (see Supplementary Information and Supplementary Figure S8) leading to dissociation events where 3D diffusion occurs (_D_3 = 1.0 × 10⁸ nm2/sec). Once the enzyme is greater than _r_trap distance away from the DNA it is in a trappable dissociative transfer state; the enzyme either rebinds or is lost to bulk when the escape radius has been reached (_r_escape). Each time the protein comes in contact with the DNA the _x_-position along the DNA long axis is recorded into a histogram. The site spacing dependence of the binned contact probabilities were fitted to the experimental data. (B) Simulated fits to the experimental data for _P_assoc′ and _P_trans′. The curves are derived from the normalized histograms for associative transfer only (dotted line) or combined dissociative and associative transfers (solid line). The histograms were derived from the analysis of 10 000 simulated trajectories.
Thousands of single particle simulated trajectories were used to model the ensemble average behavior of hOGG1 (Figure 3B). To model _P_trans′, Monte Carlo transfer trajectories comprising both 2D and 3D steps were used. These trajectories reflect the total probability that hOGG1 will transfer between two sites of known spacing without escaping to bulk (_r_escape, Figure 3A). The experimentally observed site spacing distribution of _P_trans′ has a long tail that requires 3D dissociative transfer steps, which is a key aspect of the data captured by the Monte Carlo simulations (solid curve, Figure 3B). The site spacing dependence of the untrappable associative transfers (_P_assoc′) was simulated using only the associative Monte Carlo trajectories (dashed curve, Figure 3B). Unlike the probability distribution for _P_trans′, the distribution for _P_assoc′ falls off quickly with site spacing (Figure 3B), which is also well-fitted by the associative Monte Carlo trajectories.
DISCUSSION
The molecular clock approach has now been applied to human uracil DNA glycosylase (hUNG) (17) and hOGG1. It is striking that the site transfer properties for these enzymes are essentially the same, which allows us to infer that all members of the large superfamilies represented by these enzymes will exhibit similar behaviors. In addition, ensemble findings by others indicate that similar transfer properties are used by DNA glycosylases from other superfamilies (27,31).
The experimental findings provide straight-forward intuitive insights into the translocation mechanism of hOGG1 and the new approach of numerical simulations provides further microscopic detail. Without invoking numerical methods, simple inspection of the site spacing dependences of _P_trans′ and _P_assoc.′ in Figure 3B reveals that (i) there is roughly a 50% probability that hOGG1 will successfully translocate over 10 bp using the associative pathway, and (ii) roughly half of the enzyme molecules that depart the one site can transfer 20 bp using the combined dissociative and associative pathways without escape to bulk. In addition, the phosphate blocking experiment shows that if 1D strand sliding is occurring (defined as continuous contact with a DNA strand) such events cannot exceed seven phosphate linkages in length (Figure 2B). Finally, no detectable transfers occur beyond ∼150 bp. It is of great interest to understand why these ensemble results differ substantially from previous single molecule measurements, where mean sliding lengths of ∼900 bp were observed under similar conditions (32).
One way to extend the qualitative interpretation of the data, as well as link the ensemble and single molecule measurements, is to employ numerical simulations (Supplementary Information). This approach allows useful boundaries to be placed on key transfer events that occur during the average lifetime of the bound enzyme (τbind = 3 ms). These parameters include (i) the average number associative transfer events per binding event (four), (ii) the associative transfer time and mean transfer distance (ten to hundreds of microseconds and 9 bp), (iii) the dissociative hop time and median distance (ten to hundreds of nanoseconds and 20 bp) and (iii) the average damage search footprint that arises from the use of both transfer pathways (∼60 bp). These parameters and their distributions are discussed in the Supplementary Information and summarized in Figure 4 for a single associative-dissociative transfer cycle.
Figure 4.
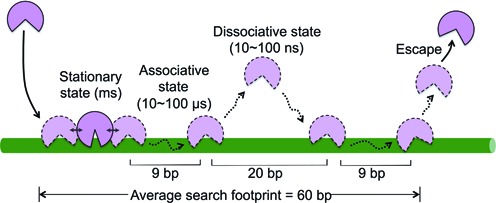
A single associative-dissociative transfer cycle of hOGG1. The ensemble mean binding lifetime of hOGG1 to non-target DNA is τbind = 3 ms. During this time the average hOGG1 molecule scans 60 bp of DNA as determined from numerical analysis of the data in Figure 3B (details in Supplementary Information). On average, each binding event consists of three associative-dissociative transfer cycles before a dissociation event leads to escape from the DNA (only one cycle is depicted). During a binding event, hOGG1 samples stationary states (25,26,41), mobile associative states, and dissociated states. The lifetime of the stationary state must consume the large part of τbind (i.e. τstat ∼ ms) (33,42), and must be much greater than the lifetime of the mobile associative state because movement requires weak interactions. The transition from the stationary to mobile associative state involves a conformational change in hOGG1 and the DNA (depicted with a solid two-headed arrow) as observed in rapid kinetic and structural studies (33,42,41). Numerical simulations indicate that the average binding event consists of four associative transfers and three dissociative transfers (three complete cycles). The time spent in a single dissociative and associative transfer step is on the order 10–100 ns and 10–100 μs, respectively (see text and Supplementary Information).
An average DNA search event of hOGG1 involves discrete states of the enzyme (Figure 4). The search begins with diffusional encounter of hOGG1 with the DNA. This initial encounter leads to associative transfers, or alternatively, a conformational change in hOGG1 that results in strong nonspecific DNA interactions and the generation of an immobile stationary state. If the stationary state is entered, a reverse conformational change is required to reinitiate associative transfer. Conformational changes between free hOGG1 and its nonspecific and specific DNA complexes are well documented in structures (25,26) and rapid kinetic studies (33,34). In this model, dissociative excursions must arise from the mobile associative state. This conclusion seems unavoidable because the stationary state interacts strongly with DNA and the principle of microscopic reversibility requires that the kinetic pathways for association and dissociation from DNA are the same. In essence, associative transfer can be viewed as a broad flat transition state for dissociation from the DNA that connects the stationary state with free enzyme. A similar conclusion was reached with hUNG (23).
The dissociative excursions depicted in Figure 4 play an important role even though the time spent in these states is vanishingly small and damage recognition cannot occur while the enzyme is not engaged with the DNA. Importantly, the use of rapid 3D diffusion over short time intervals results in short 20-bp excursions, which serve to expand the average search footprint to ∼60 bp without leaving gaps in coverage. In other words, the 3D excursion distances are similar to the associative transfer distances thereby providing redundant coverage. An additional function of the dissociative excursions is to allow bypass of obstacles that block the associative pathway. These bypass events are quickly resolved by efficient reinitiation of the associative transfers. This highly dynamic, multidimensional search mechanism is consistent with the ability of hOGG1, hUNG and human alkyl adenine DNA glycosylase to bypass obstacles that block the transfer pathway and the fundamental mechanistic requirement for rapid scanning of extended DNA regions for damage (6,5,28,17,23,24,27).
The numerical methods and simple hard sphere and cylinder model provide a simple and robust method to analyze these data without using molecular dynamics methods. This is because the key unknown—partitioning of the associative state between 2D steps and dissociation—is encoded in the experimental site transfer data. Accordingly, the simulations are only used to determine the frequency at which the dissociated enzyme escapes or recontacts the DNA cylinder. This calculation is robust because it only depends on shapes, the known diffusion constant for the free enzyme and Monte Carlo statistics. If electric field effects bias diffusion when the enzyme is in close proximity to the DNA, the efficiency of rebinding would be increased, but such effects would not alter the number of associative-dissociative cycles required to fit the data. Thus, the model in Figure 4 is relatively insensitive to higher order effects.
Reconciling bulk and single-molecule properties of hOGG1
The numerical analysis now allows reconciliation of the ensemble behavior of hOGG1 with diffusion parameters obtained in previous single-molecule studies (32,35). One key question is whether our ensemble data can reproduce the apparent 1D diffusion constant (_D_1app ∼ 2–5 × 10⁶ bp2/s) (32,35). To answer this, we calculated the mean-squared displacements from our simulation trajectories and plotted these against time (Supplementary Information and Supplementary Figure S9D and S9E). The slope of this plot gave _D1_app = 4 × 10⁶ bp2/s. Thus, the ensemble measurements can recapitulate the macroscopic _D_1app even though the microscopic process is not 1D. In essence, the rapid microscopic pathways detected in the molecular clock method are blurred into an apparently 1D process due to the distance and time resolution limits of the single-molecule TIRF measurements (36). In addition, our numerical analyses of the ensemble measurements could account for the reported salt concentration dependences of the single-molecule facilitated diffusion measurements (Supplementary Figure S9F and S9G). However, the long sliding lengths of 900 bp, and the binding lifetime of 100–200 ms under similar conditions must be attributed to the selective observation of rare long-lived transfer events in the single-molecule studies (Supplementary Figure S9E) (32).
Cellular mechanism of the damage search
The search model proposed here is unique because it does not utilize extended sliding along the DNA phosphate backbone, which is the hallmark of classical facilitated diffusion mechanisms (10,13,37). We see no obstacles for efficient operation of this mechanism in the context of the human cell nucleus. First, glycosylase enzymes are abundant (∼105 copies per cell) (38). Therefore, coverage of the nuclear volume is high, diffusion over large distances is not required and each enzyme molecule needs to survey only ∼15 Kbp of DNA. Second, associative transfers punctuated with frequent dissociative transfer events allows for efficient bypassing of protein obstacles yet rapid reinitiation of the associative search for damage. This mechanism is also compatible with the superhelical nature of DNA in cells, which may disrupt long-range sliding by the introduction of superhelical nodes. Finally, we speculate that ‘facilitation’ of a 3D-2D mechanism in the nucleus may be derived from the densely crowded environment. Molecular crowding is expected to favor compact associative transfers as compared to the dilute solution conditions used in the current measurements (39,40). Thus, efficient facilitated diffusion in the cell may be derived from the environment rather than a specific property of the enzyme.
SUPPLEMENTARY DATA
Supplementary Data are available at NAR Online.
SUPPLEMENTARY DATA
FUNDING
National Science Foundation [CHE1307275 to J.T.S.]; National Institute of Health [F32-GM105252–01 to M.M.R., RO1-GM056834 to J.T.S., CA090689 to S.S.D.] and American Heart Association [AHA-PRE12040394 to J.D.S.].
Conflict of interest statement. None declared.
REFERENCES
- 1.Shibutani S., Takeshita M., Grollman A.P. Insertion of specific bases during DNA synthesis past the oxidation-damaged base 8-oxodG. Nature. 1991;349:431–434. doi: 10.1038/349431a0. [DOI] [PubMed] [Google Scholar]
- 2.Hsu G.W., Ober M., Carell T., Beese L.S. Error-prone replication of oxidatively damaged DNA by a high-fidelity DNA polymerase. Nature. 2004;431:217–221. doi: 10.1038/nature02908. [DOI] [PubMed] [Google Scholar]
- 3.David S.S., O'Shea V.L., Kundu S. Base-excision repair of oxidative DNA damage. Nature. 2007;447:941–950. doi: 10.1038/nature05978. [DOI] [PMC free article] [PubMed] [Google Scholar]
- 4.Brooks S.C., Adhikary S., Rubinson E.H., Eichman B.F. Recent advances in the structural mechanisms of DNA glycosylases. Biochim. Biophys. Acta. 2013;1834:247–271. doi: 10.1016/j.bbapap.2012.10.005. [DOI] [PMC free article] [PubMed] [Google Scholar]
- 5.Friedman J.I., Stivers J.T. Detection of damaged DNA bases by DNA glycosylase enzymes. Biochemistry. 2010;49:4957–4967. doi: 10.1021/bi100593a. [DOI] [PMC free article] [PubMed] [Google Scholar]
- 6.Stivers J.T. Extrahelical damaged base recognition by DNA glycosylase enzymes. Chemistry. 2008;14:786–793. doi: 10.1002/chem.200701501. [DOI] [PMC free article] [PubMed] [Google Scholar]
- 7.Stanford N.P., Szczelkun M.D., Marko J.F., Halford S.E. One- and three-dimensional pathways for proteins to reach specific DNA sites. EMBO J. 2000;19:6546–6557. doi: 10.1093/emboj/19.23.6546. [DOI] [PMC free article] [PubMed] [Google Scholar]
- 8.Tafvizi A., Mirny L.A., van Oijen A.M. Dancing on DNA: kinetic aspects of search processes on DNA. Chemphyschem. 2011;12:1481–1489. doi: 10.1002/cphc.201100112. [DOI] [PMC free article] [PubMed] [Google Scholar]
- 9.Winter R.B., Berg O.G., Hippel P.H. Diffusion-driven mechanisms of protein translocation on nucleic acids. 3. The Escherichia coli lac repressor–operator interaction: kinetic measurements and conclusions. Biochemistry. 1981;20:6961–6977. doi: 10.1021/bi00527a030. [DOI] [PubMed] [Google Scholar]
- 10.Berg O.G., Winter R.B., Hippel P.H. Diffusion-driven mechanisms of protein translocation on nucleic acids. 1. Models and theory. Biochemistry. 1981;20:6929–6948. doi: 10.1021/bi00527a028. [DOI] [PubMed] [Google Scholar]
- 11.Winter R.B., Hippel P.H. Diffusion-driven mechanisms of protein translocation on nucleic acids. 2. The Escherichia coli lac repressor-operator interaction: equilibrium measurements. Biochemistry. 1981;20:6948–6960. doi: 10.1021/bi00527a029. [DOI] [PubMed] [Google Scholar]
- 12.Gowers D.M., Wilson G.G., Halford S.E. Measurement of the contributions of 1D and 3D pathways to the translocation of a protein along DNA. Proc. Natl. Acad. Sci. U.S.A. 2005;102:15883–15888. doi: 10.1073/pnas.0505378102. [DOI] [PMC free article] [PubMed] [Google Scholar]
- 13.Halford S.E., Marko J.F. How do site-specific DNA-binding proteins find their targets. Nucleic Acids Res. 2004;32:3040–3052. doi: 10.1093/nar/gkh624. [DOI] [PMC free article] [PubMed] [Google Scholar]
- 14.Gorman J., Greene E.C. Visualizing one-dimensional diffusion of proteins along DNA. Nat. Struct. Mol. Biol. 2008;15:768–774. doi: 10.1038/nsmb.1441. [DOI] [PubMed] [Google Scholar]
- 15.Gahlmann A., Moerner W.E. Exploring bacterial cell biology with single-molecule tracking and super-resolution imaging. Nat. Rev. Microbiol. 2014;12:9–22. doi: 10.1038/nrmicro3154. [DOI] [PMC free article] [PubMed] [Google Scholar]
- 16.Dunn A.R., Kad N.M., Nelson S.R., Warshaw D.M., Wallace S.S. Single Qdot-labeled glycosylase molecules use a wedge amino acid to probe for lesions while scanning along DNA. Nucleic Acids Res. 2011;39:7487–7498. doi: 10.1093/nar/gkr459. [DOI] [PMC free article] [PubMed] [Google Scholar]
- 17.Schonhoft J.D., Stivers J.T. Timing facilitated site transfer of an enzyme on DNA. Nat. Chem. Biol. 2012;8:205–210. doi: 10.1038/nchembio.764. [DOI] [PMC free article] [PubMed] [Google Scholar]
- 18.Porecha R.H., Stivers J.T. Uracil DNA glycosylase uses DNA hopping and short-range sliding to trap extrahelical uracils. Proc. Natl. Acad. Sci. U.S.A. 2008;105:10791–10796. doi: 10.1073/pnas.0801612105. [DOI] [PMC free article] [PubMed] [Google Scholar]
- 19.Leipold M.D., Workman H., Muller J.G., Burrows C.J., David S.S. Recognition and removal of oxidized guanines in duplex DNA by the base excision repair enzymes hOGG1, yOGG1, and yOGG2. Biochemistry. 2003;42:11373–11381. doi: 10.1021/bi034951b. [DOI] [PubMed] [Google Scholar]
- 20.Seiple L.A., Cardellina J.H., Akee R., Stivers J.T. Potent inhibition of human apurinic/apyrimidinic endonuclease 1 by arylstibonic acids. Mol. Pharmacol. 2008;73:669–677. doi: 10.1124/mol.107.042622. [DOI] [PMC free article] [PubMed] [Google Scholar]
- 21.Terry B.J., Jack W.E., Modrich P. Facilitated diffusion during catalysis by EcoRI endonuclease. Nonspecific interactions in EcoRI catalysis. J. Biol. Chem. 1985;260:13130–13137. [PubMed] [Google Scholar]
- 22.Radom C.T., Banerjee A., Verdine G.L. Structural characterization of human 8-oxoguanine DNA glycosylase variants bearing active site mutations. J. Biol. Chem. 2007;282:9182–9194. doi: 10.1074/jbc.M608989200. [DOI] [PubMed] [Google Scholar]
- 23.Schonhoft J.D., Kosowicz J.G., Stivers J.T. DNA translocation by human uracil DNA glycosylase: role of DNA phosphate charge. Biochemistry. 2013;52:2526–2535. doi: 10.1021/bi301561d. [DOI] [PMC free article] [PubMed] [Google Scholar]
- 24.Schonhoft J.D., Stivers J.T. DNA translocation by human uracil DNA glycosylase: the case of single-stranded DNA and clustered uracils. Biochemistry. 2013;52:2536–2544. doi: 10.1021/bi301562n. [DOI] [PMC free article] [PubMed] [Google Scholar]
- 25.Bruner S.D., Norman D.P., Verdine G.L. Structural basis for recognition and repair of the endogenous mutagen 8-oxoguanine in DNA. Nature. 2000;403:859–866. doi: 10.1038/35002510. [DOI] [PubMed] [Google Scholar]
- 26.Banerjee A., Yang W., Karplus M., Verdine G.L. Structure of a repair enzyme interrogating undamaged DNA elucidates recognition of damaged DNA. Nature. 2005;434:612–618. doi: 10.1038/nature03458. [DOI] [PubMed] [Google Scholar]
- 27.Hedglin M., O'Brien P.J. Hopping enables a DNA repair glycosylase to search both strands and bypass a bound protein. ACS Chem. Biol. 2010;5:427–436. doi: 10.1021/cb1000185. [DOI] [PMC free article] [PubMed] [Google Scholar]
- 28.Sidorenko V.S., Zharkov D.O. Correlated cleavage of damaged DNA by bacterial and human 8-oxoguanine-DNA glycosylases. Biochemistry. 2008;47:8970–8976. doi: 10.1021/bi800569e. [DOI] [PubMed] [Google Scholar]
- 29.DeSantis M.C., Li J.-L., Wang Y.M. Protein sliding and hopping kinetics on DNA. Phys. Rev. E Stat. Nonlin. Soft Matter Phys. 2011;83:021907. doi: 10.1103/PhysRevE.83.021907. [DOI] [PMC free article] [PubMed] [Google Scholar]
- 30.Bonnet I., Biebricher A., Porte P.L., Loverdo C., Benichou O., Voituriez R., Escude C., Wende W., Pingoud A., Desbiolles P. Sliding and jumping of single EcoRV restriction enzymes on non-cognate DNA. Nucleic Acids Res. 2008;36:4118–4127. doi: 10.1093/nar/gkn376. [DOI] [PMC free article] [PubMed] [Google Scholar]
- 31.Hedglin M., O'Brien P.J. Human alkyladenine DNA glycosylase employs a processive search for DNA damage. Biochemistry. 2008;47:11434–11445. doi: 10.1021/bi801046y. [DOI] [PMC free article] [PubMed] [Google Scholar]
- 32.Blainey P.C., van Oijen A.M., Banerjee A., Verdine G.L., Xie X.S. A base-excision DNA-repair protein finds intrahelical lesion bases by fast sliding in contact with DNA. Proc. Natl. Acad. Sci. U.S.A. 2006;103:5752–5757. doi: 10.1073/pnas.0509723103. [DOI] [PMC free article] [PubMed] [Google Scholar]
- 33.Kuznetsov N.A., Koval V.V., Zharkov D.O., Nevinsky G.A., Douglas K.T., Fedorova O.S. Kinetics of substrate recognition and cleavage by human 8-oxoguanine-DNA glycosylase. Nucleic Acids Res. 2005;33:3919–3931. doi: 10.1093/nar/gki694. [DOI] [PMC free article] [PubMed] [Google Scholar]
- 34.Kuznetsov N.A., Koval V.V., Nevinsky G.A., Douglas K.T., Zharkov D.O., Fedorova O.S. Kinetic conformational analysis of human 8-oxoguanine-DNA glycosylase. J. Biol. Chem. 2007;282:1029–1038. doi: 10.1074/jbc.M605788200. [DOI] [PubMed] [Google Scholar]
- 35.Blainey P.C., Luo G., Kou S.C., Mangel W.F., Verdine G.L., Bagchi B., Xie X.S. Nonspecifically bound proteins spin while diffusing along DNA. Nat. Struct. Mol. Biol. 2009;16:1224–1229. doi: 10.1038/nsmb.1716. [DOI] [PMC free article] [PubMed] [Google Scholar]
- 36.Wang Y.M., Austin R.H. Single-molecule imaging of LacI diffusing along nonspecific DNA. In: Williams MC, Maher JL, editors. In Biophysics of DNA-Protein Interactions From Single Molecules to Biological Systems. New York: Springer; 2011. pp. 9–37. [Google Scholar]
- 37.Hippel P.H., Berg O.G. Facilitated target location in biological systems. J. Biol. Chem. 1989;264:675–678. [PubMed] [Google Scholar]
- 38.Cappelli E. Rates of base excision repair are not solely dependent on levels of initiating enzymes. Carcinogenesis. 2001;22:387–393. doi: 10.1093/carcin/22.3.387. [DOI] [PubMed] [Google Scholar]
- 39.Schreiber G., Haran G., Zhou H.X. Fundamental aspects of protein− protein association kinetics. Chem. Rev. 2009;109 doi: 10.1021/cr800373w. [DOI] [PMC free article] [PubMed] [Google Scholar]
- 40.Zhou H.X., Rivas G., Minton A.P. Macromolecular crowding and confinement: biochemical, biophysical, and potential physiological consequences. Annu. Rev. Biophys. 2008;37 doi: 10.1146/annurev.biophys.37.032807.125817. [DOI] [PMC free article] [PubMed] [Google Scholar]
- 41.Chen L., Haushalter K.A., Lieber C.M., Verdine G.L. Direct visualization of a DNA glycosylase searching for damage. Chem. Biol. 2002;9:345–350. doi: 10.1016/s1074-5521(02)00120-5. [DOI] [PubMed] [Google Scholar]
- 42.Kirpota O.O., Zharkov D.O., Buneva V.N., Nevinskii G.A. [Interactions of human 8-oxoguanine-DNA glycosylase with single- and double-stranded DNA] Mol. Biol. (Mosk.) 2006;40:1055–1063. [PubMed] [Google Scholar]
Associated Data
This section collects any data citations, data availability statements, or supplementary materials included in this article.
Supplementary Materials
SUPPLEMENTARY DATA