Pseudouridine profiling reveals regulated mRNA pseudouridylation in yeast and human cells (original) (raw)
. Author manuscript; available in PMC: 2015 May 6.
Published in final edited form as: Nature. 2014 Sep 5;515(7525):143–146. doi: 10.1038/nature13802
Abstract
Post-transcriptional modification of RNA nucleosides occurs in all living organisms. Pseudouridine, the most abundant modified nucleoside in non-coding RNAs1, enhances the function of transfer RNA and ribosomal RNA by stabilizing RNA structure2–8. mRNAs were not known to contain pseudouridine, but artificial pseudouridylation dramatically affects mRNA function – it changes the genetic code by facilitating non-canonical base pairing in the ribosome decoding center9,10. However, without evidence of naturally occurring mRNA pseudouridylation, its physiological was unclear. Here we present a comprehensive analysis of pseudouridylation in yeast and human RNAs using Pseudo-seq, a genome-wide, single-nucleotide-resolution method for pseudouridine identification. Pseudo-seq accurately identifies known modification sites as well as 100 novel sites in non-coding RNAs, and reveals hundreds of pseudouridylated sites in mRNAs. Genetic analysis allowed us to assign most of the new modification sites to one of seven conserved pseudouridine synthases, Pus1–4, 6, 7 and 9. Notably, the majority of pseudouridines in mRNA are regulated in response to environmental signals, such as nutrient deprivation in yeast and serum starvation in human cells. These results suggest a mechanism for the rapid and regulated rewiring of the genetic code through inducible mRNA modifications. Our findings reveal unanticipated roles for pseudouridylation and provide a resource for identifying the targets of pseudouridine synthases implicated in human disease11–13.
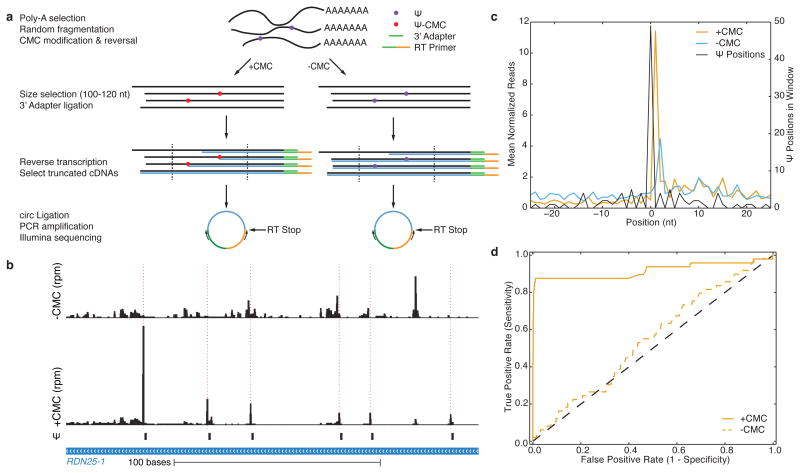
Although more than 100 classes of RNA modifications have been characterized, primarily in tRNA and rRNA14, only three modified nucleotides have been identified within the coding sequences of mRNA – m6A, m5C, and inosine15–19. To define the global landscape of RNA pseudouridylation in vivo and determine whether mRNAs contain pseudouridine (Ψ), we developed a high-throughput method to identify Ψ in the transcriptome with single-nucleotide resolution. Ψ can be selectively modified with _N_-cyclohexyl-_N_′-(2-morpholinoethyl)carbodiimide metho-p-toluenesulfonate (CMC) to generate a block to reverse transcriptase (RT) one nucleotide 3′ to the pseudouridylated site20. We exploited this chemistry to determine the locations of Ψ using next-generation sequencing (Fig. 1a; see Methods). Mock-treated (−CMC) RNA fragments were processed in parallel to identify pseudouridine-independent RT stops.
Figure 1. Genome-wide pseudouridine sequencing with single nucleotide resolution.
a) A schematic of Pseudo-seq library preparation. b) A genome browser view of Pseudo-seq reads mapping to a 200-nt region of RDN25-1 (chrXII:452168–452367) containing six known Ψs, generated from pooled reads for n =12 technical replicates from wild-type log phase yeast cultures. Peaks of Ψ-dependent reads are indicated with dashed red lines. c) A metaPsi plot of mean normalized reads (left axis) for +CMC (orange) and −CMC (blue) libraries. The number of Ψs at each position in the metaPsi window is indicated (black, right axis). CMC-dependent RT stops are found 1 nt 3′ of known Ψs. d) A ROC curve of the Pseudo-seq signal for all known Ψs in rRNA and U2 snRNA.
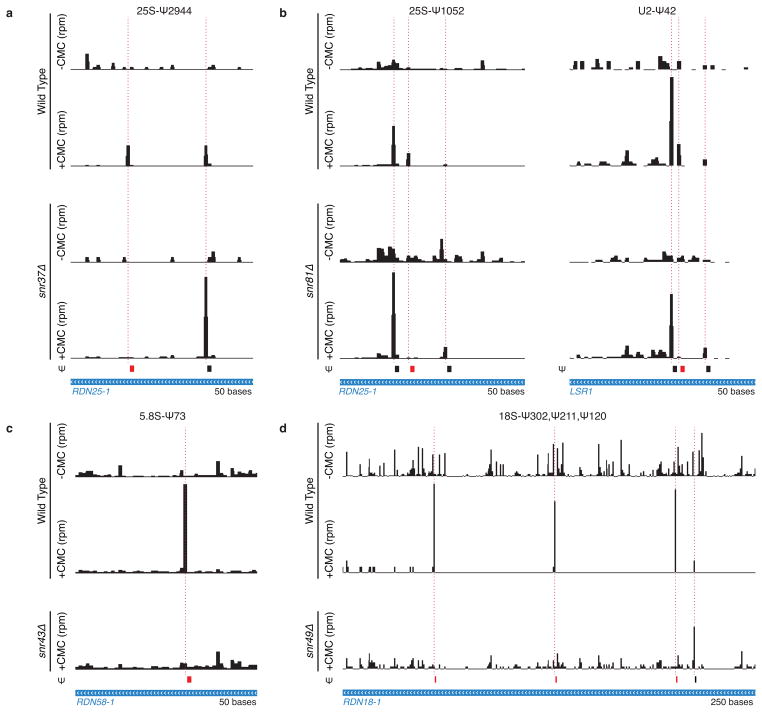
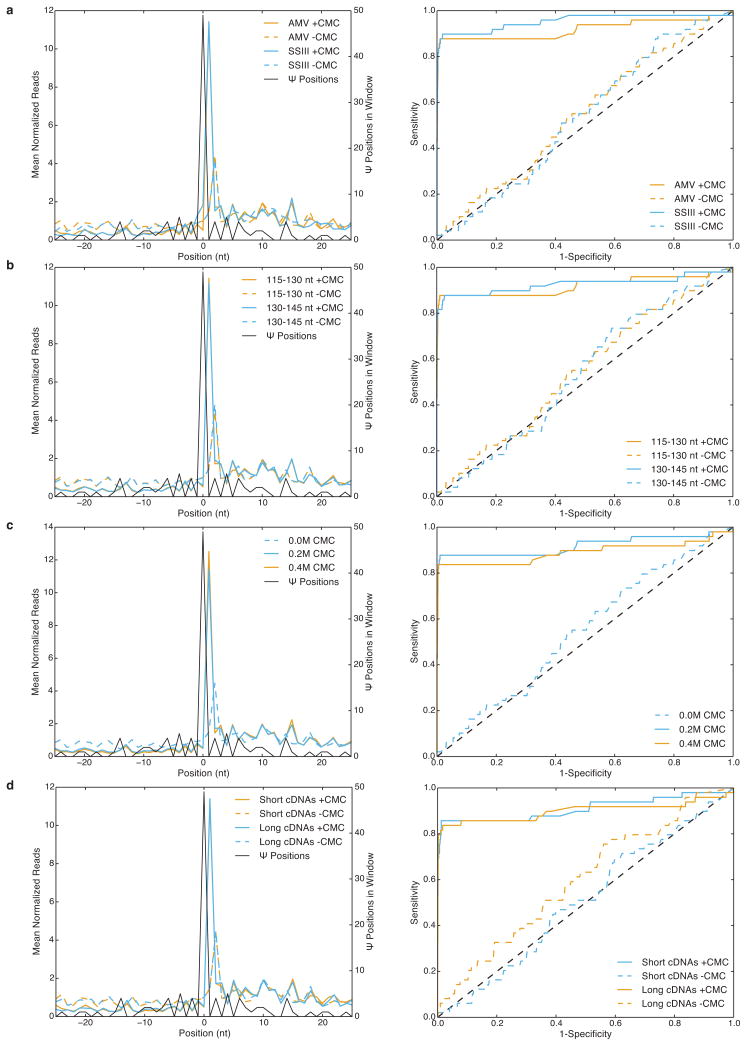
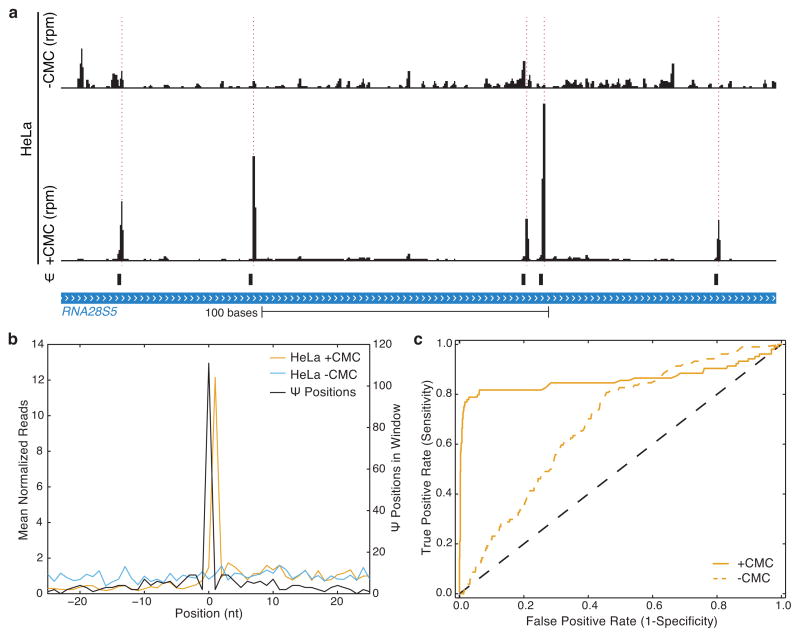
Using Pseudo-seq and stringent Ψ-calling criteria, we identified 42/51 known Ψs in rRNA and snRNA (Supplementary Table 1) with an observed false positive rate of 0.1%. The estimated FDR ranges from ~5% for highly expressed genes to ~12.5% for lowly expressed genes. (Fig. 1b–d and Methods). 6/9 false negatives were due to ‘shadowing’ from RT stops 3′ of the Ψ (e.g. 25S-Ψ2258 was not detected upstream of Ψ2260). We also identified many Ψs in tRNA, all of which occurred at known positions (Supplementary Table 2). We verified the single-nucleotide resolution of Pseudo-seq by profiling four snoRNA deletion mutants that eliminate pseudouridylation of nine specific rRNA and snRNA target sites (Extended Data Fig. 1a–d). Similar specificity and sensitivity were achieved using different RT enzymes, RNA fragment lengths, CMC concentrations, and truncated cDNA lengths, demonstrating the robustness of the Pseudo-seq method (Extended Data Fig. 2a–d).
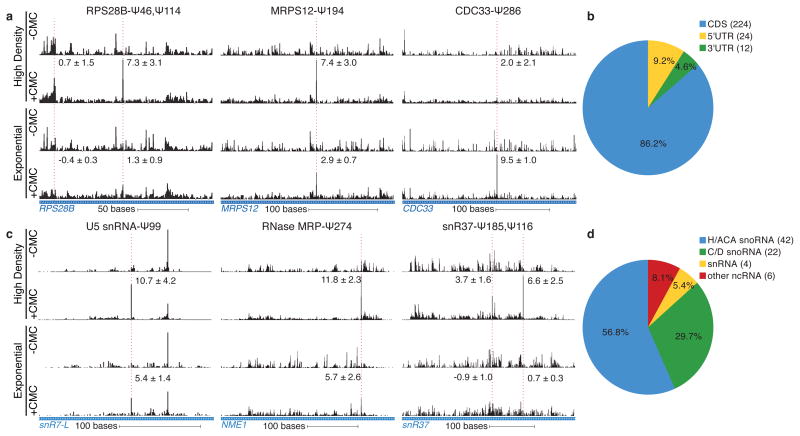
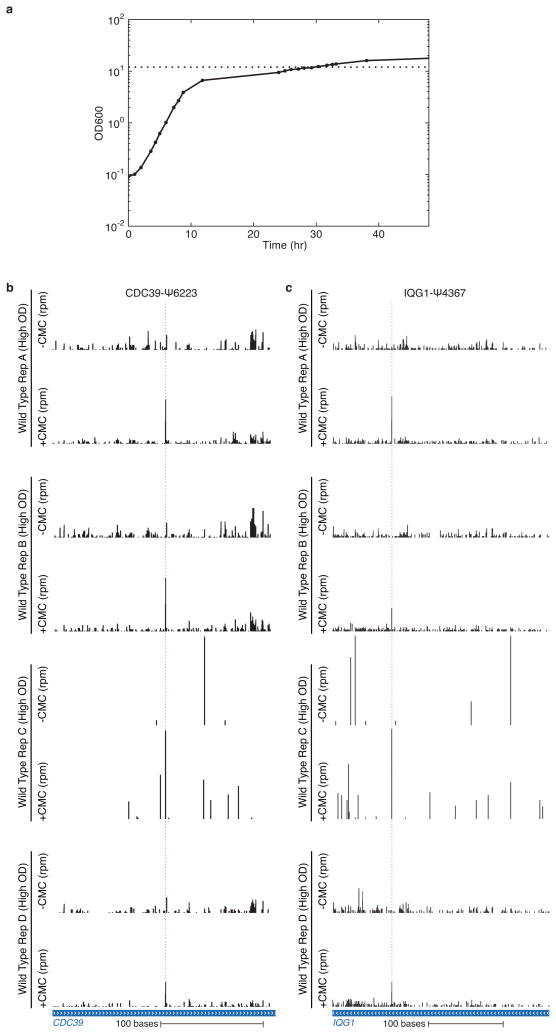
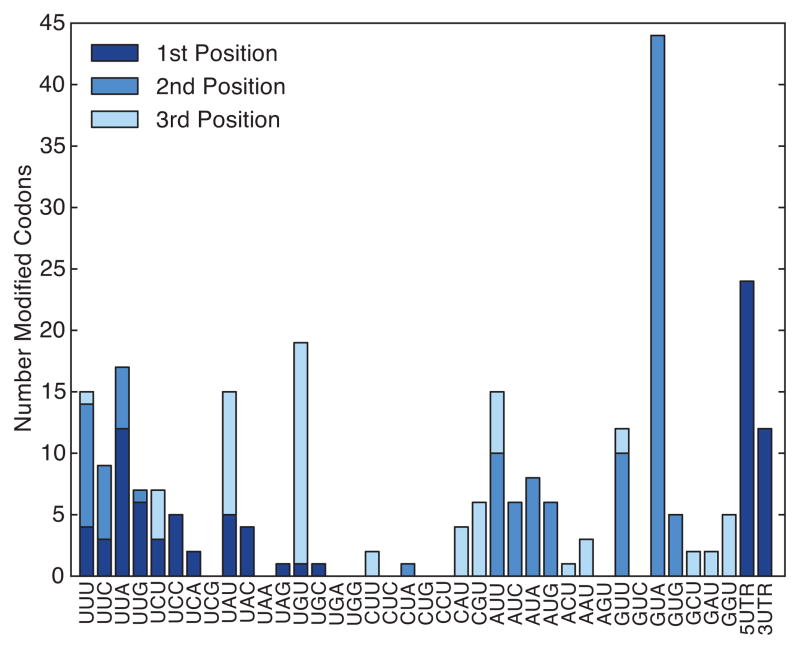
After validating the ability of Pseudo-seq to detect known Ψs in non-coding RNAs, we next analyzed mRNA pseudouridylation in budding yeast during post-diauxic growth (OD600 = 12) (Extended Data Fig. 3a). To define high confidence Pseudo-seq hits even in transcripts with sparse read coverage, we required reproducibility in 10/14 independent experiments (Extended Data Fig. 3b,c). Strikingly, we found that many mRNAs contain Ψ (Fig. 2a). In total, we conservatively identified 260 Ψs in 238 protein-coding transcripts (Supplementary Table 3). Relaxing our criteria to include Ψs detected in 9/14 experiments, a category that includes the known Ψ56 in U2 snRNA, increased the number of candidate mRNA Ψs to 466. We established a rough detectability threshold by determining the lowest observed expression level of genes having sufficient reads for reproducible Ψ calling; 5,278 genes passed the cutoff. Thus, it is unlikely that there are substantially more mRNA Ψs to be discovered in post-diauxic yeast. We conclude that mRNA pseudouridines are relatively scarce. Ψs were found in 5′ transcript leaders (5′TLs), coding sequences (CDS), and 3′ untranslated regions (3′UTRs) with an underrepresentation of Ψ in 3′UTRs (p = 10−4, hypergeometric test) (Fig. 2b). GUA valine codons were the most frequently modified, suggesting the existence of a sequence-specific mechanism for mRNA pseudouridylation (Extended Data Fig. 4).
Figure 2. Yeast mRNAs and ncRNAs are inducibly pseudouridylated.
a,c) CMC-dependent peaks of reads are indicated with a dashed red line. The median Pseudo-seq peak heights in each condition are given ±SD, negative peak values occur when the reads in the −CMC library exceed those in the +CMC library. Traces are representative of four wild-type biological replicates. a) Pseudo-seq reads in RPS28B (chrXII:673163–673336), MRPS12 (chrXIV:694489–694736), and CDC33 (chrXV:50560–60875). b) Summary of locations of Ψs within mRNA features. c) Pseudo-seq reads in U5 snRNA (snR7-L, chrVII:939458–939671), RNase MRP RNA (NME1, chrXIV:585585–585925), and an H/ACA snoRNA (snR37, chrX:228090–228475). d) Summary of novel Ψs identified in ncRNA.
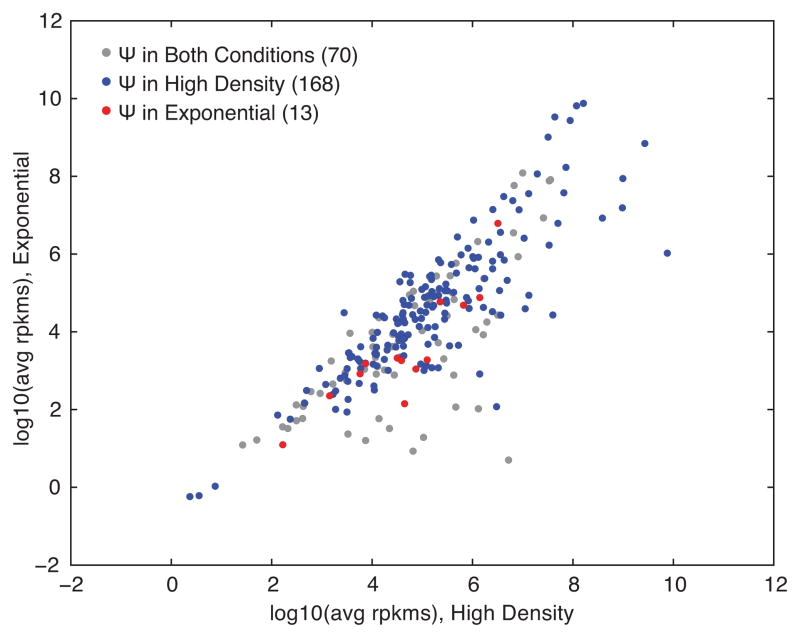
We investigated the potential for regulation of mRNA pseudouridylation by comparing two cellular conditions with substantial differences in gene expression and physiology: log phase and post-diauxic growth. Remarkably, most mRNA Ψs were regulated – 42% of the sites modified during post-diauxic growth were not detectably modified in log phase, while other sites, such as CDC33 Ψ286, were much more extensively modified during exponential growth. Moreover, of the 150 modified sites detected in both log phase and post-diauxic growth, 62 showed >2-fold changes in peak height between conditions indicating growth state-dependent changes in the extent of mRNA modification (Fig. 2a and Supplementary Table 3). Importantly, we ruled out differences in mRNA expression as an explanation for condition-dependent differences in Ψ detection (Extended Data Fig. 5). Thus, the process of mRNA pseudouridylation is regulated in response to environmental cues.
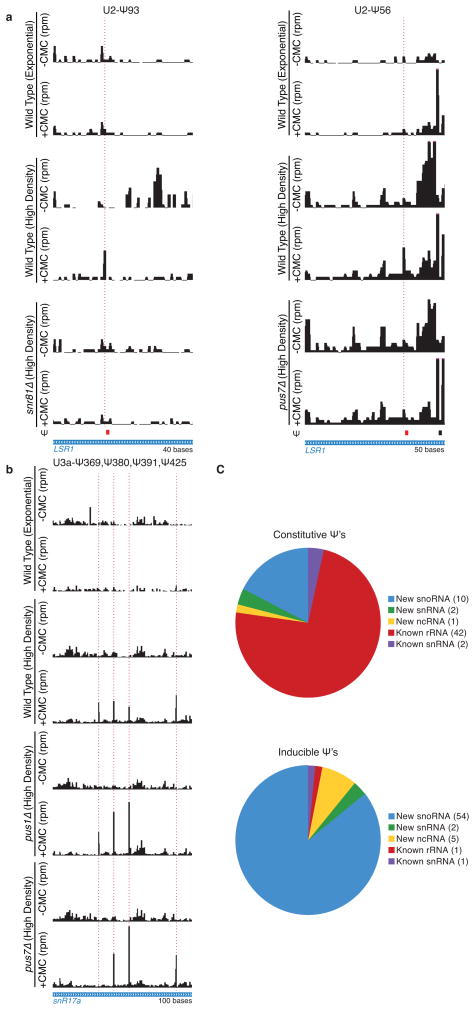
Yeast non-coding RNAs (ncRNA) have been extensively characterized for post-transcriptional modifications. Nevertheless, we identified 74 novel pseudouridylated sites in ncRNAs (Supplemental Table 4). A few, like Ψ274 in the RNase MRP RNA (NME1) (Fig. 2c), were constitutively modified, while most, including the previously described Ψ56 and Ψ93 in U2 snRNA21, were induced during post-diauxic growth (Extended Data Fig. 6a). Small nucleolar RNAs (snoRNA) were notably enriched among ncRNA classes with regulated pseudouridines: 19/29 H/ACA and 14/47 C/D snoRNAs showed one or more sites specifically modified in cells grown to high density (Fig. 2d, Extended Data Fig. 6b,c). Pseudouridylation of rRNA sites changed very little: only one site, 25S-Ψ2314, changed more than 2-fold. However, due to the stability of rRNA and the greatly reduced rate of ribosome synthesis during post-diauxic growth, we cannot rule out production of a minority population of differentially modified ribosomes in dense cultures.
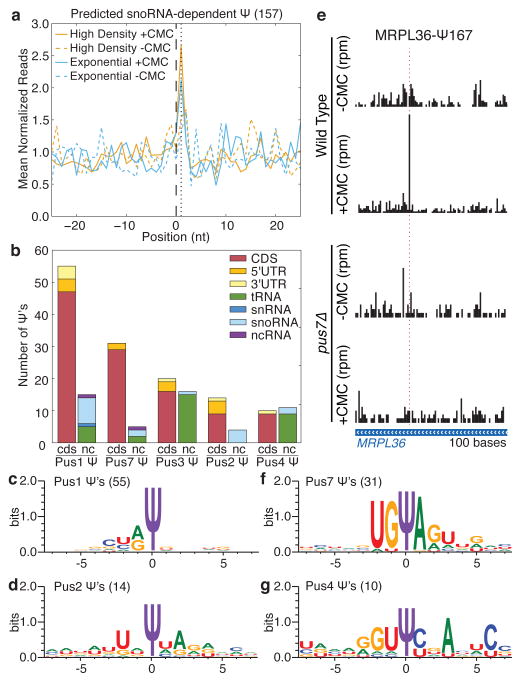
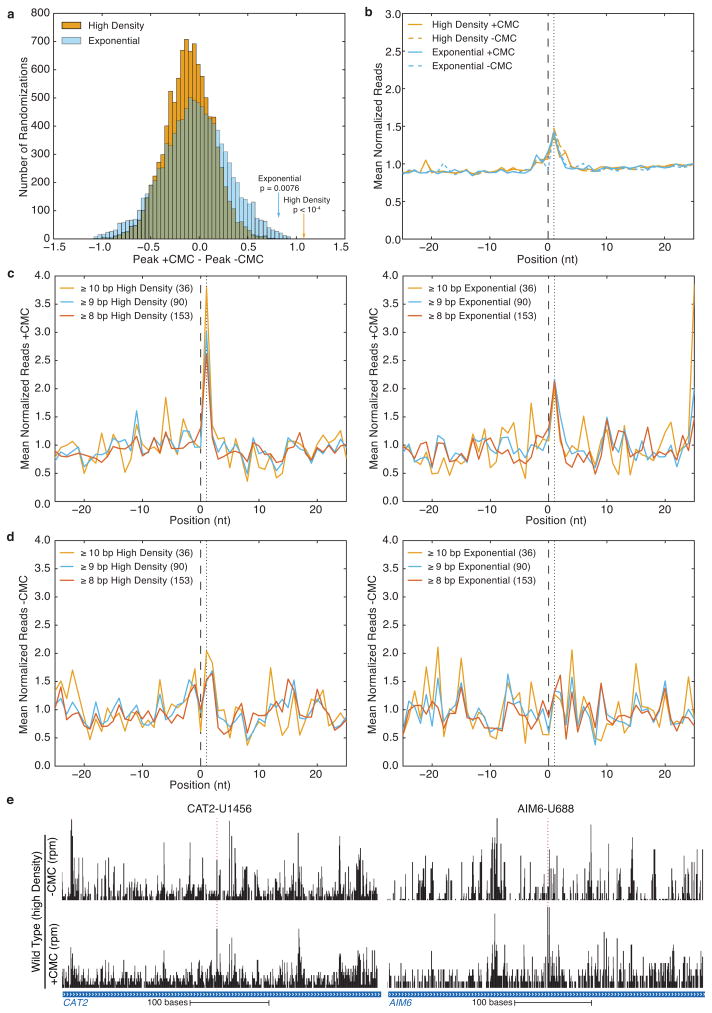
We next sought to define the molecular basis for targeting of novel mRNA and ncRNA sites for pseudouridylation. Ψs in rRNA, snRNA, and tRNA are produced by two classes of enzymes with distinct modes of target recognition. The first class, which includes yeast Cbf5 and human Dyskerin, associates with H/ACA snoRNAs to direct pseudouridylation of sites that base pair with the snoRNA guide sequences, while the second class recognizes its targets without the aid of an RNA guide. We computationally identified 157 unique sites in mRNAs containing perfect matches to canonical snoRNA targets (Supplemental Table 5). When these potential pseudouridylation sites were considered in aggregate, statistically significant pseudouridylation was detected (Fig. 3a, Extended Data Fig. 7a,b), which increased with the number of base pairs to the snoRNA guide sequence and was specific to post-diauxic growth (Extended Data Fig. 7c,d). However, only three such sites passed our threshold for Ψ calling on their own (Extended Data Fig. 7e). Thus, it is likely that many additional mRNAs are pseudouridylated at a low level and our estimate of 260 mRNA Ψ’s represents a conservative minimum.
Figure 3. Mechanisms of mRNA pseudouridylation.
a) MetaPsi plot of mean normalized reads for computationally predicted snoRNA-dependent targets in mRNA from high density cultures (orange), log phase cultures (blue), +CMC (solid), and −CMC (dashed). Indicated are the predicted snoRNA target site (black, dashed), and the expected peak of CMC-dependent reads (black, dotted). Reads were pooled from four wild-type biological replicate libraries. b) Summary of Ψs identified by Pseudo-seq as _PUS_-dependent. The few _PUS6_- and _PUS9_-dependent Ψs are not shown. The locations of Ψs within mRNAs and the distribution of Ψs among ncRNA types are indicated. c,d,f,g) Sequence motifs surrounding _PUS1_- (c), _PUS2_- (d), _PUS7_- (f), and _PUS4_-dependent (g) Ψs in mRNAs, generated by WebLogo 3.3. d) _PUS7_-dependent Pseudo-seq reads in MRPL36 (chrII:484301–484400).
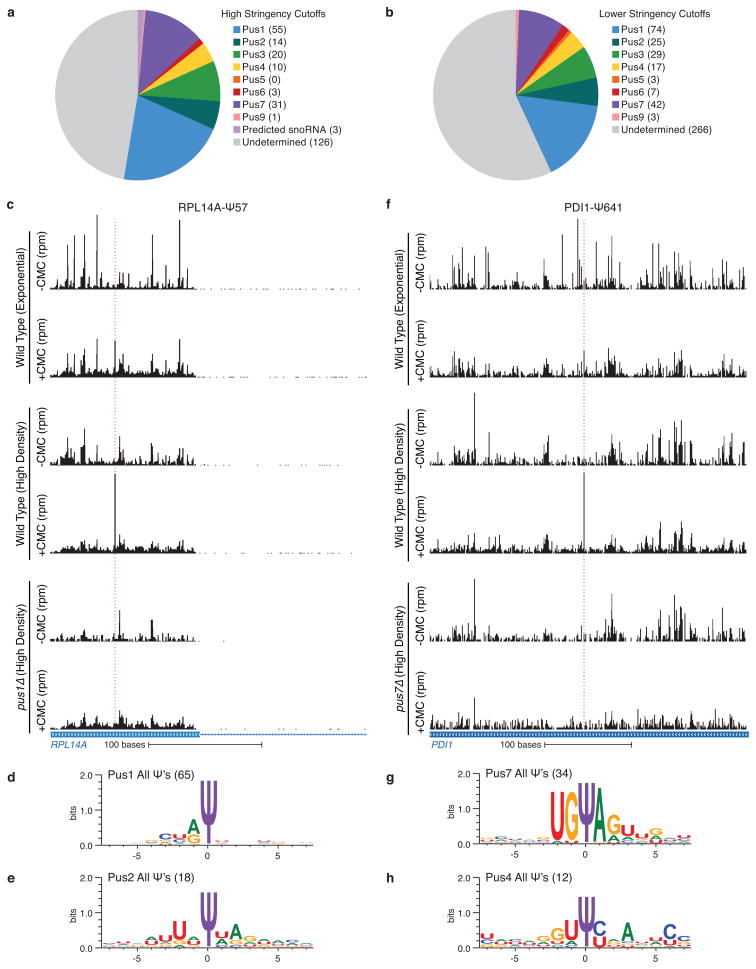
Because most pseudouridylated sites showed no significant complementarity to snoRNA guide sequences, we next investigated whether snoRNA-independent pseudouridine synthases are responsible for modifying sites in mRNAs. Yeast has nine pseudouridine synthase (PUS) genes, all of which are expressed in both log phase and post-diauxic growth. We profiled the eight viable PUS deletion strains (pusΔ) grown to high density and identified mRNA targets for each Pus protein, with the exception of Pus5 whose only known target is the 21S mitochondrial rRNA 22 (Fig. 3b, Extended Data Fig. 8a,b and Supplemental Table 6). The largest number of mRNA and novel ncRNA Ψs could be assigned to Pus1, a member of the TruA family that constitutively modifies multiple positions in cytoplasmic tRNAs and one position in U2 snRNA by a mode of target recognition that is incompletely defined. Whereas known Pus1-dependent tRNA targets showed constitutive pseudouridylation as expected, most of the mRNA targets showed increased modification during post-diauxic growth (Extended Data Fig. 8c, Supplemental Table 3). The mRNA targets of Pus1 showed little similarity at the primary sequence level, consistent with the proposed structure-dependent mode of target recognition by this enzyme (Fig. 3c, Extended Data Fig. 8d),23 while Pus2, a close paralog of Pus1, had 14 mRNA targets with a weak sequence consensus distinct from Pus1 (Fig. 3d, Extended Data Fig. 8e). Intriguingly, the Pus1 targets included seven genes encoding five proteins of the large ribosomal subunit, a significant enrichment (p = 0.025). Our comprehensive pseudouridine profiling more than doubles the number of known substrates of Pus1 and Pus2, identifies unanticipated mRNA targets, and provides the first demonstration of regulated pseudouridylation by these enzymes.
Unlike Pus1 and Pus2, the mRNA targets of Pus4 and Pus7 contained clear consensus sites in agreement with the known sequence requirements for these enzymes to modify their canonical tRNA targets, UGΨAR for Pus7 and GUΨCNANNC for Pus4 (Fig. 3e–g, Extended Data Fig. 8f–h)24,25. We also identified novel targets for Pus3 (20 mRNA, 1 ncRNA), Pus6 (3, 1) and Pus9 (1, 0), and, in total, assigned 52% of mRNA Ψs and 31% of novel ncRNA Ψs to individual Pus proteins. The remaining sites may be modified by the essential protein Pus8 and/or may be redundantly targeted by multiple Pus proteins. Together, these results reveal unanticipated diversity in Pus targets and show that Pus-dependent non-tRNA sites are regulated in response to changing cellular growth conditions. The discovery of novel mRNA substrates for Pus proteins raises the possibility that other tRNA modifying enzymes may likewise target mRNAs.
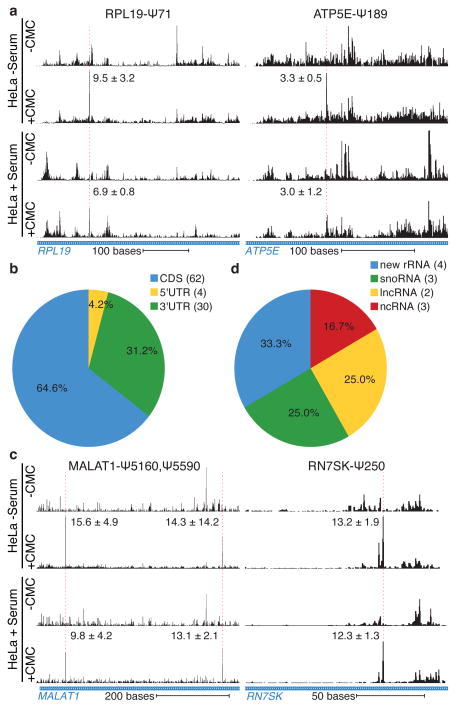
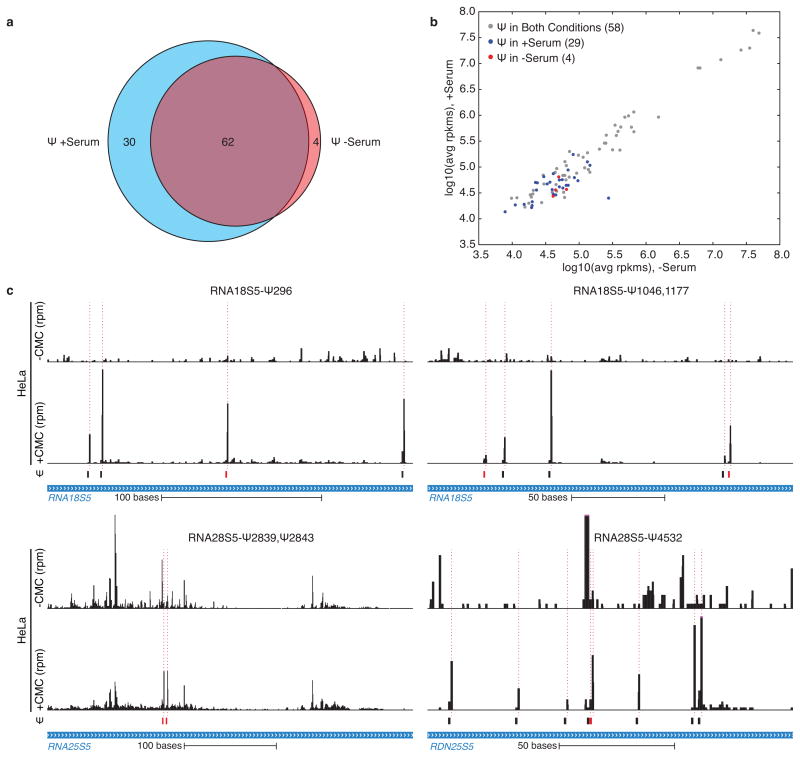
As the pseudouridine synthases that modify yeast mRNAs are conserved throughout eukaryotes, we investigated whether regulated mRNA pseudouridylation also occurs in mammalian cells. Human cervical carcinoma (HeLa) cells were profiled during normal proliferation and 24 hr after serum starvation. Pseudo-seq detected known pseudouridines with good sensitivity and specificity (Supplementary Table 7, Extended Data Fig. 9a–c). By restricting our analysis to more highly expressed genes and requiring reproducibility in four independent biological replicates, we conservatively identified 96 Ψs in 89 human mRNAs (Supplementary Table 8). As in yeast, some Ψ modifications in human mRNAs were regulated by cellular growth state (Fig. 4a, Extended Data Fig. 10a,b), and modified sites were found throughout the transcript (Fig. 4b). We also discovered novel Ψs in human ncRNAs, including 4 previously unknown sites in rRNA (Extended Data Fig. 10c, Supplementary Table 9) and sites in lnc-, sn- and snoRNAs (Fig. 4c,d). Thus, the Pseudo-seq approach is broadly applicable to diverse organisms and growth states. Moreover, the phenomenon of regulated mRNA pseudouridylation is conserved from yeast to humans.
Figure 4. Regulated pseudouridylation of human RNAs.
Pseudo-seq was performed on HeLa cells grown in the presence or absence of serum for 24 hr. a,b) CMC-dependent peaks of reads are indicated with a dashed red line. The median Pseudo-seq peak heights in each condition are given ±SD. Traces are representative of n=4 (−serum), and n=5 (+serum) biological replicates. Genome browser views represent spliced transcripts. a) Pseudo-seq reads from RPL19 (12–460), and ATP5E (154–437). b) Summary of locations of Ψs within mRNA features. c) Pseudo-seq reads from MALAT1 (5081–5636) and RN7SK (142–307). d) Summary of novel Ψs identified in ncRNA.
In summary, Pseudo-seq provides comprehensive analysis of RNA pseudouridylation with single-nucleotide resolution and reveals that endogenous mRNAs are specifically pseudouridylated in a highly regulated manner in yeast and human cells. Because Ψ stabilizes RNA structure, mRNA pseudouridylation could alter translation initiation efficiency26,27, ribosome pausing28, RNA localization29, and regulation by RNA interference30, to name a few aspects of mRNA metabolism known to be affected by RNA structure, although we cannot exclude the possibility that many instances of mRNA pseudouridylation may be functionally silent. However, given recent evidence that pseudouridine profoundly affects decoding by ribosomes from diverse organisms9, our results also raise the possibility of widespread regulated rewiring of the genetic code. Finally, this work suggests that diseases associated with mutations in pseudouridine synthases, including mitochondrial myopathy and sideroblastic anemia (MLASA)11, dyskeratosis congenita12, and lung cancer13, could be due to misregulation of mRNA targets.
Methods
Yeast Strains and Growth
All yeast strains are BY4741 or BY4742 derivatives (BY4742: wild type (YWG11), snr37Δ (YWG287, YWG343), snr43Δ (YWG293), snr49Δ (YWG299, YWG354), snr81Δ (YWG322, YWG376) pus4Δ (YWG1251, YWG1252), BY4741: pus1Δ (YWG1209), pus1Δ (YWG1209), pus2Δ (YWG1210), pus3Δ (YWG1211), pus5Δ (YWG1212), pus6Δ (YWG1213), pus7Δ (YWG1214), pus9Δ (YWG1215)). The snoRNA deletion strains and pus4Δ strains were made using PCR-based deletion cassettes31. The other pusΔ strains were obtained from the Yeast Deletion Collection32. Strains were grown at 30ºC in YPAD (1% yeast extract, 2% peptone, 0.01% adenine hemisulfate, 2% glucose), and were harvested by centrifugation in log phase (OD ~1), or at high density (OD ~12–15).
Cell Culture
HeLa (human cervix adenocarcinoma; CCL-2, ATCC) cells were cultured in DMEM (D6429; Sigma) supplemented with 10% fetal bovine serum (FBS; Atlanta Biologicals). Cells were grown at 37°C with 5% CO2 under standard laboratory conditions. For serum starvation cells were plated at a density of 5 x 10⁶ per 150 mm plate in DMEM+10% FBS, 24 hr prior to the experiment. Cells were then washed three times in PBS, before the addition of either serum-free medium (DMEM, no FBS) or full medium containing FBS (DMEM+10% FBS) for 24 hr.
Pseudo-seq Library Preparation
Yeast total RNA was isolated by hot acid phenol extraction, followed by isopropanol precipitation33. HeLa total RNA was isolated using QIAzol (QIAgen; 79306). PolyA+ RNA was isolated from 10 mg (yeast) or 2 mg (HeLa) total RNA using oligo dT cellulose beads (NEB; S1408S), as described34. For some libraries, two sequential rounds of polyA selection were performed. Yeast RNA was fragmented in 10 mM ZnCl2 at 94°C for 5 min (total RNA) or 55 seconds (polyA+ RNA), and HeLa RNA was fragmented in 10 mM ZnAcetate at 60°C for 10 min. Fragmented RNA was then precipitated.
CMC treatment of RNA fragments was as follows20. RNA was denatured in 5 mM EDTA at 80°C for 2 min, and then placed on ice. 0.5M CMC in BEU buffer (7 M urea, 4 mM EDTA, 50 mM bicine, pH 8.5) was added to a final concentration of 0.2 or 0.4 M CMC (4X RNA volume). CMC modification was carried out at 40°C for 30 min, followed by ethanol precipitation. Subsequent reversal of modification of Us and Gs was carried out in NaCO3 buffer (50 mM sodium-carbonate, pH 10.4, 2 mM EDTA) at 50°C for 2 hr, followed by precipitation. In parallel mock-treated samples were incubated in BEU buffer without CMC.
RNA fragments were dephosphorylated with CIP (NEB; M0290) and PNK (NEB; M0201), followed by size selection and elution of 80–100, 100–120, and 120–140 nt fragments on an 8% urea-TBE PAGE gel, followed by precipitation. RNA fragments were eluted from gel slices overnight at 4°C with gentle rocking in 400 μl RNA Elution Buffer (300 mM NaOAc pH 5.5, 1 mM EDTA, 100 U/mL RNasin (Promega; N2615)). Ligation of a pre-adenylated 3′ adaptor (IDT;/5Phos/TGGAATTCTCGGGTGCCAAGG/3ddC/) was carried out with T4 RNA ligase (NEB; M0204) in 1X buffer without ATP (50 mM Tris-HCl, pH 7.8, 10 mM MgCl2, 10 mM DTT) at 22°C for 2.5 hr, followed by precipitation.
Reverse transcription (RT) was carried out using AMV-RT (Promega; M5108) with the following conditions. The RT primer (IDT;/5Phos/GATCGTCGGACTGTAGAACTCTGAACCTGTCGGTGGTCGCCGTATCATT/iSp18/CACTCA/iSp18/GCCTTGGCACCCGAGAATTCCA) and RNA were denatured and annealed in RT buffer (50 mM Tris-Cl pH 8.6, 60 mM NaCl, 10 mM DTT). After annealing, dNTPs (3.3 mM each final) and MgCl2 (6mM final) were added, and RT was carried out at 42°C for 1 hr. Truncated cDNAs were size selected and purified on an 8% urea-TBE PAGE gel, followed by precipitation. cDNAs were eluted from gel slices overnight at room temperature with gentle rocking in 400 μl DNA Elution Buffer (300 mM NaCl, 10 mM Tris, pH 8.0).
cDNAs were circularized with circLigase (Epicentre; CL4115K), and amplified by PCR with Phusion (NEB; M0530) with the forward primer (IDT; AATGATACGGCGACCACCGA), and a barcoded reverse primer (IDT; CAAGCAGAAGACGGCATACGAGATXXXXXXGTGACTGGAGTTCCTTGGCACCCGAGAATTCCA). PCR products were gel purified, precipitated, and sequenced on an Illumina HiSeq 2000.
Sequencing Data Analysis
RNA-seq data was analyzed with in-house Bash and Python scripts unless otherwise specified. For yeast libraries, adapter sequences were trimmed using Cutadapt35, and were subsequently mapped to the S. cerevisiae genome downloaded from Saccharomyces Genome Database (SGD) on 9/2/2011. Mapping to the genome and defined splice junctions (UCSC, sacCer3) was performed using Tophat236. Multiply mapping reads were allowed. Using SAMtools to exclude multiply mapping reads affected Ψs called in repetitive or paralogous features, but not Ψs identified in other features37.
Trimmed reads from HeLa libraries were mapped with Bowtie1 allowing up to 2 mismatches to a database of spliced transcripts (hg19 sequence, and transcripts downloaded from UCSC on 1/8/2012) containing the transcript with the longest coding sequence, or the longest transcript for non-coding genes38. Multiply mapping reads were allowed for generation of ROC curves and MetaPsi plots, but were excluded for Ψ predictions.
Identification of Ψ
The yeast transcriptome (downloaded from SGD on 9/2/2011) with annotated 5′ and 3′UTRs was used to identify new sites of pseudouridylation39. Where annotated 5′ and 3′UTRs were not available, median UTR lengths were used. To identify new sites of pseudouridylation in HeLa cells the human transcriptome described above was used. For a given +/−CMC library pair, the −CMC libraries were first scaled to the size of the +CMC libraries. Peak values were calculated for each position 1 nt 3′ of a U (peak position) in all features with an average per nucleotide read coverage greater than a specified read cutoff:
Where r+ and r− indicate the number of reads whose 5′ ends map to the position being examined in the +CMC and –CMC libraries respectively, wr+ and wr− represent the numbers of reads whose 5′ ends map to a window centered at the position being examined (exclusive of reads at that position), and ws specifies the size of this window (exclusive of that position). Sites with peak positions greater than a specified peak cutoff were flagged as potential Ψ. To filter out false positives reproducibility of peak calling in a certain number of libraries was required.
Window size (ws) was set to 150 for all analyses. Only features surpassing an average reads/nt threshold (read cutoff) were considered. For high density yeast, the read cutoff was set to 0.0, the peak cutoff was set to 1.0, and reproducibility was required in 10 of 14 libraries. For log phase yeast, the peak values from log phase data were calculated for the high density identified Ψ. For both serum fed and serum starved HeLa cells, the read cutoff was set to 1.0, the peak cutoff was set to 2.0, and reproducibility was required in 4 of 4 libraries. A subset of called Ψ in HeLa cells came from very narrow (<20 nt) regions of uniquely mapping reads. These calls were considered unreliable and were removed.
MetaPsi Plots and ROC Curves
For a given Ψ, the reads at each position in a 51-nt window centered at the Ψ were normalized to the average reads per nucleotide within the window. These windows of normalized reads were then averaged for all known Ψ in yeast rRNA and U2 or human rRNA and snRNA, yielding a metaPsi. Given the close spacing of Ψ in these features, the number of Ψ at each position in the metaPsi window was also plotted.
To generate receiver operating characteristic (ROC) curves for a given +/−CMC library pair, the −CMC libraries were first scaled to the size of the +CMC libraries, and peak values were calculated (see above) for each position 1 nt 3′ of a U or Ψ in the features above. Additionally, a −CMC peak value was determined:
Parameters are as defined above. A range of 10,000 equally spaced cutoff scores were chosen spanning the range of observed peak values. At each cutoff score, the true positive and false positive rates were calculated, and plotted.
Estimation of False Discovery Rate
The lower bound for FDR was estimated from the observed FDR for the rRNA. The upper bound of FDR for lowly expressed genes was estimated by randomly down-sampling reads in the rRNA and U2 snRNA to a level of coverage comparable to that of lowly expressed mRNAs with Ψs. These randomizations were performed 14 times followed by Ψ calling on down-sampled libraries as described above. This number should be considered a rough estimate because the ribosomal RNA may not provide a perfect basis for estimating the FDR of Ψ calling in mRNA. The observed number of false positives in the rRNA and snRNA under the criteria used to call Ψs in mRNA was two incorrect Ψ calls in 1905 U residues (0.1%).
Defining Ψ Regulation and Factor-Dependence
To determine if a given Ψ was condition dependent the median peak values between two conditions were compared. For yeast only wild type peak values were included. A 2-fold or greater change between conditions was considered regulated.
Ψs were identified as Pus-dependent if the peak heights in both biological replicates of a given pusΔ strain were less than 25% of the median peak height for that Ψ across all libraries. For a given Ψ to be considered _PUS_-dependent, we required at least one replicate for a given pusΔ strain to have sufficient reads in the 150-nt window surrounding the Ψ to be greater than 25% of the median reads in that window for all libraries.
snoRNA Target Site Predictions and Analysis
To identify potential sites of pseudouridylation within yeast mRNAs, the yeast transcriptome (described above) was scanned for sites that perfectly match the known target sequences of all yeast Box H/ACA snoRNAs allowing mismatches at bases that are unpaired in known target sites40.
For the analysis presented in Extended Data Fig. 7a,b, 10,000 randomizations were performed. For each trial, a random U was chosen for each non-repetitive computationally predicted snoRNA target, and was matched to the same gene, and transcript feature (5′UTR, CDS, 3′UTR). Each randomized set of U’s was used to generate a metaPsi from the pooled reads of four libraries, and the differences in mean normalized reads between the +CMC and −CMC pools at the peak position were calculated. The distributions of these values were plotted in a histogram, and compared to the values for the computationally predicted snoRNA target sites.
Plotting and Other Analyses
Sequences and structures of tRNAs were obtained from tRNAdb, and Ψ locations were previously published41–43. Motifs were generated using WebLogo 3.3 using default settings, and the modified position was changed to a Ψ after logo generation41. UCSC genome browser was used to generate plots of rpm data, and matplotlib was used to generate the remainder of graphs44. RPKMs (reads per kilobase of exon sequence per million exon reads) were calculated from −CMC libraries. GO analysis was performed using the YeastMine feature of SGD (http://yeastmine.yeastgenome.org/). The set of genes whose coverage was sufficient to reproducibly call Ψ’s was used as a background set. These 5,278 genes had average RPKMs in post-diauxic wild type cultures of ≥9.25, the level of expression of the lowest expressed pseudouridylated mRNA called by our algorithm.
Extended Data
Extended Data Figure 1. Detection of specific snoRNA target sites by Pseudo-seq.
Pseudo-seq was performed on wild-type (n=4), snr37Δ (n=2), snr81Δ (n=2), snr43Δ (n=2), and snr49Δ (n=2) yeast strains. Cultures were harvested at high density (a,b) or log phase (c,d). Ψs dependent on the deleted snoRNA are indicated in red. CMC-dependent peaks of reads are indicated with dashed red lines. Traces are representative of indicated number of biological replicates. a) Pseudo-seq reads in RDN25-1 (chrXII:452221–452270) showing _SNR37_-dependence of 25S-Ψ2944. b) Pseudo-seq reads in RDN25-1 (chrXII:454111–454160, left), and U2 snRNA (LSR1, chrII:681791–681840, right) showing _SNR81_-dependence of 25S-Ψ1052 and U2-Ψ42. c) Pseudo-seq reads in RDN58-1 (chrXII:455466–455515) showing _SNR43_-dependence of 5.8S-Ψ73. _SNR43_-dependent 25S-Ψ960 was not consistently detected in wild type due to an overlapping CMC-independent RT stop. d) Pseudo-seq reads in RDN18-1 (chrXII:457361–457610) showing _SNR49-_dependence of 18S-Ψ302, 18S-Ψ211, and 18S-Ψ120. 25S-Ψ990 was also detected as _SNR49_-dependent (data not shown).
Extended Data Figure 2. Technical variations of Pseudo-seq give similar results.
a-d) MetaPsi plots (left), and ROC curves (right) for various library prep conditions n=1 for each condition. CMC-treated samples (solid), and mock-treated samples (dashed) are indicated. a) Comparison of AMV-RT (orange), and SuperScript® III (blue) (0.2M CMC; 115–130 nt, 100–115 nt fragments respectively). b) Comparison of 115–130 nt (orange), and 130–145 nt (blue) RNA fragment sizes (AMV-RT; 0.2M CMC). c) Comparison of 0.2M CMC (blue), and 0.4M CMC (orange) (AMV-RT; 115–130 nt RNA). d) Comparison of shorter (orange) and longer (blue) truncated RT fragment sizes (AMV-RT; 115–130 nt RNA; 0.2M CMC).
Extended Data Figure 3. Identification of pseudouridines in lowly expressed genes using multiple replicates.
a) Growth curves for wild-type yeast were grown in YPD. An OD600 of 12 is indicated by the horizontal dotted line. b,c) Pseudo-seq was performed on polyA+ RNA isolated from high density wild type yeast strains. CMC-dependent peaks of reads are indicated with dashed red lines. b) Pseudo-seq reads from n=4 biological replicates in a) CDC39 (chrIII:286226–286445, 12.3 avg rpkms), and c) IQG1 (chrXVI:90655–90955, 12.4 avg rpkms) showing CDC39-Ψ6223 and IQG1-Ψ4367, respectively.
Extended Data Figure 4. Codons affected by mRNA pseudouridylation.
Pseudouridylation of mRNA preferentially affects GUA codons. Numbers of pseudouridines observed at the first (dark blue), second (blue), and third positions (light blue) of each codon are indicated.
Extended Data Figure 5. Expression levels minimally affect identification of yeast mRNAs displaying regulated pseudouridylation.
A plot of log-transformed average rpkms in high density versus log phase yeast for all coding genes with a Ψ identified by Pseudo-seq n=4 biological replicates for each condition. All genes (gray), genes with a high density induced Ψ (blue), and genes with a log phase induced Ψ (red) are indicated.
Extended Data Figure 6. Inducible Pseudouridylation of ncRNAs.
a,b) Pseudo-seq was performed on wild-type (n=4), snr81Δ (n=2), pus1Δ (n=2), and pus7Δ (n=2) yeast strains grown to high density. CMC dependent peaks of reads are indicated with a dashed red line. Traces are representative indicated number of biological replicates. a) Pseudo-seq reads in U2 snRNA (LSR1; chrII:681751–681790, left; chrII:681769–681818, right) showing _SNR81_-dependence of U2-Ψ93, and _PUS1_-dependence of U2-Ψ56. Both are dependent on growth to high density. b) Pseudo-seq reads in U3a snoRNA (SNR17A, chrXV:780461–780560) showing snR17A-Ψ369 (_PUS7_-dependent), snR17A-Ψ380, snR17A-Ψ391, and snR17A-Ψ425 (_PUS1_-dependent). c) Summaries of the numbers of Ψs called in ncRNAs by Pseudo-seq. Indicated are constitutive Ψs (top), and inducible Ψs (bottom).
Extended Data Figure 7. Analysis of potential snoRNA targets.
a–d) Pseudo-seq was performed on wild-type yeast in log phase, or grown to high density. Reads from n=4 biological replicate libraries for each condition were pooled. b-d) Indicated are the predicted snoRNA target site (black, dashed), and the expected peak of CMC-dependent reads (black, dotted). a,b) Results of analysis on sets of random Us. a) A histogram of the differences (+CMC – −CMC) in mean normalized reads at the +1 peak position for 10,000 randomizations for high density (orange) and log phase (blue). The normalized read values for the computationally predicted Ψs in exponential and high density samples are indicated by arrows. b) An averaged metaPsi plot for all randomizations. c,d) +CMC (c), and −CMC (d) MetaPsi plots for computationally predicted Ψs separated by base pairing. Sites with 8 or more (red), 9 or more (blue), and 10 or more (orange) base pairs are indicated. Data for high density (left), and log phase (right) are indicated. e) Pseudo-seq reads for computationally predicted Ψs, CAT2 (chrXII:193995–19450, left), and AIM6 (chrIV:31135–31550 right). Traces are representative of at least six replicates.
Extended Data Figure 8. Mechanisms of Pus-dependent pseudouridylation.
a,b) Summaries of the _PUS_-dependence of called Ψs using higher stringency cutoffs (10/14 libraries) (a), and lower stringency cutoffs (9/14 libraries) (b). c,f) CMC dependent peaks of reads are indicated with dashed red lines. Traces are representative of n=4 (wild type), and n=2 (pusΔ) biological replicates. Pseudo-seq reads for RPL14A (a, chrXI:431901–432200) and PDI1 (d, chrIII:49401–48760) showing _PUS1_- and _PUS7_-dependency respectively. Both are dependent on growth to high density. d,e,g,h) WebLogo 3.3 was used to generate motifs for PUS1 (d), PUS2 (e), PUS7 (g), and PUS4 (h).
Extended Data Figure 9. Positive controls for human RNA Pseudo-seq.
a) Pseudo-seq reads for RDN28S5 (1516–1765) containing five known Ψs (28S-Ψ1536, 28S-Ψ1582, 28S-Ψ1677, 28S-Ψ1683, and 28S-Ψ1744). CMC-dependent peaks of reads are indicated with dashed red lines. Traces are representative of n=5 biological replicates. b) A metaPsi plot of mean normalized reads (left axis) for +CMC libraries (orange), and −CMC libraries (blue). The number of Ψs at each position in the metaPsi window is indicated (black, right axis). c) A ROC curve of the Pseudo-seq signal for all known Ψs in rRNA and snRNA.
Extended Data Figure 10. New pseudouridines in human RNAs.
a) A Venn diagram showing the overlap of mRNA pseudouridiylation events between plus serum and serum starved HeLa cells. b) A plot of log-transformed average rpkms in serum-starved versus serum-fed HeLa for all coding genes with a Ψ identified by Pseudo-seq. All genes (gray), genes with a Ψ induced in plus serum cells (blue), and genes with a Ψ induced in serum-starved cells (red) are indicated. c) Pseudo-seq reads for RDN18S5 (184–411) (top, left), RDN18S5 (1015–1210) (top, right), RDN28S5 (2713–3108) (bottom, left), and RDN28S5 (4461–4618) (bottom, right). CMC-dependent peaks of reads are indicated with dashed red lines, and highlighted Ψs are indicated by red boxes. Traces are representative of n=4 biological replicates.
Supplementary Material
1. Supplementary Table 1: Detection of known pseudouridines in yeast rRNA and snRNA by Pseudo-seq.
A table of known constitutive and inducible sites of Ψ within yeast rRNA and U2 snRNA. Gene expression values were calculated using −CMC libraries, and are the averages of the wild-type, high density replicates. The averages and standard deviations for wild-type, high density Pseudo-seq peak values are presented, as are peak values for individual libraries.
10. Supplementary Table 2: Detection of known yeast Ψs in tRNAs.
A table of pseudouridylated positions within tRNAs called by Pseudo-seq. tRNAs were depleted from Pseudo-seq libraries, and are not expected to be well captured. Gene expression values were calculated using −CMC libraries, and are the averages of the wild-type, high density replicates. Reads were mapped to unspliced tRNA transcripts. Positions called as modified within the unspliced transcripts (unspliced pos) were converted to canonical tRNA numbering (tRNA dB pos). Pus proteins known to catalyze each modification are listed (synthase).
2. Supplementary Table 3: Pseudouridylated sites in yeast mRNAs.
Tables of newly identified sites of pseudouridylation within yeast mRNAs. Gene expression values were calculated using −CMC libraries, and are the averages of the wild-type, high density replicates (avg sat rpkms), or the wild-type, log phase replicates (avg log rpkms). Ψs called in overlapping, paralogous, and repetitive features are indicated.
3. Supplementary Table 4: Pseudouridylated sites in yeast ncRNAs.
Tables of newly identified sites of pseudouridylation within yeast ncRNAs. Gene expression values were calculated using −CMC libraries, and are the averages of the wild-type, high density replicates (avg OD12 rpkms), or the wild-type, log phase replicates (avg log rpkms). Positions are relative to unspliced transcripts (rel pos).
4. Supplementary Table 5: Predicted targets of yeast H/ACA snoRNAs.
A table of predicted snoRNA target sites within yeast mRNAs that perfectly match the base pairing of canonical Box H/ACA snoRNA target sequences. The number of base pairs between guide and canonical target are indicated (canonical bp). Within the canonical snoRNA target sequence unpaired bases are indicated in lower case, and Ψs are indicated as Y. Predicted targets in overlapping, paralogous, and repetitive sequences are indicated.
5. Supplementary Table 6: Pus protein targets identified by Pseudo-seq.
Tables of Pus-dependent sites of pseudouridylation within yeast a) mRNAs, and b) ncRNAs. The averages and standard deviations for wild-type Pseudo-seq peak values are presented, as are peak values for individual libraries. b) Positions are relative to unspliced transcripts (rel pos).
6. Supplementary Table 7: Detection of known Ψs in HeLa rRNA, snRNA, and tRNA by Pseudo-seq.
A table of known sites of pseudouridylation within HeLa rRNA, snRNA, and tRNA. Gene expression values were calculated using −CMC libraries, and are the averages of the plus serum (avg rpkms +S) and serum-starved (avg rpkms −S) replicates. The averages and standard deviations for plus serum and serum starved Pseudo-seq peak values are presented, as are peak values for individual libraries. snoRNA database positions (snoRNAbase pos) were modified to match the positions of the Ensemble transcripts indicated.
7. Supplementary Table 8: Pseudouridylated sites in HeLa mRNAs.
Tables of newly identified sites of pseudouridylation within HeLa mRNAs. Gene expression values were calculated using −CMC libraries, and are the averages of the plus serum (avg rpkms +S) and serum-starved (avg rpkms −S) replicates.
8. Supplementary Table 9: Pseudouridylated sites in HeLa ncRNAs.
Tables of newly identified sites of pseudouridylation within HeLa ncRNAs. Gene expression values were calculated using −CMC libraries, and are the averages of the plus serum (avg rpkms +S) and serum-starved (avg rpkms −S) replicates.
9
Acknowledgments
We thank I. Cheeseman, C. Burge, U. RajBhandary, D. Bartel and members of the Gilbert Lab for comments and discussion. The sequencing was performed at the BioMicro Center under the direction of S. Levine. This work was supported by grants from The American Cancer Society – Robbie Sue Mudd Kidney Cancer Research Scholar Grant (RSG-13-396-01-RMC) and the National Institutes of Health (GM094303, GM081399) to W.V.G. T.M.C. and K.M.B. were supported by fellowships from The American Cancer Society. This work was supported in part by the NIH Pre-Doctoral Training Grant T32GM007287.
Footnotes
Author Contributions T.M.C. and W.V.G. conceived and designed the experiments. T.M.C., M.F.R-D., H.S., K.M.B. and W.V.G. performed the experiments. T.M.C., B.Z, and H.S. performed the bioinformatic analyses. T.M.C. and W.V.G. interpreted the results and wrote the paper with input from all authors.
Author Information Data have been deposited in NCBI’s Gene Expression Omnibus (GEO), accession number GSE58200. Reprints and permissions information is available at www.nature.com/reprints
The authors declare no competing financial interests.
References
- 1.Davis FF, Allen FW. Ribonucleic acids from yeast which contain a fifth nucleotide. J Biol Chem. 1957;227:907–915. [PubMed] [Google Scholar]
- 2.Arnez JG, Steitz TA. Crystal structure of unmodified tRNA(Gln) complexed with glutaminyl-tRNA synthetase and ATP suggests a possible role for pseudo-uridines in stabilization of RNA structure. Biochemistry. 1994;33:7560–7567. doi: 10.1021/bi00190a008. [DOI] [PubMed] [Google Scholar]
- 3.Charette M, Gray MW. Pseudouridine in RNA: what, where, how, and why. IUBMB Life. 2000;49:341–351. doi: 10.1080/152165400410182. [DOI] [PubMed] [Google Scholar]
- 4.Davis DR, Poulter CD. 1H-15N NMR studies of Escherichia coli tRNA(Phe) from hisT mutants: a structural role for pseudouridine. Biochemistry. 1991;30:4223–4231. doi: 10.1021/bi00231a017. [DOI] [PubMed] [Google Scholar]
- 5.Davis DR, Veltri CA, Nielsen L. An RNA model system for investigation of pseudouridine stabilization of the codon-anticodon interaction in tRNALys, tRNAHis and tRNATyr. J Biomol Struct Dyn. 1998;15:1121–1132. doi: 10.1080/07391102.1998.10509006. [DOI] [PubMed] [Google Scholar]
- 6.Hall KB, Mclaughlin LW. Properties of a U1/mRNA 5′ splice site duplex containing pseudouridine as measured by thermodynamic and NMR methods. Biochemistry. 1991;30:1795–1801. doi: 10.1021/bi00221a010. [DOI] [PubMed] [Google Scholar]
- 7.Hudson G, Bloomingdale R, Znosko B. Thermodynamic contribution and nearest-neighbor parameters of pseudouridine-adenosine base pairs in oligoribonucleotides. RNA. 2013;19:1474–1482. doi: 10.1261/rna.039610.113. [DOI] [PMC free article] [PubMed] [Google Scholar]
- 8.Yarian C, et al. Structural and functional roles of the N1- and N3-protons of psi at tRNA’s position 39. Nucleic Acids Res. 1999;27:3543–3549. doi: 10.1093/nar/27.17.3543. [DOI] [PMC free article] [PubMed] [Google Scholar]
- 9.Fernández IS, et al. Unusual base pairing during the decoding of a stop codon by the ribosome. Nature. 2013;500:107–110. doi: 10.1038/nature12302. [DOI] [PMC free article] [PubMed] [Google Scholar]
- 10.Karijolich J, Yu YT. Converting nonsense codons into sense codons by targeted pseudouridylation. Nature. 2011;474:395–398. doi: 10.1038/nature10165. [DOI] [PMC free article] [PubMed] [Google Scholar]
- 11.Bykhovskaya Y, Casas K, Mengesha E, Inbal A, Fischel-Ghodsian N. Missense mutation in pseudouridine synthase 1 (PUS1) causes mitochondrial myopathy and sideroblastic anemia (MLASA) Am J Hum Genet. 2004;74:1303–1308. doi: 10.1086/421530. [DOI] [PMC free article] [PubMed] [Google Scholar]
- 12.Heiss NS, et al. X-linked dyskeratosis congenita is caused by mutations in a highly conserved gene with putative nucleolar functions. Nature Genet. 1998;19:32–38. doi: 10.1038/ng0598-32. [DOI] [PubMed] [Google Scholar]
- 13.Mei YP, et al. Small nucleolar RNA 42 acts as an oncogene in lung tumorigenesis. Oncogene. 2012;31:2794–2804. doi: 10.1038/onc.2011.449. [DOI] [PMC free article] [PubMed] [Google Scholar]
- 14.Cantara WA, et al. The RNA Modification Database, RNAMDB: 2011 update. Nucleic Acids Res. 2011;39:D195–201. doi: 10.1093/nar/gkq1028. [DOI] [PMC free article] [PubMed] [Google Scholar]
- 15.Chen L. Characterization and comparison of human nuclear and cytosolic editomes. Proc Natl Acad Sci USA. 2013;110:E2741–7. doi: 10.1073/pnas.1218884110. [DOI] [PMC free article] [PubMed] [Google Scholar]
- 16.Dominissini D, et al. Topology of the human and mouse m6A RNA methylomes revealed by m6A-seq. Nature. 2012;485:201–206. doi: 10.1038/nature11112. [DOI] [PubMed] [Google Scholar]
- 17.Li JB, et al. Genome-wide identification of human RNA editing sites by parallel DNA capturing and sequencing. Science. 2009;324:1210–1213. doi: 10.1126/science.1170995. [DOI] [PubMed] [Google Scholar]
- 18.Meyer KD, et al. Comprehensive analysis of mRNA methylation reveals enrichment in 3′ UTRs and near stop codons. Cell. 2012;149:1635–1646. doi: 10.1016/j.cell.2012.05.003. [DOI] [PMC free article] [PubMed] [Google Scholar]
- 19.Squires JE, et al. Widespread occurrence of 5-methylcytosine in human coding and non-coding RNA. Nucleic Acids Res. 2012;40:5023–5033. doi: 10.1093/nar/gks144. [DOI] [PMC free article] [PubMed] [Google Scholar]
- 20.Bakin A, Ofengand J. Four newly located pseudouridylate residues in Escherichia coli 23S ribosomal RNA are all at the peptidyltransferase center: analysis by the application of a new sequencing technique. Biochemistry. 1993;32:9754–9762. doi: 10.1021/bi00088a030. [DOI] [PubMed] [Google Scholar]
- 21.Wu G, Xiao M, Yang C, Yu YT. U2 snRNA is inducibly pseudouridylated at novel sites by Pus7p and snR81 RNP. EMBO J. 2011;30:79–89. doi: 10.1038/emboj.2010.316. [DOI] [PMC free article] [PubMed] [Google Scholar]
- 22.Ansmant I, Massenet S, Grosjean H, Motorin Y, Branlant C. Identification of the Saccharomyces cerevisiae RNA:pseudouridine synthase responsible for formation of psi(2819) in 21S mitochondrial ribosomal RNA. Nucleic acids research. 2000;28:1941–1946. doi: 10.1093/nar/28.9.1941. [DOI] [PMC free article] [PubMed] [Google Scholar]
- 23.Arluison V, Buckle M, Grosjean H. Pseudouridine synthetase Pus1 of Saccharomyces cerevisiae: kinetic characterisation, tRNA structural requirement and real-time analysis of its complex with tRNA. J Mol Biol. 1999;289:491–502. doi: 10.1006/jmbi.1999.2789. [DOI] [PubMed] [Google Scholar]
- 24.Becker HF, Motorin Y, Sissler M, Florentz C, Grosjean H. Major identity determinants for enzymatic formation of ribothymidine and pseudouridine in the T psi-loop of yeast tRNAs. Journal of molecular biology. 1997;274:505–518. doi: 10.1006/jmbi.1997.1417. [DOI] [PubMed] [Google Scholar]
- 25.Behm-Ansmant I, et al. The Saccharomyces cerevisiae U2 snRNA:pseudouridine-synthase Pus7p is a novel multisite-multisubstrate RNA:Psi-synthase also acting on tRNAs. RNA. 2003;9:1371–1382. doi: 10.1261/rna.5520403. [DOI] [PMC free article] [PubMed] [Google Scholar]
- 26.Kudla G, Murray AW, Tollervey D, Plotkin JB. Coding-sequence determinants of gene expression in Escherichia coli. Science. 2009;324:255–258. doi: 10.1126/science.1170160. [DOI] [PMC free article] [PubMed] [Google Scholar]
- 27.Shah P, Ding Y, Niemczyk M, Kudla G, Plotkin JB. Rate-limiting steps in yeast protein translation. Cell. 2013;153:1589–1601. doi: 10.1016/j.cell.2013.05.049. [DOI] [PMC free article] [PubMed] [Google Scholar]
- 28.Somogyi P, Jenner AJ, Brierley I, Inglis SC. Ribosomal pausing during translation of an RNA pseudoknot. Mol Cell Biol. 1993;13:6931–6940. doi: 10.1128/mcb.13.11.6931. [DOI] [PMC free article] [PubMed] [Google Scholar]
- 29.Jambhekar A, Derisi JL. Cis-acting determinants of asymmetric, cytoplasmic RNA transport. RNA. 2007;13:625–642. doi: 10.1261/rna.262607. [DOI] [PMC free article] [PubMed] [Google Scholar]
- 30.Tan X, et al. Tiling genomes of pathogenic viruses identifies potent antiviral shRNAs and reveals a role for secondary structure in shRNA efficacy. Proc Natl Acad Sci USA. 2012;109:869–874. doi: 10.1073/pnas.1119873109. [DOI] [PMC free article] [PubMed] [Google Scholar]
- 31.Longtine MS, et al. Additional modules for versatile and economical PCR-based gene deletion and modification in Saccharomyces cerevisiae. Yeast (Chichester, England) 1998;14:953–961. doi: 10.1002/(SICI)1097-0061(199807)14:10<953::AID-YEA293>3.0.CO;2-U. [DOI] [PubMed] [Google Scholar]
- 32.Winzeler EA, et al. Functional characterization of the S. cerevisiae genome by gene deletion and parallel analysis. Science. 1999;285:901–906. doi: 10.1126/science.285.5429.901. [DOI] [PubMed] [Google Scholar]
- 33.Collart MA, Oliviero S. Ausubel Frederick M, et al., editors. Preparation of yeast RNA. Curr Prot Mol Biol. 2001;Chapter 13(Unit 13.12) doi: 10.1002/0471142727.mb1312s23. [DOI] [PubMed] [Google Scholar]
- 34.Sambrook J, Russell DW. Molecular Cloning. CSHL Press; 2001. [Google Scholar]
- 35.Martin M. Cutadapt removes adapter sequences from high-throughput sequencing reads. EMBnetjournal. 2011;17:10–12. [Google Scholar]
- 36.Kim D, et al. TopHat2: accurate alignment of transcriptomes in the presence of insertions, deletions and gene fusions. Genome Biol. 2013;14 doi: 10.1186/gb-2013-14-4-r36. [DOI] [PMC free article] [PubMed] [Google Scholar]
- 37.Li H, et al. The Sequence Alignment/Map format and SAMtools. Bioinformatics. 2009;25:2078–2079. doi: 10.1093/bioinformatics/btp352. [DOI] [PMC free article] [PubMed] [Google Scholar]
- 38.Langmead B, Trapnell C, Pop M, Salzberg SL. Ultrafast and memory-efficient alignment of short DNA sequences to the human genome. Genome Biol. 2009;10:R25. doi: 10.1186/gb-2009-10-3-r25. [DOI] [PMC free article] [PubMed] [Google Scholar]
- 39.Xu Z, et al. Bidirectional promoters generate pervasive transcription in yeast. Nature. 2009;457:1033–1037. doi: 10.1038/nature07728. [DOI] [PMC free article] [PubMed] [Google Scholar]
- 40.Piekna-Przybylska D, Decatur WA, Fournier MJ. New bioinformatic tools for analysis of nucleotide modifications in eukaryotic rRNA. RNA. 2007;13:305–312. doi: 10.1261/rna.373107. [DOI] [PMC free article] [PubMed] [Google Scholar]
- 41.Crooks GE, Hon G, Chandonia JM, Brenner SE. WebLogo: a sequence logo generator. Genome Res. 2004;14:1188–1190. doi: 10.1101/gr.849004. [DOI] [PMC free article] [PubMed] [Google Scholar]
- 42.Darty K, Denise A, Ponty Y. VARNA: Interactive drawing and editing of the RNA secondary structure. Bioinformatics. 2009;25:1974–1975. doi: 10.1093/bioinformatics/btp250. [DOI] [PMC free article] [PubMed] [Google Scholar]
- 43.Jühling F, et al. tRNAdb 2009: compilation of tRNA sequences and tRNA genes. Nucleic Acids Res. 2009;37:D159–62. doi: 10.1093/nar/gkn772. [DOI] [PMC free article] [PubMed] [Google Scholar]
- 44.Hunter JD. Matplotlib: A 2D Graphics Environment. Comput Sci Eng. 2007;9:90–95. [Google Scholar]
Associated Data
This section collects any data citations, data availability statements, or supplementary materials included in this article.
Supplementary Materials
1. Supplementary Table 1: Detection of known pseudouridines in yeast rRNA and snRNA by Pseudo-seq.
A table of known constitutive and inducible sites of Ψ within yeast rRNA and U2 snRNA. Gene expression values were calculated using −CMC libraries, and are the averages of the wild-type, high density replicates. The averages and standard deviations for wild-type, high density Pseudo-seq peak values are presented, as are peak values for individual libraries.
10. Supplementary Table 2: Detection of known yeast Ψs in tRNAs.
A table of pseudouridylated positions within tRNAs called by Pseudo-seq. tRNAs were depleted from Pseudo-seq libraries, and are not expected to be well captured. Gene expression values were calculated using −CMC libraries, and are the averages of the wild-type, high density replicates. Reads were mapped to unspliced tRNA transcripts. Positions called as modified within the unspliced transcripts (unspliced pos) were converted to canonical tRNA numbering (tRNA dB pos). Pus proteins known to catalyze each modification are listed (synthase).
2. Supplementary Table 3: Pseudouridylated sites in yeast mRNAs.
Tables of newly identified sites of pseudouridylation within yeast mRNAs. Gene expression values were calculated using −CMC libraries, and are the averages of the wild-type, high density replicates (avg sat rpkms), or the wild-type, log phase replicates (avg log rpkms). Ψs called in overlapping, paralogous, and repetitive features are indicated.
3. Supplementary Table 4: Pseudouridylated sites in yeast ncRNAs.
Tables of newly identified sites of pseudouridylation within yeast ncRNAs. Gene expression values were calculated using −CMC libraries, and are the averages of the wild-type, high density replicates (avg OD12 rpkms), or the wild-type, log phase replicates (avg log rpkms). Positions are relative to unspliced transcripts (rel pos).
4. Supplementary Table 5: Predicted targets of yeast H/ACA snoRNAs.
A table of predicted snoRNA target sites within yeast mRNAs that perfectly match the base pairing of canonical Box H/ACA snoRNA target sequences. The number of base pairs between guide and canonical target are indicated (canonical bp). Within the canonical snoRNA target sequence unpaired bases are indicated in lower case, and Ψs are indicated as Y. Predicted targets in overlapping, paralogous, and repetitive sequences are indicated.
5. Supplementary Table 6: Pus protein targets identified by Pseudo-seq.
Tables of Pus-dependent sites of pseudouridylation within yeast a) mRNAs, and b) ncRNAs. The averages and standard deviations for wild-type Pseudo-seq peak values are presented, as are peak values for individual libraries. b) Positions are relative to unspliced transcripts (rel pos).
6. Supplementary Table 7: Detection of known Ψs in HeLa rRNA, snRNA, and tRNA by Pseudo-seq.
A table of known sites of pseudouridylation within HeLa rRNA, snRNA, and tRNA. Gene expression values were calculated using −CMC libraries, and are the averages of the plus serum (avg rpkms +S) and serum-starved (avg rpkms −S) replicates. The averages and standard deviations for plus serum and serum starved Pseudo-seq peak values are presented, as are peak values for individual libraries. snoRNA database positions (snoRNAbase pos) were modified to match the positions of the Ensemble transcripts indicated.
7. Supplementary Table 8: Pseudouridylated sites in HeLa mRNAs.
Tables of newly identified sites of pseudouridylation within HeLa mRNAs. Gene expression values were calculated using −CMC libraries, and are the averages of the plus serum (avg rpkms +S) and serum-starved (avg rpkms −S) replicates.
8. Supplementary Table 9: Pseudouridylated sites in HeLa ncRNAs.
Tables of newly identified sites of pseudouridylation within HeLa ncRNAs. Gene expression values were calculated using −CMC libraries, and are the averages of the plus serum (avg rpkms +S) and serum-starved (avg rpkms −S) replicates.
9
