The Genetic Basis of Mendelian Phenotypes: Discoveries, Challenges, and Opportunities (original) (raw)
Abstract
Discovering the genetic basis of a Mendelian phenotype establishes a causal link between genotype and phenotype, making possible carrier and population screening and direct diagnosis. Such discoveries also contribute to our knowledge of gene function, gene regulation, development, and biological mechanisms that can be used for developing new therapeutics. As of February 2015, 2,937 genes underlying 4,163 Mendelian phenotypes have been discovered, but the genes underlying ∼50% (i.e., 3,152) of all known Mendelian phenotypes are still unknown, and many more Mendelian conditions have yet to be recognized. This is a formidable gap in biomedical knowledge. Accordingly, in December 2011, the NIH established the Centers for Mendelian Genomics (CMGs) to provide the collaborative framework and infrastructure necessary for undertaking large-scale whole-exome sequencing and discovery of the genetic variants responsible for Mendelian phenotypes. In partnership with 529 investigators from 261 institutions in 36 countries, the CMGs assessed 18,863 samples from 8,838 families representing 579 known and 470 novel Mendelian phenotypes as of January 2015. This collaborative effort has identified 956 genes, including 375 not previously associated with human health, that underlie a Mendelian phenotype. These results provide insight into study design and analytical strategies, identify novel mechanisms of disease, and reveal the extensive clinical variability of Mendelian phenotypes. Discovering the gene underlying every Mendelian phenotype will require tackling challenges such as worldwide ascertainment and phenotypic characterization of families affected by Mendelian conditions, improvement in sequencing and analytical techniques, and pervasive sharing of phenotypic and genomic data among researchers, clinicians, and families.
Main Text
Introduction
Improved understanding of human disease was a primary goal of the Human Genome Project (HGP).1 This promise has, in part, been realized with the identification of the consequence of germline mutation (single-nucleotide variants [SNVs] and copy-number variants [CNVs]) for more than 2,900 protein-coding genes in humans.2–4 These disease-associated mutations directly link DNA variants to altered protein function or dosage and to human phenotypes, thus transforming our understanding of the basic biology of development and physiological homeostasis in health and disease. Indeed, much of what is known about the relationship between gene function and human phenotypes is based on the study of rare variants underlying Mendelian phenotypes. Furthermore, these discoveries have identified new preventative, diagnostic, and therapeutic strategies for a growing number of rare and common diseases.5–8
Much remains to be learned. The HGP and subsequent annotation efforts have established that there are ∼19,000 predicted protein-coding genes in humans.9,10 Nearly all are conserved across the vertebrate lineage and are highly conserved since the origin of mammals ∼150–200 million years ago,11–13 suggesting that certain mutations in every non-redundant gene will have phenotypic consequences, either constitutively or in response to specific environmental challenges. The continuing pace of discovery of new Mendelian phenotypes and the variants and genes underlying them supports this contention.
Whereas protein-coding regions compose only about 1% of the human genome, the overwhelming majority of Mendelian phenotypes identified thus far result from altered function, localization, or presence of the encoded proteins. Furthermore, few Mendelian phenotypes appear to be caused exclusively by mutations outside coding regions.14 This is not only a matter of ascertainment bias, given that loci that are well mapped by unbiased analysis of linkage data prior to the discovery of underlying causes have yielded extremely high ratios in favor of variants that alter protein function.15 However, progress in the elucidation of promoters and tissue-specific regulatory elements by projects such as ENCODE16 and in linking perturbations in these elements to alterations of gene expression holds promise for the identification of new Mendelian phenotypes caused by non-coding mutations.17 Mendelian phenotypes for which mutations have not been discovered in coding regions or canonical splice sites are ideal candidates for such studies.
Our increasingly sophisticated ability to phenotype humans, coupled with differences in physiology between humans and model organisms, argues that primary mutation discovery in humans will remain crucial to progress.18 Moreover, now that a finite set of protein-coding genes has been defined, determining the phenotypic consequences of their variation represents a vital and attainable goal partly because of the advances in the production and analysis of whole-exome sequencing (WES) and whole-genome sequencing (WGS) data.19–24 Each successful discovery will define potential diagnostic, preventive, and therapeutic opportunities for the corresponding diseases and illuminate normal biology and disease mechanisms.25,26
The Burden of Mendelian Disease
In aggregate, clinically recognized Mendelian phenotypes compose a substantial fraction (∼0.4% of live births) of known human diseases, and if all congenital anomalies are included, ∼8% of live births have a genetic disorder recognizable by early adulthood.27 This translates to approximately eight million children born worldwide each year with a “serious” genetic condition, defined as a condition that is life threatening or has the potential to result in disability.28 In the US alone, Mendelian disorders collectively affect more than 25 million people and are associated with high morbidity, mortality, and economic burden in both pediatric and adult populations.28,29 Birth defects, of which Mendelian phenotypes compose an unknown but most likely substantial proportion, are the most common cause of death in the first year of life, and each year, more than three million children under the age of 5 years die from a birth defect, and a similar number survive with substantial morbidity. Beyond the emotional burden, each child with a genetic disorder has been estimated to cost the healthcare system a total of $5,000,000 during their lifetime.28,29
It remains a challenge to diagnose many Mendelian phenotypes by phenotypic features and conventional diagnostic testing. In a general clinical genetics setting, the diagnostic rate is ∼50%.30 Across a broader range of rare diseases, diagnostic rates are even lower. For example, in the NIH Undiagnosed Disease Program, the diagnostic rate was, despite state-of-the-art evaluations, 34% in adults and 11% in children.31 Moreover, the time to diagnosis is often prolonged (the “diagnostic odyssey”); in a European survey of the time to diagnosis of eight rare diseases, including cystic fibrosis (MIM: 602421) and fragile X syndrome (MIM: 309550), 25% of families waited between 5 and 30 years for a diagnosis, and the initial diagnosis was incorrect in 40% of these families.32
Molecular diagnostic rates for many Mendelian phenotypes are similarly low. For example, of 292 well-characterized categories of Mendelian phenotypes for which clinical testing is available (GeneReviews, July 2014; Table S1), a causal variant can be identified in only 52% of cases overall (Figure 1A). Diagnostic rates vary widely by phenotype and are inversely correlated with the level of genetic heterogeneity (Spearman correlation ρ = −0.155, p value = 0.008019; Figure 1B; Table S2). These observations are consistent with diagnostic rates of 25%–75% for many major categories of inherited conditions (e.g., kidney disease,33 cardiomyopathy,34 epilepsy,35 etc.) The increasing availability of clinical WES testing holds promise for improving diagnostic yield, and although the diagnostic rate reported with this technology is currently only ∼25%–30%, it represents a substantially higher rate than the diagnostic yield of other genomic assays, such as karyotyping (<5%) and array comparative genomic hybridization (∼15%–20%).36,37 Importantly, studies of the diagnostic efficacy of clinical WES show that a substantial fraction (25%–30%) of the diagnostic successes depends on recent progress in the discovery of genes underlying disease.36,38 This observation highlights the value of continued research into the genetic basis of Mendelian phenotypes. Moreover, it predicts that diagnostic rates will continue to increase as we work toward a more complete catalog of the genes and variants responsible for human disease.
Figure 1.

Clinical Diagnostic Rates of Mendelian Conditions for which Gene(s) Have Been Identified
All Mendelian conditions, or phenotypic series, included are listed in GeneReviews and might be genetically heterogeneous (i.e., caused by mutations in one or more genes).
(A) Histogram of the percentage of individuals who had a Mendelian condition (x axis) and who received a corresponding molecular diagnosis from clinical testing. Collectively, for 292 Mendelian conditions, a causal variant could be identified in only ∼52% of affected subjects overall.
(B) Boxplots show the molecular diagnostic rate (y axis) for Mendelian conditions organized by the number of causal genes (x axis). The diagnostic rate per condition is inversely correlated with the level of genetic heterogeneity (Spearman correlation ρ = −0.155, p value = 0.008019).
The Scope of Mendelian-Disease-Related Phenotypes
Our knowledge of the diversity of Mendelian phenotypes is increasingly sophisticated, but substantial gaps remain.39 Specifically, it is challenging to establish the number of Mendelian phenotypes that exist, to delineate new Mendelian phenotypes, to distinguish novel from known Mendelian phenotypes, to define what constitutes expansion of a known phenotype, and to develop metrics for assessing the relationships and diversity of phenotypes caused by variants in the same gene. These gaps are due, in part, to the diversity of “normal” human morphology and physiology, the challenge of defining normal versus abnormal, and the difficulty of setting limits for traits with quantitative distributions.40,41 Moreover, biological variation is, in large part, not binary but rather described by partially overlapping distributions.42–45 With these caveats in mind, we analyzed OMIM entries (February 2015) to identify 7,440 rare Mendelian phenotypes (7,315 monogenic; 125 chromosomal duplications and/or deletions). This number is not static; ∼300 new Mendelian phenotypes are added to OMIM each year, and this probably underestimates the number of phenotypes newly recognized each year. Delineation of new Mendelian phenotypes in populations worldwide is limited by a lack of infrastructure, resources, and expertise46,47 Moreover, studies of model organisms show that the number and types of recognized phenotypes increase with expanding environmental challenges.48 Therefore, to completely enumerate “all” human Mendelian phenotypes, it will be necessary to consider a more comprehensive span of environmental conditions and develop more-sophisticated tools to evaluate phenotype.49
Studies in mice with engineered loss-of-function (LOF) mutations suggest that the majority of the gene knockouts compatible with survival to birth are associated with a recognizable phenotype, whereas ∼30% of gene knockouts lead to in utero or perinatal lethality.50 Of the latter, it remains to be determined whether partial LOF mutations (i.e., hypomorphic alleles) or other classes of mutations (e.g., gain of function, dosage differences due to gene amplification,51 etc.) in the same genes might result in viable phenotypes. Nevertheless, given the high degree of evolutionary conservation between humans and mice, mutations in the majority of non-redundant human protein-coding genes are likely to result in Mendelian phenotypes, most of which remain to be characterized (Figure 2).
Figure 2.
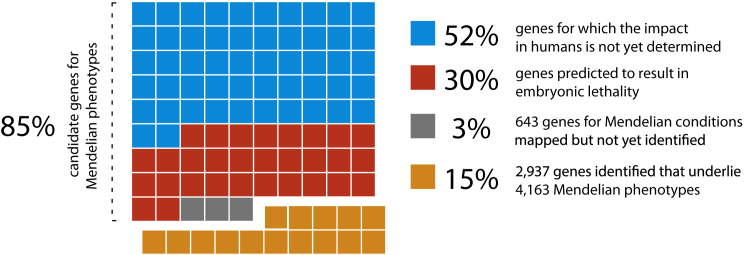
Relationship between Human Protein-Coding Genes and Mendelian Phenotypes
Of approximately ∼19,000 protein-coding genes predicted to exist in the human genome, variants that cause Mendelian phenotypes have been identified in ∼2,937 (∼15.5%; orange squares). Genes underlying ∼643 Mendelian phenotypes (∼3.38%; gray squares) have been mapped but not yet identified. On the basis of analysis of knockout mouse models, LOF variants in up to ∼30% of genes (∼5,960; red squares) could result in embryonic lethality in humans. Note that the consequences of missense variants in these genes could be different. For a minimum of ∼52% of genes (∼10,330; blue squares), the impact in humans has not yet been determined. Collectively, ∼16,063 genes remain candidates for Mendelian phenotypes.
Relationship between Mendelian Disease Traits and Common Disease
The etiologies of common diseases, such as hypertension, coronary artery disease, diabetes, obesity, scoliosis, and autism, are heterogeneous and typically include a small subset of individuals with a monogenic condition underlying their diagnosis with a common disease.52–55 The variants responsible for this small fraction of affected individuals rarely explain much of the genetic contribution to these common diseases,56,57 but they are nevertheless often highly relevant to our understanding of more-general mechanisms of these conditions.53 A classic example in cardiovascular disease research is the identification of the genetic basis of rare, monogenic forms of hypercholesterolemia, which provided critical insights into the relevance of lipid transport.58 In turn, these findings have led to the development of new therapies for common, complex cardiovascular diseases by targeting the implicated genes and pathways.53 Collectively, nearly 20% of genes implicated in Mendelian phenotypes also either contain or are nearest to a variant responsible for a genome-wide association study (GWAS) signal that achieves genome-wide significance for a complex trait (Figure 3A; Supplemental Material and Methods; Figure S1). In contrast, ∼15% of all genes overall underlie a Mendelian phenotype, suggesting that genes implicated in Mendelian phenotypes are enriched in GWAS signals. The fraction of genes that are found near GWAS signals and in which variants are responsible for Mendelian phenotypes is also positively correlated with the strength of association (Figure 3B). Widespread co-morbidity among Mendelian phenotypes and complex diseases provides further evidence that variation in genes that underlie Mendelian phenotypes plays a role in complex disease.59
Figure 3.

Relationship between GWAS Signals and Genes Underlying Mendelian Phenotypes
(A) Plot of the fraction of GWAS-signal genes that are also implicated in Mendelian phenotypes (MPs). Each orange dot represents the proportion of GWAS signals that, in a sliding window of 500 GWAS signals, are mapped to a gene also known to underlie a Mendelian condition. In GWAS signals, approximately 26.6% of genes with the top 500 lowest p values underlie a Mendelian phenotype. In contrast, only 14.2% of genes overall are known to underlie a Mendelian phenotype, suggesting that GWAS signals are more likely to be enriched with genes implicated in Mendelian phenotypes. Varied colored dots represent the percentage of genes underlying a Mendelian phenotype in GWAS signals underlying different phenotypic categories as follows (of increasing percentages from bottom to top): 10% for reproductive traits (blue); 11% for respiratory traits (gold); 13% for autoimmune inflammatory traits (dark green); 16% for immunologic traits (blue); 17% for mental-health traits (teal); 19% for infectious-disease traits (gray); 21% for anthropometric traits (brown); 23% for cancer (red); 25% for cardiovascular traits (tan); 26% for metabolomics traits (yellow); 28% for pharmacogenetic traits (green); and 33% for musculoskeletal traits (blue).
(B) Cumulative plot of the proportion of GWAS signals in which a gene underlying a Mendelian phenotype (MP) was found (orange dots) and GWAS signals in which a gene underlying a Mendelian phenotype was not found (gray dots). At virtually every p value, a higher proportion of GWAS signals overlapped genes underlying Mendelian phenotypes.
Development of new therapeutics to address common diseases that constitute major public-health problems is limited by the ignorance regarding the fundamental biology underlying disease pathogenesis.60 As a consequence, 90% of drugs entering human clinical trials fail, commonly because of a lack of efficacy and/or unanticipated mechanism-based adverse effects.61 Studies of families affected by rare Mendelian phenotypes segregating with large-effect mutations that increase or decrease risk for common disease can directly establish the causal relationship between genes and pathways and common diseases and identify targets likely to have large beneficial effects and fewer mechanism-based adverse effects when manipulated. For example, certain Mendelian forms of high and low blood pressure are due to mutations that cause increases and decreases, respectively, in renal salt reabsorption and net salt balance; these discoveries identified promising new therapeutic targets, such as KCNJ1 (potassium channel, inwardly rectifying, subfamily J, member 1 [MIM: 600359]), for which drugs are now in clinical trials. Understanding the role of salt balance in blood pressure has provided the scientific basis for public-health efforts in more than 30 countries to reduce heart attacks, strokes, and mortality by modest reduction in dietary salt intake.62 Similarly, understanding the physiological effects of CFTR (cystic fibrosis transmembrane conductance regulator [MIM: 602421]) mutations responsible for cystic fibrosis has led to allele-specific therapies that significantly improve pulmonary function in affected individuals.63 Other common-disease drugs based on gene discoveries for Mendelian phenotypes (e.g., orexin antagonists for sleep,64 beta-site APP-cleaving enzyme 1 [BACE1] inhibitors for Alzheimer dementia,65 proprotein convertase, subtilisin/kexin type 9 [PCSK9] monoclonal antibodies to lower low-density lipoprotein levels66) are undergoing advanced clinical trials. Discoveries such as these will directly facilitate the goals of the Precision Medicine Initiative.67
Use of other approaches, such as identification of common variants of small effect, might be less effective at facilitating drug development. For example, of 348 proteins specifically targeted by current therapeutics, 42.5% are encoded by a gene responsible for a Mendelian phenotype, whereas only 28.2% of proteins targeted by current therapeutics are encoded by a gene found within GWAS signals (the closest downstream and upstream genes were counted per intergenic signal, and all overlapping genes were counted per coding signal). Accounting for the over-representation of genes underlying Mendelian phenotypes in GWAS signals, 27.3% of proteins targeted are only encoded by a gene underlying a Mendelian phenotype, whereas 13.6% of proteins targeted are found only in a GWAS signal. Moreover, compared to therapeutics that are still in clinical trials, currently approved therapeutics are enriched with drugs that target a protein encoded by a gene in which mutations are responsible for a Mendelian phenotype (32.8% versus 42.5%), suggesting that drugs associated with a gene underlying a Mendelian phenotype more often receive FDA approval. No such relationship is observed for genes found within GWAS signals (28.2% are FDA approved, whereas 29.4% are in clinical trials). Accordingly, using information about whether a target protein is encoded by a gene underlying a Mendelian phenotype might help to stratify drug candidates for development.
Gene-Discovery Efforts for Mendelian Phenotypes to Date
The first successful efforts to identify genes underlying Mendelian phenotypes often required extensive prior knowledge of disease biology, including the identity of the affected protein. In 1986, discovery of mutations causing chronic granulomatous disease in CYBB (MIM: 300481) demonstrated that mapping followed by sequencing of genes within the maximum-likelihood interval offered a promising alternative for discovering genes underlying disease, and during the next 10 years, 42 genes associated with Mendelian phenotypes were identified via positional cloning.68 The ensuing two decades witnessed a steady accumulation of genes discovered to underlie Mendelian phenotypes by a combination of positional cloning and candidate-gene approaches. However, it became increasingly obvious that gene identification for most Mendelian phenotypes without a known cause was difficult via these approaches. Gene-discovery strategies based on WES and WGS introduced powerful alternatives that were agnostic to both known biology and mapping data.19,22,23,69–72 Combined with conventional genetic approaches, WES and WGS have proved to be disruptive technologies that have rapidly accelerated the pace of discovery of genes underlying Mendelian phenotypes, such that the pace of gene discovery has increased from an average of ∼166 per year between 2005 and 2009 to 236 per year between 2010 and 2014. Between January of 2010 and February 2015, ∼555 and ∼613 genes associated with monogenic Mendelian phenotypes were discovered via next-generation sequencing approaches and conventional approaches, respectively. However, over this time period, there has been a rapid shift toward increasing the use of WES and WGS, and since 2013, WES and WGS have made almost three times as many discoveries as conventional methods (Figure 4; Supplemental Material and Methods; Figure S2).
Figure 4.

Approximate Number of Gene Discoveries Made by WES and WGS versus Conventional Approaches since 2010
Since the introduction of WES and WGS in 2010, the pace of discovery of genes implicated in Mendelian phenotypes per year has increased substantially, and the proportion of discoveries made by WES or WGS (blue) versus conventional approaches (red) has steadily increased (see Supplemental Material and Methods for a detailed description of the analysis). Since 2013, WES and WGS have discovered nearly three times as many genes as conventional approaches.
Although substantial progress has been made toward identifying the genetic basis of Mendelian phenotypes, the genes underlying about half of all known Mendelian phenotypes (i.e., 3,152) have not yet been discovered, despite the fact that ∼20% (i.e., 643) have been mapped (∼80% with robust linkage data [e.g., significant linkage to a single region or recurrent structural variants (SVs) involving the same region] according to a manual review) as per data from OMIM (February 2015). Most of these “unsolved” Mendelian phenotypes are rare and often have high locus heterogeneity and/or are intractable to mapping-based approaches because they are caused by de novo mutations in the germline or mosaicism in somatic tissues.73–75 Sequencing technologies and analytical approaches have now sufficiently matured to make gene discovery at scale for all Mendelian phenotypes feasible and cost effective. To this end, national and international efforts led by the human genetics community have emerged to identify the genetic basis of Mendelian phenotypes at scale even as the number of recognized phenotypes continues to increase each year.76–78
The Centers for Mendelian Genomics
Widespread, convenient, and cost-effective application of WES and WGS for finding genes underlying Mendelian phenotypes posed a number of challenges when the strategy was first introduced.79 Moreover, achieving the goal of finding all genes underlying all Mendelian phenotypes requires searching the entire human population and therefore necessitates a worldwide collaboration among clinicians and scientists to identify and characterize both novel and well-known Mendelian phenotypes. Accordingly, multiple national efforts were initiated to establish the collaborative framework and physical infrastructure necessary for undertaking large-scale identification of affected individuals, genomic sequencing, and gene discovery for Mendelian phenotypes; these included the NHGRI- and NHLBI-supported Centers for Mendelian Genomics (CMGs),77 Finding of Rare Disease Genes (FORGE) Canada,76 and the Wellcome Trust Deciphering Developmental Disabilities (WTDDD),78 each of which was established in 2011. The CMGs consist of three centers: (1) the University of Washington Center for Mendelian Genomics, (2) the Baylor-Hopkins Center for Mendelian Genomics, and (3) the Yale Center for Mendelian Genomics. All of these consortia, as well as a myriad of individual investigators and small research groups, have made major contributions to gene discovery for Mendelian phenotypes over the past 4 years.
The CMGs were expected to make substantial progress toward discovering the genomic basis of most, if not all, known Mendelian phenotypes. Specifically, the CMGs had the following goals: (1) assess the genetic basis of ∼1,000 Mendelian phenotypes in collaboration with investigators worldwide; (2) develop new methods and approaches for discovering the genetic basis of Mendelian phenotypes; (3) generate public resources that can be leveraged by the biomedical community to facilitate investigator-initiated gene-discovery efforts, studies of gene function, and clinical translation and interpretation of human genome variation; and (4) lead and coordinate US efforts with other large-scale projects aimed at discovering genes implicated in Mendelian phenotypes. Key to accomplishing these goals was that collaborating clinicians and investigators were able to access WES, WGS, and technical expertise from the CMGs at no cost and preserve their control over data sharing, analysis, and rights to publish. It was also anticipated that the overall genetic architecture of Mendelian phenotypes would be further elucidated and that novel underlying genetic mechanisms might be revealed.
CMG Discoveries
As of January 2015, 18,863 samples representing 579 known and 470 novel Mendelian phenotypes from 8,838 families (see the CMG investigated phenotypes in the Web Resources) have been assessed by the CMGs in partnership with 529 investigators from 261 institutions in 36 countries (i.e., ∼1 of every 5 countries in the world) (Figure 5). 60% of countries, 32% of institutions, and 20% of investigators are located outside of North America, Europe, or Australia (Figure 6). Exome and whole-genome data have been produced for 16,226 and 96 samples, respectively, and about half of these sequences can be deposited in dbGaP (Figure 5). Additionally, data for newly identified causal variants have been made available through ClinVar and via a new track on the UCSC Genome Browser. Finally, web-based tools developed by the CMGs, such as GeneMatcher and Geno2MP, provide a mechanism for investigators with a candidate gene for a Mendelian phenotype to connect with other clinicians and/or basic scientists around the world with an interest in the same gene and to link phenotypic profiles to rare variants, respectively.80 Accordingly, the CMGs have empowered the entire international rare-disease research community.
Figure 5.

Overview of Deliverables from the CMGs
Collectively, the CMGs have worked with 529 investigators from 36 countries to collect and sequence 16,226 exomes and 96 genomes. Analyses of these data have resulted in 956 discoveries. These discoveries, as well as tools and technical methods developed by the CMGs, have led to the publication of 146 manuscripts.
Figure 6.

Worldwide Interactions with the CMGs
In collaboration with 529 investigators representing 261 institutions in 36 countries (or 1 of every 5 countries [orange] in the world), the CMGs have collected 18,863 samples from 8,838 families. Approximately 60% (n = 20) of these countries are located outside of North America, Europe, or Australia.
To assess progress toward identifying the genes underlying Mendelian phenotypes, it is critical to apply objective discovery metrics. To date, it has been challenging to quantify and compare reported discovery rates across different contexts (e.g., clinical service versus research). Because of its perceived simplicity, one discovery metric that has been suggested is the “solve rate,” or the proportion of investigated families in whom a causal variant for a Mendelian phenotype is identified. This definition is not particularly useful on its own given that one could, for example, achieve a high solve rate by sequencing only families affected by disorders for which the mutated gene was previously known.
In an attempt to provide clearly defined measures, we developed three complementary discovery metrics and applied them to phenotypes studied by the CMGs on the basis of strict criteria for (1) variant causality, (2) definitions of novel and known phenotypes, and (3) definitions of novel and known genes underlying a Mendelian phenotype (Table 1; Figure 7). This was necessary because although multiple guidelines for assessing causality have previously been proposed,81,82 none have been operationalized, much less used for assessing large-scale gene-discovery efforts studying thousands of families and samples across hundreds of rare Mendelian phenotypes.
Table 1.
Definitions of Terms Used to Characterize Discovery Type
| Term | Definition |
|---|---|
| Phenotype | the collection of observable or measurable traits of an individual |
| Known phenotype | a Mendelian phenotype with a MIM number |
| Explained, known phenotype | a Mendelian phenotype with a MIM number and for which a causal variant(s) in one or more genes is known |
| Unexplained, known phenotype | a Mendelian phenotype with a MIM number and for which no causal variant(s) has been reported |
| New phenotype | a Mendelian phenotype without a MIM number (MIM number assigned thereafter) |
| Known gene | a gene in which a causal variant(s) has been previously associated with a Mendelian phenotype |
| Novel gene | a gene in which a causal variant(s) has not been previously associated with a Mendelian phenotype |
| Known gene; explained, known phenotype | a Mendelian phenotype with a MIM number and for which a causal variant was found in a gene previously associated with the same phenotype |
| Novel gene; unexplained, known phenotype | a Mendelian phenotype with a MIM number, for which no causal variant(s) has been reported, and for which a causal variant was discovered in novel gene |
| Novel gene; new phenotype | a Mendelian phenotype without a MIM number and for which a causal variant(s) was found in a gene in which a causal variant(s) has not been previously associated with a Mendelian phenotype (MIM number assigned thereafter) |
| Known gene; unexplained, known phenotype | a Mendelian phenotype with a MIM number, for which a causal variant(s) has not been reported, and for which a causal variant was found in a gene previously associated with a different phenotype |
| Known gene; new phenotype | a Mendelian phenotype without a MIM number and for which a causal variant was found in a gene previously associated with a different phenotype (MIM number assigned thereafter) |
| Phenotype expansion | expansion of the spectrum of clinical characteristics of an explained, known Mendelian phenotype |
Figure 7.

Criteria for Establishing Causality of Discoveries
Flow diagram of decisions and criteria used for establishing whether gene discoveries by CMGs (Table 2) were considered causal by conservative or suggestive guidelines.
The overall diagnostic rate, defined as the proportion of families in whom a causal variant was identified, was 0.31 and 0.40 per conservative and suggestive causality criteria, respectively. This is comparable to diagnostic rates achieved by clinical WES, but neither the diagnostic rate in the CMGs nor its comparison to diagnostic rates of clinical service labs is a highly informative metric of success. On the one hand, families studied by the CMGs are specifically selected to have phenotypes that are less likely to be explained by an already known gene, thereby potentially lowering the CMG diagnostic rate. On the other hand, the CMGs often have the advantage of studying multiple individuals in a family and multiple families affected by the same unexplained phenotype, which is predicted to improve the diagnostic rate.
To date, 647 and 309 genes by conservative and suggestive causality criteria, respectively, or a total of 956 genes, were discovered by the CMGs to be implicated in a Mendelian phenotype (Table 2). Of the genes discovered by conservative criteria, 327 were (1) a gene that was not previously known to underlie a Mendelian phenotype (i.e., novel gene) but was found to be implicated in a known but unexplained phenotype (i.e., a phenotype with an OMIM number but for which no underlying gene was known; n = 25) or a novel phenotype (i.e., without an OMIM number; n = 107); (2) a gene that was previously known to underlie a Mendelian phenotype (i.e., known gene) and explained either a different known (n = 4) or a novel (n = 17) phenotype; or (3) a gene that was previously implicated in a Mendelian phenotype and was now discovered to be associated with an expanded set of clinical features (i.e., phenotypic expansion, n = 174).
Table 2.
Summary of Discoveries of Genes Underlying Mendelian Phenotypes
| Discovery Type | Evidence of Causality | |||
|---|---|---|---|---|
| Conservative | Suggestive | Total | ||
| Known | known gene; explained, known phenotype | 320 | 19 | 339 |
| Novel | phenotype expansion | 174 | 24 | 198 |
| known gene; unexplained, known phenotype | 4 | 0 | 4 | |
| known gene; new phenotype | 17 | 7 | 24 | |
| novel gene; unexplained, known phenotype | 25 | 27 | 52 | |
| novel gene; new phenotype | 107 | 232 | 339 | |
| Total novel | 327 | 290 | 617 | |
| Total number of discoveries | 647 | 309 | 956 |
Of our gene discoveries, 320 involved identification of a known gene that explained a known phenotype; the vast majority of these phenotypes (e.g., non-syndromic hearing loss [MIM: PS220290, PS124900]), asphyxiating thoracic dysplasia (MIM: PS208500), and oculocutaneous albinism (MIM: PS203100) had high locus heterogeneity. Less commonly, clinical screening failed to identify a causal variant that was discovered by WES, or a family was recognized in retrospect to be affected by an explained, known Mendelian phenotype with a clinical presentation that was unusual but not different enough to be classified as a phenotypic expansion. Overall, the causal-gene-identification rate, defined as the ratio of causal genes identified to Mendelian phenotypes studied, was 0.51 genes identified per Mendelian phenotype studied.
If gene discoveries meeting conservative and suggestive criteria are combined, 617 were (1) a novel gene that was found to underlie a known, unexplained Mendelian phenotype (n = 52) or a novel phenotype (n = 339); (2) a known gene that explained a different known Mendelian phenotype (n = 4) or a novel Mendelian phenotype (n = 24); or (3) a gene underlying a phenotypic expansion (n = 198) (Figure 8). 339 discoveries were for a gene previously known to underlie the Mendelian phenotype studied. Accordingly, the causal-gene-identification rate combining conservative and suggestive criteria was 0.76 genes per Mendelian phenotype studied.
Figure 8.

Breakdown of Discoveries Made in the 1,049 Mendelian Phenotypes Assessed in the CMG Pipeline
Phenotypes entering the CMG pipelines are putatively either new phenotypes or unexplained, known phenotypes. A substantial fraction (i.e., 32%) of phenotypes were found to have causal variants in known genes, consistent with explained, known phenotypes. However, a larger fraction (40%) of phenotypes assessed resulted in discoveries of novel genes in addition to the expansion of 198 Mendelian phenotypes. For ∼28% of phenotypes assessed, no causal variant has yet been discovered. Novel genes are those that were not associated with any Mendelian phenotype when a project was accepted by the CMGs. Phenotypes are defined on a gene- and/or genotype-centric basis—if a novel gene was discovered for a known, explained phenotype, the phenotype was reclassified as a novel phenotype because it is almost certain that deeper phenotyping would reveal (molecular, biochemical, or physiological) differences that distinguish the novel phenotype from the previously known, explained phenotype caused by mutations in another gene.
Analysis of gene-identification rates by mode of inheritance used for modeling segregation in the analysis of each phenotype provides further resolution about the types of Mendelian phenotypes for which gene discovery was successful and the challenges that remain. Gene-identification rates based on conservative criteria ranged from 0.29 (multiple models) to 0.66 (autosomal recessive) (Figure 9A); for comparison, if a causal gene were identified for every phenotype, this ratio would approach a maximum value of 1. Gene discoveries in consanguineous families were sometimes complicated by locus heterogeneity and by the rarity of the phenotype, consistent with a lower-than-anticipated gene-identification rate (0.60).83,84 Lastly, the novel-discovery rate, or the proportion of Mendelian phenotypes in which the gene was newly discovered to underlie a novel or unexplained phenotype, including phenotype expansions, was 0.52 (Figures 9B and 9C). Thus, the novel-discovery rate based on conservative and suggestive causality criteria was 0.66.
Figure 9.

Discovery Metrics under Different Models of Inheritance for Mendelian Phenotypes Studied by the CMGs
(A) The percentage of Mendelian phenotypes for which a gene was discovered on the basis of conservative causality criteria per different models of inheritance with mapping data (dark green) or without mapping data (light green) is shown. Also shown is the percentage of Mendelian phenotypes for which a causal gene was not found per different models of inheritance with mapping data (dark gray) or without mapping data (light gray). Note that for most phenotypes analyzed under an autosomal-recessive homozygous model that failed, mapping data were available; however, the statistical significance of the mapping data varied (e.g., number and length of runs of homozygosity, magnitude of LOD score, etc.). The mean number of genes discovered per Mendelian phenotype was 0.52 or 0.76 on the basis of only conservative or combined conservative and suggestive criteria, respectively. These figures do not include results from persons found to have more than one Mendelian phenotype.
(B) Classification of discoveries of genes underlying Mendelian phenotypes as known (white squares) or novel (blue squares).
(C) Percentage of Mendelian phenotypes for which a novel discovery (dark blue) or known discovery (light blue) was made on the basis of conservative causality criteria per different models of inheritance. The mean number of novel discoveries per Mendelian phenotype was 0.52 or 0.66 on the basis of only conservative or combined conservative and suggestive criteria, respectively.
Abbreviations are as follows: AD, autosomal dominant; AR, autosomal recessive (when recessive inheritance was clear, but analysis of both consanguineous and non-consanguineous families contributed to the discovery); AR homozygous, autosomal recessive in a consanguineous family; AR heterozygous, autosomal recessive in a non-consanguineous family (i.e., compound-heterozygous mutations).
The criteria that we used to estimate novel-discovery rates were conservative, in large part because causal variants in the same gene had to be identified in two or more families affected by the same Mendelian phenotype or, if a putatively causal variant was found in only one family, because both high-confidence mapping and compelling functional data (e.g., recapitulation of the phenotype in an animal model) were required.81 Given that many of the Mendelian phenotypes studied are quite rare and that additional families were not available for study, the net effect of imposing conservative causality criteria was a 1.5-fold reduction in the number of Mendelian phenotypes we considered unequivocally explained. Yet, as more families are studied and more data are shared among researchers and clinicians, our results based on suggestive causality criteria are also likely to lead to genuine gene discoveries for Mendelian phenotypes.
Lessons Learned and Challenges
The overall rate of discovery made by the CMGs over the past 3 years has been approximately three discoveries per week, including the identification of Mendelian phenotypes associated with 375 genes (128 by conservative criteria) not previously known to influence human health. This rate shows no signs of decreasing. Discovery at this scale has also provided guidance about the most effective analytical strategies for gene discovery and, in conjunction with the efforts of other research groups, has exposed genetic mechanisms of disease (e.g., de novo mutation, CNVs, digenic inheritance, somatic mosaicism, and variants that are in the same gene but cause both dominant and recessive conditions) that are more common than previously appreciated. For example, de novo mutations were found to be responsible for a wide range of multiple-malformation syndromes, including visceral myopathy85 (MIM: 155310), acromelic frontonasal dysostosis86 (MIM: 603671), and Gordon syndrome87 (MIM: 114300), as well as isolated congenital heart defects88,89 and diaphragmatic hernia.90 Facioscapulohumeral muscular dystrophy 2 (MIM: 158901) segregates as a Mendelian condition but was found to result from digenic inheritance of a D4Z4 microsatellite repeat on a chromosome 4 haplotype permissive for expression of the embedded gene, double homeobox 4 (DUX4 [MIM: 606009]), and a variant in structural maintenance of chromosomes flexible hinge domain containing 1 (SMCHD1 [MIM: 614982]).91 Mutations in mab-21-like 2 (C. elegans) (MAB21L2 [MIM: 604357]) underlie a spectrum of major eye malformations that segregate as either a dominant or recessive trait.92 Similarly, mutations in sodium leak channel, nonselective (NALCN [MIM: 611549]), a gene whose mutations are known to cause an autosomal-recessive condition—infantile hypotonia with psychomotor retardation and characteristic facies93 (MIM: 615419)—were found to also cause a novel autosomal-dominant disorder, CLIFAHDD (congenital contractures of the limbs and face, hypotonia, and global developmental delay) syndrome.94
When multiple modes of inheritance are consistent with the segregation pattern observed in a pedigree or there is otherwise uncertainty about the correct mode of inheritance for a phenotype (i.e., requiring that each model be tested separately), it is clear that the rate of gene discovery is considerably lower than when the mode of inheritance is known or easily predicted (Figures 9A and 9C). The application of multiple models was often required because there were too few families for establishing segregation patterns definitively, too little information for establishing the affectation status of an individual or stratifying persons by phenotypic similarity, or a combination thereof. This underscores the need for ascertainment and deep phenotyping of families along with an infrastructure for warehousing and sharing exome and genome data from “mutation-negative” research subjects and clinical cases. Otherwise, the rate of successful gene identification did not differ markedly across different inheritance models.
Our results on novel-discovery rates show that Mendelian phenotypes caused at least in part by de novo mutations are a rich source of novel discoveries. Additionally, because several affected persons with de novo mutations in the same gene can frequently be identified, it is often easier to satisfy conservative causality criteria in these circumstances than in rare recessive conditions. Correspondingly, our results indicate that the rate of novel discovery for Mendelian phenotypes was unexpectedly83 more modest in consanguineous families when it was based on an autosomal-recessive model and conservative causality criteria. However, the rate of novel discovery in consanguineous families varied among centers. The majority of consanguineous families in the CMG dataset are from geographic regions and populations poorly represented in public variant databases, and the ability to deeply phenotype affected individuals is often limited, both of which reduce the effectiveness of excluding non-causal variants.84 Additionally, many of the phenotypes assessed under this model in the CMG dataset (e.g., non-syndromic hearing loss, nephrotic syndrome, brain malformations, or intellectual disability) were categorical phenotypes with high locus heterogeneity, which we have demonstrated is associated with lower clinical diagnostic rates (Figure 1). Accordingly, of the 214 discoveries meeting conservative criteria and made on the basis of an autosomal-recessive model, 129 (60%) involved a known gene for an explained, known phenotype, and only 85 (40%) qualified as novel discoveries (Figure 9C).
Phenotypic expansions and known genes associated with a known, unexplained phenotype or a novel phenotype composed a substantial fraction of CMG discoveries. Until recently, the prevailing method by which new Mendelian phenotypes were described relied on circular logic restricted to the features of the first clinical report. This strategy of ascertaining persons with highly similar phenotypes and subsequent gene discovery within the ascertained group biases against uncovering mutations that are in the same gene and that result in new or different sets of phenotypic features. This phenomenon is apparent in the CMG discoveries and is most likely far more common than generally appreciated. In an analysis of data from OMIM (February 2015), 706 genes or ∼24% of all genes associated with a Mendelian phenotype are responsible for at least two “clinically discrete” phenotypes.
No gene with causal variants could be identified (i.e., either no compelling candidate variants could be identified, or the number of candidate variants remained large) for approximately half of Mendelian phenotypes assessed by the CMGs. Failure to identify a gene underlying these phenotypes is most likely explained by a combination of biological, technical, and analytical factors.95 WES cannot detect or has a hard time detecting many types of variants (e.g., indels, non-coding variants, CNVs, repeat expansions, SVs such as inversions and translocations, etc.). WGS is better at detecting these variants and will be increasingly utilized as the cost of this technology is reduced. In ongoing pilot testing, the CMGs conducted WGS on ∼100 samples selected for a variety of reasons, including insufficient DNA quantity for WES, suspicion that the causal variant would be unlikely to be detected by WES, or failure to identify a plausible candidate gene by prior WES. To date, this pilot testing has not led to a discovery that could not be detected or interpreted by WES or genotyping arrays (e.g., for CNVs). We anticipate that this will change as more Mendelian phenotypes fail discovery efforts using WES and are re-examined by WGS. However the lack of WGS discoveries in our limited pilot is consistent with a recent study that found that only ∼15% of causal variants identified by clinical WGS would most likely have been missed by WES. Moreover, although significant, this percentage is not high enough to justify the current additional costs of using WGS on a large scale for gene discovery, especially because the same study found that WGS applied to dominantly inherited disorders usually identified a large number of candidate variants for which pathogenicity could not be determined.96 As a result, increasing the use of WGS will require expanded informatics infrastructure and greatly improved tools and methods for establishing causality at scale among the consequentially inflated catalog of candidate variants (e.g., synonymous variants, non-coding variants, SVs, etc.).81,97,98
Impact of CMGs Accomplishments on Clinical Care and the Scientific Community
The translation and impact of the CMGs’ efforts on clinical care has been immediate and substantial.99 Approximately 521 novel Mendelian phenotypes have been delineated, and the clinical features of 219 known Mendelian phenotypes have been expanded. The net effect of these advances will be a better understanding of the genetic and allelic architecture of Mendelian phenotypes, an ability to distinguish among similar phenotypes, and improved ability to facilitate molecular diagnosis for disease. These results are already having substantial clinical implications. For example, variants in genes identified as underlying Mendelian phenotypes since 2011 by the CMGs and other members of the Mendelian genetics community represent ∼30% of positive findings from clinical WES.36 This result emphasizes the ongoing importance of discovering genes underlying disease. Moreover, CMG discoveries have added several hundred putative starting points for the development of targeted therapeutics for Mendelian phenotypes.
In aggregate, CMG-facilitated resources and discoveries have resulted in 146 publications over the past 2.5 years (Table S3). The discordance between the number of discoveries made and the number of publications to date reflects, in part, the time required after gene discovery for identifying and testing additional families and elucidating the underlying molecular, developmental, and physiological mechanisms of disease. These efforts are undertaken foremost to ensure the validity of the discovery but also to increase the likelihood of publication in a high-impact journal.81,82 Accordingly, most of the discoveries made by the CMGs have yet to be reported because they were made recently, and additional experimentation is underway. Nevertheless, this delay is of considerable concern given the value of gene discovery as a stimulus for basic research and improved clinical care. Alternative methods of rapidly reporting gene discoveries (e.g., online reporting in centralized databases, rapid communication in print journals, etc.) have been proposed100,101 but face barriers to implementation, including the cost of developing and maintaining an online discovery warehouse, a lack of consensus as to how to safeguard investigator attribution and provide credit for academic advancement, and the benefits investigators perceive to keeping such information privileged.
Beyond discovering genes implicated in disease, the CMGs have developed and disseminated both methods and tools to (1) enable large-scale inventory and indexing of Mendelian phenotypes, as well as provide an analysis module that enables rapid and flexible filtering of WES and WGS data coupled with the family or cohort phenotype data (PhenoDB),80,102(2) facilitate candidate-gene comparisons among investigators (GeneMatcher),80 (3) reconstruct extended pedigree relationships from genotype data (PRIMUS [Pedigree Reconstruction and Identification of a Maximally Unrelated Set]),103 (4) perform quality control of variant data (VAT),104 and (5) make computational predictions of the impact of sequence variants, including non-coding regions (ALOFT [Annotation of Loss-of-Function Transcripts], CADD [Combined Annotation-Dependent Depletion],98 and FunSeq105) (Figure 5).
Opportunities
Achieving NHGRI’s goal of understanding the genetic basis of inherited disease will ultimately require discovering the gene underlying virtually every Mendelian phenotype. This achievement will be a cornerstone of precision medicine.67 Today, and for the foreseeable future, the vast majority of genetic diagnostic tests, primary and incidental results returned to families, and results that guide clinical management in children and adults are based on discoveries of genes underlying Mendelian phenotypes. The rapidly growing catalog of phenotypes and causative variants for Mendelian phenotypes immediately (1) makes it possible for clinical laboratories to rapidly improve rates of molecular diagnosis for rare diseases, (2) advances the development and re-purposing of therapeutics, and (3) empowers clinicians to improve the care and management of individuals with a very wide spectrum of conditions. Accordingly, discovering the cause of most, if not all, Mendelian phenotypes could transform the practice of medicine and the care of families.
Of broader interest to the biomedical research community, discovery of genes implicated in all Mendelian phenotypes will (1) connect genes and their protein products to biological systems and clinical phenotypes, (2) provide a pathway for developing better strategies to find genetic and environmental modifiers underlying common diseases, and (3) enable understanding of the functional and phenotypic consequences of non-coding variation. Indeed, it is becoming increasingly clear that, in the absence of deep phenotypic characterization, genomic information even from a large number of individuals is of limited value. Moreover, what can be understood about gene function and phenotypic consequences is proportional to the breadth and diversity of conditions studied. To this end, our results and experiences suggest that the full power of human genomics to explain fundamental biological processes and rapidly transform medical care might be more readily realized by discovery of the genetic basis of all Mendelian phenotypes rather than large-scale sequencing of a handful of common diseases.
During the next 5 years, there will be a growing need for (1) keystone projects (e.g., to delineate and deeply phenotype all Mendelian phenotypes, to catalog all validated large-effect variants underlying Mendelian phenotypes, etc.) to empower the biomedical community and (2) large-scale projects to explain the functional consequences of variants responsible for all Mendelian phenotypes. These projects will generate a complete catalog of the phenotypic characteristics for all Mendelian disorders and the relationships that distinguish them; identify, index, and warehouse all causal variants linked to all Mendelian phenotypes and the range of different phenotypic features observed within each individual Mendelian disorder; and pioneer new approaches and analytical methods that can be exploited at scale for the discovery of genes underlying Mendelian phenotypes and rare disorders caused by non-traditional modes of inheritance (e.g., oligogenic, de novo, somatic mosaicism, uniparental disomy, etc.) and for explaining their overall contribution to the burden of human disease.
Acknowledgments
We thank all the families, clinicians, and investigators for their participation and support and the staff of GeneReviews and OMIM for assistance and access to data. We thank Colleen Davis, Seema Jamal, Kathryn Shively, and Colby Marvin for helpful discussion and technical assistance. This work was supported in part by National Human Genome Research Institute (NHGRI) and National Heart, Lung, and Blood Institute (NHLBI) grants HG006504 (to the Yale Center for Mendelian Disorders), HG006542 (to the Baylor-Hopkins Center for Mendelian Genomics), and HG006493 (to the University of Washington Center for Mendelian Genomics). The content is solely the responsibility of the authors and does not necessarily represent the official views of the NHGRI and NHLBI of the NIH. J.R.L. has stock ownership in 23andMe, is a paid consultant for Regeneron Pharmaceuticals, has stock options in Lasergen Inc., is a member of the Scientific Advisory Board of Baylor Miraca Genetics Laboratories, and is a co-inventor on multiple US and European patents related to molecular diagnostics for inherited neuropathies, eye diseases, and bacterial genomic fingerprinting. The Department of Molecular and Human Genetics at Baylor College of Medicine (D.M. and J.R.L.) derives revenue from the chromosomal microarray analysis and clinical exome sequencing offered in the Baylor Miraca Genetics Laboratory (http://www.bmgl.com/BMGL/Default.aspx).
Footnotes
Web Resources
The URLs for data presented herein are as follows:
- ALOFT, https://www.github.com/gersteinlab/aloft
- Centers for Mendelian Genomics, http://mendelian.org/
- Centers for Mendelian Genomics investigated phenotypes, http://mendelian.org/investigated-disorders
- ClinVar, http://www.ncbi.nlm.nih.gov/clinvar/
- dbGAP, http://www.ncbi.nlm.nih.gov/gap
- ENCODE, http://www.genome.gov/encode/
- Ensembl, http://www.ensembl.org/index.html
- GeneMatcher, https://genematcher.org/
- GeneReviews, http://www.ncbi.nlm.nih.gov/books/NBK1116/
- Geno2MP, http://geno2mp.gs.washington.edu/
- NHGRI GWAS Catalog, http://www.genome.gov/gwastudies/
- OMIM, http://omim.org
- PhenoDB, http://phenodb.net
- PRIMUS, https://primus.gs.washington.edu/primusweb/
- Therapeutic Target Database, http://bidd.nus.edu.sg/group/ttd/ttd.asp
- UCSC Genome Browser, http://genome.ucsc.edu/
Supplemental Data
Document S1. Figures S1 and S2, Tables S1–S4, and Supplemental Material and Methods
Document S2. Article plus Supplemental Data
References
- 1.Green E.D., Guyer M.S., National Human Genome Research Institute Charting a course for genomic medicine from base pairs to bedside. Nature. 2011;470:204–213. doi: 10.1038/nature09764. [DOI] [PubMed] [Google Scholar]
- 2.Kaiser J. Human genetics. Affordable ‘exomes’ fill gaps in a catalog of rare diseases. Science. 2010;330:903. doi: 10.1126/science.330.6006.903. [DOI] [PubMed] [Google Scholar]
- 3.Amberger J.S., Bocchini C.A., Schiettecatte F., Scott A.F., Hamosh A. OMIM.org: Online Mendelian Inheritance in Man (OMIM®), an online catalog of human genes and genetic disorders. Nucleic Acids Res. 2015;43:D789–D798. doi: 10.1093/nar/gku1205. [DOI] [PMC free article] [PubMed] [Google Scholar]
- 4.Stankiewicz P., Lupski J.R. Structural variation in the human genome and its role in disease. Annu. Rev. Med. 2010;61:437–455. doi: 10.1146/annurev-med-100708-204735. [DOI] [PubMed] [Google Scholar]
- 5.Bainbridge M.N., Wiszniewski W., Murdock D.R., Friedman J., Gonzaga-Jauregui C., Newsham I., Reid J.G., Fink J.K., Morgan M.B., Gingras M.C. Whole-genome sequencing for optimized patient management. Sci. Transl. Med. 2011;3:87re3. doi: 10.1126/scitranslmed.3002243. [DOI] [PMC free article] [PubMed] [Google Scholar]
- 6.Bjornsson H.T., Benjamin J.S., Zhang L., Weissman J., Gerber E.E., Chen Y.C., Vaurio R.G., Potter M.C., Hansen K.D., Dietz H.C. Histone deacetylase inhibition rescues structural and functional brain deficits in a mouse model of Kabuki syndrome. Sci. Transl. Med. 2014;6:256ra135. doi: 10.1126/scitranslmed.3009278. [DOI] [PMC free article] [PubMed] [Google Scholar]
- 7.St Hilaire C., Ziegler S.G., Markello T.C., Brusco A., Groden C., Gill F., Carlson-Donohoe H., Lederman R.J., Chen M.Y., Yang D. NT5E mutations and arterial calcifications. N. Engl. J. Med. 2011;364:432–442. doi: 10.1056/NEJMoa0912923. [DOI] [PMC free article] [PubMed] [Google Scholar]
- 8.McDermott D.H., Gao J.L., Liu Q., Siwicki M., Martens C., Jacobs P., Velez D., Yim E., Bryke C.R., Hsu N. Chromothriptic cure of WHIM syndrome. Cell. 2015;160:686–699. doi: 10.1016/j.cell.2015.01.014. [DOI] [PMC free article] [PubMed] [Google Scholar]
- 9.Ezkurdia I., Juan D., Rodriguez J.M., Frankish A., Diekhans M., Harrow J., Vazquez J., Valencia A., Tress M.L. Multiple evidence strands suggest that there may be as few as 19,000 human protein-coding genes. Hum. Mol. Genet. 2014;23:5866–5878. doi: 10.1093/hmg/ddu309. [DOI] [PMC free article] [PubMed] [Google Scholar]
- 10.Flicek P., Amode M.R., Barrell D., Beal K., Billis K., Brent S., Carvalho-Silva D., Clapham P., Coates G., Fitzgerald S. Ensembl 2014. Nucleic Acids Res. 2014;42:D749–D755. doi: 10.1093/nar/gkt1196. [DOI] [PMC free article] [PubMed] [Google Scholar]
- 11.Waterston R.H., Lindblad-Toh K., Birney E., Rogers J., Abril J.F., Agarwal P., Agarwala R., Ainscough R., Alexandersson M., An P., Mouse Genome Sequencing Consortium Initial sequencing and comparative analysis of the mouse genome. Nature. 2002;420:520–562. doi: 10.1038/nature01262. [DOI] [PubMed] [Google Scholar]
- 12.Davydov E.V., Goode D.L., Sirota M., Cooper G.M., Sidow A., Batzoglou S. Identifying a high fraction of the human genome to be under selective constraint using GERP++ PLoS Comput. Biol. 2010;6:e1001025. doi: 10.1371/journal.pcbi.1001025. [DOI] [PMC free article] [PubMed] [Google Scholar]
- 13.Aparicio S., Chapman J., Stupka E., Putnam N., Chia J.M., Dehal P., Christoffels A., Rash S., Hoon S., Smit A. Whole-genome shotgun assembly and analysis of the genome of Fugu rubripes. Science. 2002;297:1301–1310. doi: 10.1126/science.1072104. [DOI] [PubMed] [Google Scholar]
- 14.Makrythanasis P., Antonarakis S.E. Pathogenic variants in non-protein-coding sequences. Clin. Genet. 2013;84:422–428. doi: 10.1111/cge.12272. [DOI] [PubMed] [Google Scholar]
- 15.Cooper D.N., Chen J.M., Ball E.V., Howells K., Mort M., Phillips A.D., Chuzhanova N., Krawczak M., Kehrer-Sawatzki H., Stenson P.D. Genes, mutations, and human inherited disease at the dawn of the age of personalized genomics. Hum. Mutat. 2010;31:631–655. doi: 10.1002/humu.21260. [DOI] [PubMed] [Google Scholar]
- 16.Kellis M., Wold B., Snyder M.P., Bernstein B.E., Kundaje A., Marinov G.K., Ward L.D., Birney E., Crawford G.E., Dekker J. Defining functional DNA elements in the human genome. Proc. Natl. Acad. Sci. USA. 2014;111:6131–6138. doi: 10.1073/pnas.1318948111. [DOI] [PMC free article] [PubMed] [Google Scholar]
- 17.Weedon M.N., Cebola I., Patch A.M., Flanagan S.E., De Franco E., Caswell R., Rodríguez-Seguí S.A., Shaw-Smith C., Cho C.H., Lango Allen H., International Pancreatic Agenesis Consortium Recessive mutations in a distal PTF1A enhancer cause isolated pancreatic agenesis. Nat. Genet. 2014;46:61–64. doi: 10.1038/ng.2826. [DOI] [PMC free article] [PubMed] [Google Scholar]
- 18.Seok J., Warren H.S., Cuenca A.G., Mindrinos M.N., Baker H.V., Xu W., Richards D.R., McDonald-Smith G.P., Gao H., Hennessy L., Inflammation and Host Response to Injury, Large Scale Collaborative Research Program Genomic responses in mouse models poorly mimic human inflammatory diseases. Proc. Natl. Acad. Sci. USA. 2013;110:3507–3512. doi: 10.1073/pnas.1222878110. [DOI] [PMC free article] [PubMed] [Google Scholar]
- 19.Bamshad M.J., Ng S.B., Bigham A.W., Tabor H.K., Emond M.J., Nickerson D.A., Shendure J. Exome sequencing as a tool for Mendelian disease gene discovery. Nat. Rev. Genet. 2011;12:745–755. doi: 10.1038/nrg3031. [DOI] [PubMed] [Google Scholar]
- 20.Below J.E., Earl D.L., Shively K.M., McMillin M.J., Smith J.D., Turner E.H., Stephan M.J., Al-Gazali L.I., Hertecant J.L., Chitayat D., University of Washington Center for Mendelian Genomics Whole-genome analysis reveals that mutations in inositol polyphosphate phosphatase-like 1 cause opsismodysplasia. Am. J. Hum. Genet. 2013;92:137–143. doi: 10.1016/j.ajhg.2012.11.011. [DOI] [PMC free article] [PubMed] [Google Scholar]
- 21.Ng S.B., Turner E.H., Robertson P.D., Flygare S.D., Bigham A.W., Lee C., Shaffer T., Wong M., Bhattacharjee A., Eichler E.E. Targeted capture and massively parallel sequencing of 12 human exomes. Nature. 2009;461:272–276. doi: 10.1038/nature08250. [DOI] [PMC free article] [PubMed] [Google Scholar]
- 22.Choi M., Scholl U.I., Ji W., Liu T., Tikhonova I.R., Zumbo P., Nayir A., Bakkaloğlu A., Ozen S., Sanjad S. Genetic diagnosis by whole exome capture and massively parallel DNA sequencing. Proc. Natl. Acad. Sci. USA. 2009;106:19096–19101. doi: 10.1073/pnas.0910672106. [DOI] [PMC free article] [PubMed] [Google Scholar]
- 23.Ng S.B., Buckingham K.J., Lee C., Bigham A.W., Tabor H.K., Dent K.M., Huff C.D., Shannon P.T., Jabs E.W., Nickerson D.A. Exome sequencing identifies the cause of a mendelian disorder. Nat. Genet. 2010;42:30–35. doi: 10.1038/ng.499. [DOI] [PMC free article] [PubMed] [Google Scholar]
- 24.Lupski J.R., Gonzaga-Jauregui C., Yang Y., Bainbridge M.N., Jhangiani S., Buhay C.J., Kovar C.L., Wang M., Hawes A.C., Reid J.G. Exome sequencing resolves apparent incidental findings and reveals further complexity of SH3TC2 variant alleles causing Charcot-Marie-Tooth neuropathy. Genome Med. 2013;5:57. doi: 10.1186/gm461. [DOI] [PMC free article] [PubMed] [Google Scholar]
- 25.Biesecker L.G. Exome sequencing makes medical genomics a reality. Nat. Genet. 2010;42:13–14. doi: 10.1038/ng0110-13. [DOI] [PubMed] [Google Scholar]
- 26.Gonzaga-Jauregui C., Lupski J.R., Gibbs R.A. Human genome sequencing in health and disease. Annu. Rev. Med. 2012;63:35–61. doi: 10.1146/annurev-med-051010-162644. [DOI] [PMC free article] [PubMed] [Google Scholar]
- 27.Baird P.A., Anderson T.W., Newcombe H.B., Lowry R.B. Genetic disorders in children and young adults: a population study. Am. J. Hum. Genet. 1988;42:677–693. [PMC free article] [PubMed] [Google Scholar]
- 28.Christianson, A., Howson, C.P., and Modell, B. (2006). March of Dimes Global Report on Birth Defects: The hidden toll of dying and disabled children. March of Dimes Birth Defects Foundation, http://www.marchofdimes.org/materials/global-report-on-birth-defects-the-hidden-toll-of-dying-and-disabled-children-executive-summary.pdf.
- 29.Angelis A., Tordrup D., Kanavos P. Socio-economic burden of rare diseases: A systematic review of cost of illness evidence. Health Policy. 2015;119:964–979. doi: 10.1016/j.healthpol.2014.12.016. [DOI] [PubMed] [Google Scholar]
- 30.Shashi V., McConkie-Rosell A., Rosell B., Schoch K., Vellore K., McDonald M., Jiang Y.H., Xie P., Need A., Goldstein D.B. The utility of the traditional medical genetics diagnostic evaluation in the context of next-generation sequencing for undiagnosed genetic disorders. Genet. Med. 2014;16:176–182. doi: 10.1038/gim.2013.99. [DOI] [PubMed] [Google Scholar]
- 31.Gahl W.A., Markello T.C., Toro C., Fajardo K.F., Sincan M., Gill F., Carlson-Donohoe H., Gropman A., Pierson T.M., Golas G. The National Institutes of Health Undiagnosed Diseases Program: insights into rare diseases. Genet. Med. 2012;14:51–59. doi: 10.1038/gim.0b013e318232a005. [DOI] [PMC free article] [PubMed] [Google Scholar]
- 32.Eurordis - Rare Diseases Europe (2007). Survey of the delay in diagnosis for 8 rare diseases in Europe (EurordisCare2). Eurordis fact sheet, http://www.eurordis.org/IMG/pdf/Fact_Sheet_Eurordiscare2.pdf.
- 33.Devuyst O., Knoers N.V., Remuzzi G., Schaefer F., Board of the Working Group for Inherited Kidney Diseases of the European Renal Association and European Dialysis and Transplant Association Rare inherited kidney diseases: challenges, opportunities, and perspectives. Lancet. 2014;383:1844–1859. doi: 10.1016/S0140-6736(14)60659-0. [DOI] [PMC free article] [PubMed] [Google Scholar]
- 34.Pugh T.J., Kelly M.A., Gowrisankar S., Hynes E., Seidman M.A., Baxter S.M., Bowser M., Harrison B., Aaron D., Mahanta L.M. The landscape of genetic variation in dilated cardiomyopathy as surveyed by clinical DNA sequencing. Genet. Med. 2014;16:601–608. doi: 10.1038/gim.2013.204. [DOI] [PubMed] [Google Scholar]
- 35.Euro E.-R.E.S.C., EuroEPINOMICS-RES Consortium. Epilepsy Phenome/Genome Project. Epi4K Consortium De novo mutations in synaptic transmission genes including DNM1 cause epileptic encephalopathies. Am. J. Hum. Genet. 2014;95:360–370. doi: 10.1016/j.ajhg.2014.08.013. [DOI] [PMC free article] [PubMed] [Google Scholar]
- 36.Yang Y., Muzny D.M., Xia F., Niu Z., Person R., Ding Y., Ward P., Braxton A., Wang M., Buhay C. Molecular findings among patients referred for clinical whole-exome sequencing. JAMA. 2014;312:1870–1879. doi: 10.1001/jama.2014.14601. [DOI] [PMC free article] [PubMed] [Google Scholar]
- 37.Miller D.T., Adam M.P., Aradhya S., Biesecker L.G., Brothman A.R., Carter N.P., Church D.M., Crolla J.A., Eichler E.E., Epstein C.J. Consensus statement: chromosomal microarray is a first-tier clinical diagnostic test for individuals with developmental disabilities or congenital anomalies. Am. J. Hum. Genet. 2010;86:749–764. doi: 10.1016/j.ajhg.2010.04.006. [DOI] [PMC free article] [PubMed] [Google Scholar]
- 38.Farwell K.D., Shahmirzadi L., El-Khechen D., Powis Z., Chao E.C., Davis B.T., Baxter R.M., Zeng W., Mroske C., Parra M.C. Enhanced utility of family-centered diagnostic exome sequencing with inheritance model-based analysis: results from 500 unselected families with undiagnosed genetic conditions. Genet. Med. 2014 doi: 10.1038/gim.2014.154. Published online November 6, 2014. [DOI] [PubMed] [Google Scholar]
- 39.Hennekam R.C. A newborn with unusual morphology: some practical aspects. Semin. Fetal Neonatal Med. 2011;16:109–113. doi: 10.1016/j.siny.2010.12.002. [DOI] [PubMed] [Google Scholar]
- 40.Hennekam R.C., Biesecker L.G. Next-generation sequencing demands next-generation phenotyping. Hum. Mutat. 2012;33:884–886. doi: 10.1002/humu.22048. [DOI] [PMC free article] [PubMed] [Google Scholar]
- 41.Brunner H.G., van Driel M.A. From syndrome families to functional genomics. Nat. Rev. Genet. 2004;5:545–551. doi: 10.1038/nrg1383. [DOI] [PubMed] [Google Scholar]
- 42.Erdmann R., Veenhuis M., Mertens D., Kunau W.H. Isolation of peroxisome-deficient mutants of Saccharomyces cerevisiae. Proc. Natl. Acad. Sci. USA. 1989;86:5419–5423. doi: 10.1073/pnas.86.14.5419. [DOI] [PMC free article] [PubMed] [Google Scholar]
- 43.Liu H., Styles C.A., Fink G.R. Saccharomyces cerevisiae S288C has a mutation in FLO8, a gene required for filamentous growth. Genetics. 1996;144:967–978. doi: 10.1093/genetics/144.3.967. [DOI] [PMC free article] [PubMed] [Google Scholar]
- 44.Gimeno C.J., Ljungdahl P.O., Styles C.A., Fink G.R. Unipolar cell divisions in the yeast S. cerevisiae lead to filamentous growth: regulation by starvation and RAS. Cell. 1992;68:1077–1090. doi: 10.1016/0092-8674(92)90079-r. [DOI] [PubMed] [Google Scholar]
- 45.Li X., O’Neil N.J., Moshgabadi N., Hieter P. Synthetic cytotoxicity: digenic interactions with TEL1/ATM mutations reveal sensitivity to low doses of camptothecin. Genetics. 2014;197:611–623. doi: 10.1534/genetics.114.161307. [DOI] [PMC free article] [PubMed] [Google Scholar]
- 46.Baynam G., Walters M., Claes P., Kung S., LeSouef P., Dawkins H., Bellgard M., Girdea M., Brudno M., Robinson P. Phenotyping: targeting genotype’s rich cousin for diagnosis. J. Paediatr. Child Health. 2015;51:381–386. doi: 10.1111/jpc.12705. [DOI] [PubMed] [Google Scholar]
- 47.Robinson P.N. Deep phenotyping for precision medicine. Hum. Mutat. 2012;33:777–780. doi: 10.1002/humu.22080. [DOI] [PubMed] [Google Scholar]
- 48.Amberger J., Bocchini C., Hamosh A. A new face and new challenges for Online Mendelian Inheritance in Man (OMIM®) Hum. Mutat. 2011;32:564–567. doi: 10.1002/humu.21466. [DOI] [PubMed] [Google Scholar]
- 49.Deans A.R., Lewis S.E., Huala E., Anzaldo S.S., Ashburner M., Balhoff J.P., Blackburn D.C., Blake J.A., Burleigh J.G., Chanet B. Finding our way through phenotypes. PLoS Biol. 2015;13:e1002033. doi: 10.1371/journal.pbio.1002033. [DOI] [PMC free article] [PubMed] [Google Scholar]
- 50.Ayadi A., Birling M.C., Bottomley J., Bussell J., Fuchs H., Fray M., Gailus-Durner V., Greenaway S., Houghton R., Karp N. Mouse large-scale phenotyping initiatives: overview of the European Mouse Disease Clinic (EUMODIC) and of the Wellcome Trust Sanger Institute Mouse Genetics Project. Mamm. Genome. 2012;23:600–610. doi: 10.1007/s00335-012-9418-y. [DOI] [PMC free article] [PubMed] [Google Scholar]
- 51.Perry G.H., Dominy N.J., Claw K.G., Lee A.S., Fiegler H., Redon R., Werner J., Villanea F.A., Mountain J.L., Misra R. Diet and the evolution of human amylase gene copy number variation. Nat. Genet. 2007;39:1256–1260. doi: 10.1038/ng2123. [DOI] [PMC free article] [PubMed] [Google Scholar]
- 52.Blakemore A.I., Froguel P. Investigation of Mendelian forms of obesity holds out the prospect of personalized medicine. Ann. N Y Acad. Sci. 2010;1214:180–189. doi: 10.1111/j.1749-6632.2010.05880.x. [DOI] [PubMed] [Google Scholar]
- 53.Kathiresan S., Srivastava D. Genetics of human cardiovascular disease. Cell. 2012;148:1242–1257. doi: 10.1016/j.cell.2012.03.001. [DOI] [PMC free article] [PubMed] [Google Scholar]
- 54.Wu N., Ming X., Xiao J., Wu Z., Chen X., Shinawi M., Shen Y., Yu G., Liu J., Xie H. TBX6 null variants and a common hypomorphic allele in congenital scoliosis. N. Engl. J. Med. 2015;372:341–350. doi: 10.1056/NEJMoa1406829. [DOI] [PMC free article] [PubMed] [Google Scholar]
- 55.Lifton R.P., Dluhy R.G., Powers M., Rich G.M., Cook S., Ulick S., Lalouel J.M. A chimaeric 11 beta-hydroxylase/aldosterone synthase gene causes glucocorticoid-remediable aldosteronism and human hypertension. Nature. 1992;355:262–265. doi: 10.1038/355262a0. [DOI] [PubMed] [Google Scholar]
- 56.Manolio T.A., Collins F.S., Cox N.J., Goldstein D.B., Hindorff L.A., Hunter D.J., McCarthy M.I., Ramos E.M., Cardon L.R., Chakravarti A. Finding the missing heritability of complex diseases. Nature. 2009;461:747–753. doi: 10.1038/nature08494. [DOI] [PMC free article] [PubMed] [Google Scholar]
- 57.Eichler E.E., Flint J., Gibson G., Kong A., Leal S.M., Moore J.H., Nadeau J.H. Missing heritability and strategies for finding the underlying causes of complex disease. Nat. Rev. Genet. 2010;11:446–450. doi: 10.1038/nrg2809. [DOI] [PMC free article] [PubMed] [Google Scholar]
- 58.Lehrman M.A., Schneider W.J., Südhof T.C., Brown M.S., Goldstein J.L., Russell D.W. Mutation in LDL receptor: Alu-Alu recombination deletes exons encoding transmembrane and cytoplasmic domains. Science. 1985;227:140–146. doi: 10.1126/science.3155573. [DOI] [PMC free article] [PubMed] [Google Scholar]
- 59.Blair D.R., Lyttle C.S., Mortensen J.M., Bearden C.F., Jensen A.B., Khiabanian H., Melamed R., Rabadan R., Bernstam E.V., Brunak S. A nondegenerate code of deleterious variants in Mendelian loci contributes to complex disease risk. Cell. 2013;155:70–80. doi: 10.1016/j.cell.2013.08.030. [DOI] [PMC free article] [PubMed] [Google Scholar]
- 60.Harper A.R., Topol E.J. Pharmacogenomics in clinical practice and drug development. Nat. Biotechnol. 2012;30:1117–1124. doi: 10.1038/nbt.2424. [DOI] [PMC free article] [PubMed] [Google Scholar]
- 61.Food and Drug Administration (2004). Challenges and Opportunities Report, Department of Health and Human Services. March 2004, http://www.fda.gov/ScienceResearch/SpecialTopics/CriticalPathInitiative/CriticalPathOpportunitiesReports/ucm077262.htm.
- 62.Garcia M.L., Kaczorowski G.J. Targeting the inward-rectifier potassium channel ROMK in cardiovascular disease. Curr. Opin. Pharmacol. 2014;15:1–6. doi: 10.1016/j.coph.2013.11.005. [DOI] [PubMed] [Google Scholar]
- 63.Ramsey B.W., Davies J., McElvaney N.G., Tullis E., Bell S.C., Dřevínek P., Griese M., McKone E.F., Wainwright C.E., Konstan M.W., VX08-770-102 Study Group A CFTR potentiator in patients with cystic fibrosis and the G551D mutation. N. Engl. J. Med. 2011;365:1663–1672. doi: 10.1056/NEJMoa1105185. [DOI] [PMC free article] [PubMed] [Google Scholar]
- 64.Herring W.J., Connor K.M., Ivgy-May N., Snyder E., Liu K., Snavely D.B., Krystal A.D., Walsh J.K., Benca R.M., Rosenberg R. Suvorexant in Patients with Insomnia: Results from Two 3-Month Randomized Controlled Clinical Trials. Biol. Psychiatry. 2014 doi: 10.1016/j.biopsych.2014.10.003. Published online October 23, 2014. [DOI] [PubMed] [Google Scholar]
- 65.Hilpert H., Guba W., Woltering T.J., Wostl W., Pinard E., Mauser H., Mayweg A.V., Rogers-Evans M., Humm R., Krummenacher D. β-Secretase (BACE1) inhibitors with high in vivo efficacy suitable for clinical evaluation in Alzheimer’s disease. J. Med. Chem. 2013;56:3980–3995. doi: 10.1021/jm400225m. [DOI] [PubMed] [Google Scholar]
- 66.Stein E.A., Mellis S., Yancopoulos G.D., Stahl N., Logan D., Smith W.B., Lisbon E., Gutierrez M., Webb C., Wu R. Effect of a monoclonal antibody to PCSK9 on LDL cholesterol. N. Engl. J. Med. 2012;366:1108–1118. doi: 10.1056/NEJMoa1105803. [DOI] [PubMed] [Google Scholar]
- 67.Collins F.S., Varmus H. A new initiative on precision medicine. N. Engl. J. Med. 2015;372:793–795. doi: 10.1056/NEJMp1500523. [DOI] [PMC free article] [PubMed] [Google Scholar]
- 68.Collins F.S. Positional cloning moves from perditional to traditional. Nat. Genet. 1995;9:347–350. doi: 10.1038/ng0495-347. [DOI] [PubMed] [Google Scholar]
- 69.Brunham L.R., Hayden M.R. Hunting human disease genes: lessons from the past, challenges for the future. Hum. Genet. 2013;132:603–617. doi: 10.1007/s00439-013-1286-3. [DOI] [PMC free article] [PubMed] [Google Scholar]
- 70.Ng S.B., Bigham A.W., Buckingham K.J., Hannibal M.C., McMillin M.J., Gildersleeve H.I., Beck A.E., Tabor H.K., Cooper G.M., Mefford H.C. Exome sequencing identifies MLL2 mutations as a cause of Kabuki syndrome. Nat. Genet. 2010;42:790–793. doi: 10.1038/ng.646. [DOI] [PMC free article] [PubMed] [Google Scholar]
- 71.Lupski J.R., Reid J.G., Gonzaga-Jauregui C., Rio Deiros D., Chen D.C., Nazareth L., Bainbridge M., Dinh H., Jing C., Wheeler D.A. Whole-genome sequencing in a patient with Charcot-Marie-Tooth neuropathy. N. Engl. J. Med. 2010;362:1181–1191. doi: 10.1056/NEJMoa0908094. [DOI] [PMC free article] [PubMed] [Google Scholar]
- 72.Lindhurst M.J., Sapp J.C., Teer J.K., Johnston J.J., Finn E.M., Peters K., Turner J., Cannons J.L., Bick D., Blakemore L. A mosaic activating mutation in AKT1 associated with the Proteus syndrome. N. Engl. J. Med. 2011;365:611–619. doi: 10.1056/NEJMoa1104017. [DOI] [PMC free article] [PubMed] [Google Scholar]
- 73.Veltman J.A., Brunner H.G. De novo mutations in human genetic disease. Nat. Rev. Genet. 2012;13:565–575. doi: 10.1038/nrg3241. [DOI] [PubMed] [Google Scholar]
- 74.Ng B.G., Buckingham K.J., Raymond K., Kircher M., Turner E.H., He M., Smith J.D., Eroshkin A., Szybowska M., Losfeld M.E., University of Washington Center for Mendelian Genomics Mosaicism of the UDP-galactose transporter SLC35A2 causes a congenital disorder of glycosylation. Am. J. Hum. Genet. 2013;92:632–636. doi: 10.1016/j.ajhg.2013.03.012. [DOI] [PMC free article] [PubMed] [Google Scholar]
- 75.Rivière J.B., Mirzaa G.M., O’Roak B.J., Beddaoui M., Alcantara D., Conway R.L., St-Onge J., Schwartzentruber J.A., Gripp K.W., Nikkel S.M., Finding of Rare Disease Genes (FORGE) Canada Consortium De novo germline and postzygotic mutations in AKT3, PIK3R2 and PIK3CA cause a spectrum of related megalencephaly syndromes. Nat. Genet. 2012;44:934–940. doi: 10.1038/ng.2331. [DOI] [PMC free article] [PubMed] [Google Scholar]
- 76.Beaulieu C.L., Majewski J., Schwartzentruber J., Samuels M.E., Fernandez B.A., Bernier F.P., Brudno M., Knoppers B., Marcadier J., Dyment D., FORGE Canada Consortium FORGE Canada Consortium: outcomes of a 2-year national rare-disease gene-discovery project. Am. J. Hum. Genet. 2014;94:809–817. doi: 10.1016/j.ajhg.2014.05.003. [DOI] [PMC free article] [PubMed] [Google Scholar]
- 77.Bamshad M.J., Shendure J.A., Valle D., Hamosh A., Lupski J.R., Gibbs R.A., Boerwinkle E., Lifton R.P., Gerstein M., Gunel M., Centers for Mendelian Genomics The Centers for Mendelian Genomics: a new large-scale initiative to identify the genes underlying rare Mendelian conditions. Am. J. Med. Genet. A. 2012;158A:1523–1525. doi: 10.1002/ajmg.a.35470. [DOI] [PMC free article] [PubMed] [Google Scholar]
- 78.Wright C.F., Fitzgerald T.W., Jones W.D., Clayton S., McRae J.F., van Kogelenberg M., King D.A., Ambridge K., Barrett D.M., Bayzetinova T., DDD study Genetic diagnosis of developmental disorders in the DDD study: a scalable analysis of genome-wide research data. Lancet. 2015;385:1305–1314. doi: 10.1016/S0140-6736(14)61705-0. [DOI] [PMC free article] [PubMed] [Google Scholar]
- 79.Ng S.B., Nickerson D.A., Bamshad M.J., Shendure J. Massively parallel sequencing and rare disease. Hum. Mol. Genet. 2010;19(R2):R119–R124. doi: 10.1093/hmg/ddq390. [DOI] [PMC free article] [PubMed] [Google Scholar]
- 80.Sobreira N., Schiettecatte F., Boehm C., Valle D., Hamosh A. New tools for Mendelian disease gene identification: PhenoDB variant analysis module; and GeneMatcher, a web-based tool for linking investigators with an interest in the same gene. Hum. Mutat. 2015;36:425–431. doi: 10.1002/humu.22769. [DOI] [PMC free article] [PubMed] [Google Scholar]
- 81.MacArthur D.G., Manolio T.A., Dimmock D.P., Rehm H.L., Shendure J., Abecasis G.R., Adams D.R., Altman R.B., Antonarakis S.E., Ashley E.A. Guidelines for investigating causality of sequence variants in human disease. Nature. 2014;508:469–476. doi: 10.1038/nature13127. [DOI] [PMC free article] [PubMed] [Google Scholar]
- 82.Casanova J.L., Conley M.E., Seligman S.J., Abel L., Notarangelo L.D. Guidelines for genetic studies in single patients: lessons from primary immunodeficiencies. J. Exp. Med. 2014;211:2137–2149. doi: 10.1084/jem.20140520. [DOI] [PMC free article] [PubMed] [Google Scholar]
- 83.Alazami A.M., Patel N., Shamseldin H.E., Anazi S., Al-Dosari M.S., Alzahrani F., Hijazi H., Alshammari M., Aldahmesh M.A., Salih M.A. Accelerating novel candidate gene discovery in neurogenetic disorders via whole-exome sequencing of prescreened multiplex consanguineous families. Cell Rep. 2015;10:148–161. doi: 10.1016/j.celrep.2014.12.015. [DOI] [PubMed] [Google Scholar]
- 84.Rehman A.U., Santos-Cortez R.L., Drummond M.C., Shahzad M., Lee K., Morell R.J., Ansar M., Jan A., Wang X., Aziz A., University of Washington Center for Mendelian Genomics Challenges and solutions for gene identification in the presence of familial locus heterogeneity. Eur. J. Hum. Genet. 2014 doi: 10.1038/ejhg.2014.266. Published online December 10, 2014. [DOI] [PMC free article] [PubMed] [Google Scholar]
- 85.Wangler M.F., Gonzaga-Jauregui C., Gambin T., Penney S., Moss T., Chopra A., Probst F.J., Xia F., Yang Y., Werlin S., Baylor-Hopkins Center for Mendelian Genomics Heterozygous de novo and inherited mutations in the smooth muscle actin (ACTG2) gene underlie megacystis-microcolon-intestinal hypoperistalsis syndrome. PLoS Genet. 2014;10:e1004258. doi: 10.1371/journal.pgen.1004258. [DOI] [PMC free article] [PubMed] [Google Scholar]
- 86.Smith J.D., Hing A.V., Clarke C.M., Johnson N.M., Perez F.A., Park S.S., Horst J.A., Mecham B., Maves L., Nickerson D.A., Cunningham M.L., University of Washington Center for Mendelian Genomics Exome sequencing identifies a recurrent de novo ZSWIM6 mutation associated with acromelic frontonasal dysostosis. Am. J. Hum. Genet. 2014;95:235–240. doi: 10.1016/j.ajhg.2014.07.008. [DOI] [PMC free article] [PubMed] [Google Scholar]
- 87.McMillin M.J., Beck A.E., Chong J.X., Shively K.M., Buckingham K.J., Gildersleeve H.I., Aracena M.I., Aylsworth A.S., Bitoun P., Carey J.C., University of Washington Center for Mendelian Genomics Mutations in PIEZO2 cause Gordon syndrome, Marden-Walker syndrome, and distal arthrogryposis type 5. Am. J. Hum. Genet. 2014;94:734–744. doi: 10.1016/j.ajhg.2014.03.015. [DOI] [PMC free article] [PubMed] [Google Scholar]
- 88.Glessner J.T., Bick A.G., Ito K., Homsy J.G., Rodriguez-Murillo L., Fromer M., Mazaika E., Vardarajan B., Italia M., Leipzig J. Increased frequency of de novo copy number variants in congenital heart disease by integrative analysis of single nucleotide polymorphism array and exome sequence data. Circ. Res. 2014;115:884–896. doi: 10.1161/CIRCRESAHA.115.304458. [DOI] [PMC free article] [PubMed] [Google Scholar]
- 89.Zaidi S., Choi M., Wakimoto H., Ma L., Jiang J., Overton J.D., Romano-Adesman A., Bjornson R.D., Breitbart R.E., Brown K.K. De novo mutations in histone-modifying genes in congenital heart disease. Nature. 2013;498:220–223. doi: 10.1038/nature12141. [DOI] [PMC free article] [PubMed] [Google Scholar]
- 90.Yu L., Bennett J.T., Wynn J., Carvill G.L., Cheung Y.H., Shen Y., Mychaliska G.B., Azarow K.S., Crombleholme T.M., Chung D.H., University of Washington Center for Mendelian Genomics Whole exome sequencing identifies de novo mutations in GATA6 associated with congenital diaphragmatic hernia. J. Med. Genet. 2014;51:197–202. doi: 10.1136/jmedgenet-2013-101989. [DOI] [PMC free article] [PubMed] [Google Scholar]
- 91.Lemmers R.J., Tawil R., Petek L.M., Balog J., Block G.J., Santen G.W., Amell A.M., van der Vliet P.J., Almomani R., Straasheijm K.R. Digenic inheritance of an SMCHD1 mutation and an FSHD-permissive D4Z4 allele causes facioscapulohumeral muscular dystrophy type 2. Nat. Genet. 2012;44:1370–1374. doi: 10.1038/ng.2454. [DOI] [PMC free article] [PubMed] [Google Scholar]
- 92.Rainger J., Pehlivan D., Johansson S., Bengani H., Sanchez-Pulido L., Williamson K.A., Ture M., Barker H., Rosendahl K., Spranger J., UK10K. Baylor-Hopkins Center for Mendelian Genomics Monoallelic and biallelic mutations in MAB21L2 cause a spectrum of major eye malformations. Am. J. Hum. Genet. 2014;94:915–923. doi: 10.1016/j.ajhg.2014.05.005. [DOI] [PMC free article] [PubMed] [Google Scholar]
- 93.Al-Sayed M.D., Al-Zaidan H., Albakheet A., Hakami H., Kenana R., Al-Yafee Y., Al-Dosary M., Qari A., Al-Sheddi T., Al-Muheiza M. Mutations in NALCN cause an autosomal-recessive syndrome with severe hypotonia, speech impairment, and cognitive delay. Am. J. Hum. Genet. 2013;93:721–726. doi: 10.1016/j.ajhg.2013.08.001. [DOI] [PMC free article] [PubMed] [Google Scholar]
- 94.Chong J.X., McMillin M.J., Shively K.M., Beck A.E., Marvin C.T., Armenteros J.R., Buckingham K.J., Nkinsi N.T., Boyle E.A., Berry M.N., University of Washington Center for Mendelian Genomics De novo mutations in NALCN cause a syndrome characterized by congenital contractures of the limbs and face, hypotonia, and developmental delay. Am. J. Hum. Genet. 2015;96:462–473. doi: 10.1016/j.ajhg.2015.01.003. [DOI] [PMC free article] [PubMed] [Google Scholar]
- 95.Kirby A., Gnirke A., Jaffe D.B., Barešová V., Pochet N., Blumenstiel B., Ye C., Aird D., Stevens C., Robinson J.T. Mutations causing medullary cystic kidney disease type 1 lie in a large VNTR in MUC1 missed by massively parallel sequencing. Nat. Genet. 2013;45:299–303. doi: 10.1038/ng.2543. [DOI] [PMC free article] [PubMed] [Google Scholar]
- 96.Taylor J.C., Martin H.C., Lise S., Broxholme J., Cazier J.B., Rimmer A., Kanapin A., Lunter G., Fiddy S., Allan C. Factors influencing success of clinical genome sequencing across a broad spectrum of disorders. Nat. Genet. 2015 doi: 10.1038/ng.3304. Published online May 18, 2015. [DOI] [PMC free article] [PubMed] [Google Scholar]
- 97.Samocha K.E., Robinson E.B., Sanders S.J., Stevens C., Sabo A., McGrath L.M., Kosmicki J.A., Rehnström K., Mallick S., Kirby A. A framework for the interpretation of de novo mutation in human disease. Nat. Genet. 2014;46:944–950. doi: 10.1038/ng.3050. [DOI] [PMC free article] [PubMed] [Google Scholar]
- 98.Kircher M., Witten D.M., Jain P., O’Roak B.J., Cooper G.M., Shendure J. A general framework for estimating the relative pathogenicity of human genetic variants. Nat. Genet. 2014;46:310–315. doi: 10.1038/ng.2892. [DOI] [PMC free article] [PubMed] [Google Scholar]
- 99.Lee H., Deignan J.L., Dorrani N., Strom S.P., Kantarci S., Quintero-Rivera F., Das K., Toy T., Harry B., Yourshaw M. Clinical exome sequencing for genetic identification of rare Mendelian disorders. JAMA. 2014;312:1880–1887. doi: 10.1001/jama.2014.14604. [DOI] [PMC free article] [PubMed] [Google Scholar]
- 100.Rosenblatt D.S. A RaDiCAL approach to gene discovery. J. Med. Genet. 2011;48:577–578. doi: 10.1136/jmedgenet-2011-100227. [DOI] [PubMed] [Google Scholar]
- 101.A bubble popper. Nat. Genet. 2013;45:1411. doi: 10.1038/ng.2845. [DOI] [PubMed] [Google Scholar]
- 102.Hamosh A., Sobreira N., Hoover-Fong J., Sutton V.R., Boehm C., Schiettecatte F., Valle D. PhenoDB: a new web-based tool for the collection, storage, and analysis of phenotypic features. Hum. Mutat. 2013;34:566–571. doi: 10.1002/humu.22283. [DOI] [PMC free article] [PubMed] [Google Scholar]
- 103.Staples J., Qiao D., Cho M.H., Silverman E.K., Nickerson D.A., Below J.E., University of Washington Center for Mendelian Genomics PRIMUS: rapid reconstruction of pedigrees from genome-wide estimates of identity by descent. Am. J. Hum. Genet. 2014;95:553–564. doi: 10.1016/j.ajhg.2014.10.005. [DOI] [PMC free article] [PubMed] [Google Scholar]
- 104.Wang G.T., Peng B., Leal S.M. Variant association tools for quality control and analysis of large-scale sequence and genotyping array data. Am. J. Hum. Genet. 2014;94:770–783. doi: 10.1016/j.ajhg.2014.04.004. [DOI] [PMC free article] [PubMed] [Google Scholar]
- 105.Khurana E., Fu Y., Colonna V., Mu X.J., Kang H.M., Lappalainen T., Sboner A., Lochovsky L., Chen J., Harmanci A., 1000 Genomes Project Consortium Integrative annotation of variants from 1092 humans: application to cancer genomics. Science. 2013;342:1235587. doi: 10.1126/science.1235587. [DOI] [PMC free article] [PubMed] [Google Scholar]
Associated Data
This section collects any data citations, data availability statements, or supplementary materials included in this article.
Supplementary Materials
Document S1. Figures S1 and S2, Tables S1–S4, and Supplemental Material and Methods
Document S2. Article plus Supplemental Data