Locus coeruleus and dopaminergic consolidation of everyday memory (original) (raw)
. Author manuscript; available in PMC: 2017 Mar 7.
Published in final edited form as: Nature. 2016 Sep 7;537(7620):357–362. doi: 10.1038/nature19325
Summary
The retention of episodic-like memory is enhanced, in humans and animals, when something novel happens shortly before or after encoding. Using an everyday memory task in mice, we sought the neurons mediating this dopamine-dependent novelty effect, previously thought to originate exclusively from the tyrosine hydroxylase-expressing (TH+) neurons in the ventral tegmental area (VTA). We report that neuronal firing in the locus coeruleus (LC) is especially sensitive to environmental novelty, LC-TH+ neurons project more profusely than VTA-TH+ neurons to the hippocampus, optogenetic activation of LC-TH+ neurons mimics the novelty effect, and this novelty-associated memory enhancement is unaffected by VTA inactivation. Surprisingly, two effects of LC-TH+ photoactivation are sensitive to hippocampal D1/D5 receptor blockade and resistant to adrenoceptors blockade – memory enhancement and long lasting potentiation of synaptic transmission in CA1 ex vivo. Thus, LC-TH+ neurons can mediate post-encoding memory enhancement in a manner consistent with possible co-release of dopamine in hippocampus.
Numerous studies of memory, for over a century1, have established that there is substantial forgetting within a day2. Everyday memory includes many episodic-like memories that we may form automatically3,4. Important memory traces may be retained for longer, indeed for sufficiently longer that they can then be subject to stabilisation in the neocortex via systems consolidation5,6. Selective stabilisation can occur when something novel or categorically relevant happens shortly before or after the time of memory encoding, sometimes called ‘flashbulb memory’7,8. Prospective studies of novelty-associated enhancement of memory persistence in animals point to possible mechanisms9–14, with one suggestion being that a novelty signal from VTA to the hippocampus is causally important15,16. Pharmacological studies of protein synthesis-dependent long-term potentiation (LTP) and long-term depression support the concept of dopamine (DA)-dependent enhancement of persistence13,17–19, but do not identify the neuronal source of DA. We anticipated that VTA-TH+ neurons would be critical, but the possibility that LC-TH+ neurons can sometimes release DA as well as noradrenaline (NA)20–22 led to our broadening of the project to include LC-TH+ as well as VTA-TH+ neurons.
Novelty enhances memory persistence
We used 120 mice and began by checking that the enhancement of memory retention by environmental novelty, previously shown in rats12,13, could also be observed in mice. This testing deployed our ‘everyday’ memory task that is a model for ‘episodic-like’ or ‘one-shot’ memory23. We created a smaller arena for mice who searched for food reward in one of 23 different sandwells whose location varied across days (Figs. 1a, S1a). Male tyrosine hydroxylase-Cre (Th-Cre) mice were trained to encode the changing daily location of reward in ‘sample’ trials, displaying effective memory in later daily ‘choice’ trials (with 5 sandwells). The data plotted as a 5-alternative forced-choice performance index revealing stable choice performance (circa 80%) across weeks of testing (Figs. 1a, S1b,c). A control test (sessions 61–65) established the absence of olfactory artefacts. Daily memory was tested using a counterbalanced series of unrewarded probe tests (PTs) that only occasionally followed the daily sample trial(s) at different times. Reward availability on sample trials (memory encoding) was varied (low and high reward). Effective memory at 1 h (memory retrieval) was displayed in PTs for even the smallest reward (Fig. 1b), but forgetting across 24 h showed an inverse relationship with reward magnitude (Figs. 1b, S1d). A key finding was that unexpected environmental novelty for 5 min – exploration of a box with unfamiliar floor surfaces placed inside the event arena 30 min after the encoding trial prolonged spatial memory to 24 h (Fig. 1b). This post-encoding novelty was environmental and not a change in reward expectancy.
Figure 1. Novelty exploration after memory encoding enhances memory retention.
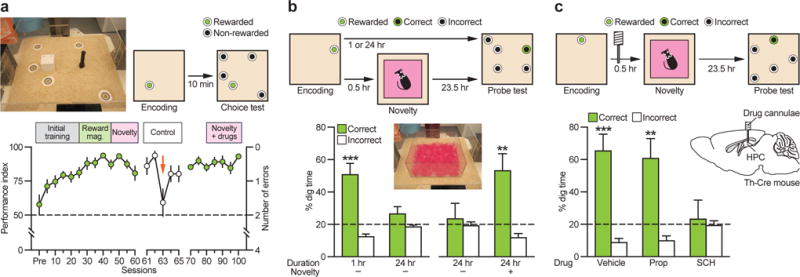
a, Everyday spatial memory task in event arena. Mice [_n_=13; 100 sessions (Ss)) learned and maintained stable performance (S25–S100: _F_14,168=1.68, _P_>0.05). Non-encoding control session performance(S63, orange arrow) dropped to 59.6% (S61–S65: _F_4,48=3.63, P<0.05; S63: _t_-test vs. chance, _t_12<1). Green circles, 5S average; white circles, 1S average; Pre, pre-training. **b**, Memory persistence (probe tests) declined from memory at 1h to chance at 24h (1h vs. 24h: _t_12=2.94, _P_<0.05; 1h: _t_12=4.44, _P_<0.001; 24h: _t_12=1.42, _P_>0.05). Novelty 30 min after encoding resulted in memory at 24h (No novelty vs. Novelty: _t_12=2.24, P<0.05; Novelty: _t_12=3.17, P<0.01). c, Blockade of hippocampal D1/D5 receptor (SCH) but not β-adrenoceptors (Prop) during novelty abolished 24h memory (_F_2,24=3.83, P<0.05; Vehicle: _t_12=4.38, P<0.001; Prop: _t_12=3.33, P<0.01). HPC, hippocampus; Prop, propranolol; SCH, SCH23390. **P<0.01, ***P<0.001 vs. chance. Dashed lines=chance level. Means±s.e.m.
Memory retention in this task is selectively impaired by pharmacological interventions targeting D1/D5 receptor in hippocampus in rats13 and in our mice with the β-adrenoceptor antagonist propranolol (Prop) during environmental novelty being without effect, whereas the D1/D5 receptor antagonist SCH23390 (SCH) blocked novelty-induced enhancement of memory persistence (Figs. 1c, S1e). However, the mechanism by which reward and environmental novelty modulate memory retention may be distinct.
TH+ neurons show a novelty response
The next step was to identify whether TH+ neurons are activated by environmental novelty. Th-Cre mice were given stereotaxic injections of a Cre-inducible adeno-associated virus (AAV) carrying Channelrhodopsin-2 (ChR2) fused to enhanced yellow fluorescent protein (eYFP) into the VTA or LC (Figs. 2a, S2) and implanted with an ‘optetrode’ microdrive. Several weeks later, brief low frequency blue light illumination was used to identify ChR2-eYFP-positive neurons in awake mice. TH+ neurons were identified (Figs. 2a; S3a, b), and recording then continued without light pulses as the mice explored both familiar (visited regularly) and novel chambers (visited rarely, and each time with a novel floor surface) for 5 min in a counterbalanced sequence (Fig. 2b). Raster plots of representative cases show novelty affected light-responsive neurons within both structures (Fig. 2c), with increased firing rates in most identified VTA-TH+ (12/15 neurons recorded) and all LC-TH+ (10/10) neurons (Fig. 2d). Firing rate modulation was not only quantitatively larger for LC-TH+ neurons, but also a clear increase from their usual tonic firing rate24 and habituated monotonically over time (Figs. 2e, S3c; Ref25). Both VTA-TH+ and LC-TH+ neurons showed a higher occurrence of bursts in novel environments (Fig. S3d), with a within-burst spike frequency of 12.8 to 53.4 Hz (Fig. S3e). This bursting pattern in both VTA and LC was intentionally used to determine an effective optogenetic stimulation protocol for both in vivo and ex vivo experiments.
Figure 2. LC-TH+ neurons show stronger modulation by novelty than VTA-TH+ neurons.
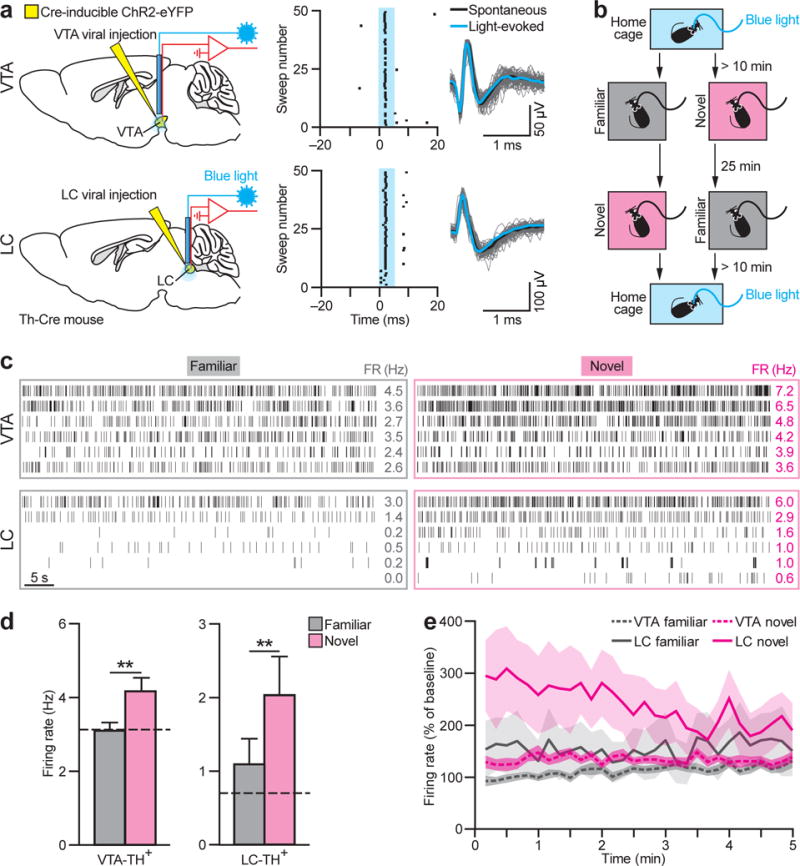
a, Viral injection and optetrode implantation. Putative VTA-TH+ and LC-TH+ neurons responded to blue light (blue). b, Behavioural protocol. c, Raster plot of VTA-TH+ (top) and LC-TH+ neurons (bottom) in familiar (left) and novel (right) environments. FR, mean firing rate. d, Firing rates of VTA-TH+ (_n_=15 neurons from 5 mice) and LC-TH+ (_n_=10 neurons from 3 mice) neurons were higher in the novel environment (VTA-TH+: _t_14=4.31, P<0.01; LC-TH+: _t_9=3.45, _P_<0.01). Dashed lines=baseline. **e**, LC-TH+ neurons showed stronger modulation by novelty than VTA-TH+ neurons (Brain Area×Condition interaction, _F_29,667=2.28, _P_<0.001). LC-TH+ but not VTA-TH+ neurons displayed habituation to novelty (Brain Area×Condition×Time interaction, _F_29,667=2.03, _P_<0.01; main effect of Time for LC novel, _F_29,261=1.70, _P_<0.05; for VTA novel, _F_29,406=1.24, _P_>0.05). **P<0.01, paired _t_-test. Means±s.e.m.
LC projects extensively to hippocampus
Previous retrograde tracing and immunohistochemical work in the rat has estimated that only a subset of VTA afferents to the hippocampus are dopaminergic26. Focusing on TH+ neurons in mice, anatomical tract tracing revealed substantial projections from LC-TH+ neurons to the dorsal hippocampus, but a paucity of such projections from VTA-TH+ neurons (Figs. 3, S5). Cell-type specific anterograde tracing involved unilateral injection of a Cre-inducible eYFP virus into VTA or LC of Th-Cre mice (Fig. 3a–f). Most TH+ neurons in VTA and LC expressed eYFP (Fig. S2g). We first established co-localisation of TH in eYFP+ axons in the dorsal hippocampus (Fig. 3b, d – top panels), and then co-localisation of eYFP, TH and the noradrenergic transporter (NET) for LC- but not VTA-axons (Figs. 3b, d – bottom panels; see also Fig. S4). We identified and quantified eYFP+ axons projecting to the hippocampus, calculating both the area occupied by all eYFP-TH double-positive axons (Fig. 3e) and the ratio of double-positive axons relative to all TH+ axons (Fig. 3f). The data showed an overwhelmingly larger proportion of axons from LC-TH+ neurons with very few from VTA-TH+ neurons (see also Ref21 and Fig. S7a). Retrograde tracing involved injecting fluorescent retrobeads into the dorsal hippocampus and examining retrograde transport to VTA (Fig. S5a, b) or LC (Fig. S5c, d). Double-labelled neurons (retrobeads and TH-positivity) were specific to LC.
Figure 3. TH+ axons in the hippocampus originate from LC-TH+ neurons.
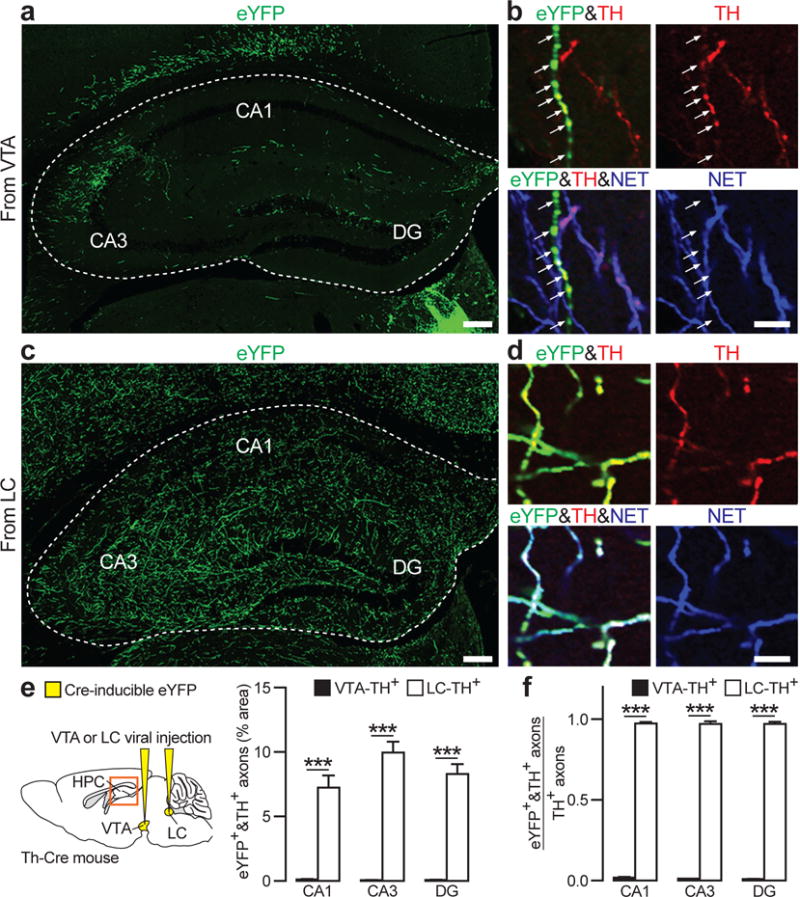
a–d, Representative coronal sections show overall distribution of eYFP+ axons from VTA (a) and LC (c) in dorsal hippocampus. Triple immunofluorescence for eYFP (green), TH (red) and NET (blue) shows co-labelling of eYFP+ VTA axons with TH (b, top) but not with NET (b, bottom; arrows), co-labelling of eYFP+ LC axons with TH (d, top) and NET (d, bottom). e, f, Quantification of area occupied by eYFP and TH double-positive axons (e), and the ratio of eYFP and TH double-positive axons relative to all TH+ axons (f) in CA1, CA3, and DG (_n_=9 slices from 3 mice/group). Both measures indicate stronger TH+ projections from LC than from VTA in CA1 (Area: _t_16=7.4, P<0.001; Ratio: _t_16=104.1, P<0.001), CA3 (Area: _t_16=11.7, P<0.001; Ratio: _t_16=59.0, P<0.001) and DG (Area: _t_16=10.8, P<0.001; Ratio: _t_16=76.4, P<0.001). ***P<0.001, paired _t_-test. Means±s.e.m.
LC activation mimics the novelty effect
The overarching aim of this project was to identify neuromodulatory neurons whose firing promotes the consolidation of hippocampal-dependent memory. While we had originally planned to examine VTA-TH+ neurons, our data so far pointed to the need to change our focus to LC-TH+ neurons as likely mediators of environmental novelty. An optimum optogenetic burst stimulation frequency of 25 Hz was chosen (Fig. 4b) based on our within-burst firing data (Fig. S3e); both LC-TH+ and VTA-TH+ neurons could follow this frequency in awake mice (Fig. S6a). Th-Cre mice were stereotaxically prepared with bilateral injections of Cre-inducible ChR2-eYFP virus (ChR2+) or a no opsin control (eYFP) virus (ChR2−) followed by implantation of bilateral optic cannulae into both LC and VTA and bilateral drug cannulae targeting the dorsal hippocampus (Fig. 4a). These animals were trained on the ‘everyday’ memory task until they were performing with a performance index at circa 75%, and showed effective memory in a 10-min probe test (Fig. S6b, c). The stage was then set for examining whether 5 min optogenetic activation, scheduled 30 min after memory encoding in place of environmental novelty, could mimic its beneficial effects on memory retention (Fig. 4c).
Figure 4. Optogenetic activation of LC-TH+ neurons enhances memory persistence.
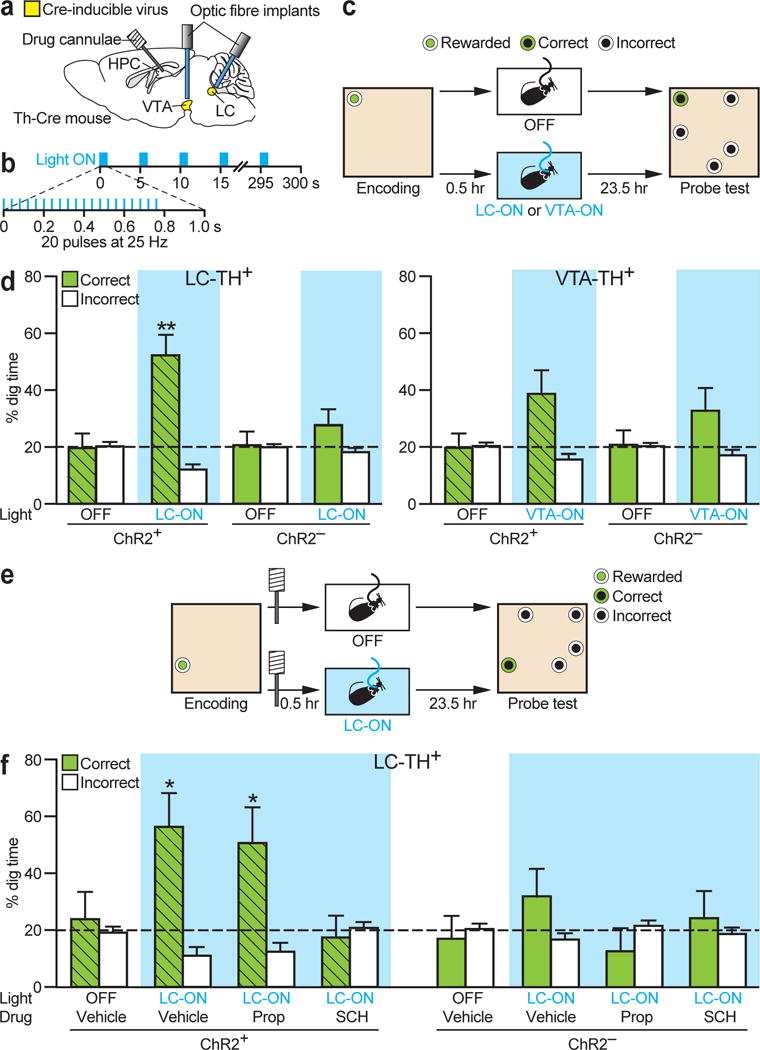
a, Viral injection, and optic fibre and drug cannulae implantations. Th-Cre mice were injected with a Cre-inducible ChR2-eYFP AAV (ChR2+, _n_=8) or a control eYFP AAV (ChR2−, _n_=6) into LC and VTA. b, Optogenetic burst protocol used in the event arena experiment. c, Design for the optogenetic mimicry experiment. d, Left, LC-TH+ neuron photostimulation (LC-ON) 30 min after encoding enhanced 24-h memory in ChR2+ animals but not in ChR2− controls (Group×Condition interaction, _F_1,12=5.66, P<0.05; ChR2+ in LC-ON vs. chance: _t_7=4.38, P<0.01). Right, VTA-TH+ neuron photostimulation (VTA-ON) caused a trend for enhanced memory that did not differ between groups (Group×Condition interaction, _F_1,12=0.33, _P_=0.58; ChR2+ in VTA-ON: _t_7=2.22, _P_=0.062; ChR2− in VTA-ON: _t_5=1.55, _P_=0.18). e, Design for the optogenetic LC activation experiment with pharmacological interventions. f, Blockade of hippocampal D1/D5 receptor (SCH) but not β-adrenoceptors (Prop) during LC-TH+ neuron photostimulation abolished the effect of LC photostimulation on memory persistence in ChR2+ mice (Group effect, _F_1,12=5.01, P<0.05; Condition effect in ChR2+, _F_3,21=3.18, P<0.05; in ChR2−: _F_3,15<1). ChR2+ mice showed good memory with post-encoding LC-ON in presence of vehicle or Prop, but not in presence of SCH or without light stimulation (Orthogonal comparisons, _F_3,21=9.23, P<0.01; LC-ON with Vehicle in ChR2+: _t_7=3.01, P<0.05; LC-ON with Prop in ChR2+: _t_7=2.41, P<0.05). Prop, propranolol; SCH, SCH23390. *P<0.05, **P<0.01 vs. chance. Dashed lines=chance level. Means±s.e.m.
The key finding of this study was the striking persistence of memory over 24 h when 5 min of intermittent burst stimulation of LC-TH+ neurons with blue light was given to the ChR2+ mice in their home cages (Fig. 4d). Tested 24 h after weak memory encoding, LC activated ChR2+ animals remembered the location of the sample sandwell sampled 30 min prior to light activation (Fig. 4d left; ChR2+ in LC-ON, 52.2% correct dig). Memory that lasted 24 h was not observed in these mice without LC light stimulation (ChR2+ in OFF), nor seen in separate ChR2− controls. Light-activation of VTA, in the same ChR2+ animals, brought about only a non-significant trend favouring some memory at 24 h, but we observed a similar trend in ChR2− mice (Fig. 4d right, compare ChR2+ and ChR2− in VTA-ON). Not only did these upwards trends not differ from chance, they also did not differ from each other, suggesting that the trend is unrelated to light-activation of ChR2-positive neurons in VTA (e.g. light-induced temperature changes27).
While compatible with our electrophysiological and anatomical observations on LC-TH+ neurons (Figs. 2 and 3), we were confronted by the paradox that light activation of LC enhances retention (Fig. 4d) but intrahippocampal infusion of a D1/D5 receptor antagonist during behavioural novelty blocks it (Fig. 1c). Accordingly, we examined the impact of post-encoding microinfusion of catecholaminergic antagonists into the hippocampus before optogenetic activation of LC (Fig. 4e). We confirmed that light activation of LC in ChR2+ mice enhanced 24-h spatial memory (Fig. 4f; ChR2+ in LC-ON with vehicle) whereas, in agreement with Fig. 1c, this effect was blocked by intrahippocampal D1/D5 receptor antagonist (ChR2+ in LC-ON with SCH) but not by β-adrenoceptor antagonist (ChR2+ in LC-ON with Prop; see also Fig. S6d). This raises the possibility of heterodimerization between NA and DA receptors or that LC-TH+ axons in the hippocampus may co-release DA.
LC activation enhances synaptic efficacy
To explore one possible mechanism of this enhancement of memory, we conducted ex vivo electrophysiological experiments to examine the response of CA1 pyramidal neurons in hippocampus to CA3 Schaffer collateral glutamatergic synaptic input (Fig. 5a). Three weeks prior to obtaining the slices, bilateral injections of Cre-inducible ChR2-eYFP virus were made into the LC of Th-Cre mice (Fig. S7a) in keeping with the recently described ‘output-defined elements’ concept28.
Figure 5. Optogenetic activation of LC-TH+ axons enhances hippocampal synaptic function.
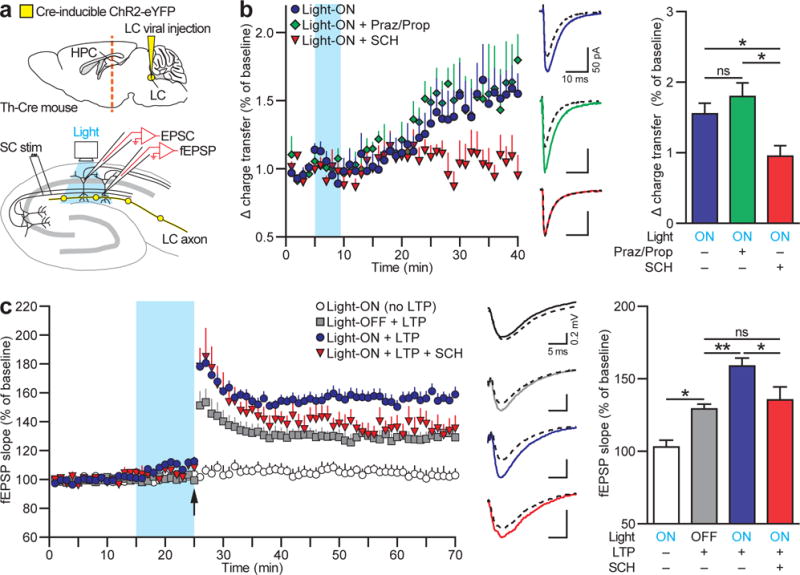
a, Hippocampal slice physiology. Orange line=hippocampal slice plane. b, Left, potentiation of Schaffer collateral (SC)-evoked EPSCs from CA1 pyramidal neurons after strong optogenetic activation (blue) of hippocampal LC-TH+ axons (Light-ON, _n_=5) is unaffected by adrenoceptor antagonists (Light-ON with Praz/Prop, _n_=4) but blocked by D1/D5 receptor antagonist (Light-ON with SCH, _n_=5) (Conditions×Time interaction, _F_7.8, 42.8=2.50, P<0.05, Greenhouse-Geisser correction). Middle, exemplar EPSCs from CA1 pyramidal neurons. Dashed lines=baseline EPSCs; Continuous=EPSCs 30–35 min after the optogenetic stimulation onset. Right, mean EPSCs 35 min after the optogenetic stimulation onset, showing effect of D1/D5 receptor antagonist (SCH) but no effect of adrenoceptor antagonists (Praz/Prop) (_F_2,11=6.38, _P_<0.05). **c**, Left, fEPSP responses to weak theta-burst stimulation (arrow) with or without optogenetic activation of hippocampal LC-TH+ axons (blue). No synaptic potentiation without theta-burst [Light-ON (no LTP), _n_=6], but with it, an increase in synaptic strength lasting > 45 min (Light-OFF + LTP, _n_=6) that was significantly enhanced by a weak physiologically relevant optogenetic stimulation of LC-TH+ axons (Light-ON + LTP, _n_=11). SCH blocked optogenetic enhancement of LTP (Light-ON + LTP with SCH, _n_=5) (Conditions×Time interaction, F19.6/156.7=2.93, P<0.001). Middle, fEPSPs: baseline (dashed lines) and 40–45 min after theta-burst stimulation (continuous lines). Right, mean fEPSP slopes 45 min after theta-burst stimulation, shows blockade of optogenetic augmentation of LTP by SCH (_F_3,24=16.99, P<0.001). Praz, prazosin; Prop, propranolol; SCH, SCH23390 or SCH39166 (see Methods). ns, not significant. *P<0.05, ***P<0.001, Tukey HSD test. Means±s.e.m.
Following three trains of burst optogenetic stimulation of hippocampal LC-TH+ axons (Fig. S7b), the CA3 to CA1 excitatory postsynaptic currents (EPSCs) measured using whole-cell recording gradually increased by 55% over ~30 min (Fig. 5b, Light-ON), an increase unaffected by the presence of the α- and β-adrenoceptors antagonists, prazosin (Praz) and propranolol (Prop) (Light-ON with Praz/Prop). In contrast, there was no increase of the EPSC following optogenetic LC-TH+ activation in the presence of D1/D5 receptor antagonists (Light-ON with SCH), revealing a pattern of EPSC potentiation consistent with mediation by a dopaminergic mechanism.
LTP at CA3 to CA1 synapses was then examined using theta-burst stimulation to induce LTP (see Methods). As in the optogenetic behavioural study (Fig. 4), hippocampal LC-TH+ axons were selectively activated with a protocol closely mimicking LC-TH+ firing patterns recorded during novelty exploration (Fig. S7c). LTP differed in magnitude across 4 conditions (Fig. 5c). Theta-burst stimulation alone induced LTP at 45 min of 29% (Light-OFF + LTP) relative to a no-LTP baseline [Light-ON (no LTP)]; this increased to 59% when combined with optogenetic LC-TH+ activation (Light-ON + LTP); but D1/D5 receptor antagonist blocked this augmentation (Light-ON + LTP with SCH). Taken together, these electrophysiological findings indicate that depolarisation of hippocampal LC-TH+ axons by optogenetic stimulation can enhance synaptic transmission, and that a physiologic-like pattern potentiates LTP at CA3-CA1 synapses in a manner consistent with release of DA from hippocampal LC-TH+ terminals.
VTA blockade has no impact on novelty effect
Last, we turned to attempting to block LC-TH+ neurons during novelty to see if memory enhancement disappeared. Acute electrophysiological studies showed that firing of LC-TH+ neurons expressing the membrane trafficking-enhanced variants of archaerhodopsin (eArch3.0)-eYFP could be successfully inhibited by green light over 5 min (Fig. S8). However, these TH+ neurons always displayed a substantial ‘rebound’ of firing when the light was turned off29. Were this rebound to occur in a behavioural study of memory, the rebound would likely overcome the earlier 5 min period of neuronal quiescence.
At this point, we already had the Th-Cre mice expressing eArch3.0-eYFP or eYFP in LC trained in the everyday memory task showing comparable levels of task performance to those of the earlier experiments (Fig. S9a, b), displaying within-day forgetting with low-reward encoding (Fig. 6c). While unable to use eArch3.0, we had the mice had bilateral drug cannulae targeting VTA. The sodium channel blocker lidocaine successfully inhibited VTA neuronal firing in separate acute electrophysiology experiments (Fig. 6a). We then examined the impact of intra-VTA infusion of lidocaine during novelty exploration (Figs. 6b and S9c). There was no effect, as we expected. It was then necessary to confirm that this novelty effect was sensitive a manipulation that inhibits LC neurons (but may have other effects), such as the α2-adrenoceptor agonist clonidine30 (and personal communication with O. Eschenko, MPI-Tuebingen). The mice were given a series of counterbalanced probe tests (Figs. 6c and S9c). One test showed normal forgetting over 24 h with low-reward encoding (No novelty with Vehicle), another the usual enhanced retention induced by environmental novelty (Novelty with Vehicle). Critically, systemic clonidine blocked the effect of novelty on 24 h memory retention (Novelty with Clonidine).
Figure 6. Pharmacological inhibition of VTA has no impact on the novelty effect.
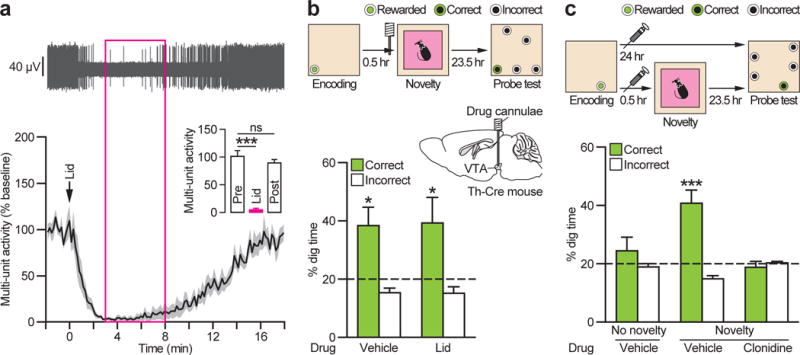
a, Microinfusion of lidocaine (Lid) into VTA blocks multi-unit activity (example trace and population data; _n_=8 traces/4 mice) (Pre vs. Lid: _t_7=8.42, P<0.001; Pre vs. Post: _t_7=1.42, _P_>0.05). Grey shading represents±s.e.m. Magenta box, novelty period. b, Lidocaine into the VTA before novelty had no effect on memory enhancement (_n_=15 mice) (Vehicle vs. Lid: _t_14<1, _P_>0.05; Vehicle vs. chance: _t_14=2.95, P<0.05; Lid: _t_14=2.19, P<0.05). c, Systemic injection of α2-adrenergic receptor agonist clonidine before novelty abolishes the novelty effect (_F_2,28=7.70, P<0.01; Novelty with Vehicle: _t_14=4.62, P<0.001). ns, not significant. *P<0.05, ***P<0.001. Dashed lines=chance level. Means±s.e.m.
Discussion
These experiments sought to identify neuromodulatory neurons that, in response to environmental novelty, trigger intracellular signal-transduction cascades within hippocampal neurons responsible for the initial consolidation of everyday memory15,31,32. Lisman and Grace15 proposed that a mediator of novelty-associated enhancement of hippocampal-dependent memory was a subiculum-accumbens-pallidal-VTA-CA1 pathway, an idea supported by both animal work and human studies33. Our data indicate, however, that VTA-TH+ neurons display weak anatomical connectivity with hippocampus, are only slightly activated by environmental novelty, and their pharmacological blockade during novelty has no effect on memory enhancement. In contrast, LC-TH+ neuronal firing is more responsive to environmental novelty and displays habituation of enhanced firing over 5 min. An overwhelming majority of hippocampal TH+ axons come from LC, and their post-encoding optogenetic activation successfully enhances memory retention. The drug clonidine that decreases neuronal activity in LC30, but not in VTA34, prevents this novelty effect. At the synaptic level ex vivo, selective optogenetic activation of LC-TH+ axons in hippocampus mediates a D1/D5 receptor-sensitive enhancement of synaptic transmission and of electrically evoked LTP at CA3-CA1 synapses, consistent with the idea that LC-TH+ neurons might co-release DA20,21. Transmitter co-release from substantia nigra (SN)/VTA-TH+ terminals, including glutamate and GABA, has been reported35,36. Lisman and his colleagues have modified their model to recognise this latter possibility37, rescuing DA receptor-dependence at the expense of recognising a different circuit for mediating the impact of environmental novelty on hippocampal memory.
Importantly, environmental novelty is different from changes in reward expectancy or magnitude. Reward expectancy is a critical component of the execution of learned actions until they become habitual38. Longstanding data point to the role of SN/VTA system in the processing of unexpected reward in striatal39–41 and hippocampal tasks42. VTA terminal activation can bidirectionally modulate CA3-CA1 synaptic responses ex vivo43, but in our in vivo study, post-encoding VTA-TH+ activation was without functional effect. Environmental novelty, in contrast to reward expectancy, is when something unexpected happens unrelated to reward during ongoing behaviour. It is likely to affect a distinct neuromodulatory system, but one with extensive connectivity to the hippocampus where it could activate processes including the synthesis and capture of plasticity-related proteins31. In this way, unexpected environmental novelty could enhance memory retention. The noradrenergic system of the LC, with its diverse projections to numerous brain areas44 has long been implicated in novelty, arousal and cognition24,45,46 and its firing is tied to distinct up and down states during sleep47. It appears that the time periods over which LC neurons exert their effects are much less precise than for VTA, in keeping with the synaptic tagging-and-capture hypothesis48–50. This idea has functional implications that extend well beyond the domain of LTP, affecting the retention of events via neural activity happening before and after the precise moment that encoding occurs, as in flashbulb memory7. In this and other ways, the retention of everyday experience is modulated over a period of time and not just at the precise moment that individual events are encoded.
Methods
Animals
The subjects were Th-Cre knock-in heterozygous male mice backcrossed more than 20 times to the C57BL/6 strain (Thtm1(cre)Te; EM:00254)51 (behavioural and anatomical studies, n = 71 mice), Th-Cre transgenic heterozygous male mice on a mixed C57BL/6 and CD1 background [Tg(Th-cre)1Tmd]52 (for ex vivo hippocampal electrophysiology, n = 42), and C57BL/6 male mice (Charles River; n = 7). They were > 8 weeks old at the start of the experiments, several of which continued for many months. All mice were given water ad libidum, kept under a 12 h light/dark cycle (lights on 7:00 am); given food ad libidum in unit recording studies but food-restricted for event arena training (85% of free-feeding weight monitored daily throughout the study, after behavioural training). Behavioural testing was carried out during the light phase of the cycle. All procedures were overseen by the University of Edinburgh Ethical Review Committee, compliant with the UK Animals (Scientific Procedures) Act 1986 and with the European Communities Council Directive of 24 November 1986 (86/609/EEC) legislation governing the maintenance of laboratory animals and their use in scientific experiments; and with guidelines of the Animal Welfare Committee of Hokkaido University; were approved by the animal care and use committee (IACUC) at the University of Texas Southwestern Medical Center and comply with federal regulations set forth by the National Institutes of Health.
Viral vectors
The Cre-inducible AAV were obtained from the University of North Carolina (UNC) Vector Core Facilities. The viral concentration was 8.0 × 10¹² particles ml−1 for AAV5/EF1a-DIO-hChR2(H134R)-eYFP (ChR2-eYFP), 3.2 × 10¹² particles ml−1 for AAV5/EF1a-DIO-eArch3.0-eYFP (eArch3.0-eYFP), 4.0 × 10¹² particles ml−1 for AAV5/EF1a-DIO-eNpHR3.0-eYFP (eNpHR3.0-eYFP), 4.0 × 10¹² particles ml−1 for AAV5/EF1a-DIO-eYFP (eYFP control), and 1–7 × 10¹² particles ml−1 for AAV2/EF1a-DIO-hChR2(H134R)-eYFP (for ex vivo hippocampal electrophysiology). Virus were subdivided into aliquots stored at −80°C until use.
Stereotactic surgery
Anaesthesia was induced using isoflurane (induction, 5%; maintenance, 1–2%; air-flow, 1 l min−1). The animals were placed in the stereotactic frame (Kopf Instruments). For viral or retrobead (Lumafluor) injection, a small hole was drilled into the skull over the target site. The virus (0.75–1 μl) or retrobead solution (0.1 μl) was then injected at 0.1 μl min−1 into the target site using a Nanofil syringe (WPI) and UMP3 pump (WPI) mounted directly on the stereotactic frame. After injection, a needle of the syringe was left for 10 min to reduce back-flow and then withdrawn slowly. Animals recovered on a heating pad until normal behaviour resumed. All experiments involving viral constructs were performed at least 3 weeks after surgery in order to allow for sufficient expression. Viral infusion coordinates were: VTA [from bregma53: anterior-posterior (AP), −3.50 mm; mediolateral (ML), 0.50 mm; and dorsal-ventral (DV) from the dura, −4.40 mm] ] and LC (AP, −5.45 mm; ML, 1.20 mm; and DV, −3.65 mm).
Event arena pharmacological experiment (Fig. 1)
Bilateral 26-gauge microinjection steel guide cannulae (2.5 mm length, 3.0 mm distance between cannulae; Plastics One) with stylets that protruded 0.5 mm below the end of the cannula (33 gauge, Plastics One) were then implanted into the dorsal hippocampus. The cannula implantation co-ordinates were (AP, −2.10 mm; ML, ±1.50 mm; and DV, −2.00 mm).
Extracellular recording in a novelty exploration paradigm (Fig. 2)
the Cre-inducible AAV5 ChR2-eYFP virus (1 μl) was unilaterally injected into VTA or LC as mentioned above. Four jeweller’s screws were then placed in the skull and the ground wire was attached to one of the skull screws. The microdrive implantation co-ordinates were: VTA (AP, −3.52 mm; ML, 0.48 mm; and DV, −4.00 mm) and LC (AP, −5.45 mm; ML, 1.00 mm; and DV, −2.80 mm). Adhesive cement (C&B metabond, Parkell) and dental acrylic were then sculpted around the microdrive.
Tract tracing experiment (Figs. 3 and S5)
For anterograde tracing, the Cre-inducible AAV5 eYFP virus (1 μl) was unilaterally injected into VTA or LC as described above. For retrograde tracing, retrobeads (0.1 μl) were unilaterally injected into CA1 (AP, −2.18 mm; ML, 1.18 mm; and DV, −1.36 mm), CA3 (AP, −2.18 mm; ML, 2.68 mm; and DV, −2.05 mm) and DG (AP, −2.18 mm; ML, 1.36 mm; and DV, −1.82 mm).
Event arena experiment with optogenetics (Fig. 4)
Arterial oxygen saturation, heart rate and breath rate were monitored by MouseOx instrument (STARR Life Science). The Cre-inducible AAV5 virus (ChR2-eYFP or eYFP, 1 μl per side) was injected bilaterally into VTA and LC according to the procedure described above. A dual ferrule optical fibre implant (0.22 NA, 200 μm core diameter; Doric Lenses) was implanted vertically into VTA (AP, −3.40 mm; ML, ±0.50 mm; and DV, −4.30 mm). Subsequently, a two-ferrule optical fibre implant (0.22 NA, 200 μm; Doric Lenses) was implanted into LC at −30° angle to coronal plane (AP, −5.45 mm; ML, ±0.90 mm; and DV, −3.00 mm). Additionally, bilateral 26-gauge steel guide cannulae (4.0 mm length, 3.0 mm distance between cannulae) with stylets (33 gauge) that protruded 0.5 mm below the end of the cannula was inserted into the dorsal hippocampus at a 40° angle to coronal plane (AP, −2.10 mm; ML, ±1.50 mm; and DV, −2.00 mm).
Event arena experiment with pharmacological inactivation (Fig. 6)
The Cre-inducible AAV5 virus (eArch3.0-eYFP or eYFP, 1 μl per side) was injected bilaterally into LC, and a two-ferrule optical fibre implant was then implanted into LC at −30° angle to coronal plane as described above. Additionally, bilateral 26-gauge steel guide cannulae (4.8 mm length, 1.0 mm distance between cannulae) with stylets (33 gauge) that protruded 0.5 mm below the end of the cannula was inserted into VTA (AP, −3.40 mm; ML, ±0.50 mm; and DV, −4.40 mm).
Ex vivo hippocampal electrophysiology (Fig. 5)
The Cre-inducible AAV2 ChR2-eYFP virus (0.75–1 μl per side) was bilaterally injected into LC (AP, −5.45 mm; ML, ±0.90 mm; and DV, −3.00 mm) over a 10–15 min period using a borosilicate glass electrode (10–15 MΩ) pulled with a horizontal pipet puller (P-97, Sutter Instrument) and a picospritzer (Parker) timed by a Master-8 pulse stimulator (A.M.P.I.). After each injection, the pipette was kept in place for 5 min to ensure proper diffusion of the virus.
Postoperative analgesia
Carprofen (0.08 ml kg−1 body weight), or buprenorphine (0.1 mg kg−1 body weight), was administered by subcutaneous injection at the end of all surgical procedures. All mice were allowed a recovery period of at least 7 days in order for them to regain their pre-surgery weights before electrophysiological or behavioural testing.
Everyday memory apparatus
Everyday memory was tested in an event arena − a square open field (120 cm wide × 120 cm long) with walls (35 cm high) made out of transparent Plexiglas (Fig. 1a) with 4 adjacent start boxes (black plexiglass). The name ‘event arena’ derives from it being an arena in which ‘events’ happen (e.g. finding food)13. The floor of the arena, arranged in a 5 × 5 grid, was covered with ~2 cm of sawdust and had two intramaze landmarks (a white metal cube located at row 3, column 2, and a black rubber flash light at row 3, column 4). The Plexiglas sandwells, in which food reward was potentially available, could be fitted into any of the 23 remaining sandwell positions (positions occupied by internal cues were excluded). The mice had access to the arena and sandwells when the startbox door was opened in any trials. Light levels, checked every day, were 25–35 lux. Data was recorded using custom-made LabVIEW software (National Instruments), using the image from camera placed above the arena.
Novelty apparatus
For novelty exploration, a square Plexiglas open field with transparent walls (70 cm wide × 70 cm long × 30 cm high) was placed in the middle of the event arena (Fig. 1b). In order to maintain the novelty of the environment, a wide range of floor substrates (dried leaves, shredded paper, feathers, acrylic pompoms, corks, lolly sticks, Lego blocks, pipe cleaners, shredded straws, and sea shells) that covered the floor of the box were used, as in a previously published protocol that used rats13.
Event arena tasks
Sample size, randomization, blinding and replication
A distinctive feature of event arena tasks is that most but not all comparisons are ‘within-subjects’ design in which every single subjects are exposed to every single treatment, including the control treatment. This typically reduces the number of subjects required for statistical significance and avoids issues associated with randomization. All non-rewarded probe tests (see below) were analysed blind and, being conducted against a stable performance background, were typically conducted twice or three times (internal replication). Averaging data helped reduce variability.
Shaping and habituation
After handling, habituation (8 sessions) involved training mice to dig in the sandwells to retrieve food (a half of cereal ‘cheerios’) and carry it to the start box.
Everyday training protocol
The goal in each daily session was to encode the changing daily location of a rewarded sandwell encountered during two consecutive sample trials (2 retrievals of buried food in each trial), and then, 10 min later, return to that same location during the choice trial (Fig. 1a). The choice trial was a retrieval test that involved a rewarded sandwell in a location that matched the sample location (the “correct” location; win-stay rule) and 4 non-rewarded sandwells placed in other locations around the arena (the “incorrect” locations). Training sessions were conducted daily (5–7 sessions per week) using 16 different sandwell configurations with rewarded sandwell positions counterbalanced between mice (Fig. S1a). We calculated a performance index (PI), using a formula PI=100−[100×(errors/4)], based on the number of errors made during the choice trial (an error being digging at an incorrect sandwell). The value expected based on chance was 50% (2 errors). With each behavioural cohort, we began conducting critical memory probe tests once mice reached average performance index of 75% (equivalent to 1 error, computed as average of last 5 training sessions). This typically happened within 35 training sessions, but sometimes additional training was needed due after complex surgical procedures.
Memory probe tests
The primary data measure of the study were derived from ‘memory tests’ performed as ‘probe’ tests – a session in which none of the sandwells contained any accessible food pellets. The mice were cued with a food pellet in the start box, and then allowed to search for the correct sandwell for 60 s from the first dig of any sandwell. After 60 s, the experimenter quietly entered the room and buried pellets in the correct sandwell, allowing the mouse to retrieve them (one by one as in training, this limited ‘extinction’). Dig time at each sandwells was measured, and the relative proportion of time at the correct and incorrect sandwells was calculated. The value expected based on chance was 20%. Probe tests were always separated by at least 2 sessions of regular training. In the ‘reward magnitude’ probe test (Figs. 1b, S1d), animals retrieved either two pellets (low reward) or eight pellets (high reward) during memory encoding.
Novelty exploration
The mice underwent 7 sessions of habituation to the box with sawdust placed in the event arena. For post-encoding unexpected environmental novelty, the mouse was placed into the centre of the box lined with a novel substrate and allowed to explore freely for 5 min.
Behavioural pharmacology
Microinfusion/injection of drugs
To help reduce any stress, all drugs were infused in the home cages. The stylets in the guide cannulae were replaced by a double infusion cannula (33 gauge, Plastics One) connected to two 5 μl microsyringes (WPI) in a microinfusion pump (Native Instruments) via flexible plastic tubing (C232CS, Plastics One) filled with Fluorinert (3M). The tips of infusion cannulae projected 0.5 mm below the tip of the guide cannulae. For intra-hippocampal microinjection, 0.5 μl of drug per cannula was infused at 0.2 μl min−1 (2.5 min). Infusion cannulas were left in place for a further 2.5 min before being replaced with stylets to aid drug absorption. For intra-VTA microinjection, 0.3 μl was injected at a rate of 0.3 μl min−1 (1 min) followed by 1-min of waiting. The mice were habituated to the experimental procedure of injection and to vehicle injection prior to the drug test in order to minimize novelty effect. Mice received drug injection 20 min (hippocampal microinfusions and i.p. injection of clonidine) or 3 min (VTA microinfusions) prior to the novelty exploration.
Drug concentrations
For microinfusions, the concentrations used were 21.1 mM (6.25 μg μl−1) for β-adrenoceptor antagonist propranolol [(S)-(−)-propranolol hydrochloride, 295.80 g mol−1; Sigma-Aldrich), 3.1 mM (1 μg μl−1) for D1/D5 receptor antagonist SCH23390 (SCH 23390 hydrochloride, 324.24 g mol−1; Tocris) and 2% w/v for voltage-gated sodium channel blocker lidocaine (lidocaine hydrochloride monohydrate, 288.81 g mol−1; Sigma-Aldrich). α2-adrenoceptor agonist clonidine (clonidine hydrochloride, 266.55 g mol−1; Sigma-Aldrich) was administered i.p. at a dose of 50 μg kg−1 of body weight. We used 0.9% NaCl (saline) in H2O as a vehicle and for control infusions. Both vehicle and drug solutions were stored in 100 μl aliquots at −20°C until use.
Optogenetic photostimulation in the event arena experiment
The mice were extensively habituated to the experimental procedure of photostimulation and to flickering blue light for several weeks prior to the optogenetic photostimulation test in order to minimize the potential novelty of the procedure. Laser stimulation, consisting of 25 Hz of twenty 5-ms pulses of 473-nm light, delivered every 5 s (average stimulation rate: 4 Hz) for the duration of 5 min (Fig. 4b), was performed in home cages using two blue solid-state diode pumped lasers (18–19 mW, Laser 2000) connected to either a dual fibre optic patch cord (for VTA; 0.22 NA, 200 μm core diameter; Doric Lenses) or two single fibre optic patch cords (for LC; 0.22 NA, 200 μm). Both lasers were synchronously controlled using custom-built LabVIEW software.
Extracellular recording in a novelty exploration paradigm
Apparatus and light stimulation
Unit activity was recorded extracellularly using the previously implanted custom-built screw-driven microdrive consisting of a 200 μm optic fibre surrounded by four tetrodes (an ‘optetrode’) that protruded 400–800 μm beyond the fibre tip54. Signals were fed through a 16 channel unity gain headstage amplifier (Axona), band-pass filtered at 300–5000 Hz, amplified 1 k–40 k times, digitized at 50 kHz and stored for subsequent analysis. Spike capturing was done on-line using amplitude threshold. Recorded neurons were identified as TH+ using Cre-dependent ChR2 expression and low-frequency light stimulation55. Laser stimulation was performed using a blue solid-state diode pumped laser (473 nm, Laser 2000) connected to a fibre optic patch cord (0.22 NA, 200 μm core diameter), and controlled with the data capturing software (Axona). Epochs of 60 light pulses (1 Hz, 5 ms pulse duration) at different light intensities (0.1–20 mW) were then administered and each tetrode was screened for light-evoked spikes. Spikes were classified as ‘light-evoked’ if their latency from the onset of the light pulse was between 0 and 15 ms, all other spikes being classified as ‘spontaneous’. Units were classified as light-responsive if: (a) a cell fired a light-evoked spike in response to more than one third of light pulses, (b) the shape of the mean light-evoked waveform of a unit closely resembled the spontaneous waveform of the same unit. Units with basal firing rates above 20 Hz were excluded from this analysis because of intrinsically high probability of spiking within the 15 ms window after the light pulse.
Novelty exploration
Two weeks after surgery, the implanted mice underwent 5 days of habituation to the experimental apparatus and the familiar environment. Following habituation, mice underwent daily screening trials for light-responsive neurons. If no light-responsive cells were found, the mouse was allowed to explore the familiar environment for 5 min and was then unplugged. If one or more recording channels showed a light-responsive unit, the mouse was subjected to an ‘exploration’ trial after a 10 min delay (Fig. 2b). The mouse might first be placed in the novel environment for 5 min, followed by 25 min in the home cage and 5 min in the familiar environment; alternatively, the order of novel and familiar exploration was reversed (in a counterbalanced manner). The novelty substrates used were the same as the ones used in the event arena tasks. Baseline recording was performed between two exploration trials. These particular time delays were chosen in order to mimic timing used in the event arena experiments, where there was a 30 min delay between memory encoding and novelty exploration. The light-sensitive unit was again confirmed in home cage with 1 Hz light stimulation. The microdrive was advanced by ~40 μm at the end of daily session to ensure that recordings are made from a different population of neurons.
Recording and analysis
Recorded spikes were clustered using Klusterkwik 1.5 unsupervised clustering algorithm (http://klusta-team.github.io/klustakwik/) based on their energy and first principal component of the waveform. Clusters were then corrected manually using Klusters spike sorting software (http://neurosuite.sourceforge.net/), based on several additional parameters (width of waveform, amplitude, time at peak, auto- and cross-correlograms). Data were analysed using Matlab R2012a (MathWorks). Firing patterns were characterised in terms of firing rate, rate of burst events and firing rate of spikes within bursts. Bursts were defined, using classic criteria56, as trains of 2 or more spikes with an interspike interval of less than 80 ms, followed by an interspike interval of more than 160 ms. For comparison of novelty modulation in VTA-TH+ and LC-TH+ neurons, firing rates of individual neurons in the novel compartment were binned in 10-s bins and normalised to the average home cage firing rate of all identified neurons in respective brain areas. For additional analysis of the novelty modulation, binned firing rates of individual neurons in the novel environment were z-scored to their respective firing rates in the familiar compartment.
Anatomical tract tracing
Under deep pentobarbital anesthesia (100 mg kg−1 of body weight, i.p.), the mice were fixed transcardially with 4% paraformaldehyde in 0.1 M sodium phosphate buffer (PB), pH 7.2, post-fixed in the same fixative for 24 h, and placed in 30% sucrose in PB. Sections of fixed brains (30 μm in thickness) were prepared using a freezing microtome (SM2000R, Leica Microsystems) for immunohistochemistry.
Immunofluorescence
Antibodies used included: goat anti-GFP57, guinea-pig anti-NET58 and mouse anti-TH (AB152, Millipore). eYFP was visualized by anti-GFP immunostaining. All immunohistochemical incubations were done at room temperature. Sections were incubated successively with 10% normal donkey serum for 20 min, a mixture of primary antibodies overnight (1 μg ml−1), and a mixture of Alexa Fluor 488-, Cy3-, or Cy5-labeled species-specific secondary antibodies (Invitrogen; Jackson ImmunoResearch) for 2 h at a dilution of 1:200.
Fluorescent in situ hybridization
Brains were freshly obtained under deep diethyl ether anaesthesia and immediately frozen in powdered dry ice. Fresh-frozen sections (20 μm) were cut on a cryostat (CM1900, Leica Microsystems). All sections were mounted on silane-coated glass slides. Mouse cDNA fragments of TH (bases 1–1025; GenBank accession number, AY855842), and NET (bases 124–814, MMU76306) were subcloned into the pBluescript II plasmid vector. Digoxigenin- or fluorescein-labeled cRNA probes were transcribed in vitro for fluorescent in situ hybridization59.
Image acquisition and data analysis
Images were taken with a confocal laser-scanning microscope (FV1200, Olympus) equipped with diode laser lines, and UPlanSApo (20×, NA 0.75) and PlanApoN (60×, NA 1.4, oil-immersion) objective lenses (Olympus). To avoid cross talk between multiple fluorophores, Alexa Fluor 488, Cy3, and Alexa Fluor 647 fluorescent signals were acquired sequentially using the 473, 559, and 647 nm excitation laser lines, respectively. All images show single optical sections. For quantification of anterograde tracing, we obtained images with a 20× objective and then created images of the entire hippocampus with a Fluoview image stitching software (Olympus). For analysis, the separate colour components were converted to greyscale, and the area of eYFP- and TH-positive elements were measured with Integrated Morphometry Analysis module (MetaMorph software, Molecular Devices).
Ex vivo hippocampal electrophysiology
Hippocampal slice preparation
300 μm thick coronal slices containing the hippocampus were cut from Th-Cre transgenic mice52 expressing AAV2 ChR2-eYFP in LC (8–12 weeks) in low light conditions to prevent unwanted ChR2 activation. Animals were anesthetized under 1.5–2% isoflurane, and the brains removed and blocked following rapid decapitation. Hippocampal slices were prepared using a vibratome (VT 1000S, Leica Microsystems) in ice cold N-Methyl-d-Glucosamine (NMDG) ringer solution (in mM): 5 NaCl, 57 NMDG, 37.5 Na-Pyruvate, 12.5 Na-Lactate, 5 Na-Ascorbate, 2.5 KCl, 1.25 NaH2PO4, 25 NaHCO3, 25 Glucose, 10 MgSO4·7H20, 0.5 CaCl2·2H20, the pH was set between 7.3 and 7.4 using 12 N HCl, the osmolarity was adjusted as needed to 315 mOsm using glucose and the solution was bubbled with 95% O2 and 5% CO2 gas. Slices were maintained in NMDG ringer at room temperature for no longer than 15 min and then transferred to artificial cerebral spinal fluid (aCSF) (in mM): 125 NaCl, 2.5 KCl, 1.25 NaH2PO4, 1.3 MgCl2, 2 CaCl2, 25 NaHCO3, and 25 dextrose continuously bubbled with 95% O2 and 5% CO2 gas, where they were kept up to 6 h, protected from light, for experimentation. One slice per animal was used.
Ex vivo whole-cell recordings
Slices were transferred to a submersion recording chamber and were perfused with aCSF at a rate of 1–2 ml min−1 at 26–29°C. EPSC recordings were performed with GABAA receptor antagonist picrotoxin (602.58 g mol−1; Sigma-Aldrich) at a concentration of 50 μM and D2 receptor antagonist eticlopride (Eticlopride hydrochloride, 377.31 g mol−1; Sigma-Aldrich) at a concentration of 100 nM in the bath. A borosilicate glass electrode (3–5 MΩ), pulled with a horizontal pipet puller (P-97), was filled with Cs-methanesulfonate pipet solution (in mM): 110 CsMeSO3, 15 CsCl, 8 NaCl, 2 EGTA, 10 HEPES, 3 QX-314, 2 ATP and 0.3 GTP adjusted to 295 mOsm and pH 7.3. Whole-cell pyramidal cell recordings from area CA1 were acquired using a combination of visualized and blind patch techniques. Cells were held at −60 mV using a multiclamp 700B amplifier (Molecular Devices). A bipolar stimulating electrode (FHC) was placed in the stratum radiatum region of dorsal CA1 within 100–200 μm of the recording electrode and stimulation (delivered at a rate of 0.2 Hz) was set to elicit current responses of 50–150 pA. Data was acquired and analysed automatically using P-Clamp 10 (Molecular Devices). Recordings were discarded if the series resistance varied by more than 20% or if the initial holding current exceeded 70 pA. Following a 5 min baseline acquisition, hippocampal slices were given a 470-nm light stimulus [consisting of three trains delivered every 2 min, of sixty 5-ms pulses, applied at 18 Hz (Fig. S7b)] through the 40× objective lenses. Following the light stimulus, baseline stimulation resumed.
Ex vivo field recordings
Slices were transferred to a submersion chamber and were perfused with aCSF at a rate of ~2 ml min−1 at 29–31°C. Field recordings from the stratum radiatum of dorsal CA1 were acquired using a borosilicate glass electrode (1–3 MΩ) filled with aCSF. A bipolar stimulating electrode was also placed in the stratum radiatum of CA1 within 100–200 μm of the recording electrode and stimulation (one stimulus every 30 s) was set to elicit a fEPSP slope that was ~50% of the maximum value. A stable 15 min baseline was obtained, followed by 10 more min of baseline stimulation with or without simultaneous optogenetic stimulation of LC-TH+ axons. Photostimulation consisting of four trains, at a 1 s interval, consisting of four 10-ms pulses of 470-nm light at 16 Hz, delivered every 30 s for the duration of 10 min (Fig. S7c), were applied through the 10× objective (directly before the Schaffer collateral stimulus). After the 25 min baseline, a weak theta-burst tetanus was applied consisting of four trains, at a 100 ms interval, consisting of 3 pulses at 50 Hz (12 pulses in total). Baseline stimulation then resumed as described above for 45 min. Every 2 traces were averaged to reduce variability. Data was acquired and analysed automatically using P-Clamp 10.
Ex vivo pharmacology
Where indicated, the following drugs were bath applied: α-adrenoceptor antagonist prazosin (prazosin hydrochloride, 419.86 g mol−1; Sigma-Aldrich) at a concentration of 30 μM, β-adrenoceptor antagonist propranolol [(S)-(−)-propranolol hydrochloride, 295.80 g mol−1; Sigma-Aldrich] at a concentration of 30 μM, D1/D5 receptor antagonist SCH 39166 (SCH 39166 hydrochloride, 394.73 g mol−1; Tocris) at a concentration of 100 nM (intracellular recordings, n = 2), and D1/D5 receptor antagonist SCH 23390 (SCH 23390 hydrochloride, 324.24 g mol−1; Tocris) at a concentration of 100 nM (intracellular recordings, n = 3) or 1 μM (extracellular recordings).
Acute extracellular recordings in anaesthetised mice
Anaesthesia was induced using isoflurane for LC optrode recording as described above or 4.8% chloral hydrate for VTA recording (induction: 480 mg kg−1 body weight, i.p.; maintenance: 120 mg kg−1 body weight, i.p.). Recordings were made using a 125 µm 1 MΩ tungsten electrode (A-M systems). This electrode was connected to a differential AC amplifier (A-M Systems), signals were band-pass filtered at 300 Hz-5 kHz, amplified 10 K times and digitized at 20 kHz. Spiking activity was defined as spikes that exceed 5 standard deviations from the mean value of the baseline signal [1 min before laser stimulation (LC) or drug infusion (VTA)]. Multi-unit activity in each trace was then normalised to the pre-stimulation (LC) or pre-infusion (VTA) baseline.
LC optrode recording
The tungsten electrode was coupled to an optic fibre (0.22 NA, 200 μm core diameter) (an ‘optrode’). This optrode was positioned above LC (AP, −5.45 mm; ML, 1.00 mm; and DV, −2.80 mm), and was then gradually in lowered in 50 μm increments until multi-unit activity was observed. Laser stimulation was performed using a green solid-state diode pumped laser (532 nm, Laser 2000) with 10–20 mW output from the fiber. For quantification of eArch3.0 recordings, baseline was measured over 30 s before the start of illumination (Pre), level of inhibition was measured over 5 min light on period (LC-ON), rebound activity was measured over 1 min after the end of illumination (Rebound), post-inhibition baseline was measured 4–5 min after the end of illumination (Post).
VTA recording with pharmacology
The drug cannula (33 gauge, Plastics One) was positioned in the VTA at 14° angle to sagittal plane (AP, −3.52 mm; ML, 0.48 mm; and DV, −4.40 mm) and the recording electrode was positioned vertically at the boundary of the VTA. For intra-VTA microinjection of lidocaine, infusion parameters were the same as those used in the behavioural experiment as described above. For quantification, pre-infusion baseline was measured over 30 s before the start of infusion (Pre), level of inhibition was measured 3–8 min after the start of infusion (Lid) – the period that corresponds to novelty exploration, and post-inhibition baseline was measured 17–18 min after the start of injection (Post).
Statistics, data presentation and data deposition
Statistical analyses were performed using SPSS version 19 (IBM). All data are expressed as mean ± s.e.m. Statistical significance was always determined by ANOVAs, prior to orthogonal comparisons where possible or Tukey HSD tests as appropriate to correct for multiple comparisons, paired _t_-tests and one-sample _t_-tests. All statistical tests were two-tailed. Analysis of probe test performance was done on the basis on the ‘% correct dig time’ score. In the pharmacological inactivation experiment (Fig. 6), three animals that persistently failed to show any novelty-induced memory enhancement in all control conditions [all 24-h PT scores (% correct dig) in the ‘novelty with vehicle’ condition at below chance level, i.e. < 20%] were eliminated from the whole dataset prior to statistical analysis (leaving n = 15). The rationale was that it is not possible to measure the impact of pharmacological manipulations on the novelty effect in animals that are not susceptible to it, the existence of the novelty effect having been established in the first cohort of mice (Fig. 1b). All source data for the preparation of graphs and statistical analysis is presented online. All other relevant data that support the conclusions of the study are available from the authors on request.
Supplementary Material
1. Extended Data Figure S1 | Everyday spatial memory task in the event arena.
a, Example sandwell locations (black circles) and starting positions (black arrows) used during regular training and non-rewarded probe tests (PTs). Sixteen different sandwell configurations were used throughout experiments, with daily rewarded sandwell positions counterbalanced between animals. b, Latency to dig in correct sandwell during choice test decreased as initial training progressed (Fig. 1a; Th-Cre mice, n = 13). Grey bars mark acquisition PT sessions. c, 10-min PTs conducted at different stages of initial training illustrate the learning curve (_F_2,24 = 9.35, P < 0.001), with animals performing above chance on PT3 (one-sample _t_-test vs. chance, _t_12 = 4.76, P < 0.001). d, Increased reward during the sample trial resulted in persistent memory at 24 h (1 h vs 24 h: _t_12 < 1; 1 h: _t_12 = 4.16, P < 0.01; 24 h: _t_12 = 4.70, P < 0.001). e, Impact of intra-hippocampal infusion of propranolol (Prop) or SCH23390 (SCH) on animals’ performance in 24-h PT (Fig. 1c). Infusion of Prop or SCH in dorsal hippocampus 20 min before novelty exploration had no impact on the total time that mice spent digging in sandwells (_F_2,24 < 1). **P < 0.01, ***P < 0.001 vs. chance. Dashed line indicates the chance level. Data are means ± s.e.m.
2. Extended Data Figure S2 | Specificity and expression rate of Cre-inducible AAV in VTA and LC of Th-Cre mice.
a, Schematic of viral injection. b–e, Double immunofluorescence for eYFP (green) and TH (red). In VTA (b, c) and LC (d, e), most eYFP-expressing cells are positive for TH (asterisks), and eYFP expression in TH− cells (arrows) is only occasionally observed. f, g, Quantification of specificity (f) and expression rate (g) of the Cre-inducible AAV in VTA and LC of Th-Cre mice. VTA-TH+ neurons are defined as TH+ cells located in the parabrachial pigmented area (PBP), paranigral (PN), interfascicular (IF) and rostral linear (RLi) nuclei. Measurements were made from the VTA in the left hemisphere, and three coronal sections (AP: −2.9, −3.5, and −3.9 from Bregma) from each mouse. LC-TH+ neurons are defined as TH+ cells located in the lateral floor of the fourth ventricle. Measurements were made from the LC in the left hemisphere, and five coronal sections (AP: −5.3 to −5.7 from Bregma) from each mouse. Total number of neurons measured are 2,500 and 1,520 in VTA and LC, respectively. Data are presented as mean ± s.e.m (n = 3 mice in each). IPN, interpeduncular nucleus; LC, locus coeruleus; SNc, Substantia nigra pars compacta; SNr, Substantia nigra pars reticulata; VTA, ventral tegmental area. Scale bars: 200 μm (b, d); 20 μm (c, e).
3. Extended Data Figure S3 | Firing properties of VTA-TH+ and LC-TH+ neurons.
a, b, Average spontaneous (black) and light-evoked (blue) waveforms of all identified VTA-TH+ neurons in Th-Cre mice expressing ChR2-eYFP in VTA (a, n = 15 neurons from 5 mice) and LC-TH+ neurons in Th-Cre mice expressing ChR2-eYFP in LC (b, n = 10 neurons from 3 mice) show nearly perfect overlap. c, Comparison of the novelty response dynamics of VTA-TH+ and LC-TH+ neurons. When z-scored to their average firing rates in the familiar compartment, LC-TH+ neurons showed stronger modulation by novelty than VTA-TH+ neurons (two-way ANOVA: main effect of Brain Area, _F_29,667 = 7.96, P < 0.01; Brain Area × Time interaction, _F_29,667 = 2.60, _P_ < 0.001). Additionally, LC-TH+ neurons but not VTA-TH+ neurons displayed habituation in a manner consistent with a novelty signal (one-way ANOVA: main effect of Time for LC Novel, _F_29,261 = 2.03, _P_ < 0.01; no effect of Time for VTA Novel: _F_29,406 = 1.18, _P_ > 0.05). d, VTA-TH+ and LC-TH+ neurons fire more bursts in novel than in familiar environments (5 min of exploration) (VTA-TH+: two-tailed paired _t_-test, _t_14 = 3.70, P < 0.01; LC-TH+: _t_9 = 2.43, P < 0.05). Dashed line indicates the baseline burst set rate. e, Firing properties of VTA-TH+ and LC-TH+ neurons in novel environments used to choose physiologically-relevant optogenetic stimulation protocols. The average firing rate and within-burst firing rate of our optogenetic stimulation protocols for both in vivo and extracellular ex vivo experiments are within the physiological range of both VTA-TH+ and LC-TH+ neurons. In addition, several recorded neurons fired most of their spikes in bursts. *P < 0.05, **P < 0.01, paired _t_-test. Data are means ± s.e.m.
4. Extended Data Figure S4 | NET is specifically expressed in LC-TH+ neurons.
a, Immunofluorescence showing overall distribution of TH (red) and NET (green) immunoreactivity in the mouse hippocampus. b, Representative high magnification images of double immunofluorescence for TH (red) and NET (green). Note that most TH+ axons are co-labelled for NET, and TH+-NET− axons (arrows) are only occasionally observed. c–e, Double-labelling fluorescence in situ hybridization showing distinct expression pattern of TH (red) and NET (green) mRNAs in VTA (c, d) and LC (e). Note that mRNA for NET is detected in virtually all TH-positive neurons in LC, whereas it is not in any of TH+ neurons in VTA. CA1 and CA3, hippocampal subregions CA1 and CA3; DG, dentate gyrus; HPC, hippocampus; LC, locus coeruleus; SNc, Substantia nigra pars compacta; SNr, Substantia nigra pars reticulate; VTA, ventral tegmental area. Scale bars: 200 μm (a); 5 μm (b); 100 μm (c); 10 μm (d); 50 μm (e).
5. Extended Data Figure S5 | Retrograde tracing with retrobeads.
Representative images of coronal sections containing VTA (a, b) and LC (c, d) showing TH+ (green) neurons labelled with retrobeads (red) in LC, but not in VTA. CA1 and CA3, hippocampal subregions CA1 and CA3; DG, dentate gyrus; LC, locus coeruleus; MPB, medial parabrachial nucleus; SNc, Substantia nigra pars compacta; SNr, Substantia nigra pars reticulata; SuM, supramammillary nucleus; VTA, ventral tegmental area. Scale bars: 200 μm (a); 50 μm (b, c, d).
6. Extended Data Figure S6 | Performance during training and probe tests in the optogenetic activation experiment (Fig. 4).
a, ChR2-expressing LC-TH+ and VTA-TH+ neurons reliably follow 25-Hz blue light stimulation in awake mice. b, ChR2+ mice (n = 8) and ChR2− controls (n = 6) both acquired the task over several weeks of training and maintained exceptionally stable performance from session (S) 40 until the end of training (S40 to S125: _F_16,192 < 1, _P_ > 0.05). After 15 training sessions, Th-Cre mice were allocated into ChR2+ and ChR2− groups based on their performance (average performance index in S1–S15: 75% in both groups). Vertical grey bar denotes the break in training due to implantation surgery. Pre, pre-training. c, 10-min probe test (PT) conducted before the implantation surgery, showing good memory (correct digging: one-sample _t_-test vs. chance, _t_13 = 3.17, P < 0.01; ChR2+ vs ChR2−: two-tailed paired _t_-test, _t_12 < 1, _P_ > 0.05). d, Infusion of propranolol or SCH23390 in dorsal hippocampus 20 min before LC photoactivation had no impact on the total digging time in either group (ChR2+: _F_3,21 < 1, _P_ > 0.05; ChR2−: _F_3,15 = 1.44, P > 0.05) (see Fig. 4f). **P < 0.01 vs. chance. Dashed lines indicate the chance level. Data are means ± s.e.m.
7. Extended Data Figure S7 | ChR2-eYFP expression in LC-TH+ neurons of Th-Cre mice and optogenetic stimulation protocols for ex vivo hippocampal electrophysiology (Fig. 5).
a, Representative images of double immunofluorescence for eYFP (green) and TH (red) in LC cell bodies (top) and LC axons in CA1 (bottom) in the strain of Th-Cre mice used for ex vivo hippocampal electrophysiology. b, c, Photostimulation protocols used in intracellular (b) and extracellular (c) ex vivo hippocampal electrophysiology.
8. Extended Data Figure S8 | Rebound activation after optogenetic inhibition of LC-TH+ neurons.
a, In vivo optrode recordings of eArch3.0-expressing LC-TH+ neurons in anaesthetised Th-Cre mice. Left, complete inhibition of multi-unit activity in LC during the 5 min ‘532-nm light on’ period [example trace and population data (n = 9 traces from 5 mice)], followed by pronounced rebound activation. Grey shading represents ± s.e.m. Right, mean multi-unit activity in LC (Pre vs. LC-ON: _t_8 = 35.6, P < 0.001; Pre vs. Rebound: _t_8 = 3.98, _P_ < 0.05; Pre vs. Post: _t_8 < 1, _P_ > 0.05). b, Single traces showing rebound excitation of eArch3.0-expressing LC-TH+ neurons after incomplete inhibition. Rebound excitation could not be reduced by low-power illumination (10 mW, left), even when light intensity was decreased monotonically over 3 min (right). c, Rebound excitation of the membrane trafficking-enhanced variants of halorhodopsin (eNpHR3.0)-expressing LC-TH+ neurons of Th-Cre mouse. Green shading indicates ‘light on’ periods.
9. Extended Data Figure S9 | Performance during training and probe tests in the pharmacological inactivation experiment (Fig. 6).
a, Th-Cre mice (n = 15) acquired the task over several weeks of training and maintained stable performance from session (S) 35 until the end of training (S35 to S90: _F_10,140 < 1, _P_ > 0.05]. Pre, pre-training. b, Mice showed effective memory when tested 1 h after weak encoding (one-sample _t_-test vs. chance, _t_14 = 5.68, P < 0.001). **c**, Intra-VTA infusion of lidocaine (left) or intraperitoneal injection of clonidine (right) prior to novelty exploration had no impact on the total digging time (see Fig. 6b, c) (Lidocaine: _t_14 < 1, _P_ > 0.05; Clonidine: _F_2,28 = 1.01, P > 0.05). ***P < 0.001 vs. chance. Dashed lines indicate the chance level. Data are means ± s.e.m.
Acknowledgments
We thank M. Evans for Th-Cre mice; H. Rowe, D. Tse for pilot studies; M. Lo, H-C. Tsai, C. Ramakrishnan for optogenetics training; UNC Viral Cores for producing AAVs; J. Cala, R. Fitzpatrick, J. Tulloch, T. Thai for technical support; R. Watson for animal care; N. Uchida, J. Cohen for assistance with optogenetic identification of TH+ neurons; P. Pedarzani, S. Canals, L. Genzel, M. Kroes, J. Lisman, D. Manahan-Vaughan, M. Munoz, T. Spires-Jones, S-H. Wang, O. Eschenko, E. Wood for scientific discussion. This work was funded by the European Research Council (G.F., R.G.M.M.: ERC-2010-AdG-268800-NEUROSCHEMA), UK Medical Research Council (A.J.D., R.G.M.M.), the European Commission’s 7th Framework 2011 ICT Programme for Future Emerging Technologies (A.J.D.: 600725-GRIDMAP), Dept. Veterans Affairs, NIH grant 5R01MH080297 and International Institute for Integrative Sleep Medicine, University of Tsukuba (R.W.G.), and NIDA-T32-DA7290 Basic Science Training Program in Drug Abuse, PI: A. Eisch (A.S.). The Instituto de Neurociencias at Alicante is “Centre of Excellence Severo Ochoa” in Spain.
Footnotes
Author contributions
T.T., A.J.D. designed with R.G.M.M. and conducted the behavioural, anatomical and in vivo electrophysiological experiments. T.T., M.Y. designed with M.W. and conducted the tract-tracing studies; M.Y. analysed the data. A.S., C.C.S. designed with R.W.G. and conducted the ex vivo electrophysiological experiments. P.A.S. and A.J.D. constructed behavioural apparatus; P.A.S. implemented the optogenetic stimulation equipment. R.W.G., G.F. and R.G.M.M. secured the funding. K.D. offered advice and training to T.T. and designed the optetrode. T.T. and A.J.D. analysed the remaining data. T.T., A.J.D., R.W.G. and R.G.M.M. wrote the manuscript. All authors discussed and commented on the manuscript.
The authors declare no competing financial interests. Readers are welcome to comment on the online version of the paper.
References
- 1.Ebbinghaus H. Memory: A Contribution to Experimental Psychology. Dover, New York: 1885. [DOI] [PMC free article] [PubMed] [Google Scholar]
- 2.Wixted JT. The psychology and neuroscience of forgetting. Annu Rev Psychol. 2004;55:235–269. doi: 10.1146/annurev.psych.55.090902.141555. [DOI] [PubMed] [Google Scholar]
- 3.Marr D. Simple memory: a theory for archicortex. Philos Trans R Soc Lond B Biol Sci. 1971;262:23–81. doi: 10.1098/rstb.1971.0078. [DOI] [PubMed] [Google Scholar]
- 4.Morris RGM. Elements of a neurobiological theory of hippocampal function: the role of synaptic plasticity, synaptic tagging and schemas. Eur J Neurosci. 2006;23:2829–2846. doi: 10.1111/j.1460-9568.2006.04888.x. [DOI] [PubMed] [Google Scholar]
- 5.Squire LR. Memory and the hippocampus: a synthesis from findings with rats, monkeys, and humans. Psychol Rev. 1992;99:195–231. doi: 10.1037/0033-295x.99.2.195. [DOI] [PubMed] [Google Scholar]
- 6.Dudai Y, Morris RGM. In: Brain, Perception and Memory: Advances in Cognitive Neuroscience. Bolhuis JJ, editor. Oxford Univ. Press; 2000. pp. 147–162. [Google Scholar]
- 7.Brown R, Kulik J. Flashbulb memories. Cognition. 1977;5:73–99. [Google Scholar]
- 8.Dunsmoor JE, Murty VP, Davachi L, Phelps EA. Emotional learning selectively and retroactively strengthens memories for related events. Nature. 2015;520:345–348. doi: 10.1038/nature14106. [DOI] [PMC free article] [PubMed] [Google Scholar]
- 9.Guzowski JF, McNaughton BL, Barnes CA, Worley PF. Environment-specific expression of the immediate-early gene Arc in hippocampal neuronal ensembles. Nat Neurosci. 1999;2:1120–1124. doi: 10.1038/16046. [DOI] [PubMed] [Google Scholar]
- 10.Li S, Cullen WK, Anwyl R, Rowan MJ. Dopamine-dependent facilitation of LTP induction in hippocampal CA1 by exposure to spatial novelty. Nat Neurosci. 2003;6:526–531. doi: 10.1038/nn1049. [DOI] [PubMed] [Google Scholar]
- 11.Lemon N, Manahan-Vaughan D. Dopamine D1/D5 receptors gate the acquisition of novel information through hippocampal long-term potentiation and long-term depression. J Neurosci. 2006;26:7723–7729. doi: 10.1523/JNEUROSCI.1454-06.2006. [DOI] [PMC free article] [PubMed] [Google Scholar]
- 12.Moncada D, Viola H. Induction of long-term memory by exposure to novelty requires protein synthesis: evidence for a behavioral tagging. J Neurosci. 2007;27:7476–7481. doi: 10.1523/JNEUROSCI.1083-07.2007. [DOI] [PMC free article] [PubMed] [Google Scholar]
- 13.Wang SH, Redondo RL, Morris RGM. Relevance of synaptic tagging and capture to the persistence of long-term potentiation and everyday spatial memory. Proc Natl Acad Sci USA. 2010;107:19537–19542. doi: 10.1073/pnas.1008638107. [DOI] [PMC free article] [PubMed] [Google Scholar]
- 14.Takeuchi T, Duszkiewicz AJ, Morris RGM. The synaptic plasticity and memory hypothesis: encoding, storage and persistence. Philos Trans R Soc Lond B Biol Sci. 2014;369:20130288. doi: 10.1098/rstb.2013.0288. [DOI] [PMC free article] [PubMed] [Google Scholar]
- 15.Lisman JE, Grace AA. The hippocampal-VTA loop: controlling the entry of information into long-term memory. Neuron. 2005;46:703–713. doi: 10.1016/j.neuron.2005.05.002. [DOI] [PubMed] [Google Scholar]
- 16.Bunzeck N, Guitart-Masip M, Dolan RJ, Duzel E. Pharmacological dissociation of novelty responses in the human brain. Cereb Cortex. 2014;24:1351–1360. doi: 10.1093/cercor/bhs420. [DOI] [PMC free article] [PubMed] [Google Scholar]
- 17.Frey U, Matthies H, Reymann KG, Matthies H. The effect of dopaminergic D1 receptor blockade during tetanization on the expression of long-term potentiation in the rat CA1 region in vitro. Neurosci Lett. 1991;129:111–114. doi: 10.1016/0304-3940(91)90732-9. [DOI] [PubMed] [Google Scholar]
- 18.Huang YY, Kandel ER. D1/D5 receptor agonists induce a protein synthesis-dependent late potentiation in the CA1 region of the hippocampus. Proc Natl Acad Sci USA. 1995;92:2446–2450. doi: 10.1073/pnas.92.7.2446. [DOI] [PMC free article] [PubMed] [Google Scholar]
- 19.Lemon N, Manahan-Vaughan D. Dopamine D1/D5 receptors contribute to de novo hippocampal LTD mediated by novel spatial exploration or locus coeruleus activity. Cereb Cortex. 2012;22:2131–2138. doi: 10.1093/cercor/bhr297. [DOI] [PMC free article] [PubMed] [Google Scholar]
- 20.Devoto P, Flore G. On the origin of cortical dopamine: is it a co-transmitter in noradrenergic neurons? Curr Neuropharmacol. 2006;4:115–125. doi: 10.2174/157015906776359559. [DOI] [PMC free article] [PubMed] [Google Scholar]
- 21.Smith CC, Greene RW. CNS dopamine transmission mediated by noradrenergic innervation. J Neurosci. 2012;32:6072–6080. doi: 10.1523/JNEUROSCI.6486-11.2012. [DOI] [PMC free article] [PubMed] [Google Scholar]
- 22.Hansen N, Manahan-Vaughan D. Dopamine D1/D5 receptors mediate informational saliency that promotes persistent hippocampal long-term plasticity. Cereb Cortex. 2014;24:845–858. doi: 10.1093/cercor/bhs362. [DOI] [PMC free article] [PubMed] [Google Scholar]
- 23.Nakazawa K, et al. Hippocampal CA3 NMDA receptors are crucial for memory acquisition of one-time experience. Neuron. 2003;38:305–315. doi: 10.1016/s0896-6273(03)00165-x. [DOI] [PubMed] [Google Scholar]
- 24.Aston-Jones G, Bloom FE. Activity of norepinephrine-containing locus coeruleus neurons in behaving rats anticipates fluctuations in the sleep-waking cycle. J Neurosci. 1981;1:876–886. doi: 10.1523/JNEUROSCI.01-08-00876.1981. [DOI] [PMC free article] [PubMed] [Google Scholar]
- 25.Vankov A, Herve-Minvielle A, Sara SJ. Response to novelty and its rapid habituation in locus coeruleus neurons of the freely exploring rat. Eur J Neurosci. 1995;7:1180–1187. doi: 10.1111/j.1460-9568.1995.tb01108.x. [DOI] [PubMed] [Google Scholar]
- 26.Gasbarri A, Verney C, Innocenzi R, Campana E, Pacitti C. Mesolimbic dopaminergic neurons innervating the hippocampal formation in the rat: a combined retrograde tracing and immunohistochemical study. Brain Res. 1994;668:71–79. doi: 10.1016/0006-8993(94)90512-6. [DOI] [PubMed] [Google Scholar]
- 27.Stujenske JM, Spellman T, Gordon JA. Modeling the spatiotemporal dynamics of light and heat propagation for in vivo optogenetics. Cell Rep. 2015;12:525–534. doi: 10.1016/j.celrep.2015.06.036. [DOI] [PMC free article] [PubMed] [Google Scholar]
- 28.Lerner TN, Ye L, Deisseroth K. Communication in neural circuits: tools, opportunities, and challenges. Cell. 2016;164:1136–1150. doi: 10.1016/j.cell.2016.02.027. [DOI] [PMC free article] [PubMed] [Google Scholar]
- 29.Mahn M, Prigge M, Ron S, Levy R, Yizhar O. Biophysical constraints of optogenetic inhibition at presynaptic terminals. Nat Neurosci. 2016;19:554–556. doi: 10.1038/nn.4266. [DOI] [PMC free article] [PubMed] [Google Scholar]
- 30.Wu MF, et al. Locus coeruleus neurons: cessation of activity during cataplexy. Neuroscience. 1999;91:1389–1399. doi: 10.1016/s0306-4522(98)00600-9. [DOI] [PMC free article] [PubMed] [Google Scholar]
- 31.Frey U, Morris RGM. Synaptic tagging: implications for late maintenance of hippocampal long-term potentiation. Trends Neurosci. 1998;21:181–188. doi: 10.1016/s0166-2236(97)01189-2. [DOI] [PubMed] [Google Scholar]
- 32.Kandel ER. The molecular biology of memory: cAMP, PKA, CRE, CREB-1, CREB-2, and CPEB. Mol Brain. 2012;5:12. doi: 10.1186/1756-6606-5-14. [DOI] [PMC free article] [PubMed] [Google Scholar]
- 33.Gruber MJ, Ritchey M, Wang SF, Doss MK, Ranganath C. Post-learning hippocampal dynamics promote preferential retention of rewarding events. Neuron. 2016;89:1110–1120. doi: 10.1016/j.neuron.2016.01.017. [DOI] [PMC free article] [PubMed] [Google Scholar]
- 34.Grenhoff J, Svensson TH. Clonidine modulates dopamine cell firing in rat ventral tegmental area. Eur J Pharmacol. 1989;165:11–18. doi: 10.1016/0014-2999(89)90765-6. [DOI] [PubMed] [Google Scholar]
- 35.Chuhma N, et al. Dopamine neurons mediate a fast excitatory signal via their glutamatergic synapses. J Neurosci. 2004;24:972–981. doi: 10.1523/JNEUROSCI.4317-03.2004. [DOI] [PMC free article] [PubMed] [Google Scholar]
- 36.Tritsch NX, Ding JB, Sabatini BL. Dopaminergic neurons inhibit striatal output through non-canonical release of GABA. Nature. 2012;490:262–266. doi: 10.1038/nature11466. [DOI] [PMC free article] [PubMed] [Google Scholar]
- 37.Otmakhova NA, Duzel E, Deutch AY, Lisman J. In: Intrinsically Motivated Learning in Natural and Artificial Systems. Baldassarre G, Mirolli M, editors. Sptringer; Berlin: 2013. pp. 235–254. [Google Scholar]
- 38.Everitt BJ, Dickinson A, Robbins TW. The neuropsychological basis of addictive behaviour. Brain Res Brain Res Rev. 2001;36:129–138. doi: 10.1016/s0165-0173(01)00088-1. [DOI] [PubMed] [Google Scholar]
- 39.Schultz W, Apicella P, Ljungberg T, Romo R, Scarnati E. Reward-related activity in the monkey striatum and substantia nigra. Prog Brain Res. 1993;99:227–235. doi: 10.1016/s0079-6123(08)61349-7. [DOI] [PubMed] [Google Scholar]
- 40.Tsai HC, et al. Phasic firing in dopaminergic neurons is sufficient for behavioral conditioning. Science. 2009;324:1080–1084. doi: 10.1126/science.1168878. [DOI] [PMC free article] [PubMed] [Google Scholar]
- 41.Steinberg EE, et al. A causal link between prediction errors, dopamine neurons and learning. Nat Neurosci. 2013;16:966–973. doi: 10.1038/nn.3413. [DOI] [PMC free article] [PubMed] [Google Scholar]
- 42.McNamara CG, Tejero-Cantero A, Trouche S, Campo-Urriza N, Dupret D. Dopaminergic neurons promote hippocampal reactivation and spatial memory persistence. Nat Neurosci. 2014;17:1658–1660. doi: 10.1038/nn.3843. [DOI] [PMC free article] [PubMed] [Google Scholar]
- 43.Rosen ZB, Cheung S, Siegelbaum SA. Midbrain dopamine neurons bidirectionally regulate CA3-CA1 synaptic drive. Nat Neurosci. 2015;18:1763–1771. doi: 10.1038/nn.4152. [DOI] [PMC free article] [PubMed] [Google Scholar]
- 44.Schwarz LA, et al. Viral-genetic tracing of the input-output organization of a central noradrenaline circuit. Nature. 2015;524:88–92. doi: 10.1038/nature14600. [DOI] [PMC free article] [PubMed] [Google Scholar]
- 45.Harley C. Noradrenergic and locus coeruleus modulation of the perforant path-evoked potential in rat dentate gyrus supports a role for the locus coeruleus in attentional and memorial processes. Prog Brain Res. 1991;88:307–321. doi: 10.1016/s0079-6123(08)63818-2. [DOI] [PubMed] [Google Scholar]
- 46.Sara SJ. The locus coeruleus and noradrenergic modulation of cognition. Nature Rev Neurosci. 2009;10:211–223. doi: 10.1038/nrn2573. [DOI] [PubMed] [Google Scholar]
- 47.Eschenko O, Magri C, Panzeri S, Sara SJ. Noradrenergic neurons of the locus coeruleus are phase locked to cortical up-down states during sleep. Cereb Cortex. 2012;22:426–435. doi: 10.1093/cercor/bhr121. [DOI] [PubMed] [Google Scholar]
- 48.Frey U, Morris RGM. Synaptic tagging and long-term potentiation. Nature. 1997;385:533–536. doi: 10.1038/385533a0. [DOI] [PubMed] [Google Scholar]
- 49.Redondo RL, Morris RGM. Making memories last: the synaptic tagging and capture hypothesis. Nature Rev Neurosci. 2011;12:17–30. doi: 10.1038/nrn2963. [DOI] [PubMed] [Google Scholar]
- 50.Rogerson T, et al. Synaptic tagging during memory allocation. Nature Rev Neurosci. 2014;15:157–169. doi: 10.1038/nrn3667. [DOI] [PMC free article] [PubMed] [Google Scholar]
- 51.Lindeberg J, et al. Transgenic expression of Cre recombinase from the tyrosine hydroxylase locus. Genesis. 2004;40:67–73. doi: 10.1002/gene.20065. [DOI] [PubMed] [Google Scholar]
- 52.Savitt JM, Jang SS, Mu W, Dawson VL, Dawson TM. Bcl-x is required for proper development of the mouse substantia nigra. J Neurosci. 2005;25:6721–6728. doi: 10.1523/JNEUROSCI.0760-05.2005. [DOI] [PMC free article] [PubMed] [Google Scholar]
- 53.Franklin KBJ, Paxinos G. The Mouse Brain in Stereotaxic Coordinates. 3rd. Academic Press; San Diego: 2007. [Google Scholar]
- 54.Anikeeva P, et al. Optetrode: a multichannel readout for optogenetic control in freely moving mice. Nat Neurosci. 2012;15:163–170. doi: 10.1038/nn.2992. [DOI] [PMC free article] [PubMed] [Google Scholar]
- 55.Cohen JY, Haesler S, Vong L, Lowell BB, Uchida N. Neuron-type-specific signals for reward and punishment in the ventral tegmental area. Nature. 2012;482:85–88. doi: 10.1038/nature10754. [DOI] [PMC free article] [PubMed] [Google Scholar]
- 56.Grace AA, Bunney BS. Intracellular and extracellular electrophysiology of nigral dopaminergic neurons–1. Identification and characterization. Neuroscience. 1983;10:301–315. doi: 10.1016/0306-4522(83)90135-5. [DOI] [PubMed] [Google Scholar]
- 57.Takasaki C, et al. Cytochemical and cytological properties of perineuronal oligodendrocytes in the mouse cortex. Eur J Neurosci. 2010;32:1326–1336. doi: 10.1111/j.1460-9568.2010.07377.x. [DOI] [PubMed] [Google Scholar]
- 58.Uchigashima M, et al. Subcellular arrangement of molecules for 2-arachidonoyl-glycerol-mediated retrograde signaling and its physiological contribution to synaptic modulation in the striatum. J Neurosci. 2007;27:3663–3676. doi: 10.1523/JNEUROSCI.0448-07.2007. [DOI] [PMC free article] [PubMed] [Google Scholar]
- 59.Yamasaki M, Matsui M, Watanabe M. Preferential localization of muscarinic M1 receptor on dendritic shaft and spine of cortical pyramidal cells and its anatomical evidence for volume transmission. J Neurosci. 2010;30:4408–4418. doi: 10.1523/JNEUROSCI.5719-09.2010. [DOI] [PMC free article] [PubMed] [Google Scholar]
Associated Data
This section collects any data citations, data availability statements, or supplementary materials included in this article.
Supplementary Materials
1. Extended Data Figure S1 | Everyday spatial memory task in the event arena.
a, Example sandwell locations (black circles) and starting positions (black arrows) used during regular training and non-rewarded probe tests (PTs). Sixteen different sandwell configurations were used throughout experiments, with daily rewarded sandwell positions counterbalanced between animals. b, Latency to dig in correct sandwell during choice test decreased as initial training progressed (Fig. 1a; Th-Cre mice, n = 13). Grey bars mark acquisition PT sessions. c, 10-min PTs conducted at different stages of initial training illustrate the learning curve (_F_2,24 = 9.35, P < 0.001), with animals performing above chance on PT3 (one-sample _t_-test vs. chance, _t_12 = 4.76, P < 0.001). d, Increased reward during the sample trial resulted in persistent memory at 24 h (1 h vs 24 h: _t_12 < 1; 1 h: _t_12 = 4.16, P < 0.01; 24 h: _t_12 = 4.70, P < 0.001). e, Impact of intra-hippocampal infusion of propranolol (Prop) or SCH23390 (SCH) on animals’ performance in 24-h PT (Fig. 1c). Infusion of Prop or SCH in dorsal hippocampus 20 min before novelty exploration had no impact on the total time that mice spent digging in sandwells (_F_2,24 < 1). **P < 0.01, ***P < 0.001 vs. chance. Dashed line indicates the chance level. Data are means ± s.e.m.
2. Extended Data Figure S2 | Specificity and expression rate of Cre-inducible AAV in VTA and LC of Th-Cre mice.
a, Schematic of viral injection. b–e, Double immunofluorescence for eYFP (green) and TH (red). In VTA (b, c) and LC (d, e), most eYFP-expressing cells are positive for TH (asterisks), and eYFP expression in TH− cells (arrows) is only occasionally observed. f, g, Quantification of specificity (f) and expression rate (g) of the Cre-inducible AAV in VTA and LC of Th-Cre mice. VTA-TH+ neurons are defined as TH+ cells located in the parabrachial pigmented area (PBP), paranigral (PN), interfascicular (IF) and rostral linear (RLi) nuclei. Measurements were made from the VTA in the left hemisphere, and three coronal sections (AP: −2.9, −3.5, and −3.9 from Bregma) from each mouse. LC-TH+ neurons are defined as TH+ cells located in the lateral floor of the fourth ventricle. Measurements were made from the LC in the left hemisphere, and five coronal sections (AP: −5.3 to −5.7 from Bregma) from each mouse. Total number of neurons measured are 2,500 and 1,520 in VTA and LC, respectively. Data are presented as mean ± s.e.m (n = 3 mice in each). IPN, interpeduncular nucleus; LC, locus coeruleus; SNc, Substantia nigra pars compacta; SNr, Substantia nigra pars reticulata; VTA, ventral tegmental area. Scale bars: 200 μm (b, d); 20 μm (c, e).
3. Extended Data Figure S3 | Firing properties of VTA-TH+ and LC-TH+ neurons.
a, b, Average spontaneous (black) and light-evoked (blue) waveforms of all identified VTA-TH+ neurons in Th-Cre mice expressing ChR2-eYFP in VTA (a, n = 15 neurons from 5 mice) and LC-TH+ neurons in Th-Cre mice expressing ChR2-eYFP in LC (b, n = 10 neurons from 3 mice) show nearly perfect overlap. c, Comparison of the novelty response dynamics of VTA-TH+ and LC-TH+ neurons. When z-scored to their average firing rates in the familiar compartment, LC-TH+ neurons showed stronger modulation by novelty than VTA-TH+ neurons (two-way ANOVA: main effect of Brain Area, _F_29,667 = 7.96, P < 0.01; Brain Area × Time interaction, _F_29,667 = 2.60, _P_ < 0.001). Additionally, LC-TH+ neurons but not VTA-TH+ neurons displayed habituation in a manner consistent with a novelty signal (one-way ANOVA: main effect of Time for LC Novel, _F_29,261 = 2.03, _P_ < 0.01; no effect of Time for VTA Novel: _F_29,406 = 1.18, _P_ > 0.05). d, VTA-TH+ and LC-TH+ neurons fire more bursts in novel than in familiar environments (5 min of exploration) (VTA-TH+: two-tailed paired _t_-test, _t_14 = 3.70, P < 0.01; LC-TH+: _t_9 = 2.43, P < 0.05). Dashed line indicates the baseline burst set rate. e, Firing properties of VTA-TH+ and LC-TH+ neurons in novel environments used to choose physiologically-relevant optogenetic stimulation protocols. The average firing rate and within-burst firing rate of our optogenetic stimulation protocols for both in vivo and extracellular ex vivo experiments are within the physiological range of both VTA-TH+ and LC-TH+ neurons. In addition, several recorded neurons fired most of their spikes in bursts. *P < 0.05, **P < 0.01, paired _t_-test. Data are means ± s.e.m.
4. Extended Data Figure S4 | NET is specifically expressed in LC-TH+ neurons.
a, Immunofluorescence showing overall distribution of TH (red) and NET (green) immunoreactivity in the mouse hippocampus. b, Representative high magnification images of double immunofluorescence for TH (red) and NET (green). Note that most TH+ axons are co-labelled for NET, and TH+-NET− axons (arrows) are only occasionally observed. c–e, Double-labelling fluorescence in situ hybridization showing distinct expression pattern of TH (red) and NET (green) mRNAs in VTA (c, d) and LC (e). Note that mRNA for NET is detected in virtually all TH-positive neurons in LC, whereas it is not in any of TH+ neurons in VTA. CA1 and CA3, hippocampal subregions CA1 and CA3; DG, dentate gyrus; HPC, hippocampus; LC, locus coeruleus; SNc, Substantia nigra pars compacta; SNr, Substantia nigra pars reticulate; VTA, ventral tegmental area. Scale bars: 200 μm (a); 5 μm (b); 100 μm (c); 10 μm (d); 50 μm (e).
5. Extended Data Figure S5 | Retrograde tracing with retrobeads.
Representative images of coronal sections containing VTA (a, b) and LC (c, d) showing TH+ (green) neurons labelled with retrobeads (red) in LC, but not in VTA. CA1 and CA3, hippocampal subregions CA1 and CA3; DG, dentate gyrus; LC, locus coeruleus; MPB, medial parabrachial nucleus; SNc, Substantia nigra pars compacta; SNr, Substantia nigra pars reticulata; SuM, supramammillary nucleus; VTA, ventral tegmental area. Scale bars: 200 μm (a); 50 μm (b, c, d).
6. Extended Data Figure S6 | Performance during training and probe tests in the optogenetic activation experiment (Fig. 4).
a, ChR2-expressing LC-TH+ and VTA-TH+ neurons reliably follow 25-Hz blue light stimulation in awake mice. b, ChR2+ mice (n = 8) and ChR2− controls (n = 6) both acquired the task over several weeks of training and maintained exceptionally stable performance from session (S) 40 until the end of training (S40 to S125: _F_16,192 < 1, _P_ > 0.05). After 15 training sessions, Th-Cre mice were allocated into ChR2+ and ChR2− groups based on their performance (average performance index in S1–S15: 75% in both groups). Vertical grey bar denotes the break in training due to implantation surgery. Pre, pre-training. c, 10-min probe test (PT) conducted before the implantation surgery, showing good memory (correct digging: one-sample _t_-test vs. chance, _t_13 = 3.17, P < 0.01; ChR2+ vs ChR2−: two-tailed paired _t_-test, _t_12 < 1, _P_ > 0.05). d, Infusion of propranolol or SCH23390 in dorsal hippocampus 20 min before LC photoactivation had no impact on the total digging time in either group (ChR2+: _F_3,21 < 1, _P_ > 0.05; ChR2−: _F_3,15 = 1.44, P > 0.05) (see Fig. 4f). **P < 0.01 vs. chance. Dashed lines indicate the chance level. Data are means ± s.e.m.
7. Extended Data Figure S7 | ChR2-eYFP expression in LC-TH+ neurons of Th-Cre mice and optogenetic stimulation protocols for ex vivo hippocampal electrophysiology (Fig. 5).
a, Representative images of double immunofluorescence for eYFP (green) and TH (red) in LC cell bodies (top) and LC axons in CA1 (bottom) in the strain of Th-Cre mice used for ex vivo hippocampal electrophysiology. b, c, Photostimulation protocols used in intracellular (b) and extracellular (c) ex vivo hippocampal electrophysiology.
8. Extended Data Figure S8 | Rebound activation after optogenetic inhibition of LC-TH+ neurons.
a, In vivo optrode recordings of eArch3.0-expressing LC-TH+ neurons in anaesthetised Th-Cre mice. Left, complete inhibition of multi-unit activity in LC during the 5 min ‘532-nm light on’ period [example trace and population data (n = 9 traces from 5 mice)], followed by pronounced rebound activation. Grey shading represents ± s.e.m. Right, mean multi-unit activity in LC (Pre vs. LC-ON: _t_8 = 35.6, P < 0.001; Pre vs. Rebound: _t_8 = 3.98, _P_ < 0.05; Pre vs. Post: _t_8 < 1, _P_ > 0.05). b, Single traces showing rebound excitation of eArch3.0-expressing LC-TH+ neurons after incomplete inhibition. Rebound excitation could not be reduced by low-power illumination (10 mW, left), even when light intensity was decreased monotonically over 3 min (right). c, Rebound excitation of the membrane trafficking-enhanced variants of halorhodopsin (eNpHR3.0)-expressing LC-TH+ neurons of Th-Cre mouse. Green shading indicates ‘light on’ periods.
9. Extended Data Figure S9 | Performance during training and probe tests in the pharmacological inactivation experiment (Fig. 6).
a, Th-Cre mice (n = 15) acquired the task over several weeks of training and maintained stable performance from session (S) 35 until the end of training (S35 to S90: _F_10,140 < 1, _P_ > 0.05]. Pre, pre-training. b, Mice showed effective memory when tested 1 h after weak encoding (one-sample _t_-test vs. chance, _t_14 = 5.68, P < 0.001). **c**, Intra-VTA infusion of lidocaine (left) or intraperitoneal injection of clonidine (right) prior to novelty exploration had no impact on the total digging time (see Fig. 6b, c) (Lidocaine: _t_14 < 1, _P_ > 0.05; Clonidine: _F_2,28 = 1.01, P > 0.05). ***P < 0.001 vs. chance. Dashed lines indicate the chance level. Data are means ± s.e.m.