Breaching self-tolerance to Alu duplex RNA underlies MDA5-mediated inflammation (original) (raw)
. Author manuscript; available in PMC: 2019 Feb 8.
Summary
Aberrant activation of innate immune receptors can cause a spectrum of immune disorders, such as Aicardi-Goutières syndrome (AGS). One such receptor is MDA5, a viral dsRNA sensor that induces antiviral immune response. Using a newly developed RNase protection/RNA-seq approach, we here demonstrate that constitutive activation of MDA5 in AGS results from the loss of tolerance to cellular dsRNAs formed by Alu retroelements. While wild-type MDA5 cannot efficiently recognize Alu-dsRNAs because of its limited filament formation on imperfect duplexes, AGS-variants of MDA5 display reduced sensitivity to duplex structural irregularities, assembling signaling-competent filaments on Alu-dsRNAs. Moreover, we identified an unexpected role of RNA-rich cellular environment in suppressing aberrant MDA5 oligomerization, highlighting context-dependence of self vs. non-self discrimination. Overall, our work demonstrates that the increased efficiency of MDA5 to recognize dsRNA comes at a cost of self-recognition, and implicates a unique role of Alu-dsRNAs as virus-like elements that shape the primate immune system.
In Brief
Constitutive activation of the viral RNA sensor MDA5 in the autoimmune disorder Aicardi-Goutières syndrome (AGS) results from loss of tolerance to endogenous Alu retroelement transcripts.
Introduction
The balance between immune activity and self-tolerance is the key to successful immune functions, while their imbalance could lead to immune disorders or infectious diseases. This balance is also required during self vs. non-self discrimination by innate immune receptors, such as Melanoma Differentiation Associated gene 5 (MDA5). MDA5 is a cytosolic innate immune receptor that recognizes long dsRNA generated during viral replication (del Toro Duany et al., 2015). Earlier studies showed that while MDA5 can bind various nucleic acids (Peisley et al., 2011), it forms filaments along the length of dsRNA, thereby regulating its stability according to the length of the bound dsRNA (Peisley et al., 2012). Filament formation was also proposed to enable oligomerization of the signaling domain, tandem caspase activation recruitment domain (2CARD) (Wu et al., 2013), a pre-requisite for interaction with and activation of the downstream adaptor molecule, MAVS (Jiang et al., 2012; Wu et al., 2013). Activated MAVS polymerizes on mitochondria and in turn recruits downstream signaling molecules, leading to the activation of transcription factors, such as IRF3, to induce type I and III interferons (IFNs) and other antiviral genes (Hou et al., 2011).
Recent studies showed that certain mutations in MDA5 lead to aberrant activation of its signaling activity, resulting in a spectrum of immune disorders, such as systemic lupus erythematosus (SLE), Aicardi-Goutières syndrome (AGS) and Singleton-Merten syndrome (SMS) (Oda et al., 2014; Rice et al., 2014; Rutsch et al., 2015; Van Eyck et al., 2015). In vitro, these MDA5 variants display more efficient filament formation on dsRNA and high basal signaling activities in the absence of viral infection (Rice et al., 2014). Two possibilities are conceivable to explain the gain-of-function (GOF) activities of these variants. One possibility is that the GOF mutations release auto-repression of 2CARD, thereby activating antiviral signaling in a ligand-independent manner (Funabiki et al., 2014; Oda et al., 2014). The other possibility is that the GOF mutations allow misrecognition of cellular RNAs, resulting in self-triggered signaling (Rice et al., 2014).
We here used a combination of biochemical and cellular assays to investigate the role of cellular RNAs in constitutive activation of MDA5. We developed an RNase protection assay coupled with RNA-seq and identified the endogenous ligands for MDA5, revealing a new mechanism underlying the intricate balance between self-RNA tolerance and innate immune activation. Our cell-free assay also led us to discover the previously unappreciated role of the RNA-rich cellular environment, the topic unapproachable by conventional cellular assays. Our findings offer new insights into the self vs. non-self discrimination mechanism that could potentially apply to other innate immune sensors.
Results
Basal signaling activity of GOF MDA5 is due to endogenous RNA recognition
In our efforts to investigate the two possible mechanisms for constitutive activation of MDA5 in AGS, we first examined the impact of premature truncation in MDA5 downstream to 2CARD. We argued that if autorepression release model is correct, such premature truncation would liberate 2CARD, leading to the constitutive activation of MDA5. On the other hand, endogenous RNA recognition model suggests that the loss of C-terminal domain (CTD), which is important for RNA binding (Wu et al., 2013), would lead to abrogation of its signaling activity. We chose three pre-mature termination variants in the single nucleotide polymorphism (SNP) database (Lek et al., 2016) - Q230Ter, E627Ter and E773Ter (Figure 1A). E627Ter and E773Ter were chosen because they are the two most frequent pre-mature truncations with the allele frequencies of 0.0033 and 0.0001, respectively. Q230Ter was additionally chosen as it truncates the protein immediately C-terminal to 2CARD, ensuring an exposure of 2CARD from any potential auto-repression. All three SNPs remove CTD and abrogated the signaling activity of wild-type (WT) MDA5 in response to long dsRNA mimic, polyinosinic:polycytidylic acid (pIC) (Figure 1A). None of the SNPs increased the pIC-independent signaling activity of WT MDA5 (Figure 1A). Similarly, E627Ter, the most common premature termination SNP, abrogated both the basal and RNA-dependent signaling activities of GOF MDA5 variants from AGS patients (Rice et al., 2014), of which the mutations are located upstream of the residue 627 (Figure 1A). These observations strongly argue against the notion that a release of 2CARD leads to constitutive activation of MDA5, and instead support that the high basal signaling activities of GOF variants are mediated by endogenous RNAs.
Figure 1. Basal signaling activity of gain-of-function (GOF) variants of MDA5 is mediated by endogenous RNA recognition.

(A) _IFN_β reporter activity of wild-type (WT) and GOF MDA5 (R337G, D393V and G495R), with and without premature truncation mutations. Right: a western blot of ectopically expressed, FLAG-tagged MDA5.
(B) Schematic of MDA5 2CARD fused to zinc finger domain (ZF) of Zif268 and DNA oligos containing tandem repeats of the ZF binding site (ZBS).
(C) _IFN_β reporter activity of 2CARD-ZF and oligomerization-deficient mutant (m2CARD-ZF, A20K/R21E) in the presence and absence of DNA with 1–4 repeats of ZF-binding sequence (ZBS, GCGTGGGCG) (Jamieson et al., 1996). Right: a western blot of indicated proteins.
(D) Effect of co-expression of dsRNA binding proteins, NS1 and E3L, on the _IFN_β reporter activity of G495R (a GOF MDA5 variant) and GST-2CARD. The dsRNA binding-deficient mutants, mNS1 and mE3L, were used as controls. Right: a western blot of indicated proteins.
All cellular assays were performed in 293T cells. Data are represented as mean ± SD (n=3) for (A), (C) and (D). See also Figure S1.
The abrogation of antiviral signaling by premature truncation of MDA5 was in apparent conflict with the conventional notion that isolated 2CARD is sufficient for signaling. This notion however, needs revision; a side-by-side comparison showed that the signaling activity of isolated 2CARD is significantly lower than pIC-induced full-length MDA5 activity (Figure S1A). This is despite the fact that 2CARD is expressed at a markedly higher level than full-length MDA5 (Figures S1B and S1C). 2CARD fused to a dimeric protein, GST, showed a higher signaling activity than 2CARD alone (Figure S1A), suggesting that bridging of 2CARD, as expected within the MDA5 filament on dsRNA, could be important for efficient signaling. In fact, artificial bridging of isolated 2CARD using a fusion protein (the zinc finger domain (ZF) that binds the ZF-binding sequence (ZBS) in DNA) and a bridging DNA rescued the signaling activity of isolated 2CARD (Figure 1C). The extent of rescue increased with the ZBS repeats. Such bridging-dependent rescue was not observed with the isolated 2CARD or mutant 2CARD (m2CARD, A20K/R21E) deficient in oligomerization (Figure 1C). These results demonstrate the importance of 2CARD bridging, further supporting the requirement of RNA-mediated MDA5 bridging for both WT MDA5 and GOF variants.
In further support of the role of endogenous RNAs in the basal signaling activity of GOF MDA5, co-expression of dsRNA-binding proteins, such as NS1 from influenza A or E3L from vaccinia virus, suppressed the basal signaling activities of GOF MDA5, but not the RNA-independent activity of GST-2CARD (Figures 1D and S1D). The dsRNA-binding deficient mutants of NS1 and E3L (R38A/K41A for mNS1 and G164V/K167T for mE3L), did not have an inhibitory effect on GOF MDA5, suggesting that the suppression was mediated by endogenous RNA sequestration. Similarly, other dsRNA binding proteins, such as Loquacious-PB (Loqs-PB) or Loqs-PD from Drosophila melanogaster, also suppressed GOF MDA5 (Figures S1E and S1F), further indicating the role of endogenous RNA in the basal signaling activity of GOF MDA5.
RNA-rich cellular environment necessitates MDA5 filament assembly on dsRNA for signaling
In our effort to investigate the endogenous ligands for GOF MDA5, we first examined the RNA structural requirement. We chose to focus on G495R, as all tested GOF variants showed similar characteristics (Figures 1 and S1). WT MDA5 is known to have high affinity for both ssRNA and dsRNA, while only dsRNA binding triggers filament formation and ATP hydrolysis (Peisley et al., 2011). Similarly, G495R also showed high affinity binding to both dsRNA and ssRNA independent of the sequence, while cooperative filament formation and ATPase activity was observed only with dsRNA (Figures 2A–2C, S2A–S2C). To examine the signaling activity upon binding to ssRNA vs. dsRNA, a conventional method would be to introduce RNA in cells expressing MDA5 by transfection and measure the signaling activity. Surprisingly, we found that different transfection methods resulted in different activities of G495R in response to ssRNA vs. dsRNA (Figures S2D and S2E). While it is unclear how the transfection methods impact the signaling outcome, it suggested artifacts introduced by transfection reagents. We therefore used the cell-free IRF3 dimerization assay (Jiang et al., 2012) as a functional assay to directly monitor the signaling process without the need for transfection. In this assay, we first formed the complex of MDA5 and RNA of interest in the presence of K63-linked polyubiquitin (K63-Ubn), which functions to stabilize the 2CARD oligomers (Jiang et al., 2012). The complex was then incubated with 35S-IRF3 in cellular extract (S1) from 293T cells, which contains MAVS and cytosolic signaling molecules. Activation of IRF3 was measured by its dimerization using native gel electrophoresis (Figure 2D).
Figure 2. RNA-rich cellular environment necessitates MDA5 filament assembly on dsRNA for signaling.

(A–C) Native gel shift assay (A), representative electron micrographs (B) and ATPase activity (C) of G495R in complex with 512-ssRNA and 512-dsRNA (see Methods for the RNA sequence). 2CARD deletion mutant (Δ2CARD) of MDA5, which is both necessary and sufficient for RNA binding, was used for all EM, native gel shift assays and ATPase assays in this study. In all comparisons, same mass concentrations (2.5, 0.6 and 0.4 ng/µl for native gel, EM and ATPase assays, respectively) of RNAs were used.
(D) Schematic of the cell-free IRF3 dimerization assay using S1 extract from 293T cells. Right: native gel showing 35S-IRF3 dimerization in the presence and absence of MDA5, dsRNA and K63-Ubn.
(E and F) IRF3 stimulatory activity of G495R in complex with an increasing concentration (0.5–50 ng/µl) of 512-ssRNA and 512-dsRNA (E), and yeast tRNA and 42-ssRNA (F).
(G) A model to explain the observed difference between dsRNA and ssRNA in stimulating the MDA5 signaling activity. On dsRNA (upper panel), cooperative filament formation allows proximity-induced oligomerization of 2CARD regardless of the level of RNA. On ssRNA (lower panel), however, receptor oligomerization occurs only when RNA is present at substoichiometric concentrations (left), but not in excess (right).
(H) IRF3 stimulatory activity of G495R in complex with stimulatory RNA (sRNA), 512-ssRNA and 512-dsRNA (both at 0.5 ng/µl), in the presence of an increasing concentration (0.5–50 ng/µl) of non-stimulatory, competitor tRNA (cRNA).
See also Figure S2.
As expected, G495R in complex with a model dsRNA (512 bp, 512-dsRNA) and K63-Ubn stimulated IRF3 dimerization, but not without dsRNA (Figure 2D). IRF3 dimerization was also stimulated by 512 nt ssRNA at a substoichiometric amount (512-ssRNA), but its stimulatory activity rapidly declined with an increasing concentration of RNA (Figure 2E). This is in contrast to 512-dsRNA, with which IRF3 stimulatory activity decreased more gradually. A similar concentration dependence was observed with RNA pairs of unrelated sequence (Figure S2F). Short ssRNA (42 nt) or compactly folded tRNA did not stimulate IRF3 at any concentration (Figure 2F). These observations led to the following model (Figure 2G). At a substoichiometric amount, long ssRNA can bridge multiple MDA5 molecules, thereby allowing proximity-induced oligomerization of 2CARD. However, this effect rapidly disappears with an increasing amount of RNA, as MDA5 would be effectively diluted due to re-distribution among the RNA molecules (Figure 2G). In the case of dsRNA, on the contrary, cooperative filament formation maintains proximity among the MDA5 molecules even with an excess of RNA (Figure S2G), allowing for a sustained signaling activity that is independent of the total RNA concentration (Figure 2G). Consistent with this notion, an excess of non-stimulatory tRNA or 42 nt ssRNA also caused more rapid decline in the IRF3-stimulatory activity with 512-ssRNA than with 512-dsRNA (Figures 2H and S2H).
Interestingly, WT MDA5 showed similar behavior (Figure S2I and S2J), suggesting that RNA-induced receptor oligomerization is a common requirement for both WT and GOF MDA5 signaling. Given the fact that there is an abundance of cellular RNAs in the cytosol, these results suggest that the RNA-rich environment would prevent aberrant oligomerization of both WT and GOF MDA5, and that filament formation on dsRNA is required for activation of both WT and GOF MDA5.
RNase protection assay as a method to enrich MDA5 agonists
To identify the endogenous dsRNA ligands for GOF MDA5, we initially employed RNA co-immunoprecipitation (co-IP) approach. However, we were unable to identify a co-IP condition that enriches even the known exogenously introduced dsRNA ligands (e.g. 512-dsRNA). In retrospect, the lack of enrichment of dsRNA is consistent with the fact that MDA5 binds dsRNA with high cooperativity. That is, co-IP would recover a few molecules of dsRNA coated with MDA5, compared to a large number of ssRNA molecules sparsely bound by MDA5. Given the fact that MDA5 distinguishes agonists from non-agonist RNAs, not by affinity but by conformation (i.e. filament formation), we developed an RNase protection assay, in which filament formation protects long stretches of dsRNA, while distributive binding on ssRNA leads to protection of short monomeric footprints (Figure 3A). We incubated isolated cytosolic RNA from 293T cells (Figure 3B) with MDA5 protein, digested with RNase A and purified the remaining RNA while removing small monomeric footprints.
Figure 3. Alu:Alu hybrids formed by IR-Alus are the primary ligands for G495R MDA5.

(A) Schematic of the RNase A protection assay. Cytosolic RNA (5 ng/µl) from 293T cells was pre-incubated with purified MDA5 G495R (150 nM), treated with RNase A, and recovered for subsequent biochemical and functional analyses (See Methods).
(B) Western blot analysis of the 293T cytosolic fraction, from which cytosolic RNA was purified.
(C and D) IRF3 dimerization (C), filament formation (D) assays with RNAs recovered from the G495R-protected digestion. CytoRNA-0.0, −0.5 and −2.0 indicate RNAs recovered after digestion with 0.0, 0.5, and 2.0 ng/µl of RNase A, respectively. Same mass concentrations (0.5 ng/µl for IRF3 dimerization and 2.0 ng/µl for EM) of RNAs were used. IRF3 dimerization was measured in the presence of an increasing concentration of competitor tRNA (cRNA, 0–8 ng/µl).
(E) RNA-seq followed by RepeatMasker analysis of cytoRNA-0.0 and cytoRNA-2.0. The table below shows averages (standard deviations in parenthesis) of two independent biological repeats.
(F) Normalized gene counts of cytoRNA-2.0 plotted against cytoRNA-0.0.
(G) Distribution of sequencing reads of cytoRNA-0.0 and cytoRNA-2.0. Two representative genes (BRI3BP and CXorf56) from the top enriched genes are shown. Thin, medium thick and thick lines represent intron, UTR and CDS, respectively, according to the GENCODE v24 annotation. Red arrows represent Alu elements according to the RepeatMasker annotation. Y-axis represents read count.
(H) Schematic of Alus in the inverted repeat (IR) configuration.
(I) Histograms of the enrichment factors of IR-Alus (gap between Alus < 1 kb) (grey) and other Alus that do not meet the IR-Alu criteria (red).
(J) Left: schematic of the in-cellulo RNase A protection assay. G495R Δ2CARD (or empty vector, EV) was ectopically expressed in 293T cells and RNase A was transiently introduced through the pore forming protein, SLO (See Methods). Right: the level of Alu RNA relative to GAPDH after in-cellulo RNase A digestion. Data represent mean ± SD (n=3).
See also Figure S3.
After 0.5–3.0 ng/µl RNase A treatment, most cytosolic RNAs were degraded to near completion without G495R MDA5 (recovery rate of < 4 % for 2 ng/µl RNase A), while a higher level of RNA (~14 %) was recovered in the presence of G495R. The size of the recovered RNA, as measured by gel analysis (Figure S3A), also showed that unprotected digestion truncates RNAs to a greater extent than MDA5-protected digestion. To examine whether the protected digestion enriches MDA5-stimulatory RNAs, we measured the ATPase, filament formation and IRF3 stimulatory activities of G495R with the RNAs recovered from protected digestion (cytoRNA-0.0, −0.5 and −2.0, generated using 0.0, 0.5, and 2.0 ng/µl RNase A, respectively) (Figures S3B, 3C & 3D). Here, ATPase activity was used as a quantitative measure of the dsRNA bound conformation. By all three measurements, we found that protected digestion significantly enriches the G495R-stimulatory activity. Unprotected digestion alone did not enrich the ATPase activity (Figure S3B).
Alu:Alu hybrids formed by Inverted Repeat Alus are the primary ligands for MDA5
To determine the identities of the G495R-stimulatory RNAs enriched by the protected digestion, we performed RNA-seq analysis on cytoRNA-0.0 (before digestion) and cytoRNA-2.0 (after protected digestion). Unprotected digestion sample could not be analyzed due to the significantly smaller size and lower yield. The cDNA libraries were generated from total RNAs in a strand-specific manner (See STAR method). Two batches of independently prepared cytoRNA-2.0 showed a good agreement (Figure S3C).
We first performed the RepeatMasker analysis (Smit et al., 2013–2015), which identifies and quantitates various families of repetitive elements independent of genome mapping. The result showed a striking enrichment of Alu element upon protected digestion, increasing from 2–3 % of the total sequence in cytoRNA-0.0 to ~67 % in cytoRNA-2.0 (Figure 3E). Alu is a ~300 nt long SINE retroelement that constitutes ~10 % of the genome. The enrichment was found for all subfamilies of Alus (Figure S3D), suggesting a contribution by a wide range of Alu-containing genes. The RepeatMasker analysis also showed ~2- and ~6-fold enrichment of LINEs and satellites, respectively (Figure 3E), but the two together represent ~3 % of cytoRNA-2.0 (in comparison to 67 % for Alu).
To examine the origins of the enriched Alu RNAs, we mapped the sequence reads onto the genome and determined individual gene counts. A comparison of gene counts in cytoRNA-0.0 vs. cytoRNA-2.0 (Figure 3F) revealed two distinct groups of genes, either completely depleted or highly enriched by the G495R-protected RNase digestion. Closer inspection of the 100 most enriched genes (fold enrichment greater than ~30, Table S1) showed that the enrichment is predominantly within Alu retroelements (Figure 3G), consistent with the RepeatMasker analysis. Most enriched Alus were found in 3’UTR (~84%) or non-coding RNA exons (~8%), accounting for ~92 % of the read counts among the top 100 genes (Table S1). About ~4 % of the enriched Alus were from introns, while the remaining ~4% were from previously unannotated antisense transcripts (to be discussed below). The minor enrichment of intronic Alu appears to reflect a minor presence of intronic Alus in the cytosol since there is little evidence of nuclear contamination (Figures 3B and S3E). Only 3 out of the top 100 enriched genes showed enrichment in non-Alu regions (Table S1). In all three cases, ~60–250 bp hairpins were predicted (RNAfold webserver), but their combined representation in gene counts was below 2 % of the top 100 enriched genes.
The enrichment was not observed with all Alus, but predominantly with those in the inverted repeat configuration (IR-Alu) that are in close proximity (<~1 kb) to each other within a single transcript (Figure 3G, Table S1). This is consistent with the fact that individual Alu RNAs do not form >40 bp duplex region, but can form a ~300 bp long Alu:Alu duplex when they occur as IR-Alu (Figure 3H) (Athanasiadis et al., 2004). In addition, genes with IR-Alus that were previously shown to form Alu:Alu hybrids (e.g. NICN1, BPNT1 and DESI1) (Chen et al., 2008; Sakurai et al., 2014) also showed enrichments exclusively within the IR-Alus (Figure S3F). A global analysis of Alus also showed more efficient enrichment of IR-Alus than other Alus that do not meet the IR-Alu criteria (with the mean fold enrichment of ~11.2 and 1.9, respectively) (Figure 3I).
Previous studies proposed the possibility of MDA5 recognizing long duplexes formed by overlapping sense and antisense transcripts of endogenous retroviruses (ERVs) (Chiappinelli et al., 2016; Roulois et al., 2015). ERVs belong to the LTR element family, and are not enriched by G495R-protected digestion (Figure 3E). A global analysis of sense and antisense transcripts also argues against other potential sense:antisense hybrids contributing to MDA5 activation. Separate mapping of the sequence reads in sense and antisense orientations revealed a 3-fold enrichment (from 2 % to 6 %) of antisense upon the G495R-protected digestion (Figure S3G). More importantly, enrichment within antisense was primarily restricted to IR-Alus, as in the sense transcripts (Figure S3H). Since sense and antisense hybridization should not be bound by Alu boundaries, this observation shows that the ~3-fold enrichment of antisense is also due to IR-Alu within the antisense forming Alu:Alu hybrids, just like in the sense RNA.
To further examine that the interaction between G495R and Alu occurs in cellular milieu, we performed the RNase protection assay in cells. We ectopically expressed G495R and introduced RNase A through a pore-forming protein, Streptolysin O (SLO) (Walev et al., 2001). We used the 2CARD-deletion construct (MDA5Δ2CARD) that can form filaments, but cannot activate signal in 293T cells (Wu et al., 2013) to ensure that RNA population remains the same as in the empty vector control. Comparison of the level of recovered IR-Alus shows a significant enrichment of Alu in the presence of G495R (500–700 fold, as normalized by GAPDH), than in its absence (40–80 fold) (Figure 3J). Altogether, these data strongly suggest that MDA5 forms filaments on IR-Alus in cells and that IR-Alus are the primary endogenous ligands for MDA5.
Alu:Alu hybrids, unlike other cellular dsRNA, can robustly stimulate MDA5 filament formation and signaling
To understand whether IR-Alu in fact stimulates MDA5 filament formation and its signaling activity, and to further define how IR-Alu differs from other cellular dsRNAs, we performed more detailed analysis for a selected group of dsRNAs. These include pre-miRNAs, solvent-exposed ribosomal RNA stem-loops (rRNA SL), IR-DNA transposon (hAT:hAT), IRLine1 (L1:L1) and IR-Alu (Alu:Alu). These were chosen based on the previous reports that they form dsRNA in cells (Chen et al., 2008; Sugimoto et al., 2015; Watanabe et al., 2008) and satisfy the minimal duplex length requirement for G495R MDA5 (>30–40 bp, Figure S4A).
We in vitro transcribed a representative RNA from each of the five dsRNA groups (see Figure S4B for details), and tested their abilities to stimulate G495R as measured by IRF3 dimerization, filament formation and ATPase assay. Among these, only Alu:Alu (from NICN1 3’UTR) supported robust IRF3 dimerization (Figure 4A). Filament formation and ATPase activity were also observed more robustly with the Alu:Alu hybrid than other dsRNAs (Figures 4B and 4C). Two other examples of Alu:Alu hybrids (from BPNT1 and DESI1 3’UTRs) also supported G495R filament formation and IRF3 dimerization (Figures 4D and S4C). The observed selectivity for Alu:Alu hybrids, among all the cellular dsRNAs tested, correlates with the degree of complementarity of the duplex (Figure S4B). To examine whether this difference applies to the general population of Alu vs. other repeat elements, we performed a genome-wide analysis of all adjacent pairs of repetitive elements (within 1 kb) that overlap with known transcripts. The result showed that over 99 % of the top ~1500 complementary pairs of repetitive elements are IR-Alus (Figure 4E). These results suggest that the reason for Alu being the primary ligand for MDA5 is not just because it is abundant, but also because of its high level of sequence conservation, which makes IR-Alu to form a more intact, complementary duplex.
Figure 4. Alu:Alu hybrids, unlike other cellular dsRNA, can robustly stimulate MDA5 filament formation and signaling.

(A) IRF3 stimulatory activity of G495R in complex with stimulatory RNAs (sRNA, 0.5 ng/µl) that represent five types of cellular dsRNAs. The activity was measured with an increasing concentration of competitor tRNA (cRNA, 0–8 ng/µl).
(B and C) ATPase activity (B) and representative electron micrographs (C) of G495R in complex with cellular dsRNAs (0.4 ng/µl for ATPase assay and 0.6 ng/µl for EM) used in (A). Data are represented as mean ± SD (n=3) for (B).
(D) Representative electron micrographs of G495R filaments formed on Alu:Alu hybrids from BPNT1 and DESI1 3’UTRs.
(E) Alignment scores between adjacent inverted repeats. Pairs of inverted repeats were ranked by the alignment scores (Y-axis), and listed in the descending order (X-axis). Two scoring systems were used for sequence alignment: default from the program Exonerate (top) and modified parameters with higher penalty for gaps (bottom). Red bars represent pairs of inverted repeats that are not Alu elements; there are 11 (top) and 5 (bottom) non-Alu pairs out of ~1500 total inverted repeat pairs. All the remaining pairs (yellow) are IR-Alus.
(F) Sequencing chromatograms of Alu:Alu hybrids (NICN1 3’UTR) before and after in vitro A-to-I modification by ADAR1. Yellow highlights indicate the positions of the modification. Note that an A-to-I-modified base is reverse transcribed as G.
(G and H) Representative electron micrographs (G) and IRF3 stimulatory activity (H) of G495R in complex with Alu:Alu hybrids (NICN1 3’UTR) before and after A-to-I modification.
See also Figure S4.
Cellular dsRNAs, including Alu:Alu hybrids, are commonly known to be post-transcriptionally modified by the adenosine deaminase, ADAR1, which converts adenosine into inosine (A-to-I) and thus weakens dsRNA integrity (Bass, 2002; Nishikura, 2010) (Figures S4D–S4F). We found that G495R formed filaments and stimulated IRF3 dimerization in complex with both modified and unmodified Alu:Alu hybrids (Figures 4F–4H). This result suggests that G495R tolerates the A-to-I modification despite showing a preference for Alu over other cellular dsRNAs with more structural irregularities. Furthermore, the observed specificity for the Alu:Alu hybrid and the tolerance to ADAR1-modification was also observed with another GOF variant from AGS patients, R779H (Figures S4G–S4K) (Rice et al., 2014). These findings suggest that Alu:Alu hybrids are common ligands for R779H and G495R.
Paired Alus, not unpaired Alus, stimulate GOF MDA5 and are abundant in cytosol
Previous studies suggested that individual, unpaired Alu RNAs (sense (+) or antisense (−) strand (Hung et al., 2015; Kaneko et al., 2011)) or a related SINE element in mice (Karijolich et al., 2015) can activate the antiviral innate immune response. In particular, a subset of Alu(+) transcribed by RNA polymerase III (pol III) were shown to be induced by viral infection and thus have a potential to amplify antiviral signals (Jang and Latchman, 1989; Karijolich et al., 2015; Williams et al., 2004). In the case of MDA5, neither Alu(+) nor Alu(−) can individually support G495R filament formation, IRF3 dimerization or ATP hydrolysis (Figures 5A–5C). In addition, the overall levels of cytosolic Alu RNAs were largely unaffected by Sendai viral infection in various cell types (Figures S5A and S5B), consistent with the notion that cytosolic Alus are primarily from various pol II transcripts (UTRs of mRNAs).
Figure 5. Paired Alus, not unpaired Alus, stimulate GOF MDA5 and are abundant in cytosol.

(A–C) Representative electron micrographs (A), IRF3 stimulatory activity (B), and ATPase activity (C) of G495R in complex with the sense (+) or antisense (−) strand of Alu from the NICN1 3’UTR.
(D) Schematic of the RNase H-based method to selectively cleave unpaired, but not paired Alu RNAs.
(E) Gel analysis of the RNase H assay. In vitro transcribed Alu RNAs (from NICN1 3’UTR) were subjected to the RNase H assay as described in (D). An oligo targeting GAPDH (αGAPDH) was used for negative controls.
(F) Quantitation of Alu:Alu hybrids in cytosolic RNA. The RNase H assay in (D) was performed using purified cytosolic RNA from 293T cells, and remaining Alu(+) and Alu(−) were quantitated relative to the spike-in control.
(G) The levels of Alu(+), Alu(−), GAPDH and ACTB (right) relative to the spike-in control before and after the RNase A protection assay. CytoRNA-0.0, −0.5 and −2.0 indicate RNAs recovered after digestion with 0.0, 0.5 and 2.0 ng/µl RNase A in the presence or absence of G495R.
Data represent mean ± SD (n=3) for (C), (F) and (G). See also Figure S5.
We next asked how abundant Alu:Alu hybrids are in the cytosol. Although a previous study showed the role of IR-Alu in 3’UTR in promoting mRNA nuclear retention (Chen et al., 2008), the levels of paired and unpaired Alus have not been quantitatively examined to date. We noted that structure-sensitive RNases (e.g. RNase I or III) are not suitable for such quantitation because of the conserved secondary structures within unpaired Alu RNAs and mismatches/bulges within paired Alu:Alu hybrids. Therefore, we developed a new strategy that takes advantage of the fact that only unpaired Alus, but not paired ones, can hybridize to DNA oligos (αAlu(+) and αAlu(−)) complementary to a conserved, unstructured region of Alu(+) or Alu(−) (Figure 5D). Once hybridized to DNA, unpaired Alu can be selectively cleaved with RNase H (Figure 5E), and uncleaved Alu RNAs (i.e. paired Alu:Alu) can be quantitated by RT-qPCR using primers that flank the RNase H cleavage site (Figure 5D). The RNase H assay using purified cytosolic RNA from 293T cells showed that ~20 % of Alu(+) and ~40–50 % of Alu(−) have inaccessible DNA target site (Figures 5F and S5C). Given that Alu(+) is present in ~2–3 fold excess over Alu(−) in the cytosol (Figure S5A), the result showed that equivalent amounts of Alu(+) and Alu(−) are resistant to RNase H, as expected from Alu(+):Alu(−) hybrids. Introduction of a heat-cool cycle to disrupt RNA structure prior to the RNase H digestion resulted in a near complete cleavage of Alus (Figure S5D), suggesting that the observed RNase H resistance in Figure 5F is due to RNA structure, rather than a potential sequence divergence in the DNA target region. A similar RNase H resistance was observed with cytosolic fraction from 293T (which contains native cytosolic proteins) (Figure S5E) as with purified cytosolic RNA, suggesting that RNA structure is preserved during RNA purification and that cytosolic proteins have limited impact. Thus, the result suggests that ~25 % of cytosolic Alu RNA is in the form of Alu:Alu hybrids or other previously unknown RNA structures with limited DNA target accessibility.
For an independent analysis of the level of Alu:Alu hybrids in the cytosol, we took advantage of the fact the MDA5-protected RNase A digestion (in Figure 3) enriches only long dsRNAs supporting MDA5 filament formation. Here, we measured the amount of Alu relative to a spike-in control by RT-qPCR, before and after the MDA5-protected digestion (Figure 5G). Because RT-qPCR can only detect fully intact Alu, not those that are internally cleaved due to incomplete coverage of Alu:Alu hybrids by discontinuous filaments (see Figure 4), it provides a lower estimate for the Alu:Alu hybrids. The result showed that ~15–25 % of total Alu remained intact after G495R-protected digestion, whereas ~1–5% of total Alu were recovered after unprotected digestion. About 2–5% of GAPDH or ACTB mRNAs were recovered regardless of the G495R protection (Figure 5G). Altogether, both RNase H and MDA5-protected digestion experiments support that a significant portion (~15–25%) of total Alus in the cytosol are in the form of Alu:Alu hybrids.
Wild-type MDA5 has a limited ability to recognize Alu:Alu hybrids
We next asked whether Alu:Alu hybrids can also activate WT MDA5 as well as GOF MDA5. Unlike GOF MDA5, WT formed filaments infrequently and those that were formed were significantly shorter than the GOF MDA5 filaments (Figure 6A–6B). WT MDA5 also displayed little ATPase activity (Figure 6C). Interestingly, under the same condition, WT MDA5 efficiently formed filaments and hydrolyzed ATP upon binding to an artificial, perfect Alu duplex (Figures 6B and 6C). This suggests that the low reactivity of WT MDA5 with naturally occurring Alu:Alu hybrids (formed by IR-Alus) is due to the mismatches and bulges within the duplex (Figure 6A).
Figure 6. WT MDA5 is sensitive to dsRNA structural irregularities and is thus inefficient in recognizing an imperfect duplex of Alu:Alu hybrid.

(A) Schematic of Alu:Alu hybrids formed by IR-Alus in NICN1 3’UTR. Red and white half arrows indicate sense (+) and antisense (−) Alus, respectively. Below is the sequence alignment of Alu(+) (top strand) and the reverse complement of Alu(−) (bottom strand). Red # and space indicate mismatch and bulge, respectively.
(B) Representative electron micrographs of WT and G495R in complex with the naturally occurring Alu:Alu hybrids from NICN1 3’UTR (red:white arrow, top) or with an artificial perfect duplex formed by Alu(+) and its reverse complement (red:red arrow, bottom).
(C) ATPase activity of WT and G495R when bound by unpaired or paired Alus from NICN1 3’UTR. Arrows are as defined in (A and B).
(D) Representative electron micrographs of WT and G495R in complex with 512 bp dsRNA with or without 6 nt mismatch at the center.
(E) RNase I footprinting assay to examine the occupancy of the 6 nt mismatched site by WT or G495R molecules. The RNase I sensitivity was examined with an increasing concentration of MDA5 (top) or RNase I (bottom). The saturating concentration (1 µM) of MDA5 was used in the bottom to compare WT and G495R independent of their differential affinities for dsRNA.
(F and G) Representative electron micrographs (F) and ATPase activity (G) of WT and G495R in complex with A-to-I modified 512-dsRNA. Data are mean ± SD (n=3) for (C and H).
See also Figure S6.
To further examine the difference between WT MDA5 and G495R in tolerating mismatches and bulges, we used 512-dsRNA with a 6 nt mismatch or a 3 nt bulge at the center of the duplex, and tested the ability of WT MDA5 and G495R to form filaments. While both WT MDA5 and G495R formed continuous filaments on uninterrupted dsRNA, only G495R, and not WT MDA5, readily formed full-length filaments with the mismatch and bulge (Figures 6D and S6A). WT MDA5 instead formed half-length filaments, suggesting that the WT filament cannot propagate across the irregular dsRNA structure, while G495R can. This notion was further supported by the RNase I footprinting assay, in which we measured the sensitivity of the mismatched or bulged site to ssRNA-specific nuclease, RNase I, in the presence of WT or G495R MDA5. The results showed that G495R can occupy the mismatched or bulged site more efficiently than WT MDA5 (Figures 6E and S6B).
Structural irregularities are not only caused by partial complementarity, but also by ADAR1-mediated RNA modification, as discussed earlier. Comparison of 512-dsRNA before and after modification showed that, unlike G495R which tolerates A-to-I modification, WT MDA5 showed reduced ability to form filaments, hydrolyze ATP and stimulate IRF3 dimerization (Figures 6F, 6G and S6C), despite efficient binding (Figure S6D). The A-to-I modification can further suppress the filament formation on naturally occurring Alu:Alu hybrids. Although mismatches/bulges in Alu:Alu hybrids make them poor substrates for WT MDA5, high protein concentration can partially compensate for the intrinsic limitation in unmodified Alu:Alu hybrids (Figure S6E). This compensation, however, was not observed with modified Alu:Alu hybrids (Figure S6E). These results thus support that, unlike GOF MDA5, WT MDA5 does not recognize self ligands largely because of its sensitivity to structural irregularities that are common to cellular dsRNAs, and that the combination of mismatches, bulges and A-to-I modifications synergize to restrict self RNA recognition by WT MDA5.
Unmodified Alu:Alu hybrids activate wild-type MDA5 under the ADAR1-deficiency
Previous studies showed that ADAR1-deficiency can cause auto-inflammatory diseases through aberrant activation of WT MDA5 (Rice et al., 2010; Liddicoat et al., 2015; Mannion et al., 2014; Pestal et al., 2015), and this can be recapitulated in various cell lines (Li et al., 2017; Pestal et al., 2015) as shown in Figure 7A (ADAR1-WT and -KO refer to ADAR1-sufficient and -deficient 293T cells, respectively). Our findings in Figure 6 that A-to-I modifications suppress filament formation of WT MDA5 support the previous speculation that aberrant activation of MDA5 under the ADAR1-deficiency is caused by recognition of unmodified cellular RNAs. In further support of the role of cellular RNA, co-expression of an RNA binding protein, influenza NS1, but not its RNA binding-deficient mutant (mNS1) abrogated the basal signaling activity of MDA5 in ADAR1-KO (Figure 7A). These data thus provide a strong support for the endogenous RNA-mediated activation of WT MDA5 in ADAR1 deficient cells.
Figure 7. Unmodified Alu:Alu hybrids activate wild-type MDA5 under the ADAR1-deficiency.

(A) The _IFN_β reporter activity of WT MDA5 and GST-2CARD in the presence or absence of NS1/mNS1 in ADAR1-WT and -KO cells.
(B) RNA-seq followed by RepeatMasker analysis of cytoRNA-0.0 and cytoRNA-2.0, which were generated by WT MDA5-protected digestion of ADAR1-KO cytosolic RNAs. The numbers represent averages (standard deviations in parenthesis) of the two independent biological repeats.
(C) Distribution of sequencing reads of cytoRNA-0.0 and cytoRNA-2.0. Two representative genes (BRI3BP and CXorf56) from the top enriched genes are shown as in Figure 3G.
(D) The level of Alu RNA relative to GAPDH after in-cellulo RNase A protection assay. WT MDA5Δ2CARD (or empty vector, EV) was ectopically expressed in ADAR1-WT or -KO cells and RNase A was introduced into the cells using SLO pores as in Figure 3J.
(E) The level of _IFN_β or MDA5 (IFIH) mRNA induction upon treatment with the IFNβ protein in ADAR1-WT and -KO cells.
(F) Sequencing chromatograms of representative IR-Alus (in PHAX 3’UTR) from ADAR1-WT and -KO cytosol before and after (24 hr post) IFNβ treatment.
(G) IRF3 stimulatory activity of WT MDA5 in complex with increasing concentration of cytosolic RNA (0.5–15 ng/µl) from ADAR1-WT and -KO cells before and after IFNβ treatment.
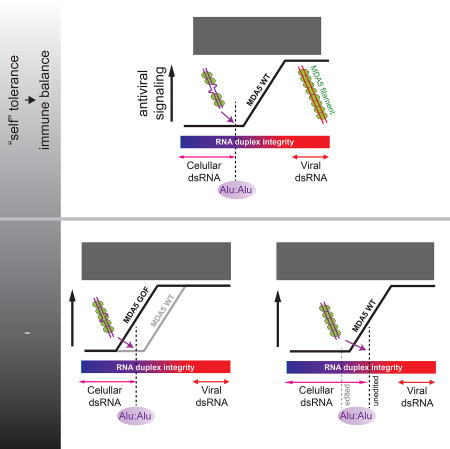
(H) A model of how Alu:Alu hybrids activate GOF MDA5 in ADAR1-sufficient cells (left) and WT MDA5 in ADAR1-deficient cells (right). In ADAR1-sufficient cells, WT MDA5 does not recognize cellular RNAs due to its sensitivity to structural irregularities caused by mismatches, bulges and A-to-I modifications. GOF mutations, however, make MDA5 less sensitive to such dsRNA structural irregularities, allowing recognition of imperfect duplexes such as Alu:Alu hybrids. In ADAR1-deficient cells, on the other hand, the lack of A-to-I modification increases the structural integrity of Alu:Alu hybrids, allowing aberrant recognition by WT MDA5.
Data represent mean ± SD (n=3) for (A), (D) and (E). See also Figure S7.
To identify the endogenous ligands for WT MDA5 in ADAR1-KO cells, we performed the RNase A protection assay followed by RNA-Seq analysis (as in Figure 3) using cytosolic RNA from ADAR1-KO cells. RepeatMasker analysis showed the enrichment of Alu from 3 % to 63 % (Figure 7B). Genome mapping analysis showed that enrichment is restricted to IR-Alus (Figure 7C) and in similar genes as found with G495R in ADAR1-WT cells (Figure S7A). The MDA5-dependent Alu protection was also observed by in-cellulo RNase A protection assay (Figure 7D). Consistent with the low level of basal signaling in ADAR1-WT cells, Alu was protected less efficiently in ADAR1-WT (Figure 7D). These results suggest that IR-Alus are the primary ligands for WT MDA5 in ADAR1-KO cells, as for G495R MDA5 in ADAR1-WT cells.
ADAR1 exists in two isoforms, p110 and p150. The p110 isoform is constitutively expressed in the nucleus, while p150 is IFN-inducible and functional in both the nucleus and cytosol (Figure S7B). A previous study showed that the p150 isoform is primarily responsible for suppressing the MDA5 activity (Pestal et al., 2015). We hypothesized that the IFN-inducibility of p150 is important because MDA5 itself is IFN-inducible (Figure S7B) and thus can form a pathologic, self-perpetuating positive feedback loop in the absence of viral infection. In other words, any stochastic increase in IFN would up-regulate MDA5, and could promote its filament formation on Alu:Alu hybrids and further induce IFN, unless ADAR1 p150 is concurrently induced to modify Alu:Alu hybrids (Figure S7G). In agreement with this notion, stimulation of ADAR1-KO cells with the IFNβ protein up-regulates the level of _IFN_β mRNA (Figure 7E). This induction occurs with delayed kinetics compared to interferon-stimulated genes (e.g. MDA5 (IFIH1), Figure S7D) and in a manner that depends on MDA5 (Figure S7E). This positive feedback loop is not mediated by any IFN-induced changes in the cytosolic RNA, as the level of Alu, its modification or MDA5-stimulatory activity did not change by the IFN treatment (Figures S7F, 7F and 7G). By contrast, ADAR1-WT cells do not show such an IFNβ positive feedback loop (Figures 7E and S7C). Unlike in ADAR1-KO cells, IFNβ treatment results in an increased level of A-to-I modifications in cytosolic IR-Alus (Figures 7F) and a concurrent decrease in the MDA5-stimulatory activity of cytosolic RNAs (Figures 7G).
Thus, the positive feedback loop in ADAR1-KO cells appears to be primarily driven by IFN-mediated up-regulation of MDA5 rather than by changes in IR-Alus. In ADAR1-WT cells, by contrast, IFN-mediated induction of ADAR1 p150 and consequent increase in A-to-I modifications cancel out the heightened signaling potential of MDA5 (Figure S7G). Altogether, these findings suggest the intricate balance between the ADAR1-mediated negative feedback and the MDA5-mediated positive feedback loop, and the central role of Alu:Alu hybrids in this immunity-tolerance balance.
Discussion
Identification of RNA ligands for proteins that multimerize on RNA is challenging as such interactions lead to minimal enrichment of the RNA ligand by the conventional co-IP approaches. Ligand identification has been particularly challenging for MDA5, which not only forms filaments on the agonist dsRNA, but also displays high affinity, non-cooperative interactions with non-agonist ssRNAs. Here, we developed the RNase protection/RNA-seq method (Figure 3) to uniquely utilize filament formation as a means to enrich the endogenous dsRNA ligand. From this analysis, we unambiguously identified that Alu:Alu hybrids are the primary ligands for MDA5 and demonstrated their key role in MDA5-mediated antiviral signaling (Figure 4). In particular, we found that what activates MDA5 are the Alu:Alu hybrids formed by IR-Alus, which are largely present in 3’UTR of retrotransposition-incompetent pol II transcripts, not the unpaired Alu elements from retrotransposition-competent pol III transcripts. This finding differs from previous studies reporting the role of individual, unpaired Alu RNAs in immune activation (Hung et al., 2015; Kaneko et al., 2011). This work thus expands the role of Alu and highlights diverse mechanisms by which Alu elements regulate immune functions.
WT MDA5 does not normally recognize Alu:Alu hybrids because it is sensitive to mismatches, bulges and A-to-I modifications that commonly occur to cellular Alu:Alu hybrids. AGS GOF mutants, however, tolerate such dsRNA structural irregularities, forming filaments on Alu:Alu hybrids and triggering aberrant antiviral signaling. While exactly how these GOF mutations confer insensitivity to dsRNA structural defect is yet unclear, we envision that any mutation that enhances the MDA5 protein:protein interaction could partially reshape imperfect dsRNA to support filament assembly. Other cellular dsRNAs, such as inverted repeats of other transposable elements, do not show the same level of MDA5-stimulatory activity because the structural irregularity in those dsRNAs exceeds the tolerance threshold for GOF MDA5. Similarly, Alu:Alu hybrids are the primary ligands for WT MDA5 under the ADAR1-deficiency. Unlike the GOF mutations in MDA5, which breaks immune tolerance by relaxing the RNA specificity of MDA5, ADAR1-deficiency increases the structural integrity of Alu:Alu thereby breaching the immune tolerance of WT MDA5 (Figure 7H). It would be interesting to study the potential role of other dsRNA interacting proteins, such as LGP2 (Bruns et al., 2014), PKR (Pham et al., 2016) and DHX9 (Aktaş et al., 2017), in MDA5:Alu interactions.
Our work highlights Alu:Alu hybrid as a unique virus-like element in the primate cytosolic RNA pool that serves as the common primary ligand for GOF MDA5 in ADAR1-sufficient cells and WT MDA5 in ADAR1-deficient cells. Given these findings, it is tempting to speculate that Alu poses evolutionary pressure on MDA5 and prevents it from further evolving into a more efficient dsRNA binder. In other words, dsRNA-recognition efficiency of human MDA5 may be optimized just enough to avoid recognition of Alu hybrids. Similarly, it is also possible that MDA5 orthologs from species that have more divergent Alu population or lack Alu elements (e.g. rodents) may have acquired different sensitivities to structural irregularities depending on the composition and structure of their own cellular dsRNAs.
Finally, our biochemical methods allowed identification of a previously unexpected role of the RNA-rich cellular environment. The results demonstrated that the key criterion for ligand discrimination is not the RNA affinity, but rather the ability to induce receptor oligomerization (Figure 2). This discrimination occurs only in the context of the RNA-rich cellular environment, which serves as a pool of competitor RNAs that dilute MDA5 molecules and prevent formation of an aberrant signaling complex on non-agonist RNAs. Considering that all cytosolic innate immune receptors function in the background of abundant self molecules, of which the chemical space often overlaps with that of non-self molecules, our findings provide a model of how the self-rich environment participates in ligand discrimination.
STAR*Methods
Contact for reagent and resource sharing
Further information and requests for reagents may be directed to, and will be fulfilled by the corresponding author Sun Hur (Sun.Hur@childrens.harvard.edu).
Experimental Model and Subject Details
Cell Lines
HEK293T (wild type and ADAR-KO were gifts from Dr. D. Stetson, Univ. of Washington) (Pestal et al., 2015), A459 (gift from Dr. A. Goldfeld, Harvard Medical School) and U87MG cells (ATCC) were maintained in DMEM (High glucose, L-glutamine, Pyruvate) (Cellgro) supplemented with 10% fetal bovine serum, 1% penicillin/streptomycin. THP-1 cells (gift from Dr. J. Kagan, Harvard Medical School) were maintained in RPMI-1640 (GE Healthcare) supplemented with 10% heat-inactivated fetal bovine serum, 1% penicillin/streptomycin. All cells were grown at 37°C in a 5% CO2 humidified atmosphere. The sex of HEK293T cell line is female while THP-1, A549 and U87MG cell lines are male.
Method details
Protein expression and purification
Human MDA5 and their variants were purified as previously reported (Peisley et al., 2011). Briefly, proteins were expressed from pET50b (Novagen) as a 6xHis tagged NusA fusion protein in BL21(DE3) at 20°C for 16–20 hr following induction with 0.5 mM IPTG. Cells were lysed by high-pressure homogenization using an Emulsiflex C3 (Avestin), and proteins were purified by a combination of Ni-NTA and heparin affinity chromatography and size exclusion chromatography (SEC) in buffer A (20 mM HEPES pH 7.5, 150 mM NaCl, and 2 mM DTT). The NusA-tag was removed by HRV 3C cleavage for all proteins.
For ADAR1 purification, HEK293T cells were transfected with pEBG plasmid expressing GST-ADAR1(p110) fusion protein. The cells were homogenized 60 hr post-transfection in the lysis buffer (50 mM Tris pH 8.0, 500 mM KCl, 10% glycerol, 5 mM BME and 1X mammalian ProteaseArrest GBiosciences) and the GST-tagged protein was purified using Glutathione Sepharose beads (GE Life Sciences).
K63-Ubn was synthesized as previously reported (Dong et al., 2011). Briefly, mouse E1, human Ubc13, Uev1a and ubiquitin were purified from BL21(DE3), and were incubated in the following reaction condition overnight at 37°C. The reaction contained 0.4 mM ubiquitin, 4 µM mE1, 20 µM Ubc13 and 20 µM Uev1a in a buffer, 10 mM ATP, 50 mM Tris pH 7.5, 10 mM MgCl2, 0.6 mM DTT. Synthesized K63-Ubn chains were then diluted 5-fold into 50 mM ammonium acetate pH 4.5, 0.1 M NaCl and separated over a 45 ml 0.1–0.6 M NaCl gradient in 50 mM ammonium acetate pH 4.5 using a Hi-Trap SP FF column (GE Healthcare). High molecular weight fractions were applied to an S200 10/300 column equilibrated in 20 mM HEPES pH 7.5, 0.15 M NaCl.
RNA preparation
The templates for all RNAs were generated by PCR amplification. The sequences of 512-ssRNA and 512-ssRNA’ were derived from the first 500 nucleotides of the MDA5 gene and bacteriophage T7 RNA polymerase gene, respectively, flanked by 5’gggaga and tctccc3’. Sequences of all the other RNAs are shown in Table S2. The templates for these cellular RNAs were PCR amplified from cDNA of ADAR1-KO 293T (gift from Dr. D. Stetson, Univ. of Washington) using the indicated primers in Table S3. All RNAs were prepared by T7 in vitro transcription and PAGE purification as previously described (Peisley et al., 2011). For dsRNA preparation, sense and antisense strands were generated by separate transcription, followed by annealing in 20 mM HEPES pH 7.5 and 50 mM NaCl. Pre-let7d, ES27L and L1:L1 hybrid were generated as a single strand hairpin as annealing of individual strands was inefficient.
The A-to-I modification reaction was carried out by mixing 100 ng/µl dsRNA with 400 ng/µl GST-ADAR1 (p110) in 50 mM HEPES pH 7.5, 2.5 mM MgCl2 at 37°C for 2.5–3 hr. The modified RNA was purified using QIAquick PCR Purification Kit (Qiagen) and the modification was confirmed by reverse transcription (RT) followed by sequencing.
Electrophoretic Mobility Shift Assay (EMSA)
Assays were performed as previously reported (Peisley et al., 2011). Briefly, RNA (2.5 ng/µl) was incubated with protein (100 – 300 nM) in buffer B (20 mM HEPES pH 7.5, 150 mM NaCl, 1.5 mM MgCl2 and 2 mM DTT) at 22°C for 10 min, and the complex was analyzed on Bis-Tris native PAGE (Life Technologies) after staining with SybrGold stain (Life Technologies). SybrGold fluorescence was recorded using the scanner FLA9000 (Fuji) and analyzed with Multigauge (GE Healthcare).
ATP hydrolysis Assay
The ATP hydrolysis activity was measured using Green Reagent (Enzo Life Sciences). MDA5Δ2CARD (300 nM) was pre-incubated with RNA (0.4 ng/µl) in buffer B, and the reaction was initiated by addition of 2 mM ATP at 37°C. Aliquots (10 µl) were withdrawn before and 15 min after ATP addition, and were quenched with 100 mM EDTA on ice. The Green Reagent (90 µl) was added to the quenched reaction at a ratio of 9:1, and OD650 was measured using a Synergy2 plate reader (BioTek).
Electron microscopy
MDA5Δ2CARD (450 nM) was incubated with RNA (0.6 ng/µl regardless of its length) in buffer B for 10 min at 22°C followed by addition of 1 mM ADP•AlFx on ice. ADP•AlFx was prepared by mixing ADP, AlCl3 and NaF in a molar ratio of 1:1:3. Prepared filaments were adsorbed to carbon-coated grids (Ted Pella) and stained with 0.75% uranyl formate as described (Ohi et al., 2004). Images were collected using a Tecnai G2 Spirit BioTWIN transmission electron microscope at 30,000x or 68,000x magnification.
IFNβ promoter luciferase reporter assay
HEK293T cells were maintained in 48-well plates in Dulbecco’s modified Eagle medium (Cellgro) supplemented with 10% fetal calf serum and 1% penicillin/streptomycin. At ~95% confluence, cells were transfected with pFLAG-CMV4 plasmids encoding NS1 or E3L (20, 50, 100 ng), MDA5 (10 ng) or GST-2CARD (100 ng), IFNβ promoter driven firefly luciferase reporter plasmid (100 ng) and a constitutively expressed Renilla luciferase reporter plasmid (pRL-CMV, 10 ng) by using lipofectamine2000 (Life) according to the manufacturer’s protocol. Empty vector was used to maintain the total amount of DNA and lipofectamine constant. In the experiments requiring RNA stimulation, the medium was changed 6–8 hr after the first transfection and the cells were additionally transfected with RNA (0.2 µg, Invivogen). Cells were lysed ~20 hr post-stimulation and IFNβ promoter activity was measured using the Dual Luciferase Reporter assay (Promega) and a Synergy2 plate reader (BioTek). Firefly luciferase activity was normalized against Renilla luciferase activity.
Cell-free IRF3 dimerization assay
This assay protocol was modified from the one described previously (Jiang et al., 2012). HEK293T cells were homogenized in hypotonic buffer (10 mM Tris pH 7.5, 10 mM KCl, 0.5 mM EGTA, 1.5 mM MgCl2, 1 mM sodium orthovanadate, 1X mammalian ProteaseArrest GBiosciences) and centrifuged at 1000g for 5 min to pellet the nuclei. The supernatant (S1), containing the cytosolic and the mitochondrial fractions, was used for in vitro IRF3 dimerization assay. The stimulation mix for IRF3 activation was prepared by mixing 10–12.5 ng/µl MDA5, 3.1 ng/µl K63-Ubn in the presence or absence of indicated amounts of RNA and pre-incubated at 4°C for 30 min in (20 mM HEPES pH 7.4, 4 mM MgCl2 and 2 mM ATP). 35S-IRF3 was produced by in vitro translation using T7 Coupled Reticulocyte Lysate System (Promega) according to manufacturer’s instructions. The IRF3 activation reaction was carried out by adding 1.5 µl of stimulation mix to 15 µl reaction mixture containing 10 µg/µl of S1, 0.5 µl 35S-IRF3 in (20 mM HEPES pH 7.4, 4 mM MgCl2 and 2 mM ATP) and incubated at 30°C for 1 hr. Subsequently, the samples were centrifuged at 18,000g for 5 min and the supernatant subjected to native PAGE analysis as in Ref (Iwamura et al., 2001) (except 9% native Tris-glycine gels were prepared in-house and the cathode chamber buffer contained 0.4% sodium deoxycholate) followed by autoradiography and phosphorimaging (FLA9000, Fuji) for visualization of IRF3 dimerization.
RT-qPCR
Total RNAs were extracted using TRIzol reagent (Thermo Fisher) and cDNA was synthesized using High Capacity cDNA reverse transcription kit (Applied Biosystems) according to the manufacture’s instruction. Real-time PCR was performed using a SYBR Green Master Mix (Applied Biosystems), the StepOne™ Real-Time PCR Systems (Applied Biosystems) and the primers (Table S3). 18S rRNA was used as the internal normalization control.
For cytosolic Alu quantitation, the following method was used. Cytosolic RNA was extracted using RNeasy Mini Kit (Qiagen) according to the manufacturer’s protocol with the exception of spinning down the lysate at 6000_g_ for 15 min at 4°C to remove mitochondria and other organelles. Purified cytosolic RNA was mixed with a 500 bp DNA fragment containing part of the T7 RNA polymerase gene (spike-in control), 10 µM RT primer (AluConsF for Alu(−) and AluConsR1/2 for Alu(+)) in 2 mM EDTA, and heated at 95°C for 5 min, followed by cooling down to 4°C for 2 min. The 1st strand cDNA synthesis was performed by incubating the RNA+primer mix with the reverse transcriptase in the RT buffer at 37°C for 2 hr according to the manufacture’s instruction (High Capacity cDNA kit, Applied Biosystems). 1st strand cDNA was purified using QIAquick PCR Purification Kit (Qiagen) and treated with RNaseA (Sigma) in 1X RT buffer at 37°C for 30 min. For the 2nd strand DNA synthesis, the reaction was incubated with Klenow (0.15 unit/µl), 2 µM primer (AluConsF for Alu(+) and AluConsR1/2 for Alu(−)) and dNTP (0.2 mM each) at 37°C for 30 min. cDNA was subsequently purified using QIAquick PCR Purification Kit (Qiagen) and subjected to qPCR using AluConsF and AluConsR1/2 primers and Power SYBR Green PCR Master Mix (Applied Biosystms). The Alu level was normalized against the spike-in control T7-Pol (to account for the sample loss during purifications) and then against 18S rRNA (internal control).
For IFNβ treatment assays, 10 ng/ml of IFNβ was added to the culture medium. At indicated hours post treatment, cells were lysed with RLN buffer and the RNA was extracted using RNeasy Mini Kit (Qiagen). Purified RNA was then used for RT-qPCR.
For SeV infection assays, 200 HA units/ml of Sendai/Cantell strain virus was added with 0.2% Trypsin and serum-free DMEM into the cells. The medium was changed into fresh DMEM containing 10% FBS at 1 hour post infection. At 24 hours post infection, cells were lysed with RLN buffer and the RNA was extracted using RNeasy Mini Kit (Qiagen). The purified RNA was then used for RT-qPCR.
RNase A protection assay
Cytosolic RNA (5 ng/µl) purified from 293T cells (either ADAR1-sufficient or –deficient cells) was pre-incubated with MDA5Δ2CARD (150 nM) or buffer alone at 22°C for 10 min in (20 mM HEPES pH 7.5, 50 mM NaCl, 2 mM MgCl2 and 2 mM DTT) followed by addition of RNase A (0–3 ng/µl) and incubation for another 5 min at 22°C. The RNase A digestion was quenched by adding three volumes of TRIzol reagent (Thermo Fisher) and the RNA was purified with Directzol RNA miniprep kit (Zymo Research) using manufacturer’s protocol. The extracted RNA was further purified using QIAquick PCR purification kit (Qiagen) to remove small digestion products. The final RNA was used for the cDNA library preparation or biochemical/functional assays.
For in-cellulo RNase A protection assay, 293T cells were transfected in a six-well plate with 1.0 µg pFLAG-CMV4 plasmid expressing MDA5Δ2CARD (or empty vector for control samples) at about 80% confluency. About 20–22 hrs post-transfection, the cells were permeabilized with 200 ng/ml Streptolysin O (Sigma) in 1 ml Hank's Balanced Salt Solution (HBSS) (Thermo Fisher) at 37°C for 15 min. After permeabilization, the cells were allowed to cool down to 15°C for 5 min before adding RNase A (0.05 mg/ml) and further incubating the digestion reaction for 15 min at 15°C. The reaction was quenched with TRIzol reagent (Thermo Fisher), followed by RNA purification with Directzol RNA miniprep kit (Zymo Research) according to the manufacturer’s protocol. The extracted RNA was further purified using QIAquick PCR purification kit (Qiagen) to remove small digestion products. The final RNA was used for RT-qPCR-based quantitation.
RNA-seq cDNA library preparation & analysis
RNAs recovered from the RNase A protection assay (cytoRNA-0.0 and −2.0) were treated with DNase I (New England Biolabs) to remove any DNA contaminations and concentrated by RNA clean & concentrator kit (Zymo Research). Following depletion of rRNA using Next rRNA-depletion kit (New England Biolabs), 100 ng RNA was used for the cDNA library construction using Smarter Stranded RNA-seq Kit (Clontech) according to the manufacturer’s instructions, with the following modifications. For RNA fragmentation, cytoRNA-0.0 was heated at 94°C for 3 min in the presence of 5× First-Strand Buffer, while cytoRNA-2.0 were heated at 94°C for 1 min without the buffer. All RNA samples were then cooled on ice for 2 min, before proceeding to the random primer-primed RT reaction. For the first-strand cDNA purification using SPRI Ampure Beads (Beckman Coulter), the volume ratio of bead solution to DNA was 1:1 for cytoRNA-0.0, 0.8:1 for cytoRNA-2.0. 15 PCR cycles were used for cytoRNA-0, while 18 cycles were used for cytoRNA-2.0. For the library purification using SPRI Ampure Beads, the volume ratio of bead solution to DNA was 0.8:1 for all samples.
The cDNA libraries were quality controlled by TapeStation (Agilent Genomics) and SYBR qPCR assays (Kapa). The cDNA libraries for cytoRNA-0.0 and cytoRNA-2.0 were pooled at a molar ratio of 1:1. In addition, phiX spike-in control was added to a final molar ratio of 15–20%, to improve sequence diversity. ~6 pM of cDNA libraries were sequenced using paired-ended 150 bp reads on an illumina Miseq V2. The quality control and Miseq reaction were performed at Biopolymer Facility (Harvard Medical School). By using the Smarter Stranded RNA-seq kit, read 1 was derived from the sense strand of input RNA and read 2 was from the antisense strand. About 3–9 million reads were obtained for each of cytoRNA-0.0 and cytoRNA-2.0.
The raw sequence files were pre-processed using Trimmomatic v 0.33 (Bolger et al., 2014) to trim Illumina adaptor sequences and low quality bases. RepeatMasker 4.0.7 analysis (http://www.repeatmasker.org) was performed on the trimmed reads against the primate repeat element database using rmblast as a search engine. In parallel, the trimmed reads were aligned against the human genome (UCSC hg38) using STAR aligner v. 2.5.2a (Dobin et al., 2013). Htseq-count was used to count gene reads uniquely mapped to the nuclear genes. Normalized gene counts were calculated by dividing the gene counts of individual genes by the total number of gene counts in each sample. Fold enrichment was calculated by dividing the normalized gene counts of cytoRNA-2.0 by those of cytoRNA-0.0. Table S1 was based on the averaged normalized gene counts for two independent biological repeats. For sense and antisense analyses, strandness of reads were determined from the alignments using RSeQC python package version 2.6.4 (Wang et al., 2012) using the script infer_experiments.py with sample size greater than the number of reads in the input bam file and a reference gene model. Reads that are unmapped, low quality, with duplicates or multiple mappings, or not primary were excluded from the analysis. IGV 2.3 (Thorvaldsdóttir et al., 2013) was used to visualize read counts against the genome.
Genome-wide search for invert repeats in transcribed regions
112,444 intervals were extracted from the UCSC Genome Browser to be marked as repeat elements by RepeatMasker and to have at least 80 % overlap with any transcript annotated in GENCODE v. 24 (wgEncodeGencodeCompV24). From these, 110,264 pairs of adjacent repeats were identified with separation less than 1,000 bp (i.e., the end of the first interval is within 1,000 bp upstream of the beginning of the second interval). Note that each repeat was allowed to form multiple pairs with adjacent repeats. Each pair of repeats was then aligned locally in an anti-parallel manner by the Smith-Waterman algorithm using the program Exonerate (Slater and Birney, 2005). Two different penalty scores were used for gap opening and extension (1) 12 for gap opening and 4 for gap extension (default); (2) 15 for gap opening and 10 for gap extension. The second set of parameters generated shorter alignments with fewer/shorter gaps. After alignment, pairs whose alignment chunks are separated by more than 1,000 bp and the raw alignment scores are below 500 were removed. There were a total of 1,610 inverted repeat pairs using the default gap penalty scores, all but 12 of which were pairs of Alu elements; there were a total of 1,374 inverted repeat pairs using the modified gap penalty scores, all but 6 of which were pairs of Alu elements. The raw alignment scores above 500 were plotted in Figure 4E.
Quantitation of paired Alu:Alu hybrids
Purified cytosolic RNA (0.2 µg/µl) or cytosolic extract was mixed with the 0.1 µg/µl DNA oligos (RNaseH_Alu1_20a/b/c for Alu(+); RNaseH_Alu2_20a/b/c/d for Alu(−); and GAPDH_rv for GAPDH) in 1X RNaseH Buffer (New England Biolabs). RNaseH (0.25 unit/µl, New England Biolabs) was added to the reaction and incubated at 37°C for 30 min. RNA was purified by Direct-zol RNA MiniPrep Kit (Zymo Research) and treated with DNase I (0.12 unit/µl, New England Biolabs) to remove the oligos. RNA was again purified with QIAquick PCR Purification Kit (Qiagen) and was subjected to RT-qPCR as described in the previous section. A heat-cool cycle was added for the experiment in Figure S5D, wherein the RNA+primer premix was heated to 95°C for 5 min in the presence of 2 mM EDTA and then cooled down to 4°C for 2 min before proceeding to RNase H digestion.
RNase I footprinting assay
RNA (2 ng/µl) was incubated with saturating amounts of MDA5Δ2CARD (1 µM) in buffer B at 22°C for 10 min before treatment with increasing amounts (0–50 U/ml for 6 nt mismatch RNA and 0–500 U/ml for 3 nt bulge RNA) of RNase If (New England Biolabs). For MDA5 titration, the RNA was incubated with 0–1 µM MDA5Δ2CARD before adding 5 U/ml of RNase If (New England Biolabs). After 30 min at 22°C, the digestion reaction was quenched with 50 mM EDTA followed by proteinase K (New England Biolabs) digestion of bound protein for 20 min at 22°C. The samples were then run on Bis-Tris native PAGE (Life Technologies) followed by staining with SybrGold stain (Life Technologies). The RNA cleavage was detected using SybrGold fluorescence (FLA9000, Fuji) and analyzed with Multigauge (GE Healthcare).
Data Resources
The accession number for the sequencing data reported in this paper is GEO: GSE103539
Supplementary Material
1
Figure S1. Basal signaling activity of gain-of-function (GOF) variants of MDA5 is mediated by endogenous RNA recognition. Related to Figure 1.
(A) Comparison of the _IFN_β reporter activity of pIC-stimulated full-length MDA5 and isolated 2CARD with or without GST fusion.
(B) Relative protein expression level of full-length MDA5, 2CARD and GST-2CARD in 293T cells using the indicated mass amount of the expression plasmid. Molar protein level was measured by quantitative western blot in (C).
(C) Quantitative western blots used for (B). The protein levels in the 293T lysate were compared against the standard curve of the purified protein.
(D) Relative _IFN_β reporter activities of two additional GOF variants, R337G and R779H (Rice et al., 2014), with and without co-expression of influenza A NS1, vaccinia virus E3L, and their RNA binding-deficient mutants (mNS1 and mE3L).
(E) The impact of dsRNA binding proteins, Loqs-PB and Loqs-PD, from Drosophila melanogaster on the basal signaling activities of G495R or GST-2CARD. Relative _IFN_β reporter activity was measured in the absence of exogenously introduced RNA.
(F) Relative _IFN_β reporter activities of R337G and R779H, with and without co-expression of Loqs-PB and Loqs-PD, as in (E).
All cellular assays were performed in 293T cells. Data are represented as mean ± SD (n=3) for all except for (C), in which data are mean ± SD (n=2).
9
Table S1. List of top 100 most enriched genes (non-ribosomal RNAs), Related to Figure 3.
10
Figure S2. Both G495R and WT MDA5 must form filaments on dsRNA to activate antiviral signaling in the RNA-rich environment. Related to Figure 2.
(A) Native gel shift assay of 512-ssRNA’ and 512-dsRNA’ (see Methods for the RNA sequence) with an increasing concentration of G495R (100–300nM). RNAs were visualized by SybrGold stain.
(B–C) Representative electron micrographs (B) and ATPase activity (C) of G495R in complex with 512-ssRNA’ and 512-dsRNA’. Same mass concentrations of RNAs (0.6 ng/µl and 0.4 ng/µl for EM and ATPase assay, respectively) were used.
(D) Left: Relative _IFN_β reporter activity of WT MDA5 and G495R in 293T cells upon transfection of sense (+) and antisense (−) of 512-ssRNA, 512-dsRNA and pIC using lipofectamine MessangerMax. Right: signaling activity was also examined by qPCR analysis of the ISG15 gene, which agrees with the reporter activity. There was a strong activation of G495R by 512-ssRNA(+) and 512-ssRNA(−), while WT MDA5 did not show any activity against these RNAs. This was an unexpected result, and prompted us to further investigate a potential effect of the various transfection methods in (E).
(E) Relative antiviral signaling activity of G495R in 293T cells upon stimulation with 512-ssRNA(+), 512-dsRNA and pIC introduced by various lipofectamine-mediated transfection vs. electroporation. The signaling activity was measured by the level of ISG15 mRNA. The results showed that different transfection methods cause different activities of 512-ssRNA relative to 512-dsRNA or pIC. While it is unclear how this occurs, the results together point to a potential artifact of transfecting long ssRNAs into the cells. This led us to employ a cellfree IRF3 dimerization assay (in Figure 2) to more accurately compare MDA5-stimulatory activities of various RNAs without having to involve transfection.
(F) IRF3 stimulatory activity of G495R in complex with an increasing concentration (0.5–50 ng/µl) of 512-ssRNA’ and 512-dsRNA’.
(G) Representative electron micrographs of G495R (150 nM) in complex with an increasing concentration (1–100 ng/µl) of 512-dsRNA’.
(H) IRF3 stimulatory activity of G495R in complex with 512-ssRNA and 512-dsRNA (0.5 ng/µl) in the presence of an increasing concentration (0.5–50 ng/µl) of non-stimulatory competitor RNA (cRNA), 42 nt ssRNA.
(I) IRF3 stimulatory activity of WT MDA5 in complex with an increasing concentration (0.5–50 ng/µl) of 512-ssRNA and 512-dsRNA.
(J) IRF3 stimulatory activity of WT MDA5 in complex with 512-ssRNA and 512-dsRNA (both at 0.5 ng/µl) in the presence of an increasing concentration (0–8 ng/µl) of tRNA.
Data are mean ± SD (n=3) for (C)-(E).
2
Figure S3. Alu:Alu hybrids formed by IR-Alus are the primary ligands for G495R MDA5. Related to Figure 3.
(A and B) Non-denaturing TBE polyacrylamide gel (6%) analysis (A) and ATPase assay (B) with RNase A-digested samples (using the indicated amount of RNase A). RNAs were recovered and concentrated prior to gel analysis. 2.0 ng/µl RNA and 300 nM G495R was used for ATPase assay. Data are mean ± SD (n=2) for (B).
(C) Normalized gene counts of cytoRNA-2.0 (biological replicate#2) plotted against cytoRNA-2.0 (biological replicate#1). Gene counts were obtained from RNA-seq, and normalized by the total gene counts.
(D) Contributions of individual Alu subfamilies to cytoRNA-0.0 and cytoRNA-2.0, obtained by RepeatMasker analysis.
(E–F) Distribution of sequencing reads of cytoRNA-0.0 and cytoRNA-2.0. Shown are two abundant house keeping genes (ACTB and GAPDH) (E), and three representative genes (NICN1, BPNT1 and DESI1) that are known to harbor duplex forming IR-Alus in 3’UTRs (F). Thin, medium thick and thick lines in the bottom represent intron, UTR and CDS, respectively, according to the GENCODE v24 annotation. Red arrows represent Alu elements according to the RepeatMasker annotation. The complete absence of introns in ACTB and GAPDH argues against nuclear contamination.
(G) The fraction of reads mapped to sense or antisense transcripts. The sum of sense and antisense read fractions is less than 100 % because reads that are unmapped, low quality and with duplicates or multiple mappings were excluded from the analysis. The table shows averages (standard deviations in parenthesis) of the two independent biological repeats.
(H) Sequencing reads mapped to sense and antisense transcripts of PHAX, FHL2 and SLC27A1 in cytoRNA-2.0. These three genes are representative examples showing enrichment of antisense transcripts upon the protected digestion. Each sequencing reads are shown in grey line and stacked vertically. In the cases of PHAX and FHL2, both sense and antisense are enriched in cytoRNA-2.0, but the enrichment is restricted to Alu elements in both orientations. Since sense and antisense hybridization should not be bound by Alu boundaries, these observations suggest that enrichment of Alu is due to an intra-strand formation of Alu:Alu hairpins, rather than inter-strand interactions. In the case of SLC27A1, enrichment was observed primarily in antisense, corresponding to intronic Alus in the sense transcript. This should not be counted as intronic Alu as intron/exon boundaries for antisense is unknown. In fact, ~4 % of top 100 enriched genes (Table S1) showed such cases of unannotated antisense enrichment corresponding to intronic regions in sense.
3
Figure S4. Alu:Alu hybrids, unlike other cellular dsRNA, can robustly stimulate MDA5 filament formation and signaling activity. Related to Figure 4.
(A) IRF3 stimulatory activity of G495R in complex with dsRNAs of 21–62 bp (at a substoichiometric amount, 0.5 ng/µl). No competitor RNA was used in this experiment as the focus was to determine the minimal dsRNA length required to assemble signaling-competent MDA5 oligomers.
(B) Predicted secondary structures of RNAs that represent five types of cellular dsRNAs. They are pre-miRNA for let7d, a solvent-exposed rRNA stem loop (ES27L), inverted repeat of hAT DNA transposons from the OTUD7B 3’UTR, inverted repeat of Line1 (L1) retrotransposons from the NBPF1 3’UTR and inverted repeat of Alu retrotransposons from the NICN1 3’UTR.
(C) IRF3 stimulatory activity of G495R in complex with Alu:Alu hybrids from BPNT1 and DESI1 3’UTRs (both at 0.5 ng/µl) in the presence of an increasing concentration of tRNA (0–8 ng/µl).
(D) Chemical structure of A:U base-pair before and after adenosine deamination by ADAR1.
(E) SDS-PAGE analysis of GST fused ADAR1 (p110) used in this study for generating modified dsRNA.
(F) Native gel analysis of 512-dsRNA before and after A-to-I modification. Gel image was obtained using fluorescence of the acridine orange (AO) stain. Mobility shift upon the A-to-I modification indicates structural changes (i.e. partial melting) in dsRNA. It is also evident from the AO fluorescence, which changes when it is bound to dsRNA vs. ssRNA. The displayed image was generated by overlaying two fluorescence scans, one for detecting dsRNA fluorescence (green) and the other for ssRNA fluorescence (red). The dsRNA and ssRNA ladders were used as fluorescence controls.
(G) IRF3 stimulatory activity of R779H in complex with cellular dsRNA as in Figure 4A.
(H) Representative electron micrographs of R779H in complex with cellular dsRNA as in Figure 4C.
(I) ATPase activity of R779H in complex with cellular dsRNA as in Figure 4B.
(J and K) Representative electron micrographs (J) and ATPase activity (K) of R779H in complex with 512-dsRNA before and after the A-to-I modification. Same mass concentrations of RNAs (0.6 ng/µl and 0.4 ng/µl for EM and ATPase assay, respectively) were used.
Data are mean ± SD (n=3) for (I) and (K).
4
Figure S5. Quantitation of paired and unpaired Alu RNAs. Related to Figure 5.
(A) The relative RNA amount of Alu(+) and Alu(–) in cytosolic RNAs from different cell lines. The level of cytosolic Alu(+) and Alu(−) were compared to the standard curve generated with in vitro transcribed NICN1 Alu(+) and Alu(−) RNAs. The presence of ~2-fold excess of Alu(+) over Alu(−) is in agreement with the RNA-seq result (RepeatMasker analysis) of undigested samples in Figure 3.
(B) The relative amount of Alu(+) and Alu(−) in cytosolic RNAs with and without Sendai virus (SeV) infection in 293T, A549, THP1 and U87MG cell lines. Cells were harvested 24 hr post virus infection and cytosolic RNAs were analyzed by Alu strand-specific RT-qPCR, and normalized against 18S rRNA.
(C) Quantitation of Alu:Alu hybrids in the cytosolic RNA of U87MG, THP1 and A549 cells. The level of Alu was normalized against the spike-in control to accurately reflect changes after RNase H-digestion. Cytosolic RNAs were extracted and were subjected to the RNase H-mediated digestion as in Figure 5D.
(D) Schematic of the RNase H-based method to cleave all Alu RNAs independent of RNA structure. The experimental scheme was modified from that in Figure 5D by incorporating a heat-cool cycle (which disrupts the RNA structure) prior to the RNase H digestion. Right: The level of Alu RNAs were measured relative to the spike-in control as in (C).
(E) Quantitation of Alu:Alu hybrids in the 293T cytosol. The RNase H assay in Figure 5D was performed with the cytosolic fraction from 293T cells, instead of purified RNA as in Figure 5F. The RNase H-resistant Alu(+) and Alu(−) were quantitated relative to the spike-in control. Oligos targeting GAPDH (αGAPDH) were used as negative controls.
Data are represented as mean ± SD (n=3).
5
Figure S6. WT MDA5 is more sensitive to dsRNA structural irregularities than G495R. Related to Figure 6.
(A) Representative electron micrographs of WT MDA5 and G495R in complex with 512-dsRNA (0.6 ng/µl) containing a 3 nt bulge at the center.
(B) RNase I footprinting assay to examine the occupancy of the 3 nt bulged site by WT or G495R molecules. The RNase I sensitivity was examined with an increasing concentration of RNase I. The saturating concentration (1 µM) of MDA5 was used, as in the bottom panel of Figure 6E, to compare WT and G495R independent of their differential affinities for dsRNA.
(C) IRF3 stimulatory activity of WT MDA5 or G495R in complex with 512-ssRNA or 512-dsRNA (0.5 ng/µl) before and after A-to-I modification, in the presence of an increasing concentration of tRNA (0–8 ng/µl).
(D) EMSA of unmodified 512-dsRNA and A-to-I modified 512-dsRNA (m512-dsRNA) with an increasing concentration of WT MDA5 (100–300 nM). RNAs were visualized by SybrGold stain.
(E) The ATPase activity of WT MDA5 in complex with Alu:Alu hybrid (red:white arrow, from NICN1 3’UTR) before and after A-to-I modification, with an increasing concentration of MDA5 (300–900 nM). Artificial perfect duplex (red:red arrow) was used for comparison. Data are represented as mean ± SD (n=3).
6
Figure S7. Unmodified Alu:Alu hybrids activate wild-type MDA5 under the ADAR1-deficiency Related to Figure 7.
(A) Normalized gene counts of cytoRNA-2.0 from the WT MDA5-protected digestion of ADAR1-KO 293T RNAs plotted against cytoRNA-2.0 from the G495R-protected digestion of WT 293T RNAs. Gene counts were obtained from RNA-seq in Figure 7 and Figure 3, respectively, and normalized by the total gene counts.
(B) The level of endogenous MDA5 and ADAR1 proteins before and after treatment with IFNβ (10 ng/ml).
(C) The level of _IFN_β mRNA induction in various cell types 24 hr post IFNβ treatment.
(D) Time course of the MDA5 gene (IFIH1) and _IFN_β mRNA induction after treatment with the IFNβ protein in ADAR1-KO 293T cells
(E) The level of _IFN_β mRNA induction in ADAR1-KO cells upon treatment with IFNβ in the presence of siRNA targeting MDA5 (#1 and #2) or control siRNA.
(F) The relative levels of Alu(+) and Alu(−) RNAs in the cytosol of ADAR1-WT and ADAR1-KO cells with and without IFNβ treatment. Cells were harvested 24 hr post IFNβ treatment and cytosolic RNAs were analyzed by Alu strand-specific RT-qPCR, and normalized against 18S rRNA.
(G) Schematic of the proposed positive feedback loop of IFN signaling uniquely present in ADAR1-KO cells. Under the ADAR1-deficiency, any stochastic fluctuation in IFN (or environmentally triggered IFN) can lead to a pathologic, self-perpetuating positive feedback loop. This is because IFN up-regulates MDA5, leading to a more stable filament formation on unmodified Alu:Alu hybrids and consequent induction of IFNβ. This positive feedback loop, however, is blocked in the presence of ADAR1. This is because IFNβ up-regulates ADAR1 (p150) together with MDA5, converting Alu:Alu to a suboptimal ligand for WT MDA5 and thus canceling out the heightened signaling potential of MDA5.
Data are represented as mean ± SD (n=3) for (C) to (F).
7
Table S2. Sequences of Alu and other dsRNAs, Related to STAR methods.
8
Table S3. Sequences of all DNA oligonucleotides, Related to STAR methods.
Highlights.
- The RNA-rich cellular environment suppresses aberrant activation of MDA5.
- AGS mutations in MDA5 lead to its constitutive activation by cellular dsRNA.
- Alu:Alu hybrids are the primary endogenous ligands for the AGS mutant MDA5.
- Alu:Alu hybrids also activate wild-type MDA5 under the ADAR1-deficiency.
Acknowledgments
We thank Dr. D.Stetson (U of Washington) for sharing the ADAR1-KO 293T cell line, and Dr. Z.J.Chen (UT Southwestern) for assisting with IRF3 dimerization assays. S.A. is funded by Cancer Research Institute. This work was funded through NIH grants (R01AI106912, R01AI111784 and R21AI130791) and March of Dime grant to S.H.
Footnotes
Publisher's Disclaimer: This is a PDF file of an unedited manuscript that has been accepted for publication. As a service to our customers we are providing this early version of the manuscript. The manuscript will undergo copyediting, typesetting, and review of the resulting proof before it is published in its final citable form. Please note that during the production process errors may be discovered which could affect the content, and all legal disclaimers that apply to the journal pertain.
Author Contributions
S.A., X.M generated the vast majority of the presented data. S.A., X.M., F.Y., S.H. initiated the study and designed experiments. S.A., X.M., F.Y., E.G., J.-W.P. performed experiments and analyzed data. E.J., C.-Z.Z. and S.H. performed bioinformatic analysis, S.A., X.M., S.H wrote the manuscript. S.H. directed the research.
Declaration of Interests
The authors declare no competing interests.
References
- Aktaş T, Avşar Ilık İ, Maticzka D, Bhardwaj V, Pessoa Rodrigues C, Mittler G, Manke T, Backofen R, Akhtar A. DHX9 suppresses RNA processing defects originating from the Alu invasion of the human genome. Nature. 2017;544:115–119. doi: 10.1038/nature21715. [DOI] [PubMed] [Google Scholar]
- Athanasiadis A, Rich A, Maas S. Widespread A-to-I RNA editing of Alu-containing mRNAs in the human transcriptome. PLoS Biol. 2004;2:e391. doi: 10.1371/journal.pbio.0020391. [DOI] [PMC free article] [PubMed] [Google Scholar]
- Bass BL. RNA editing by adenosine deaminases that act on RNA. Annu. Rev. Biochem. 2002;71:817–846. doi: 10.1146/annurev.biochem.71.110601.135501. [DOI] [PMC free article] [PubMed] [Google Scholar]
- Bolger AM, Lohse M, Usadel B. Trimmomatic: a flexible trimmer for Illumina sequence data. Bioinformatics. 2014;30(15):2114–2120. doi: 10.1093/bioinformatics/btu170. [DOI] [PMC free article] [PubMed] [Google Scholar]
- Bruns AM, Leser GP, Lamb RA, Horvath CM. The innate immune sensor LGP2 activates antiviral signaling by regulating MDA5-RNA interaction and filament assembly. Mol. Cell. 2014;55:771–81. doi: 10.1016/j.molcel.2014.07.003. [DOI] [PMC free article] [PubMed] [Google Scholar]
- Chen LL, DeCerbo JN, Carmichael GG. Alu element-mediated gene silencing. EMBO J. 2008;27:1694–1705. doi: 10.1038/emboj.2008.94. [DOI] [PMC free article] [PubMed] [Google Scholar]
- Chiappinelli KB, Strissel PL, Desrichard A, Li H, Henke C, Akman B, Hein A, Rote NS, Cope LM, Snyder A, et al. Inhibiting DNA methylation causes an interferon response in cancer via dsRNA including endogenous retroviruses. Cell. 2016;164:1073. doi: 10.1016/j.cell.2015.10.020. [DOI] [PubMed] [Google Scholar]
- del Toro Duany Y, Wu B, Hur S. MDA5-filament, dynamics and disease. Curr. Opin. Virol. 2015;12:20–25. doi: 10.1016/j.coviro.2015.01.011. [DOI] [PMC free article] [PubMed] [Google Scholar]
- Dobin A, Davis CA, Schlesinger F, Drenkow J, Zaleski C, Jha S, Batut P, Chaisson M, Gingeras TR. STAR: ultrafast universal RNA-seq aligner. Bioinformatics. 2013;29(1):15–21. doi: 10.1093/bioinformatics/bts635. [DOI] [PMC free article] [PubMed] [Google Scholar]
- Dong KC, Helgason E, Yu C, Phu L, Arnott DP, Bosanac I, Compaan DM, Huang OW, Fedorova AV, Kirkpatrick DS, et al. Preparation of distinct ubiquitin chain reagents of high purity and yield. Structure. 2011;19:1053–1063. doi: 10.1016/j.str.2011.06.010. [DOI] [PubMed] [Google Scholar]
- Funabiki M, Kato H, Miyachi Y, Toki H, Motegi H, Inoue M, Minowa O, Yoshida A, Deguchi K, Sato H, et al. Autoimmune disorders associated with gain of function of the intracellular sensor MDA5. Immunity. 2014;40:199–212. doi: 10.1016/j.immuni.2013.12.014. [DOI] [PubMed] [Google Scholar]
- Hou F, Sun L, Zheng H, Skaug B, XJiang QX, Chen ZJ. MAVS forms functional prion-like aggregates to activate and propagate antiviral innate immune response. Cell. 2011;146:1–14. doi: 10.1016/j.cell.2011.06.041. [DOI] [PMC free article] [PubMed] [Google Scholar]
- Hung T, Pratt GA, Sundararaman B, Townsend MJ, Chaivorapol C, Bhangale T, Graham RR, Ortmann W, Criswell LA, Yeo GW, et al. The Ro60 autoantigen binds endogenous retroelements and regulates inflammatory gene expression. Science. 2015;350:455–459. doi: 10.1126/science.aac7442. [DOI] [PMC free article] [PubMed] [Google Scholar]
- Iwamura T, Yoneyama M, Yamaguchi K, Suhara W, Mori W, Shiota K, Okabe Y, Namiki H, Fujita T. Induction of IRF-3/-7 kinase and NF-kappaB in response to double-stranded RNA and virus infection: common and unique pathways. Genes Cells. 2001;6:375–388. doi: 10.1046/j.1365-2443.2001.00426.x. [DOI] [PubMed] [Google Scholar]
- Jamieson AC, Wang H, Kim S-H. A zinc finger directory for high-affinity DNA recognition. Proc. Natl. Acad. Sci. USA. 1996;93:12834–12839. doi: 10.1073/pnas.93.23.12834. [DOI] [PMC free article] [PubMed] [Google Scholar]
- Jang KL, Latchman DS. HSV infection induces increased transcription of Alu repeated sequences by RNA polymerase III. FEBS Lett. 1989;258:255–258. doi: 10.1016/0014-5793(89)81667-9. [DOI] [PubMed] [Google Scholar]
- Jiang X, Kinch LN, Brautigam CA, Chen X, Du F, Grishin NV, Chen ZJ. Ubiquitin-induced oligomerization of the RNA sensors RIG-I and MDA5 activates antiviral innate immune response. Immunity. 2012;36:959–973. doi: 10.1016/j.immuni.2012.03.022. [DOI] [PMC free article] [PubMed] [Google Scholar]
- Kaneko H, Dridi S, Tarallo V, Gelfand BD, Fowler BJ, Cho WG, Kleinman ME, Ponicsan SL, Hauswirth WW, Chiodo VA, et al. DICER1 deficit induces Alu RNA toxicity in age-related macular degeneration. Nature. 2011;471:325–330. doi: 10.1038/nature09830. [DOI] [PMC free article] [PubMed] [Google Scholar]
- Karijolich J, Abernathy E, Glaunsinger BA. Infection-induced retrotransposon-derived noncoding RNAs enhance herpesviral gene expression via the NF-kappa B pathway. PLoS Pathog. 2015;11:e1005260. doi: 10.1371/journal.ppat.1005260. [DOI] [PMC free article] [PubMed] [Google Scholar]
- Lek M, Karczewski KJ, Minikel EV, Samocha KE, Banks E, Fennell T, O'Donnell-Luria AH, Ware JS, Hill AJ, Cummings BB, et al. Analysis of protein-coding genetic variation in 60,706 humans. Nature. 2016;536:285–291. doi: 10.1038/nature19057. [DOI] [PMC free article] [PubMed] [Google Scholar]
- Li Y, Banerjee S, Goldstein SA, Dong B, Gaughan C, Rath S, Donovan J, Korennykh A, Silverman RH, Weiss SR. Ribonuclease L mediates the cell-lethal phenotype of double-stranded RNA editing enzyme ADAR1 deficiency in a human cell line. Elife. 2017;6:e25687. doi: 10.7554/eLife.25687. [DOI] [PMC free article] [PubMed] [Google Scholar]
- Liddicoat BJ, Piskol R, Chalk AM, Ramaswami G, Higuchi M, Hartner JC, Li JB, Seeburg PH, Walkley CR. RNA editing by ADAR1 prevents MDA5 sensing of endogenous dsRNA as nonself. Science. 2015;349:1115–1120. doi: 10.1126/science.aac7049. [DOI] [PMC free article] [PubMed] [Google Scholar]
- Mannion NM, Greenwood SM, Young R, Cox S, Brindle J, Read D, Nellaker C, Vesely C, Ponting CP, McLaughlin PJ, et al. The RNA-editing enzyme ADAR1 controls innate immune responses to RNA. Cell Rep. 2014;9:1482–1494. doi: 10.1016/j.celrep.2014.10.041. [DOI] [PMC free article] [PubMed] [Google Scholar]
- Nishikura K. Functions and regulation of RNA editing by ADAR deaminases. Annu. Rev. Biochem. 2010;79:321–349. doi: 10.1146/annurev-biochem-060208-105251. [DOI] [PMC free article] [PubMed] [Google Scholar]
- Oda H, Nakagawa A, Abe J, Awaya T, Funabiki M, Hijikata A, Nishikomori R, Funatsuka M, Ohshima Y, Sugawara Y, et al. Aicardi-Goutières syndrome is caused by IFIH1 mutations. Am. J. Hum. Genet. 2014;95:121–125. doi: 10.1016/j.ajhg.2014.06.007. [DOI] [PMC free article] [PubMed] [Google Scholar]
- Ohi M, Li Y, Cheng Y, Walz T. Negative staining and image classification-powerful tools in modern electron microscopy. Biol. Proced. Online. 2004;6:23–34. doi: 10.1251/bpo70. [DOI] [PMC free article] [PubMed] [Google Scholar]
- Peisley A, Jo M, Lin C, Wu B, Orme-Johnson M, Walz T, Hohng S, Hur S. Kinetic mechanism for viral dsRNA length discrimination by MDA5 filament. Proc. Natl. Acad. Sci. USA. 2012;109:E3340–3349. doi: 10.1073/pnas.1208618109. [DOI] [PMC free article] [PubMed] [Google Scholar]
- Peisley A, Lin C, Bin W, Orme-Johnson M, Liu M, Walz T, Hur S. Cooperative assembly and dynamic disassembly of MDA5 filaments for viral dsRNA recognition. Proc. Natl. Acad. Sci. USA. 2011;108:21010–21015. doi: 10.1073/pnas.1113651108. [DOI] [PMC free article] [PubMed] [Google Scholar]
- Pestal K, Funk CC, Snyder JM, Price ND, Treuting PM, Stetson DB. Isoforms of RNA-editing enzyme ADAR1 independently control nucleic acid sensor MDA5-driven autoimmunity and multi-organ development. Immunity. 2015;43:933–944. doi: 10.1016/j.immuni.2015.11.001. [DOI] [PMC free article] [PubMed] [Google Scholar]
- Pham AM, Santa Maria FG, Lahiri T, Friedman E, Marié IJ, Levy DE. PKR transduces MDA5-dependent signals for type I IFN induction. PLoS Pathog. 2016;12:e1005489. doi: 10.1371/journal.ppat.1005489. [DOI] [PMC free article] [PubMed] [Google Scholar]
- Rice GI, del Toro Duany Y, Jenkinson EM, Forte GM, Anderson BH, Ariaudo G, Bader-Meunier B, Baildam EM, Battini R, Beresford MW, et al. Gain-of-function mutations in IFIH1 cause a spectrum of human disease phenotypes associated with upregulated type I interferon signaling. Nat. Genet. 2014;46:503–509. doi: 10.1038/ng.2933. [DOI] [PMC free article] [PubMed] [Google Scholar]
- Rice GI, Kasher PR, Forte GMa, Mannion NM, Greenwood SM, Szynkiewicz M, Dickerson JE, al e. Mutations in ADAR1 cause Aicardi-Goutières syndrome associated with a type I interferon signature. Nat Genetics. 2010;44:1243–1248. doi: 10.1038/ng.2414. [DOI] [PMC free article] [PubMed] [Google Scholar]
- Roulois D, Loo Yau H, Singhania R, Wang Y, Danesh A, Shen SY, Han H, Liang G, Jones PA, Pugh TJ, et al. DNA-demethylating agents target colorectal cancer cells by inducing viral mimicry by endogenous transcripts. Cell. 2015;162:961–973. doi: 10.1016/j.cell.2015.07.056. [DOI] [PMC free article] [PubMed] [Google Scholar]
- Rutsch F, MacDougall M, Lu C, Buers I, Mamaeva O, Nitschke Y, Rice GI, Erlandsen H, Kehl HG, Thiele H, et al. A specific IFIH1 gain-of-function mutation causes Singleton-Merten syndrome. Am. J. Hum. Genet. 2015;96:275–282. doi: 10.1016/j.ajhg.2014.12.014. [DOI] [PMC free article] [PubMed] [Google Scholar]
- Sakurai M, Ueda H, Yano T, Okada S, Terajima H, Mitsuyama T, Toyoda A, Fujiyama A, Kawabata H, Suzuki T. A biochemical landscape of A-to-I RNA editing in the human brain transcriptome. Genome Res. 2014;24:522–534. doi: 10.1101/gr.162537.113. [DOI] [PMC free article] [PubMed] [Google Scholar]
- Slater GS, Birney E. Automated generation of heuristics for biological sequence comparison. BMC Bioinformatics. 2005;6:31. doi: 10.1186/1471-2105-6-31. [DOI] [PMC free article] [PubMed] [Google Scholar]
- Smit AFA, Hubley R, Green P. RepeatMasker Open-4.0.0 2013–2015 [Google Scholar]
- Sugimoto Y, Vigilante A, Darbo E, Zirra A, Militti C, D'Ambrogio A, Luscombe NM, Ule J. hiCLIP reveals the in vivo atlas of mRNA secondary structures recognized by Staufen 1. Nature. 2015;519:491–494. doi: 10.1038/nature14280. [DOI] [PMC free article] [PubMed] [Google Scholar]
- Thorvaldsdóttir H, Robinson JT, Mesirov JP. Integrative Genomics Viewer (IGV): high-performance genomics data visualization and exploration. Brief Bioinform. 2013;14(2):178–192. doi: 10.1093/bib/bbs017. [DOI] [PMC free article] [PubMed] [Google Scholar]
- Van Eyck L, De Somer L, Pombal D, Bornschein S, Frans G, Humblet-Baron S, Moens L, de Zegher F, Bossuyt X, Wuouters C, et al. IFIH1 mutation causes systemic lupus erythematosus with selective IgA deficiency. Arthritis Rheumtol. 2015;67:1592–1597. doi: 10.1002/art.39110. [DOI] [PubMed] [Google Scholar]
- Walev I, Bhakdi SC, Hofmann F, Djonder N, Valeva A, Aktories K, Bhakdi S. Delivery of proteins into living cells by reversible membrane permeabilization with streptolysin-O. Proc. Natl. Acad. Sci. USA. 2001;98:3185–3190. doi: 10.1073/pnas.051429498. [DOI] [PMC free article] [PubMed] [Google Scholar]
- Wang L, Wang S, Li W. RSeQC: quality control of RNA-seq experiments. Bioinformatics. 2012;28:2184–2185. doi: 10.1093/bioinformatics/bts356. [DOI] [PubMed] [Google Scholar]
- Watanabe T, Totoki Y, Toyoda A, Kaneda M, Kuramochi-Miyagawa S, Obata Y, Chiba H, Kohara Y, Kono T, Nakano T, et al. Endogenous siRNAs from naturally formed dsRNAs regulate transcripts in mouse oocytes. Nature. 2008;453:539–543. doi: 10.1038/nature06908. [DOI] [PubMed] [Google Scholar]
- Williams WP, Tamburic L, Astell CR. Increased levels of B1 and B2 SINE transcripts in mouse fibroblast cells due to minute virus of mice infection. Virology. 2004;327:233241. doi: 10.1016/j.virol.2004.06.040. [DOI] [PubMed] [Google Scholar]
- Wu B, Peisley A, Richards C, Yao H, Zeng X, Lin C, Chu F, Walz T, Hur S. Structural basis for dsRNA recognition, filament formation, and antiviral signal activation by MDA5. Cell. 2013;152:276–289. doi: 10.1016/j.cell.2012.11.048. [DOI] [PubMed] [Google Scholar]
Associated Data
This section collects any data citations, data availability statements, or supplementary materials included in this article.
Supplementary Materials
1
Figure S1. Basal signaling activity of gain-of-function (GOF) variants of MDA5 is mediated by endogenous RNA recognition. Related to Figure 1.
(A) Comparison of the _IFN_β reporter activity of pIC-stimulated full-length MDA5 and isolated 2CARD with or without GST fusion.
(B) Relative protein expression level of full-length MDA5, 2CARD and GST-2CARD in 293T cells using the indicated mass amount of the expression plasmid. Molar protein level was measured by quantitative western blot in (C).
(C) Quantitative western blots used for (B). The protein levels in the 293T lysate were compared against the standard curve of the purified protein.
(D) Relative _IFN_β reporter activities of two additional GOF variants, R337G and R779H (Rice et al., 2014), with and without co-expression of influenza A NS1, vaccinia virus E3L, and their RNA binding-deficient mutants (mNS1 and mE3L).
(E) The impact of dsRNA binding proteins, Loqs-PB and Loqs-PD, from Drosophila melanogaster on the basal signaling activities of G495R or GST-2CARD. Relative _IFN_β reporter activity was measured in the absence of exogenously introduced RNA.
(F) Relative _IFN_β reporter activities of R337G and R779H, with and without co-expression of Loqs-PB and Loqs-PD, as in (E).
All cellular assays were performed in 293T cells. Data are represented as mean ± SD (n=3) for all except for (C), in which data are mean ± SD (n=2).
9
Table S1. List of top 100 most enriched genes (non-ribosomal RNAs), Related to Figure 3.
10
Figure S2. Both G495R and WT MDA5 must form filaments on dsRNA to activate antiviral signaling in the RNA-rich environment. Related to Figure 2.
(A) Native gel shift assay of 512-ssRNA’ and 512-dsRNA’ (see Methods for the RNA sequence) with an increasing concentration of G495R (100–300nM). RNAs were visualized by SybrGold stain.
(B–C) Representative electron micrographs (B) and ATPase activity (C) of G495R in complex with 512-ssRNA’ and 512-dsRNA’. Same mass concentrations of RNAs (0.6 ng/µl and 0.4 ng/µl for EM and ATPase assay, respectively) were used.
(D) Left: Relative _IFN_β reporter activity of WT MDA5 and G495R in 293T cells upon transfection of sense (+) and antisense (−) of 512-ssRNA, 512-dsRNA and pIC using lipofectamine MessangerMax. Right: signaling activity was also examined by qPCR analysis of the ISG15 gene, which agrees with the reporter activity. There was a strong activation of G495R by 512-ssRNA(+) and 512-ssRNA(−), while WT MDA5 did not show any activity against these RNAs. This was an unexpected result, and prompted us to further investigate a potential effect of the various transfection methods in (E).
(E) Relative antiviral signaling activity of G495R in 293T cells upon stimulation with 512-ssRNA(+), 512-dsRNA and pIC introduced by various lipofectamine-mediated transfection vs. electroporation. The signaling activity was measured by the level of ISG15 mRNA. The results showed that different transfection methods cause different activities of 512-ssRNA relative to 512-dsRNA or pIC. While it is unclear how this occurs, the results together point to a potential artifact of transfecting long ssRNAs into the cells. This led us to employ a cellfree IRF3 dimerization assay (in Figure 2) to more accurately compare MDA5-stimulatory activities of various RNAs without having to involve transfection.
(F) IRF3 stimulatory activity of G495R in complex with an increasing concentration (0.5–50 ng/µl) of 512-ssRNA’ and 512-dsRNA’.
(G) Representative electron micrographs of G495R (150 nM) in complex with an increasing concentration (1–100 ng/µl) of 512-dsRNA’.
(H) IRF3 stimulatory activity of G495R in complex with 512-ssRNA and 512-dsRNA (0.5 ng/µl) in the presence of an increasing concentration (0.5–50 ng/µl) of non-stimulatory competitor RNA (cRNA), 42 nt ssRNA.
(I) IRF3 stimulatory activity of WT MDA5 in complex with an increasing concentration (0.5–50 ng/µl) of 512-ssRNA and 512-dsRNA.
(J) IRF3 stimulatory activity of WT MDA5 in complex with 512-ssRNA and 512-dsRNA (both at 0.5 ng/µl) in the presence of an increasing concentration (0–8 ng/µl) of tRNA.
Data are mean ± SD (n=3) for (C)-(E).
2
Figure S3. Alu:Alu hybrids formed by IR-Alus are the primary ligands for G495R MDA5. Related to Figure 3.
(A and B) Non-denaturing TBE polyacrylamide gel (6%) analysis (A) and ATPase assay (B) with RNase A-digested samples (using the indicated amount of RNase A). RNAs were recovered and concentrated prior to gel analysis. 2.0 ng/µl RNA and 300 nM G495R was used for ATPase assay. Data are mean ± SD (n=2) for (B).
(C) Normalized gene counts of cytoRNA-2.0 (biological replicate#2) plotted against cytoRNA-2.0 (biological replicate#1). Gene counts were obtained from RNA-seq, and normalized by the total gene counts.
(D) Contributions of individual Alu subfamilies to cytoRNA-0.0 and cytoRNA-2.0, obtained by RepeatMasker analysis.
(E–F) Distribution of sequencing reads of cytoRNA-0.0 and cytoRNA-2.0. Shown are two abundant house keeping genes (ACTB and GAPDH) (E), and three representative genes (NICN1, BPNT1 and DESI1) that are known to harbor duplex forming IR-Alus in 3’UTRs (F). Thin, medium thick and thick lines in the bottom represent intron, UTR and CDS, respectively, according to the GENCODE v24 annotation. Red arrows represent Alu elements according to the RepeatMasker annotation. The complete absence of introns in ACTB and GAPDH argues against nuclear contamination.
(G) The fraction of reads mapped to sense or antisense transcripts. The sum of sense and antisense read fractions is less than 100 % because reads that are unmapped, low quality and with duplicates or multiple mappings were excluded from the analysis. The table shows averages (standard deviations in parenthesis) of the two independent biological repeats.
(H) Sequencing reads mapped to sense and antisense transcripts of PHAX, FHL2 and SLC27A1 in cytoRNA-2.0. These three genes are representative examples showing enrichment of antisense transcripts upon the protected digestion. Each sequencing reads are shown in grey line and stacked vertically. In the cases of PHAX and FHL2, both sense and antisense are enriched in cytoRNA-2.0, but the enrichment is restricted to Alu elements in both orientations. Since sense and antisense hybridization should not be bound by Alu boundaries, these observations suggest that enrichment of Alu is due to an intra-strand formation of Alu:Alu hairpins, rather than inter-strand interactions. In the case of SLC27A1, enrichment was observed primarily in antisense, corresponding to intronic Alus in the sense transcript. This should not be counted as intronic Alu as intron/exon boundaries for antisense is unknown. In fact, ~4 % of top 100 enriched genes (Table S1) showed such cases of unannotated antisense enrichment corresponding to intronic regions in sense.
3
Figure S4. Alu:Alu hybrids, unlike other cellular dsRNA, can robustly stimulate MDA5 filament formation and signaling activity. Related to Figure 4.
(A) IRF3 stimulatory activity of G495R in complex with dsRNAs of 21–62 bp (at a substoichiometric amount, 0.5 ng/µl). No competitor RNA was used in this experiment as the focus was to determine the minimal dsRNA length required to assemble signaling-competent MDA5 oligomers.
(B) Predicted secondary structures of RNAs that represent five types of cellular dsRNAs. They are pre-miRNA for let7d, a solvent-exposed rRNA stem loop (ES27L), inverted repeat of hAT DNA transposons from the OTUD7B 3’UTR, inverted repeat of Line1 (L1) retrotransposons from the NBPF1 3’UTR and inverted repeat of Alu retrotransposons from the NICN1 3’UTR.
(C) IRF3 stimulatory activity of G495R in complex with Alu:Alu hybrids from BPNT1 and DESI1 3’UTRs (both at 0.5 ng/µl) in the presence of an increasing concentration of tRNA (0–8 ng/µl).
(D) Chemical structure of A:U base-pair before and after adenosine deamination by ADAR1.
(E) SDS-PAGE analysis of GST fused ADAR1 (p110) used in this study for generating modified dsRNA.
(F) Native gel analysis of 512-dsRNA before and after A-to-I modification. Gel image was obtained using fluorescence of the acridine orange (AO) stain. Mobility shift upon the A-to-I modification indicates structural changes (i.e. partial melting) in dsRNA. It is also evident from the AO fluorescence, which changes when it is bound to dsRNA vs. ssRNA. The displayed image was generated by overlaying two fluorescence scans, one for detecting dsRNA fluorescence (green) and the other for ssRNA fluorescence (red). The dsRNA and ssRNA ladders were used as fluorescence controls.
(G) IRF3 stimulatory activity of R779H in complex with cellular dsRNA as in Figure 4A.
(H) Representative electron micrographs of R779H in complex with cellular dsRNA as in Figure 4C.
(I) ATPase activity of R779H in complex with cellular dsRNA as in Figure 4B.
(J and K) Representative electron micrographs (J) and ATPase activity (K) of R779H in complex with 512-dsRNA before and after the A-to-I modification. Same mass concentrations of RNAs (0.6 ng/µl and 0.4 ng/µl for EM and ATPase assay, respectively) were used.
Data are mean ± SD (n=3) for (I) and (K).
4
Figure S5. Quantitation of paired and unpaired Alu RNAs. Related to Figure 5.
(A) The relative RNA amount of Alu(+) and Alu(–) in cytosolic RNAs from different cell lines. The level of cytosolic Alu(+) and Alu(−) were compared to the standard curve generated with in vitro transcribed NICN1 Alu(+) and Alu(−) RNAs. The presence of ~2-fold excess of Alu(+) over Alu(−) is in agreement with the RNA-seq result (RepeatMasker analysis) of undigested samples in Figure 3.
(B) The relative amount of Alu(+) and Alu(−) in cytosolic RNAs with and without Sendai virus (SeV) infection in 293T, A549, THP1 and U87MG cell lines. Cells were harvested 24 hr post virus infection and cytosolic RNAs were analyzed by Alu strand-specific RT-qPCR, and normalized against 18S rRNA.
(C) Quantitation of Alu:Alu hybrids in the cytosolic RNA of U87MG, THP1 and A549 cells. The level of Alu was normalized against the spike-in control to accurately reflect changes after RNase H-digestion. Cytosolic RNAs were extracted and were subjected to the RNase H-mediated digestion as in Figure 5D.
(D) Schematic of the RNase H-based method to cleave all Alu RNAs independent of RNA structure. The experimental scheme was modified from that in Figure 5D by incorporating a heat-cool cycle (which disrupts the RNA structure) prior to the RNase H digestion. Right: The level of Alu RNAs were measured relative to the spike-in control as in (C).
(E) Quantitation of Alu:Alu hybrids in the 293T cytosol. The RNase H assay in Figure 5D was performed with the cytosolic fraction from 293T cells, instead of purified RNA as in Figure 5F. The RNase H-resistant Alu(+) and Alu(−) were quantitated relative to the spike-in control. Oligos targeting GAPDH (αGAPDH) were used as negative controls.
Data are represented as mean ± SD (n=3).
5
Figure S6. WT MDA5 is more sensitive to dsRNA structural irregularities than G495R. Related to Figure 6.
(A) Representative electron micrographs of WT MDA5 and G495R in complex with 512-dsRNA (0.6 ng/µl) containing a 3 nt bulge at the center.
(B) RNase I footprinting assay to examine the occupancy of the 3 nt bulged site by WT or G495R molecules. The RNase I sensitivity was examined with an increasing concentration of RNase I. The saturating concentration (1 µM) of MDA5 was used, as in the bottom panel of Figure 6E, to compare WT and G495R independent of their differential affinities for dsRNA.
(C) IRF3 stimulatory activity of WT MDA5 or G495R in complex with 512-ssRNA or 512-dsRNA (0.5 ng/µl) before and after A-to-I modification, in the presence of an increasing concentration of tRNA (0–8 ng/µl).
(D) EMSA of unmodified 512-dsRNA and A-to-I modified 512-dsRNA (m512-dsRNA) with an increasing concentration of WT MDA5 (100–300 nM). RNAs were visualized by SybrGold stain.
(E) The ATPase activity of WT MDA5 in complex with Alu:Alu hybrid (red:white arrow, from NICN1 3’UTR) before and after A-to-I modification, with an increasing concentration of MDA5 (300–900 nM). Artificial perfect duplex (red:red arrow) was used for comparison. Data are represented as mean ± SD (n=3).
6
Figure S7. Unmodified Alu:Alu hybrids activate wild-type MDA5 under the ADAR1-deficiency Related to Figure 7.
(A) Normalized gene counts of cytoRNA-2.0 from the WT MDA5-protected digestion of ADAR1-KO 293T RNAs plotted against cytoRNA-2.0 from the G495R-protected digestion of WT 293T RNAs. Gene counts were obtained from RNA-seq in Figure 7 and Figure 3, respectively, and normalized by the total gene counts.
(B) The level of endogenous MDA5 and ADAR1 proteins before and after treatment with IFNβ (10 ng/ml).
(C) The level of _IFN_β mRNA induction in various cell types 24 hr post IFNβ treatment.
(D) Time course of the MDA5 gene (IFIH1) and _IFN_β mRNA induction after treatment with the IFNβ protein in ADAR1-KO 293T cells
(E) The level of _IFN_β mRNA induction in ADAR1-KO cells upon treatment with IFNβ in the presence of siRNA targeting MDA5 (#1 and #2) or control siRNA.
(F) The relative levels of Alu(+) and Alu(−) RNAs in the cytosol of ADAR1-WT and ADAR1-KO cells with and without IFNβ treatment. Cells were harvested 24 hr post IFNβ treatment and cytosolic RNAs were analyzed by Alu strand-specific RT-qPCR, and normalized against 18S rRNA.
(G) Schematic of the proposed positive feedback loop of IFN signaling uniquely present in ADAR1-KO cells. Under the ADAR1-deficiency, any stochastic fluctuation in IFN (or environmentally triggered IFN) can lead to a pathologic, self-perpetuating positive feedback loop. This is because IFN up-regulates MDA5, leading to a more stable filament formation on unmodified Alu:Alu hybrids and consequent induction of IFNβ. This positive feedback loop, however, is blocked in the presence of ADAR1. This is because IFNβ up-regulates ADAR1 (p150) together with MDA5, converting Alu:Alu to a suboptimal ligand for WT MDA5 and thus canceling out the heightened signaling potential of MDA5.
Data are represented as mean ± SD (n=3) for (C) to (F).
7
Table S2. Sequences of Alu and other dsRNAs, Related to STAR methods.
8
Table S3. Sequences of all DNA oligonucleotides, Related to STAR methods.