The mouse Gene Expression Database (GXD): 2019 update (original) (raw)
Abstract
The mouse Gene Expression Database (GXD) is an extensive, well-curated community resource freely available at www.informatics.jax.org/expression.shtml. Covering all developmental stages, GXD includes data from RNA in situ hybridization, immunohistochemistry, RT-PCR, northern blot and western blot experiments in wild-type and mutant mice. GXD’s gene expression information is integrated with the other data in Mouse Genome Informatics and interconnected with other databases, placing these data in the larger biological and biomedical context. Since the last report, the ability of GXD to provide insights into the molecular mechanisms of development and disease has been greatly enhanced by the addition of new data and by the implementation of new web features. These include: improvements to the Differential Gene Expression Data Search, facilitating searches for genes that have been shown to be exclusively expressed in a specified structure and/or developmental stage; an enhanced anatomy browser that now provides access to expression data and phenotype data for a given anatomical structure; direct access to the wild-type gene expression data for the tissues affected in a specific mutant; and a comparison matrix that juxtaposes tissues where a gene is normally expressed against tissues, where mutations in that gene cause abnormalities.
INTRODUCTION
Developmental gene expression information from wild-type and mutant mice can provide crucial insights into the molecular mechanisms of development, differentiation and disease. To help researchers understand these processes, the Gene Expression Database (GXD) annotates and integrates these data and makes them readily accessible via biologically and biomedically relevant searches. Designed as an open-ended system that can integrate different types of expression data, GXD collects RNA and protein expression information from RNA in situ hybridization, immunohistochemistry, in situ reporter (knock in), RT-PCR, northern blot and western blot experiments (1,2). These data have been acquired from thousands of publications and through collaboration with projects doing large-scale expression screens that generate the types of data collected by GXD. New data are added to GXD daily and made available to the public on a weekly basis. All data are reviewed and annotated by GXD curators. The curators make extensive use of controlled vocabularies and ontologies in order to standardize the data, making integration with other data possible. As an integral component of the larger Mouse Genome Informatics (MGI) resource (3–5), GXD combines its expression data with genetic, functional, phenotypic and disease-oriented data, thereby enabling its unique and powerful search capabilities. GXD and its user interfaces have been described previously (6,7). Here, we focus on progress made since our last report in the NAR Database Issue (8).
DATA CONTENT AND PROGRESS IN DATA ACQUISITION
Comprehensive literature survey
We systematically survey journals to find all publications examining endogenous gene expression during mouse development. As the first curation step for each paper, we annotate the genes and ages analyzed and the expression assay types used. Annotations are based on the entire publication, including Supplementary Data, and employ official nomenclature for genes. This information, combined with bibliographic information from PubMed, can be accessed via the Gene Expression Literature Search (http://www.informatics.jax.org/gxdlit). GXD’s literature content records are comprehensive and up-to-date from 1990 to the present. GXD has records for >26 500 references and nearly 16 000 genes. Thus, as well as helping GXD curators to prioritize papers for detailed expression annotation (below), the Gene Expression Literature Search provides researchers with an effective tool for finding publications with specific gene expression data.
Detailed expression data
GXD contains detailed records of gene expression results derived from publications in the literature index and large-scale expression projects (e.g. an RNA in situ record: http://www.informatics.jax.org/assay/MGI:1349751). We record the strength and pattern of gene expression in specific anatomical structures, as reported by the authors. Records also include the age and genetic background of the specimens analyzed and information about the probes and experimental conditions used. Images of the data accompany the annotations when available. Standard gene, mouse strain and allele nomenclature, controlled vocabularies and an extensive anatomy ontology are employed to annotate the data and to enable thorough data integration and search capabilities. As of September 2018, GXD contains detailed expression data for ∼14 700 genes and includes data from numerous strains of wild-type mice and from >4000 mouse mutants. GXD now holds >340 000 images and >1.65 million expression result annotations.
KEY IMPROVEMENTS TO THE GXD USER INTERFACE
Improved GXD portal
To take full advantage of the GXD resource, users should consult the GXD home page (http://www.informatics.jax.org/expression.shtml). It summarizes the features and resources available. This page has been redesigned to make it more intuitive and helpful. Graphical tiles now provide a quick overview of and access to GXD’s search functions. This includes direct access to each of the three search modes of the Gene Expression Data Query Form: the Standard Search that allows users to search for expression data and images using many different parameters, the Differential Expression Search (see below) and the Batch Search that provides an effective means to retrieve expression data for lists of genes. For First Time Users, a one-page flow chart describes the GXD interface. A Highlights section now alerts users of newly added features and data.
New Differential Expression Search utility
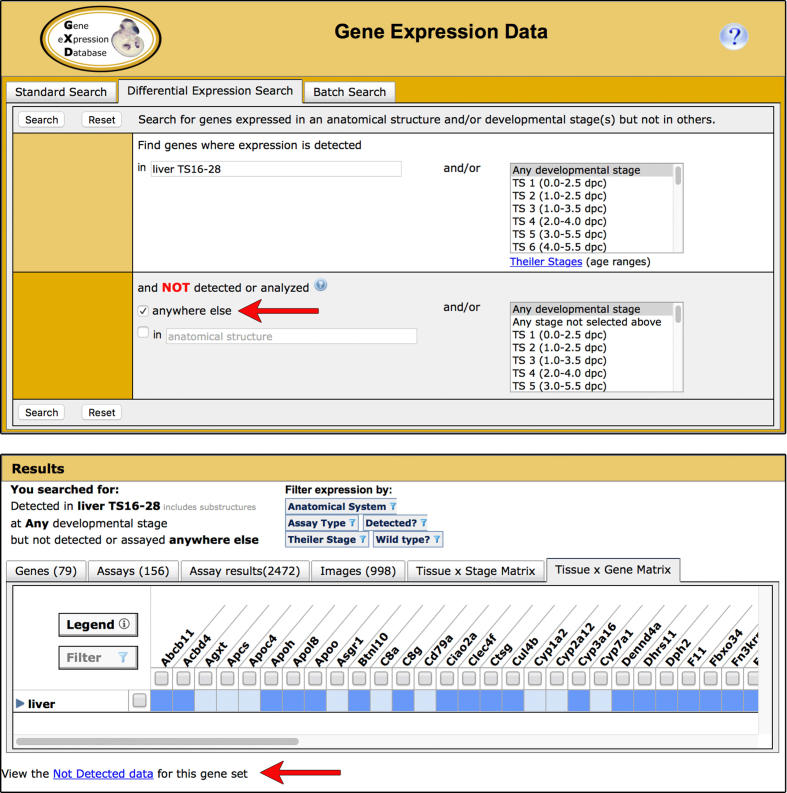
The Differential Expression Search allows users to search for genes expressed in some anatomical structures and/or developmental stages but not in others (http://www.informatics.jax.org/gxd/differential). The capabilities of this search have been expanded. Now users can also search for genes that have been shown to be expressed in a specified structure (or its substructures) and/or developmental stage(s) but nowhere else (Figure 1).
Figure 1.
The ability to search for genes exclusively expressed in specified anatomical structures and/or developmental stages has been added to the Differential Gene Expression Data Search (upper). The structure and/or stages in which expression has been observed are entered in the upper section of the form. The lower section of the form is used to search for the absence of expression, either by entering structures and/or stages or by selecting the new ‘not detected or analyzed anywhere else’ box (arrow). If you choose the ‘not anywhere else’ option, your search will return a list of genes whose detected (positive) gene expression annotations are limited to the specified structure and its substructures and/or stages; there are no positive annotations to other structures and/or stages. This gene list is displayed in the Tissue-by-Gene Matrix tab of our multi-tabbed search return (lower). Genes on this list may have not detected (negative) gene expression annotations to the structures/stages that are included in the ‘not anywhere else’ domain. To view these negative annotations, click the ‘Not Detected data’ link below the matrix (arrow). To access the supporting data, click in the colored cells of the matrix. The gene list can be downloaded using the Export features found on the Genes tab of the search return.
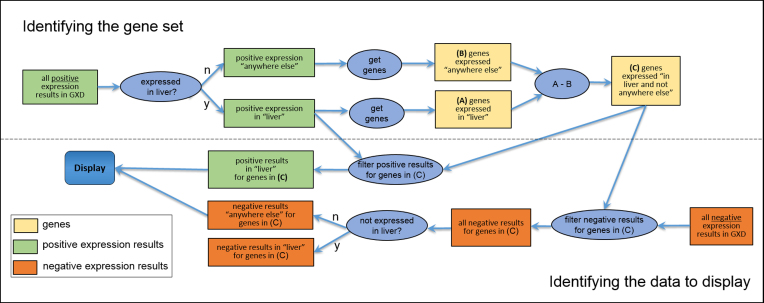
In implementing this search capability, it is worth noting that we had to take two attributes of ‘not detected’ data into account. First, ‘detected’ and ‘not detected’ data have to be treated differently in hierarchical anatomical searches. Specifically, if it is known that a gene is expressed in a part (substructure) of the liver, one can infer that the gene is expressed in the liver (the parent structure). However, one cannot make the same type of inference regarding lack of expression assertions, i.e. the observation that a gene is not detected in a substructure does not mean there is no expression anywhere in the parent structure. Second, ‘not detected’ observations are underreported. Whereas only one section is needed to demonstrate expression, it can require extensive serial sectioning to prove that a gene is not expressed in a specific anatomical structure. For these reasons, our search algorithm conceptually focuses on ‘detected’ data to identify tissue- and/or stage-specific genes; the ‘not detected’ data are only provided as corroborating evidence (Figure 2).
Figure 2.
Conceptual diagram of the expressed ‘here’ and ‘not anywhere else’ search and display. This diagram explains what the user sees when using the Differential Gene Expression Data Search to find genes expressed in the liver and ‘not anywhere else’. In this example, ‘here’ is ‘liver,’ but it could be any combination of structure and/or stage(s). Answering the user’s query involves two distinct parts: first, finding the genes that satisfy the constraint (left-to-right flow in the upper portion of the diagram) and second, gathering/organizing the appropriate data for display (right-to-left flow in the lower portion). To find the genes, we consider only positive expression results; i.e. the genes ‘expressed in liver and not anywhere else’ are the genes where there is evidence of expression in the liver or its substructures and no evidence of expression in any other structure [box (C) at top right]. GXD also annotates negative expression results when the authors specifically state that expression was not found in certain tissues or stages. Because such data are far sparser than positive results and because accounting for them greatly complicates the constraint semantics, we leave them out of the calculation of the gene set and simply add them into the display (bottom tier) as corroborating evidence for lack of expression ‘anywhere else.’ Note that this diagram is a conceptual rendering only; the actual implementation is backed by Solr indexes and is much more efficient.
Enabling the anatomical comparison of expression and phenotype data
GXD uses the Mouse Developmental Anatomy (EMAPA) Ontology to describe gene expression patterns (9,10). MGD, another important component of MGI, uses the Mammalian Phenotype (MP) Ontology to annotate phenotypic data (11). To enable the anatomical comparison of mouse expression and phenotype data, we have established mappings between the shared anatomical concepts of both ontologies. The MP ontology incorporates equivalence axioms to anatomical concepts in the cross-species UBERON anatomy ontology (12), and UBERON includes cross-references to EMAPA. Using these MP–UBERON–EMAPA connections, we generated the MP–EMAPA mappings (Bello et al., Proceedings of ICBO 2018, in press). These newly established anatomical mappings between the MP and the EMAPA ontologies provided the basis for the implementation of all the new features described below.
The MP–EMAPA mappings will continue to increase and become more complete as MGD’s phenotype group continues to add equivalence axioms and GXD continues to expand the mouse developmental anatomy. Currently, the MGD group is reviewing the MP abnormal developmental process terms, e.g. ‘abnormal brain development.’ Presently, these terms only have equivalence axioms to Gene Ontology development terms (e.g. ‘brain development’); they have no reference to UBERON anatomy terms. Going forward, these terms will have additional equivalence axioms to UBERON, allowing us to create MP–EMAPA mappings for these terms.
Enhanced Mouse Developmental Anatomy Browser
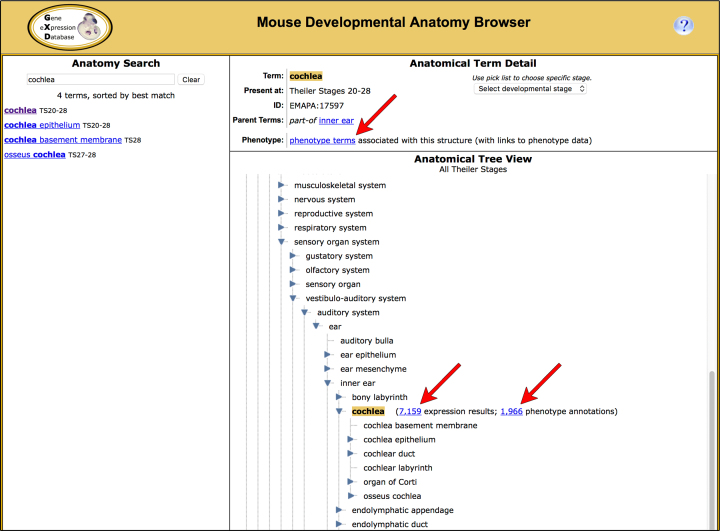
The anatomy browser has always allowed users to navigate the anatomical ontology, locate a specific anatomical structure and to obtain the expression data associated with that structure and its substructures. Now the anatomy browser also provides access to the corresponding phenotype data, enabling users to easily compare the expression and phenotype data for specific anatomical structures (Figure 3).
Figure 3.
The Mouse Developmental Anatomy Browser allows users to search for anatomical structures and to retrieve the expression and phenotype data associated with these structures. The Tree View section of the browser (lower right) allows users to explore the anatomical hierarchy. Anatomy terms are displayed in the context of their parents and substructures. Links beside the selected term (arrows) allow for the retrieval of the expression and phenotype data associated with these structures and their substructures. The Term Detail section of the browser (upper right) displays the term, the developmental stage range during which it is present, and its parent terms. If the term is mapped to MP terms, a link to the MP browser will be present (arrow), leading to a listing of the mapped MP terms and associated phenotype data. Conversely, the MP browser provides, in its Term Detail section, links to mapped anatomical structures that lead to associated expression data (not shown).
Access to expression data for anatomical structures affected in mutants
The wild-type gene expression data for the anatomical structures associated with mutant phenotypes are now accessible via a new link on allele detail pages (e.g. Pax6Sey-Neu allele detail: http://www.informatics.jax.org/allele/MGI:1856158). The allele detail page summarizes the information about the allele in MGI. This new link, added to the expression ribbon of the page, takes users to the anatomy browser which, in turn, displays the list of anatomical structures affected by the mutation. As described above, links in the anatomy browser provide access to the expression (and phenotype) data associated with those terms. Information about the wild-type expression data for anatomical structures affected by specific mutations can provide insights in the molecular mechanisms leading to the phenotype.
Gene Expression + Phenotype Comparison Matrix
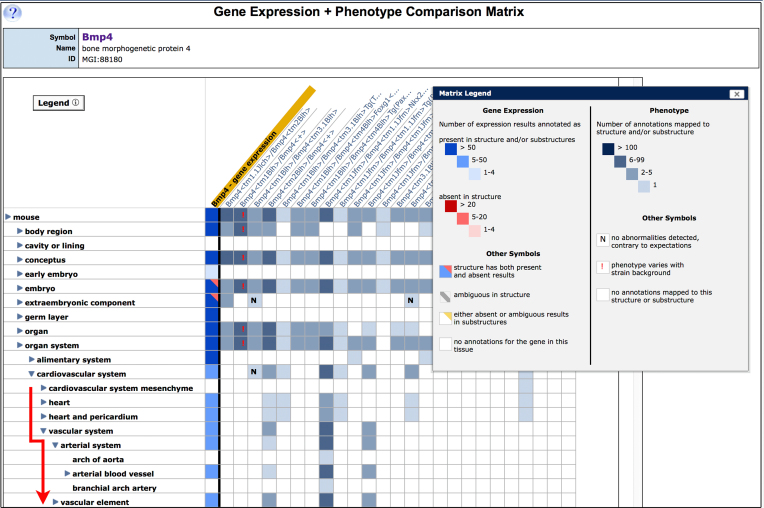
Based on our previous work on Tissue-by-Gene expression matrix displays (8), we have developed an interactive matrix view that allows users to compare gene expression and phenotype data for a given gene (Figure 4). The Gene Expression + Phenotype Comparison Matrix displays both types of data using the common anatomical framework of the mouse developmental anatomy and visually juxtaposing the tissues, where a gene is normally expressed against tissues where mutations in that gene cause abnormalities. The anatomy axis of the view can be expanded and collapsed, allowing users to interactively explore correlations between gene expression and phenotype at different levels of detail. The Gene Expression + Phenotype Comparison Matrix is accessible from the phenotype and expression ribbons on the MGI detail page for that gene (e.g. Bmp4 gene detail: http://www.informatics.jax.org/marker/MGI:88180).
Figure 4.
The Gene Expression + Phenotype Comparison Matrix enables users to compare gene expression and phenotype data for a given gene. The first column (gold header) summarizes the wild-type expression pattern of the gene. The color of matrix cells in the column indicates the type and number of expression annotations for each tissue; the conventions are defined in the matrix legend (inset). Alleles of the gene are displayed in subsequent columns. The tissues where each allele has phenotypic effects are indicated by the presence of colored matrix cells; the cells get progressively darker as the number of phenotype annotations increases. The default matrix display is a relatively high-level anatomy overview, but users can interactively explore the anatomy hierarchy using the blue toggles (▸ or ▾) to expand and collapse the tree; in the figure, the cardiovascular system node has been expanded (red line). To access the supporting data, click in the colored cells of the matrix.
USER SUPPORT
GXD provides support to its users through dedicated User Support personnel, detailed online documentation and quick tutorials. User Support can be contacted via email at mgi-help@jax.org or by clicking the ‘Contact Us’ link in the navigation bar at the top of all web pages. Upon request User Support will provide remote interactive training sessions and on-site visits. The online documentation can be accessed by clicking on the question mark in the upper corner of most pages. Quick tutorials (and links to other informational material) can be found on the Help tab of the GXD home page (http://www.informatics.jax.org/expression.shtml).
CITING GXD
The following citation format is suggested when referring to data downloaded from GXD: These data were retrieved from the (GXD), MGI, The Jackson Laboratory, Bar Harbor, Maine, USA (URL: http://www.informatics.jax.org) on [date (month, year) when you retrieved the data cited]. To reference the database itself, please cite this article.
FUNDING
Eunice Kennedy Shriver National Institute of Child Health and Human Development (NICHD) of the National Institutes of Health (NIH) [HD062499]; National Human Genome Research Institute (NHGRI) of the NIH [HG000330]. Funding for open access charge: NIH [HD062499].
Conflict of interest statement. None declared.
REFERENCES
- 1.Ringwald M., Baldock R., Bard J., Kaufman M., Eppig J.T., Richardson J.E., Nadeau J.H., Davidson D.. A database for mouse development. Science. 1994; 265:2033–2034. [DOI] [PubMed] [Google Scholar]
- 2.Ringwald M., Mangan M.E., Eppig J.T., Kadin J.A., Richardson J.E. GXD: a gene expression database for the laboratory mouse . The gene expression database group. Nucleic Acids Res. 1999; 27:106–112. [DOI] [PMC free article] [PubMed] [Google Scholar]
- 3.Smith C.L., Blake J.A., Kadin J.A., Richardson J.E., Bult C.J. the Mouse Genome Database Group . Mouse Genome Database (MGD)-2018: knowledgebase for the laboratory mouse. Nucleic Acids Res. 2018; 46:D836–D842. [DOI] [PMC free article] [PubMed] [Google Scholar]
- 4.Smith C.M., Finger J.H., Hayamizu T.F., McCright I.J., Xu J., Eppig J.T., Kadin J.A., Richardson J.E., Ringwald M.. GXD: a community resource of mouse Gene Expression Data. Mamm. Genome. 2015; 26:314–324. [DOI] [PMC free article] [PubMed] [Google Scholar]
- 5.Drabkin H.J., Christie K.R., Dolan M.E., Hill D.P., Ni L., Sitnikov D., Blake J.A.. Application of comparative biology in GO functional annotation: the mouse model. Mamm. Genome. 2015; 26:574–583. [DOI] [PMC free article] [PubMed] [Google Scholar]
- 6.Finger J.H., Smith C.M., Hayamizu T.F., McCright I.J., Xu J., Eppig J.T., Kadin J.A., Richardson J.E., Ringwald M.. The mouse gene expression database: new features and how to use them effectively. Genesis. 2015; 53:510–522. [DOI] [PMC free article] [PubMed] [Google Scholar]
- 7.Smith C.M., Finger J.H., Kadin J.A., Richardson J.E., Ringwald M.. The gene expression database for mouse development (GXD): Putting developmental expression information at your fingertips. Dev. Dyn. 2014; 243:1176–1186. [DOI] [PMC free article] [PubMed] [Google Scholar]
- 8.Finger J.H., Smith C.M., Hayamizu T.F., McCright I.J., Xu J., Law M., Shaw D.R., Baldarelli R.M., Beal J.S., Blodgett O. et al. . The mouse Gene Expression Database (GXD): 2017 update. Nucleic Acids Res. 2017; 45:D730–D736. [DOI] [PMC free article] [PubMed] [Google Scholar]
- 9.Hayamizu T.F., Baldock R.A., Ringwald M.. Mouse anatomy ontologies: enhancements and tools for exploring and integrating biomedical data. Mamm. Genome. 2015; 26:422–430. [DOI] [PMC free article] [PubMed] [Google Scholar]
- 10.Hayamizu T.F., Wicks M.N., Davidson D.R., Burger A., Ringwald M., Baldock R.A.. EMAP/EMAPA ontology of mouse developmental anatomy: 2013 update. J. Biomed. Semantics. 2013; 4:15. [DOI] [PMC free article] [PubMed] [Google Scholar]
- 11.Smith C.L., Eppig J.T.. The Mammalian Phenotype Ontology as a unifying standard for experimental and high-throughput phenotyping data. Mamm. Genome. 2012; 23:653–668. [DOI] [PMC free article] [PubMed] [Google Scholar]
- 12.Haendel M.A., Balhoff J.P., Bastian F.B., Blackburn D.C., Blake J.A., Bradford Y., Comte A., Dahdul W.M., Dececchi T.A., Druzinsky R.E et al. . Unification of multi-species vertebrate anatomy ontologies for comparative biology in Uberon. J. Biomed. Semantics. 2014; 5:21. [DOI] [PMC free article] [PubMed] [Google Scholar]


