Shared evolutionary origin of vertebrate neural crest and cranial placodes (original) (raw)
. Author manuscript; available in PMC: 2019 Feb 26.
Published in final edited form as: Nature. 2018 Aug 1;560(7717):228–232. doi: 10.1038/s41586-018-0385-7
Placodes and neural crest represent defining features of vertebrates, yet their relationship remains enigmatic despite extensive investigations1–3. In this study we use a combination of lineage tracing, gene disruption, and single cell RNA-seq assays to explore the properties of the lateral plate ectoderm of the proto-vertebrate, Ciona intestinalis. There are striking parallels in the patterning of the lateral plate in Ciona and the compartmentalization of the neural plate ectoderm in vertebrates4. Both systems exhibit sequential patterns of Six1/2, Pax3/7 and Msxb expression that depend on a network of inter-locking regulatory interactions4. In Ciona, this compartmentalization network produces distinct but related sensory cell types that share similarities with derivatives of both cranial placodes and neural crest in vertebrates. Simple genetic perturbations result in the inter-conversion of one sensory cell type into another. Particular efforts focused on the bipolar tail neurons (BTNs) since they arise from tail regions of the lateral plate and possess properties of dorsal root ganglia, a derivative of neural crest in vertebrates5. Strikingly, BTNs are readily transformed into PSCs (palp sensory cells), a proto-placodal sensory cell type arising from the anterior-most regions of the lateral plate in the Ciona tadpole6. Proof of transformation was confirmed by whole-embryo single cell RNA-seq assays. These findings suggest that compartmentalization of the lateral plate ectoderm preceded the advent of the vertebrates, and served as a common source for the evolution of both cranial placodes and neural crest 3,4.
Placodes and neural crest are the key ontogenetic novelties underlying vertebrate cephalization1–3. However, their evolutionary origins remain uncertain despite recent evidence that invertebrate chordates contain rudiments of both cell types4–14. Here we sought to obtain a more comprehensive view of the lateral plate ectoderm in Ciona since it is the source of the cell types that are related to placodal and neural crest derivatives in vertebrates.
Lineage-tracing methods were used to identify four derivatives of the lateral plate ectoderm: palp sensory cells (PSCs) arising from the a8.20 and a8.18 lineages12, aATENs (a8.26 lineage)14, pATENs (b8.20 lineage)9 and BTNs (b8.18 lineage)5 (summarized in Fig. 1a,b; Extended data Fig. 1). The aATENs were previously shown to possess dual properties of placode-derived chemosensory neurons (e.g., olfactory neurons) and GnRH-expressing neurosecretory neurons (e.g., hypothalamic GnRH neurons)14. The BTNs are thought to share properties with neural crest-derived dorsal root ganglia5.
Figure 1 |. Lateral plate ectoderm.
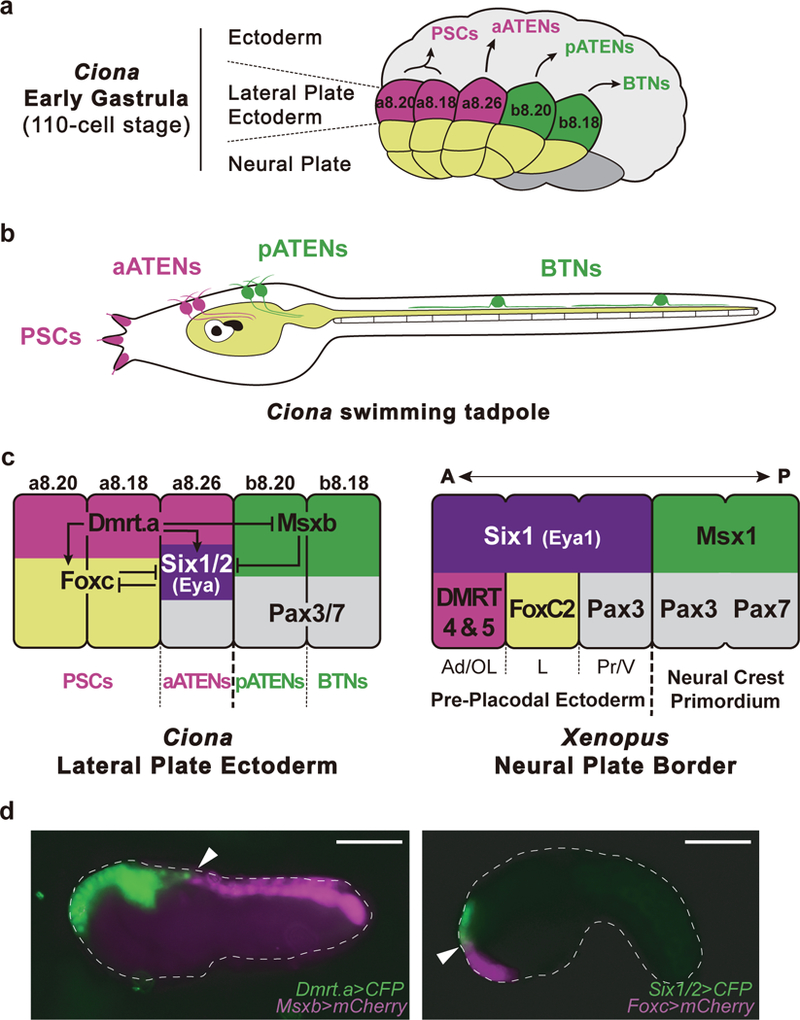
a, Summary of lateral plate derivatives at early gastrula (110 cell stage). Magenta indicates progenitors of palp sensory cells (PSCs) and aATENs arising from the a8.20, a8.18 and a8.26 lineages, respectively. Green indicates pATENs and BTNs arising from b8.20 and b8.18, respectively. b, Diagram of Ciona tadpole showing the position of PSCs, aATENs, pATENs and BTNs. c, Summary of Ciona lateral plate ectoderm and Xenopus pan-placodal primordium. Magenta indicates Dmrt.a expressing blastomeres (a8.20, a8.18 and a8.26 lineage), green indicates Msxb expressing blastomeres (b8.20 and b8.18 lineage), violet indicates prospective Six1/2 and Eya expressing blastomeres (a8.26 lineage), yellow indicates Foxc expressing blastomeres (a8.20 and a8.18 lineage) and grey indicates Pax3/7 expressing blastomeres (a8.26, b8.20 and b8.18 lineage), A, anterior; Ad, adenohypophyseal placode; OL, olfactory placode; L, lens placode; P, posterior; Pr, profundal placode; V, trigeminal placode. d, (left) Tailbud embryo co-injected with _Dmrt.a_>CFP (green) and Msxb>mCherry (magenta) reporter genes. Arrowhead indicates the boundary separating the Dmrt.a and Msxb expression territories. d, (right) Tailbud embryo injected with _Six1/2_>CFP and Foxc>mCherry reporter genes. Arrowhead indicates the boundary separating the Six1/2 and Foxc expression territories. Anterior to the left; scale bars, 100 μm.
A regulatory “blueprint” of the Ciona embryo identified several determinants of the lateral plate ectoderm, including Dmrt.a, Foxc, Six1/2, Pax3/7 and Msxb15. Dmrt.a, Foxc, and Six1/2 are expressed in the anterior-most regions (a8.20 and a8.18 and a8.26 lineages) (summarized in Fig. 1c,d)12,14,16, while Msxb is selectively expressed in posterior regions (b8.20 and b8.18 lineages) (Fig. 1d)15,17. Pax3/7 straddles anterior and posterior regions, spanning the a8.26, b8.20, and b8.18 lineages (Fig. 1c)18.
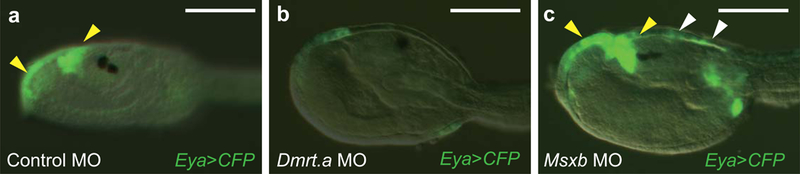
We have obtained evidence for inter-locking regulatory interactions among these lateral plate determinants (Fig. 2a-d; Extended Data Figs. 2-5). Dmrt.a activates Foxc and Six1/2 expression in the anterior-most regions (Fig. 2a,b)15,16. There is an expansion of Six1/2 and Eya expression into tail regions of Msxb morpholino (MO) morphants, suggesting that Msxb functions as a repressor to delineate the trunk/tail boundary of the lateral plate ectoderm (Fig. 2a-c; Extended Data Fig. 2). The characterization of a minimal Six1/2 enhancer is consistent with direct repression by Msxb (Extended Data Fig. 4). Furthermore, there is an anterior expansion of Msxb expression in Dmrt.a MO morphant mutants, raising the possibility of reciprocal repression of Msxb by either Six1/2 (and Eya) or Dmrt.a (Extended Data Fig. 5).
Figure 2 |. Functional analysis of the lateral plate ectoderm.
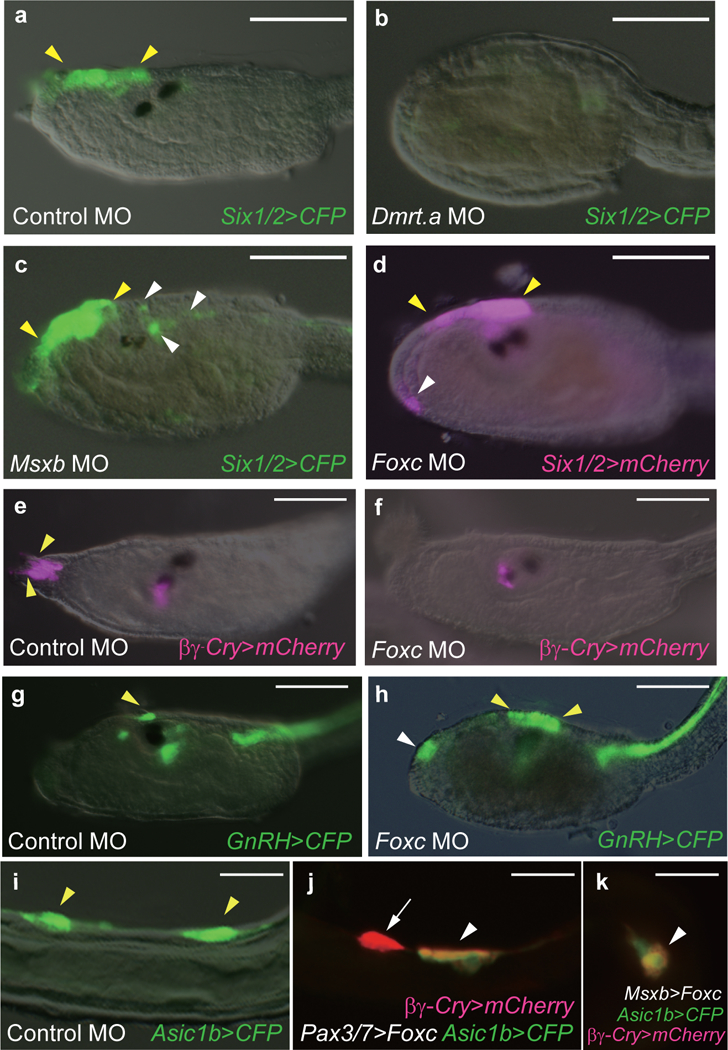
a-c, Head regions of larvae that were injected with a _Six1/2_>CFP reporter gene. a, Six1/2 expression in the proto-placodal region of control MO injected tadpoles (49 of 49 larvae displayed this expression pattern). The yellow arrowheads identify the normal location of Six1/2 expression. b, Loss of expression in Dmrt.a morphants (49 of 49 larvae). c, Expanded expression of the Six1/2>CFP reporter gene (white arrowheads) in Msxb morphants (42 of 50 larvae showed this expansion pattern). d, Head regions of a larva that was co-injected with Foxc MO and Six1/2>mCherry reporter gene. There is ectopic expression (white arrowhead) in the palp regions of Foxc morphants (35 of 47 larvae showed this phenotype). e, f, Larvae injected with βγ-crystallin>mCherry reporter gene. Yellow arrowheads indicate the _βγ_-crystallin expressing PSCs in control MO injected larvae (51 of 51 larvae display this expression pattern). f, There is a loss of these cells in Foxc morphants (108 of 108 larvae showed this phenotype). g, h, Larvae injected with a _GnRH_>CFP reporter gene. Yellow arrowheads identify the GnRH expressing aATENs in a control larva (59 of 59 larvae displayed expression in aATENs). h, There is ectopic expression in the palp regions of Foxc morphants (white arrow) (28 of 40 injected larvae showed this phenotype). i-k, Tail regions of larvae injected with Asic1b>CFP (i) and co-injected with βγ-crystallin>mCherry reporter gene (j,k). Yellow arrowheads identify the Asic1b expressing BTNs in a control larva (83 of 83 larvae displayed this phenotype). j, Ectopic expression of the _βγ-crystallin_>mCherry reporter gene in tail regions (white arrowheads) upon misexpression of Foxc by the Pax3/7 enhancer (26 of 55 larvae showed this phenotype. k, Same as j except that Msxb regulatory sequences were used to misexpress Foxc (31 of 57 larvae showed misexpression of βγ-crystallin>mCherry. Anterior to the left; scale bars, 100 μm (a-h), 20 μm (i-k).
There are striking parallels in the compartmentalization of the lateral plate in vertebrates and ascidians (summarized in Fig. 1c). In Xenopus, Dmrt.a homologs 4 and 5 specify the adenohypophyseal/olfactory placodes within anterior regions of the pan-placodal primordium19,20. They do not appear to regulate Six1 as seen in ascidians. Nonetheless, in Ciona Dmrt.a gives way to sequential expression of Six1/2 and Msxb at the trunk/tail boundary, similar to that seen in vertebrates (Fig. 1c,d). Moreover, the overlapping patterns of Six1/2 and Pax3/7 expression seen for the Ciona aATEN lineage are evocative of those that delineate specific compartments within the pan-placodal primordium in vertebrates21–23.
The most significant deviation in the Ciona and vertebrate regulatory fate maps is the compartmentalization of the Ciona anterior lateral plate into two distinct domains exhibiting mutually exclusive expression of Foxc (PSCs) and Six1/2 (aATENs) (Fig. 1c, d). We sought to determine whether these territories might share common developmental properties since vertebrate orthologs of Foxc have been implicated in delineating placodal derivatives such as the eye lens24–26. Foxc morphants were obtained by injection of a sequence-specific MO targeting the translation start site of the endogenous Foxc gene. They show a loss of PSC marker gene expression (Fig. 2e,f) as well as an unexpected phenotype: ectopic expression of a Six1/2 reporter gene in palp regions producing PSCs (Fig. 2d,g,h; Extended Data Fig. 6). Thus, Foxc appears to function as a key determinant of PSC identity by activating PSC markers and inhibiting an alternate aATEN identity. This transformation of PSCs into aATENs suggests that the Foxc and Six1/2 territories of the anterior lateral plate employ a similar developmental program for specifying sensory cells.
It has been suggested that the BTNs are related to dorsal root ganglia, which are derived from neural crest cells in vertebrates5. This observation raises the possibility that tail regions of the lateral plate ectoderm possess “proto-neural crest” properties5, hinting to a common origin of cranial placodes and neural crest from lateral plate ectoderm1. To explore this possibility we asked whether BTNs could be transformed into other derivatives of the lateral plate ectoderm. Towards this goal we misexpressed Foxc in posterior regions of the lateral plate using Pax3/7 and Msxb regulatory sequences. Mutant tailbud embryos display variable transformations of BTNs into PSCs (Fig. 2i-k) without altering other tail structures (e.g. neural tube and notochord). Some BTNs express only PSC marker genes (e.g. βγ-crystallin) (arrow, Fig. 2j) while others express both PSC and BTN markers (e.g., Asic1b) (arrowhead, Fig. 2j,k). These observations suggest that anterior and posterior regions of the lateral plate ectoderm employ a similar developmental program for the specification of related but distinct sensory cell types. It is therefore possible that the entire lateral plate of the last shared tunicate/vertebrate ancestor is the source of both placodal and neural crest derivatives in vertebrates.
Since the transformation of BTNs into supernumerary PSCs is pivotal to our proposal that the compartmentalized lateral plate ectoderm produces distinct but related sensory cell types, we employed single cell RNA-seq assays to characterize transformed BTNs by taking advantage of the well-defined lineages and small cell numbers comprising Ciona tailbud embryos (~1500 cells). Embryos were injected with the Pax3/7>Foxc transgene (Fig. 2j), grown to the late tailbud stage, dissociated and sequenced using the 10x microfluidics platform. Approximately 5000 cells were sequenced in order to obtain sufficient coverage (~3×) to ensure reliable detection of PSCs, BTNs, and transformed cell types. Unequivocal identification of cells expressing the Pax3/7 transgene was provided by the insertion of a unique 450 bp sequence tag positioned downstream of the Foxc coding region.
tSNE projections reveal 20 cell clusters representing different tissues, including notochord, endoderm, tail muscles, mesenchyme, epidermis, and CNS (Fig. 3a; Extended Data Fig 7a,b and Supplementary Table1). BTNs were identified by their expression of key marker genes such as Asic1b and synaphin, while PSCs express a distinct set of markers including Islet, SP8 and Foxg (Fig. 3b; Extended Data Fig. 7c, Fig. 8 and Supplementary Table1). Transformed BTNs are defined as those expressing the Pax3/7 transgene, lacking expression of BTN markers (Asic1b and synaphin), acquiring expression of PSC markers (Islet, Foxg and SP8), and clustering within the 95% confidence interval (CI) ellipse of native PSCs (bottom oval, Fig. 3c). Partially transformed BTNs are defined as those expressing Pax3/7 transgenes, lacking expression of just one of the BTN marker genes, and acquiring expression of just a subset of PSC markers. The transcriptomes of hybrid cells tend to map outside the 95% CI ellipse of PSCs (Fig. 3c). Altogether, 45 BTNs were identified in the whole-embryo single cell transcriptome datasets. About half (21) are untransformed and display the native BTN transcriptome profile, while the other half are either fully transformed into PSCs (10) or partially transformed (14) into a hybrid BTN/PSC identity (Fig. 3d). These findings closely mirror the direct visualization of reporter gene expression in transgenic embryos, whereby BTNs exhibit variable expression of βγ-crystallin and Asic1b reporter genes (Fig. 2j,k).
Figure 3 |. Single cell RNA-seq analysis of BTN transformations.
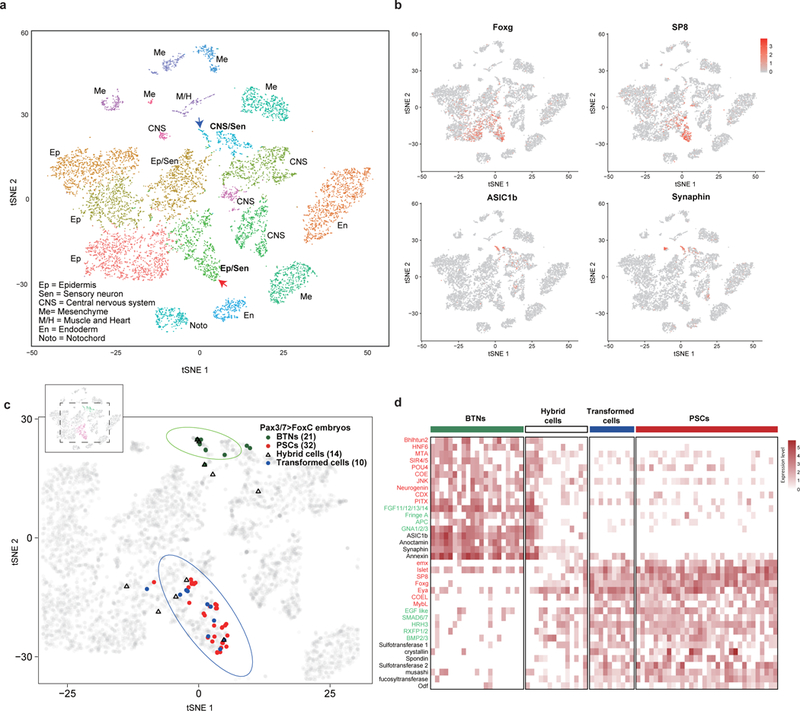
a, The tSNE projection map of dissociated cells from wild-type and mutant tailbud-stage embryos that misexpress Foxc in tail regions using Pax3/7 regulatory DNAs (Pax3/7>Foxc transgene). Each dot corresponds to the transcriptome of a single cell, and cells possessing similar transcriptome profiles map near each other. All of the major tissue types in tailbud-stage embryos were identified: Ep=epidermis; Se=sensory neurons; CNS=central nervous system; Me=mesenchyme; M&H=heart and muscle; En=Endoderm; Noto=Notochord). Identification is based on the expression of known marker genes (Extended Data Fig. 8b, and Extended File 1 sheet 1). b, Distribution of marker gene expressed in PSCs (Islet, Foxg and SP8) and BTNs (Asic1b and Synaphin) within tSNE projections as shown in (a). d, Distribution of cells expressing transgenes, which identifies cells that misexpress the PSC determinant, Foxc. BTNs (dark green dots; n = 21), PSCs (red dots; n=32), hybrid cells that express both PSC and BTN marker genes (light blue triangles; n=14), and transformed cells that express PSC markers (blue dots; n=10). The grey dots (n = 10,103) correspond to all dissociated cells that were sequenced in these experiments. d, Heatmap of BTNs, PSCs, transformed cells, and hybrid cells showing the relative expression of a select group of genes encoding transcription factors (red), signaling components (green), and cellular effectors (black).
The Pax3/7>Foxc transgene is expressed in the lateral plate and additional tissues, such as the mesenchyme, which is a common site of ectopic expression of Ciona transgenes27. These other sites of Foxc expression do not undergo transformations in cell identity, but instead display native transcriptome profiles (Extended Data Fig. 7e,f). Altogether, the single cell RNA-seq assays strengthen the evidence that BTNs are transformed into PSCs, suggesting the use of a similar developmental program for the specification of different sensory cells arising from head, trunk, and tail regions of the lateral plate ectoderm.
We have presented evidence that the antero-posterior compartmentalization of the Ciona lateral plate leads to the development of related but distinct sensory cell types (summarized in Fig. 4). PSCs, aATENs, and BTNs express a common suite of regulatory gene and cell identity genes (e.g., POU IV, DCDC2 and 14–3-3c), despite their different origins along the lateral plate (Extended Data Fig. 9). Foxc, Six1/2 and Msxb impose distinctive signatures of gene activity leading to the specification of diverse sensory cell types. There are striking parallels with the regional specification of distinct somatosensory neurons arising from placodal and neural crest territories in vertebrates28. We therefore suggest that a compartmentalized lateral plate preceded the advent of the vertebrates, and served as a common source for the evolution of both cranial placodes and neural crest.
Figure 4 |. Compartmentalization of Ciona lateral plate ectoderm.
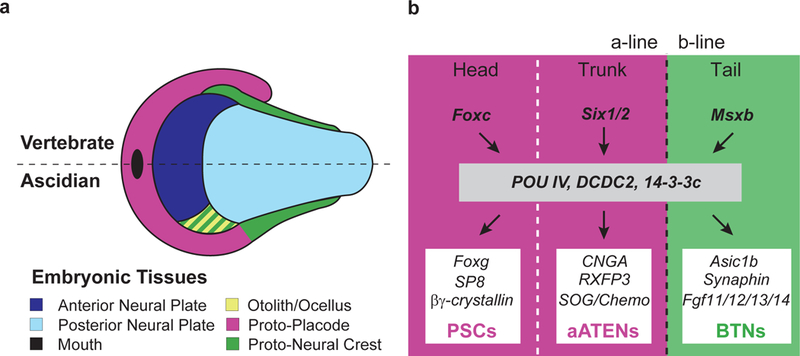
a, Schematic illustration of the neural plate and its lateral border in vertebrate (top half) and ascidians (bottom half). We proposed that both proto-placode and proto-neural crest evolved from entire lateral plate in the last shared tunicate/vertebrate ancestor. Otolith/ocellus contribution to the proto-neural crest is based on Abitua et al., 2012. b, Provisional gene regulatory network for the compartmentalization, specification and differentiation of the lateral plate ectoderm into akin sensory cell types in Ciona intestinalis. During early embryogenesis, Foxc and Six1/2 determine the head /trunk boundary (white dotted line) of proto-placode lineages (magenta) while Msxb patterns the proto-neural crest territory (green). In tailbud stages, a common developmental program specifies sensory progenitors within each compartment. CNGA, RXFP3 and SOG/Chemokine-like expression is based on Abitua et al., 201514.
SUPPLEMENTARY INFORMATION
METHODS
Biological Materials.
Wild-type Ciona intestinalis adults were obtained from M-Rep (San Diego, CA) and the National Bio-Resource Project for Ciona in Japan. Sperm and eggs were collected by dissecting the sperm and gonadal ducts.
Constructs.
Reporter genes were designed using previously published enhancer sequences: Dmrt.a30, Msxb17,31,32, Six1/214, GnRH14, CNGA14, Foxc12, Islet6. The Eya (Ciinte.REG.KhC7:6052317–6053527) and Pax3/7 (Ciinte.REG. KhC10:876118–879610) enhancers were isolated via PCR using the following primers (5’-atgcctgcagactcaattaccgaattaatt-3’ and 5’-gatcggatccatatttccatcacgaacttt-3’ for Eya, 5’-atgcctgcaggtatgactgtgtaaatctgc-3’ and 5’-gatcggatccgtttgttgggttgtgttcag-3’ for Pax3/7) and cloned into the PstI/BamHI restriction site of the pSPeCFP vector.
The following fusion genes were used in the experiments presented in Extended Data Figure 9. For Dmrt.a ΔMO target sequence (Ciinte.REG.KhS544:4,240–5,196) was isolated via PCR from the following primers (5’-atgcgcatgctagtagggtggaggaagatg-3’ and 5’-gatcggatccttggtttaacactctaaagc-3’) and cloned into the SphI/BamHI restriction site of the pSPeCFP vector. To generate pSPDmrt.a construct, we isolated the coding sequence of Dmrt.a (Ciinte.CG.KH.S544.3) with following primers (5’-atgcgcggccgcatggcaaccgacagagga-3’ and 5’-gatcgaattcctacttgtcacttgagcatg-3’ and cloned into the NotI/EcoRI restriction site of pSPeCFP vector. To generate Dmrt.a Δ MO target sequence>Dmr.a, Dmrt.a Δ MO target sequence was inserted into the SphI and BamHI site of pSPDmrt.a construct. To generate the pSPMsxb MO target sequence CFP, Msxb MO target sequence (AAATTAAAAATGACAGTAAACGAAT) was tagged by inverse PCR. To generate Msxb>Msxb MO target sequence CFP, the enhancer sequence of Msxb was cloned into the XhoI/NotI site of the pSPMsxb MO target sequence CFP. To generate the pSPMsxb construct, we isolated the coding sequence of Ci-Msxb (Ciinte.CG.KH.C2.957) with the following primers (5’-atgcgcggccgcatgacagtaaacgaatcc-3’ and 5’-gcttgatatcctatcgactctcagttgggt-3’). To generate the pSPMsxb mut construct, we replaced the coding region of the Msxb MO target sequence from (ATGACAGTAACGAAT) to (ATGACGGTGAATGAGT) by inversePCR. The PCR products were digested with NotI and EcoRV and inserted into the NotI and blunted EcoRI sites of pSPeCFP. For Msxb>Msxb mut, the Msxb enhancer DNA was cloned into the XhoI/NotI site of pSPMsxb mut. To generate the pSPFoxc MO target sequence CFP, Foxc MO target sequence (GGTTTGATTCTCTATAATGACAATG) was tagged by inverse PCR. To generate Foxc>Foxc MO target sequence CFP, the enhancer sequence of Foxc was cloned into the XhoI/NotI site of pSPFoxc MO target sequence CFP. To generate the pSPFoxc construct, we isolated the coding sequence of Ci-Foxc (Ciinte.CG.KH.L57.25) with the following primers (5’-atgcgcggccgctatgacaatgcaaatccg-3’ and 5’-gatcgaattctcagtacttagtgtaatcgt-3’). To generate Foxc>Foxc, the enhancer sequence of Foxc was cloned into the XhoI/NotI site of pSPFoxc.
The following fusion genes were used for the experiments shown in Figure 2, Figure 3, and Extended Data Figure 3, Extended Data figure 4-The pSPDmrt.a, pSPSix1/2 and pSPFoxc fusion genes were prepared using the coding sequence of Ci-Dmrt.a (Ciinte.CG.KH.S544.3), Ci-Six1/2 (Ciinte.CG.KH.C3.553) and Ci-Foxc (Ciinte.CG.KH.L57.25). These were amplified with the following primers (5’-atgcgcggccgcatggcagccaccctggcg-3’ and 5’-gatcgaattcttacgatcccatttcgactg-3’ for Six 1/2, 5’-atgcgcggccgctatgacaatgcaaatccg-3’ and 5’-gatcgaattctcagtacttagtgtaatcgt-3’ for Foxc). The PCR products were digested with NotI and EcoRI and inserted into the NotI and EcoRI site of pSPeCFP. To generate Dmrt.a>Msxb, Dmrt.a>Six1/2 fusion genes, the enhancer region of Dmrt.a was inserted into the SphI and BamHI sites of pSPMsxb and pSPSix1/2. The Dmrt.a>Foxc fusion gene was prepared using the enhancer region of Dmrt.a inserted in the SphI and NotI sites of pSPFoxc. To generate, Pax3/7>Foxc, the enhancer region of Pax3/7 was inserted into the XhoI and NotI sites of pSPFoxc. The minimal enhancer of Six1/2 was amplified with the following primers (5’-tgcctgcagcgaaaacaatggtttatccg −3’ and 5’-gatcggatcctacatgtacgcgcactttaa-3’) and cloned into the PstI/BamHI restriction site of a reporter construct containing the pSPFoxAa basal promoter and Kaede33.
Microinjection of Antisense Morpholino Oligonucleotides and reporter genes.
Morpholino oligomers (MOs) were obtained from Gene Tools, LLC (Philomath, OR). MOs targeting Dmrt.a, Msxb, Otx and Foxc were described previously15. The following MO sequences were used: Dmrt.a, 5’-ctgtttgctataatttctgtaactc-3’; Msxb, 5’-attcgtttactgtcatttttaattt-3’; Otx, 5’-tacgacatgttaggaattgaacccg-3’. Foxc 5’-cattgtcattatagagaatcaaacc-3’. For control injections we used a universal control MO obtained from Gene Tools, LLC (Philomath, OR). MOs were dissolved in DEPC treated water containing 1mg/ml tetramethylrhodamine dextran (D1817, Invitrogen). The concentrations of MO and plasmid DNA in the injection medium were 0.5mM, 1–10ng/μl, respectively. Microinjections of MOs and reporter constructs were performed as described previously34. All experiments were repeated at least twice with different batches of embryos. Efficiency and specificity of MOs were evaluated by the simultaneous injection of MO and CFP reporter genes (10ng/μl), whereby the initiating codon (ATG) was replaced with a nucleotide sequence recognized by individual MOs (Extended Data Fig. 9). The concentration of rescue construct in the injection medium is 1ng/μl.
DiI labeling.
DiI or DiO labeling of the a5.3, a5.4, b5.3 blastomeres was performed as described previously35,36. DiI (Celltracker™ CM-DiI Dye, C7000, Molecular probe, Eugene, OR) and DiO (D-275, Molecular probe, Eugene, OR) were dissolved in soybean oil at a concentration of 5mg/ml. (see Extended Data Fig.1).
Single cell RNA-seq assays.
Pax3/7>Foxc (2.5ng/μl) injected eggs and control eggs were fertilized side by side, and allowed to develop to the late tailbud stage (12h after fertilization at 18°C). For each sample, 120 morphologically normal embryos were transferred into a 1.5 ml centrifuge tube that was pre-coated with 5% BSA in Ca2+-Free artificial sea water (Ca2+-Free ASW, 10 mM KCl, 40 mM MgCl2, 15 mM MgSO4, 435 mM NaCl, 2.5 mM NaHCO3, 7 mM Tris base, 13 mM Tris-HCl). Cells were subsequently dissociated with 300 ul 1% trypsin in Ca2+-Free ASW with 5 mM EGTA for 5 min. Embryos were pipetted 5 min on ice to complete dissociation of individual cells. 500 ul ice cold Ca2+-Free ASW + 0.5% BSA was added to terminate digestion. Cells were collected by centrifuging at 900g for 5 min at 4°C and then resuspended in 50 ul ice cold Ca2+-Free ASW + 0.5% BSA.
Single cell suspensions were loaded onto the 10x Genomics Chromium system using Reagent Kits to generate and amplify cDNAs, as recommended by the manufacturer (10X Genomics, CA)37. Illumina sequencing libraries were generated from the cDNA samples using the Nextera DNA library prep kit and sequenced using Illumina HiSeq 2500 Rapid flowcells (Illumina Inc., CA) with paired-end 26nt + 125nt reads following standard Illumina protocols. Raw sequencing reads were filtered by Illumina HiSeq Control Software and only Pass-Filter (PF) reads were used for further analysis.
The Pax3/7>Foxc and wildtype samples were run on a both lanes of a HiSeq 2500 Rapid Run mode flowcell. Basecalling was performed by Illumina RTA version 1.18.64.0. BCL files were then converted to fastq format using Illumina’s bcl2fastq version 1.8.4. Reads that aligned to phix (using Bowtie 1.1.1) were removed as well as reads that failed Illumina’s default chastity filter. We then combined the fastq files from each lane and separated the samples using the barcode sequences allowing 1 mismatch (using barcode_splitter version 0.18.2). Using 10x CellRanger version 2.0.1, the count pipeline was run with default settings on the fastq files to generate gene-barcode matrices for each sample. The reference sequence was obtained from the Ghost database38 with the sv40 sequences added. The gene annotations used were also obtained from the Ghost database, again with sv40 added.
Low-quality transcriptomes were filtered, as follows: 1) we discarded cells with less than 200 expressed genes; 2) we discarded cells with less than 500 or more than 30000 Unique Molecular Identifiers (UMIs). We further normalized the read counts of each cell by Seurat methods, and the normalized read counts were log-transformed for downstream analyses and visualizations. For dimensional reduction, the relative expression measurement of each gene was used to remove unwanted variation. Genes with the top 2000 highest standard deviations were obtained as highly variable genes of wild-type and transgenic (Pax3/7>Foxc) samples, respectively. We further aligned these two samples used canonical correlation analysis to focus on shared similarities and to facilitate comparative analysis. In aligned dataset, 10135 cells were kept and clustered based on their PCA scores with highly variable genes. Basically, after significant PCs were identified, a graph-based clustering approach was used for partitioning the cellular distance matrix into clusters. Cell distance was visualized by t-Distributed Stochastic Neighbor Embedding (t-SNE) method in reduced 2D space. Differentially expressed genes (DEGs) between different cell types were identified by the following criteria using the DESeq2 software package: 1) FDR adjusted p value < 0.01; 2) absolute log2 fold change between groups were larger than 1.
Extended Data
Extended Data Figure 1. Sensory cell lineages.
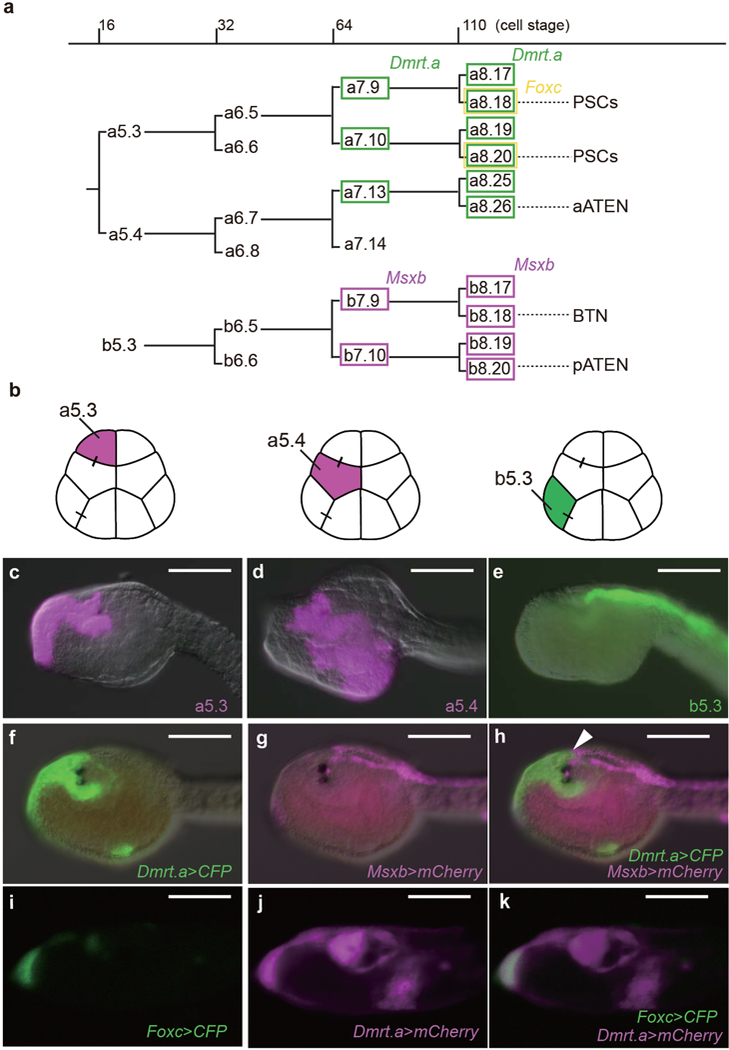
a, Cell lineages of anterior blastomeres (a-line blastomeres) and a posterior blastomere (b-line) from the 16-cell to 110-cell stages. Green identifies _Dmrt.a_-expressing blastomeres, magenta identifies Msxb expression lineages, and yellow identifies Foxc expression. b, Schematic illustration of 16 cell stage embryos. Each of the blastomeres that was labeled with Dil or DiO is indicated by magenta or green. c-e, Head regions of larvae labeled with DiI or DiO at the 16 cell stage. c, Labeling of the a5.3 lineage. d, Labeling of the a5.4 lineage. e, labeling b5.3 blastomere. f-h, Head region of a larva that was co-injected with _Dmrt.a_>CFP and Msxb>mCherry reporter genes. Arrowhead identifies the boundary of the Dmrt.a/Msxb expression territories. i-k, Head region of a larva co-injected with _Foxc_>CFP and Dmrt.a>mCherry reporter genes. Anterior to the left; scale bars, 100μm.
Extended Data Figure 2. Regulation of Eya expression by Dmrt.a and Msxb.
a-c, Head regions of larvae injected with an _Eya_>CFP reporter gene. Yellow arrowheads denote Eya expression in the proto-placodal region of Control MO injected larvae (36 of 36 larvae displayed this pattern) (a). c, there is expanded expression (white arrowheads) in Msxb morphants (39 of 48 larvae showed this phenotype). b, there is a loss of expression in Dmrt.a morphants (88 of 88 larvae showed this phenotype). Anterior to the left; scale bars, 100μm.
Extended Data Figure 3. Regulatory interactions among placodal determinants.
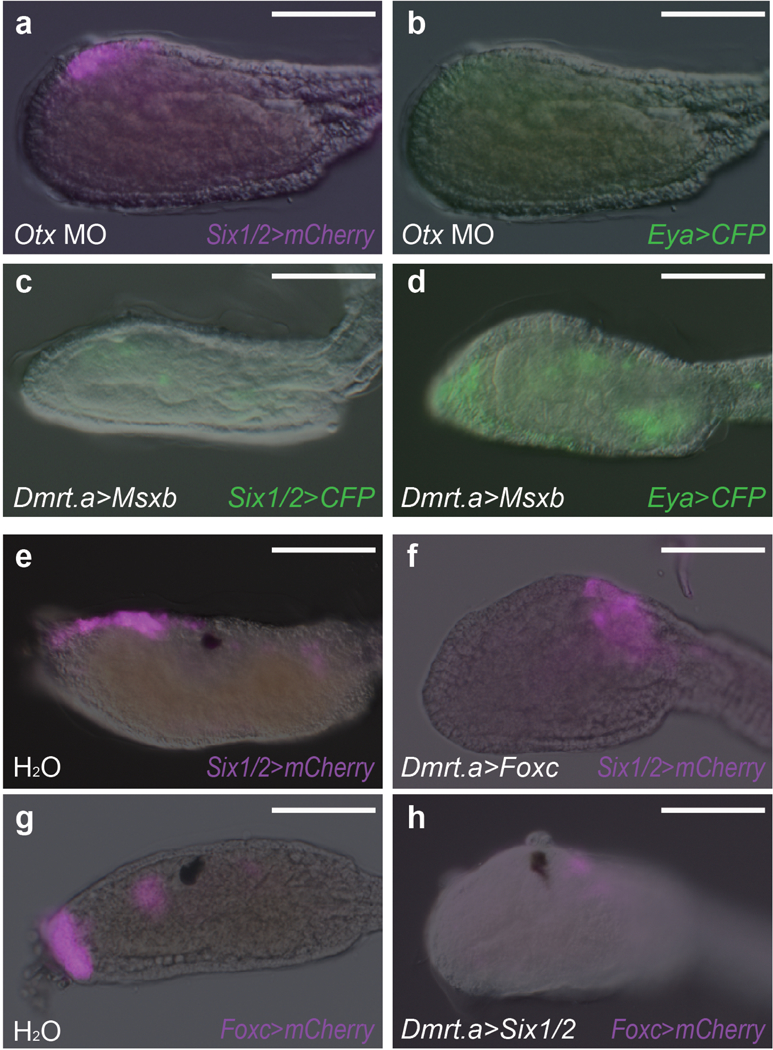
a, b, Head regions of larvae that were injected with an Otx MO, and co-injected with Six1/2>mCherry (a) and Eya>CFP (b) (32 of 32 larvae showed reduced or no expression of Six1/2>mCherry and no expression of Eya>CFP). c, d, Head regions of larvae injected with Dmrt.a>Msxb, and co-injected with Six1/2>CFP (33 of 33 larvae showed no expression of Six1/2>CFP) (c) and Eya>CFP (71 of 71 larvae showed little or no expression of Eya>CFP) (d). e, f, Head regions of larvae injected with Six1/2>mCherry, and co-injected with H2O (61 of 61 larvae showed full expression of Six1/2>mCherry) (e), or Dmrt.a>Foxc (50 of 50 larvae showed no expression of Six1/2>mCherry) (f). g, h, Head regions of larvae injected with Foxc>mCherry, and co-injected with H2O (40 of 40 larvae showed full expression of Foxc>mCherry (g) or Dmrt.a>Six1/2 (39 of 39 larvae showed no expression of Foxc>mCherry) (h). Scale bars, 100μm.
Extended Data Figure 4. Direct repression of Six1/2 expression by Msxb.
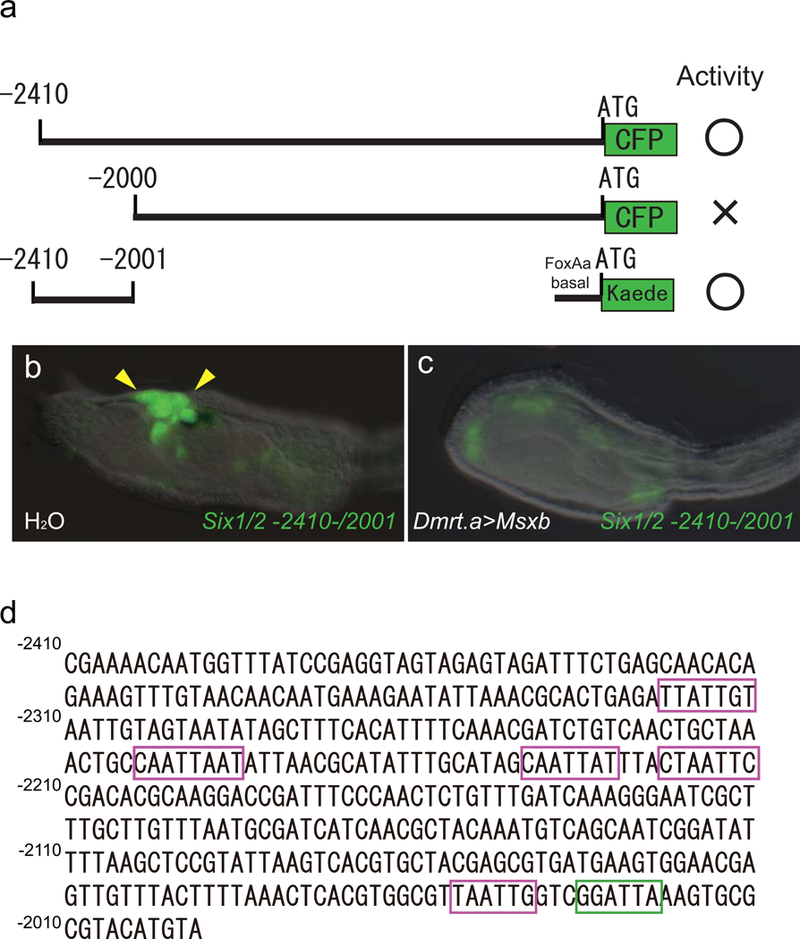
a Deletion analyses of the 5’ regulatory region of Six1/2. −2410 bp to −2001 bp of the 5’ _cis_-regulatory region is necessary for Kaede expression in the pre-placodal territory. b, c, head regions of larvae injected with _Six1/2 −2410/−2001_>Kaede, and co-injected with H2O (74 of 74 larvae showed full expression of Six1/2 −2410/−2001>Kaede) or _Dmrt.a_>Msxb (37 of 37 larvae showed no expression of Six1/2 2410/−2001>Kaede) (c). d, the Six1/2 5’ regulatory region spanning −2410 to −2001 bp contains an Otx binding site (green box) and multiple Msxb repressor binding sites (magenta box).
Extended Data Figure 5. Anterior expansion of Msxb expression in Dmrt.a morphant.
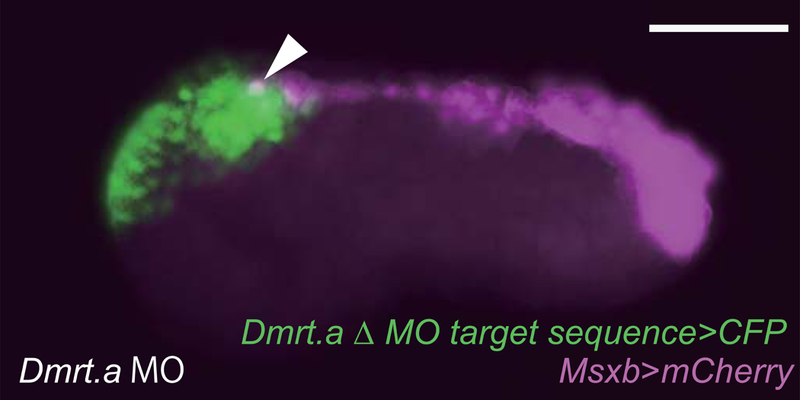
Tailbud embryo co-injected with Dmrt.a MO, Dmrt.a Δ MO target sequence>CFP and Msxb>mCherry construct. The anterior expansion of the Msxb>mCherry expression pattern is indicated by the white arrowhead. Anterior to the left; scale bars, 100μm
Extended Data Figure 6. Specification of aATEN sensory neurons.
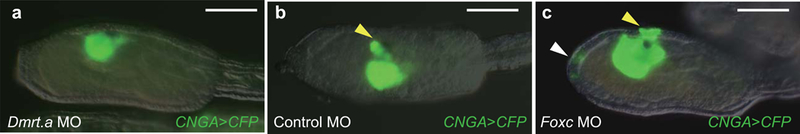
a-c, Larvae injected with _CNGA_>CFP reporter gene. Yellow arrowheads indicate expression in aATENs, and white arrowheads indicate ectopic sites of differentiated aATENs in the palp. a, Larva co-injected with Dmrt.a MO (62 of 62 larvae showed no expression of CNGA>CFP in aATENs). b, Larva co-injected with control MO (32 of 32 larvae showed full expression of CNGA>CFP). c, Larva co-injected with Foxc MO (18 of 42 larvae showed expanded expression of CNGA>CFP in palp region). Anterior to the left; scale bars, 100μm.
Extended Data Figure 7. Single Cell RNA-seq analysis. .
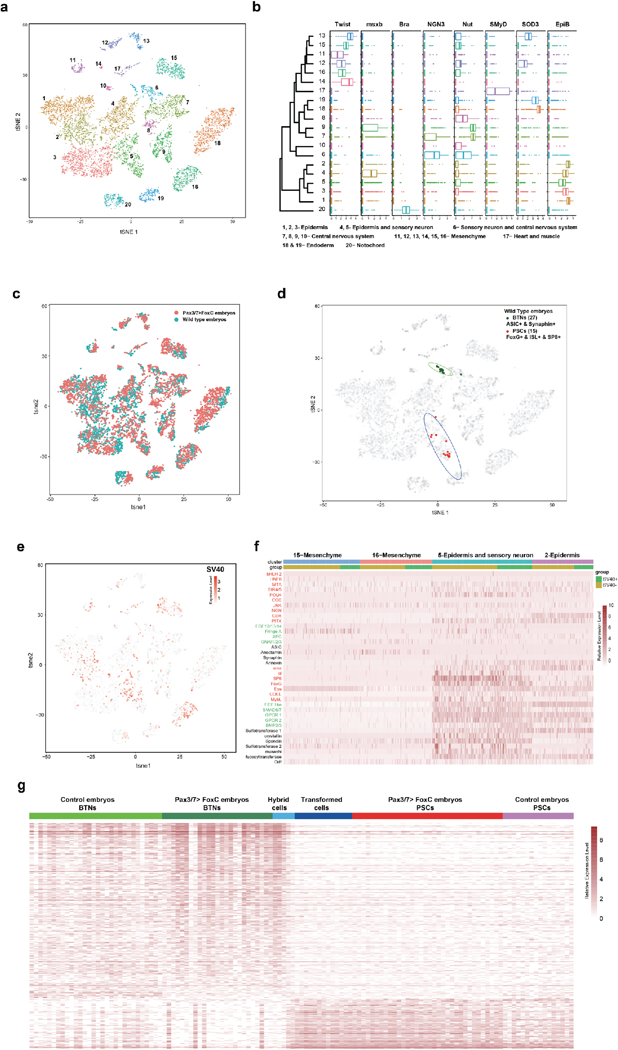
a, b, Identification of major cell types among 20 clusters with known markers, 3 epidermis clusters were identified by the expression of EpiB; 2 clusters of epidermis and sensory neurons were identified by the expression of either Msxb or Nut, along with EpiB; a cluster of sensory neurons identified by the expression of NGN3 and Nut; 3 clusters of central nervous system by high levels of Nut transcripts; 6 clusters of mesenchyme by their expression of Twist; 2 endoderm clusters by the high expression of SOD3; and one notochord cluster by the expression of Ci-T (Brachyury). c, Representation of overlap between cells from Pax3/7>Foxc and control embryos in each cell population. tSNE plot from Figure 3a, with each cell now colored to indicate their origin from either Pax3/7>Foxc embryos (red dots, n=5339) or control embryos (blue dots, n=4850). Both samples contribute to all 20 cell populations. d, Identification of BTNs and PSCs with the combination of representation markers in the control embryo, 27 BTNs (green dot) were identified by the combination of Asic1b & Synaphin, and 15 PSCs were identified by the combination of Foxg, islet, and SP8. e, Visualization of SV40 positive cells in Pax3/7>Foxc transgenic embryos within tSNE projection map. SV40 is detected in cells contained within clusters 2 and 5 for epidermis and sensory neuron cells, as well as weak expression in mesenchyme clusters 15 and 16. None of the transformed or hybrid cells contained in the sensory cell clusters (5 and 6) express any mesenchyme marker genes, suggesting that none of these are transformed by misexpression of Pax3/7. f, heatmap of representative genes (see Fig. 3e of main text) that show no significant differential expression in SV40 positive cells contained within clusters 2, 5, 15, and 16. g, heatmap of all differentially expressed genes between BTNs and PSCs from both control and Pax3/7>Foxc embryos.
Extended Data Figure 8. New identified markers for PSCs and BTNs.
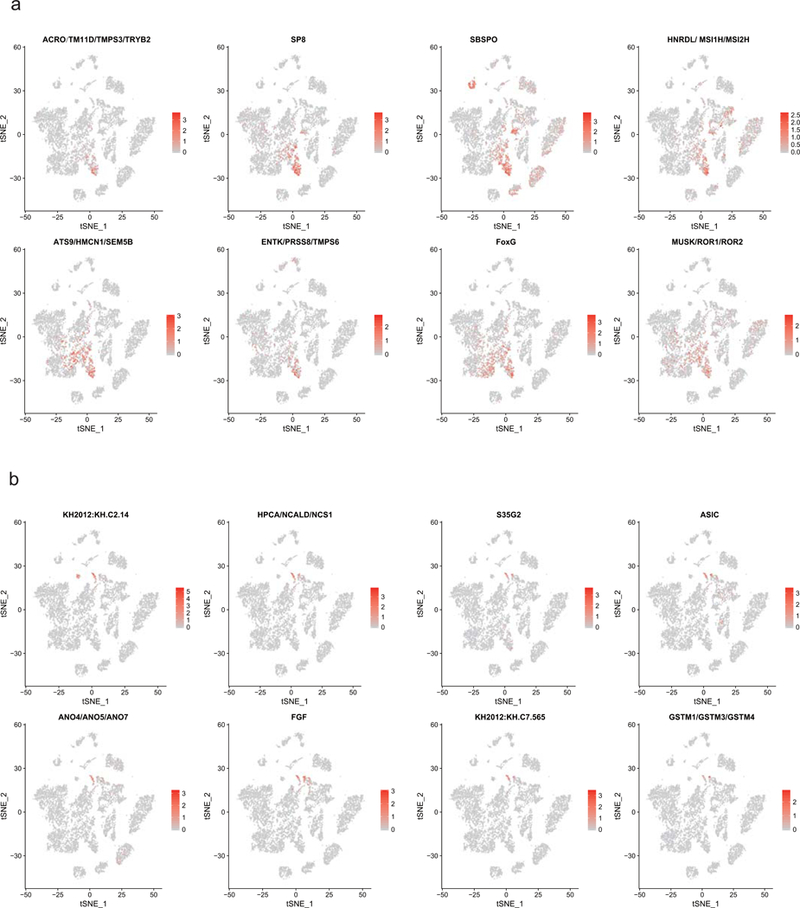
Distribution of new identified marker gene in PSCs (a) and BTNs (b).
Extended Data Figure 9. Heatmap of differentially expressed and co-expressed genes between PSCs, aATENs and BTNs from rom wild type late tailbud stage II embryos.
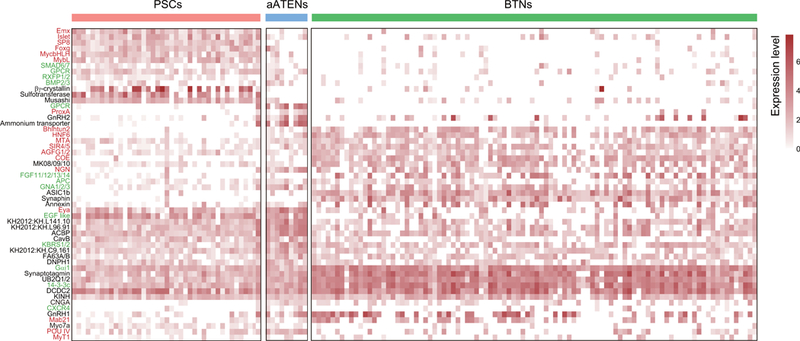
Transcription factors (red), signaling pathway genes (green), and effector genes (black).
Extended Data Figure 10. Control experiments for MO gene disruption assays.
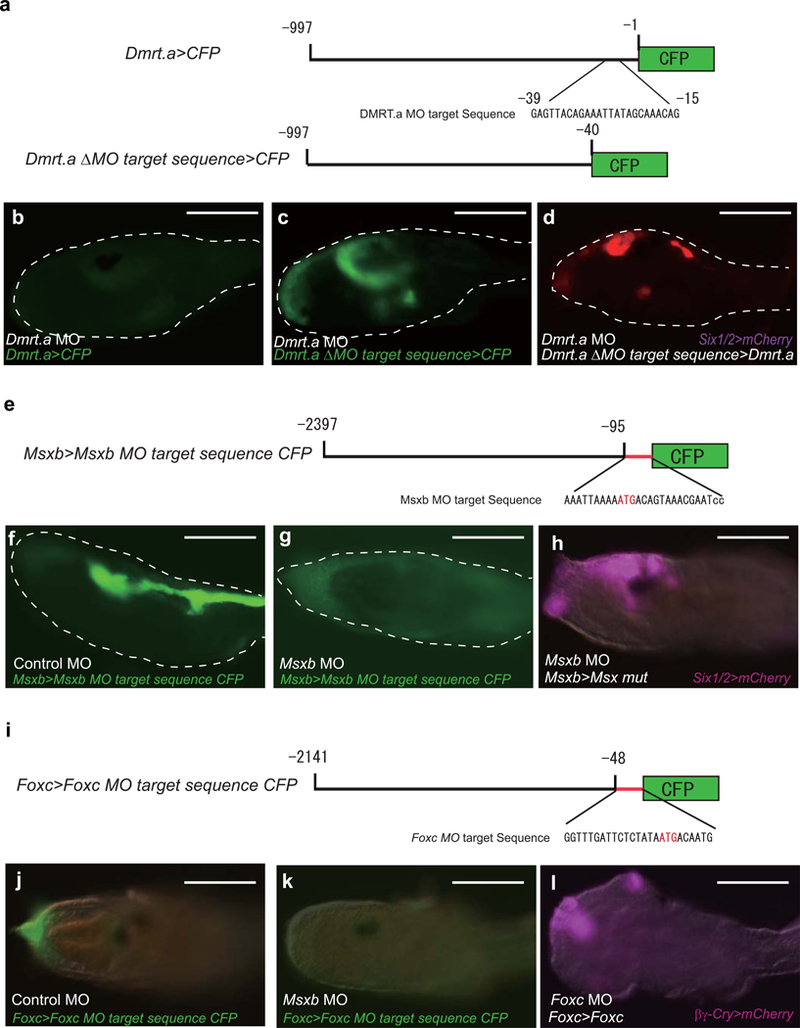
a-d, Dmrt.a MO. a, Schematic diagram of reporter gene containing Dmrt.a regulatory genes with and without recognition sequences for the Dmrt.a MO that was used in this study. The MO recognition sequences are located in the 5’ UTR, upstream of the initiating AUG codon (−1). b, Larva injected with Dmrt.a MO and co-injected with the Dmrt.a>CFP reporter gene containing the MO recognition sequences. 46 of 46 larvae showed no protein synthesis from the Dmrt.a>CFP reporter. c, Same as b except that the reporter gene lacks the Dmrt.a MO recognition sequence (Dmrt.a ΔMO target>CFP). 57 of 57 larvae showed C_FP_ expression in appropriate head tissues. Dmrt.a MO efficiently blocks the expression of CFP that contains the Dmrt.a MO target sequence. d, Larva co-injected with Dmrt.a MO_, Dmrt.a ΔMO>Dmrt.a_ and Six1/2>mCherry. Dmrt.a MO morphants normally lack Six1/2>mCherry expression (see Fig. 2b), but expression is restored with a Dmrt.a transgene that lacks the MO recognition sequence (107 of 108 larvae showed expression of Six1/2>mCherry). This result shows that the Dmrt.a MO used in this study specifically blocks the synthesis of Dmrt.a protein products. e-h, Msxb MO. e, Diagram of Msxb 5’ regulatory region and the location of the recognition sequences for the Msxb MO and point mutations in this sequence. f, g, Larvae injected with Msxb> CFP containing MO recognition sequences, and co-injected with control MO (54/54 larvae showed CFP expression) (f). g, Same as f except that the Msxb MO was coinjected in place of the control MO (44/44 larvae showed no expression of CFP). These results show that the Msxb MO specifically blocks CFP protein synthesis from the Msxb reporter gene. h, Larva co-injected with Msxb MO, Six1/2>mCherry, and Msxb>CFP reporter gene containing point mutations in MO recognition sequence (see red letters in panel e). Msxb morphants normally display expanded expression of Six1/2 in tail regions (see Figure 2c). This expansion is suppressed by co-injection of the mutant Msxb transgene lacking MO recognition sequences (h). This result suggests that the Msxb MO inhibits synthesis of Msxb protein products. i-l, Foxc MO. i, Diagram of Foxc 5’ regulatory region showing the location of the MO recognition sequence and point mutations in this sequence. j-l, Larvae injected with Foxc>Foxc transgene and _Foxc_>CFP reporter gene, and also co-injected with control MO (25/25 larvae showed CFP expression) (j). k, Same as j except that the embryo was co-injected with the Foxc MO in place of the control MO (99/99 larvae showed no expression of CFP) (k). This result shows that the Foxc MO efficiently blocks the synthesis of CFP proteins encoded by the Foxc>CFP reporter gene containing the Foxc MO target sequence. l, Larvae co-injected with Foxc MO, Foxc>Foxc mut (MO-resistant Foxc cDNA) and βγ-crystallin>mCherry. Normally, Foxc morphants lack expression of the βγ-crystallin>mCherry reporter gene (see Figure 2f). However, expression is restored by co-injection of Foxc>Foxc transgene. This result suggests that the Foxc MO inhibits synthesis of Foxc protein products. Scale bar, 100μm.
Supplementary Material
Reporting Summary
SI Guide
Sup Table 1
Acknowledgments
We thank all the members of the LSI genome facility for technical support of the single cell RNA-seq assays and analysis. We also thank Reiko Yoshida and Chikako Imaizumi and all other members of the staff at the Maizuru Fisheries Research Station of Kyoto University for providing Ciona intestinalis. This study was supported by a grant from the NIH to M.L. (NS076542) and by Grants-in-Aid for Scientific Research from JSPS to T.H. (24687008, 16K07433). T.H. was supported by the Pre-Stagic Initiatives, University of Tsukuba. Portion of Ciona intestinalis and plasmids used in this study were provided by the National Bio-Resource Project (NBRP) of the MEXT, Japan. A. H. was partially supported by a fellowship from the Colombian Government (Colciencias 568).
Footnotes
Competing interest
The authors declare no competing interest
Image acquisition. Images of transgenic larvae were obtained with a Zeiss AX 10 epifluorescence microscope.
Data availability. Single-cell RNA-seq data that support the findings of this study have been deposited in Gene Expression Omnibus (GEO) with the accession code GSE115331 (https://www.ncbi.nlm.nih.gov/geo/query/acc.cgi?acc=GSE115331). All other data support the findings of this study are available from corresponding author upon reasonable request.
REFERENCE
- 1.Northcutt RG & Gans C The genesis of neural crest and epidermal placodes: a reinterpretation of vertebrate origins. Q. Rev. Biol 58, 1–28 (1983). [DOI] [PubMed] [Google Scholar]
- 2.Baker CV & Bronner-Fraser M The origins of the neural crest. Part II: an evolutionary perspective. Mech. Dev 69, 13–29 (1997). [DOI] [PubMed] [Google Scholar]
- 3.Schlosser G Do vertebrate neural crest and cranial placodes have a common evolutionary origin? Bioessays 30, 659–672 (2008). [DOI] [PubMed] [Google Scholar]
- 4.Schlosser G, Patthey C & Shimeld SM The evolutionary history of vertebrate cranial placodes II. Evolution of ectodermal patterning. Dev. Biol 389, 98–119 (2014). [DOI] [PubMed] [Google Scholar]
- 5.Stolfi A et al. Migratory neuronal progenitors arise from the neural plate borders in tunicates. Nature 527, 371–374 (2015). [DOI] [PMC free article] [PubMed] [Google Scholar]
- 6.Wagner E et al. Islet is a key determinant of ascidian palp morphogenesis. Development 141, 3084–3092 (2014). [DOI] [PMC free article] [PubMed] [Google Scholar]
- 7.Manni L et al. Neurogenic and non-neurogenic placodes in ascidians. J. Exp. Zool. B Mol. Dev. Evol 302, 483–504 (2004). [DOI] [PubMed] [Google Scholar]
- 8.Mazet F et al. Molecular evidence from Ciona intestinalis for the evolutionary origin of vertebrate sensory placodes. Dev. Biol 282, 494–508 (2005). [DOI] [PubMed] [Google Scholar]
- 9.Pasini A et al. Formation of the ascidian epidermal sensory neurons: insights into the origin of the chordate peripheral nervous system. PLoS Biol 4, e225 (2006). [DOI] [PMC free article] [PubMed] [Google Scholar]
- 10.Imai JH & Meinerzhagen IA Neurons of the ascidian larval nervous system in Ciona intestinalis: II. Peripheral nervous system. J. Comp. Neurol 501, 335–352 (2007). [DOI] [PubMed] [Google Scholar]
- 11.Horie T, Kusakabe T & Tsuda M Glutamatergic networks in the Ciona intestinalis larva. J. Comp. Neurol 508, 249–263 (2008). [DOI] [PubMed] [Google Scholar]
- 12.Wagner E & Levine M FGF signaling establishes the anterior border of the Ciona neural tube. Development 139, 2351–2359 (2012). [DOI] [PMC free article] [PubMed] [Google Scholar]
- 13.Patthey C, Schlosser G & Shimeld SM The evolutionary history of vertebrate cranial placodes--I: cell type evolution. Dev. Biol 389, 82–97 (2014). [DOI] [PubMed] [Google Scholar]
- 14.Abitua PB et al. The pre-vertebrate origins of neurogenic placodes. Nature 524, 462–465 (2015). [DOI] [PMC free article] [PubMed] [Google Scholar]
- 15.Imai KS et al. Regulatory blueprint for a chordate embryo. Science 312, 1183–1187 (2006). [DOI] [PubMed] [Google Scholar]
- 16.Tresser J et al. doublesex/mab3 related-1 (dmrt1) is essential for development of anterior neural plate derivatives in Ciona. Development 137, 2197–2203 (2010). [DOI] [PMC free article] [PubMed] [Google Scholar]
- 17.Aniello F et al. Identification and developmental expression of Ci-msxb: a novel homologue of Drosophila msh gene in Ciona intestinalis. Mech. Dev 88, 123–126 (1999). [DOI] [PubMed] [Google Scholar]
- 18.Wada H et al. Neural tube is partially dorsalized by overexpression of HrPax-37: the ascidian homologue of Pax-3 and Pax-7. Dev. Biol 187, 240–252 (1997). [DOI] [PubMed] [Google Scholar]
- 19.Huang X et al. The doublesex-related gene, XDmrt4, is required for neurogenesis in the olfactory system. Proc. Natl. Acad. Sci. U. S. A 102, 11349–11354 (2005). [DOI] [PMC free article] [PubMed] [Google Scholar]
- 20.Parlier D et al. The Xenopus doublesex-related gene Dmrt5 is required for olfactory placode neurogenesis. Dev. Biol 373, 39–52 (2013)21. [DOI] [PubMed] [Google Scholar]
- 21.Ahrens K & Schlosser G Tissues and signals involved in the induction of placodal Six1 expression in Xenopus laevis. Dev. Biol 288, 40–59 (2005). [DOI] [PubMed] [Google Scholar]
- 22.Schlosser G & Ahrens K Molecular anatomy of placode development in Xenopus laevis. Dev. Biol 271, 439–466 (2004). [DOI] [PubMed] [Google Scholar]
- 23.Pieper M et al. Origin and segregation of cranial placodes in Xenopus laevis. Dev. Biol 360, 257–275 (2011). [DOI] [PubMed] [Google Scholar]
- 24.Köster M et al. Activin A signaling directly activates Xenopus winged helix factors XFD-4/4’, the orthologues to mammalian MFH-1. Dev. Genes Evol 210, 320–324 (2000). [DOI] [PubMed] [Google Scholar]
- 25.Bailey AP et al. Lens specification is the ground state of all sensory placodes, from which FGF promotes olfactory identity. Dev. Cell 11, 505–517 (2006). [DOI] [PubMed] [Google Scholar]
- 26.Berry FB et al. , Functional interactions between FOXC1 and PITX2 underlie the sensitivity to FOXC1 gene dose in Axenfeld-Rieger syndrome and anterior segmentdysgenesis. Hum. Mol. Genet 15, 905–919 (2006). [DOI] [PubMed] [Google Scholar]
- 27.Corbo JC, Levine M & Zeller RW Characterization of a notochord-specific enhancer from the Brachyury promoter region of the ascidian, Ciona intestinalis. Development 124, 589–602 (1997). [DOI] [PubMed] [Google Scholar]
- 28.Schlosser G Induction and specification of cranial placodes. Dev. Biol 294, 303–351 (2006). [DOI] [PubMed] [Google Scholar]
- 29.Abitua PB et al. , Identification of a rudimentary neural crest in a non-vertebrate chordate. Nature 492, 104–107. (2012). [DOI] [PMC free article] [PubMed] [Google Scholar]
- 30.Gainous TB, Wagner E & Levine M Diverse ETS transcription factors mediate FGF signaling in the Ciona anterior neural plate. Dev. Biol 399, 218–225. (2015). [DOI] [PMC free article] [PubMed] [Google Scholar]
- 31.Russo MT et al. Regulatory elements controlling Ci-msxb tissue-specific expression during Ciona intestinalis embryonic development. Dev. Biol 267, 517–528. (2004). [DOI] [PubMed] [Google Scholar]
- 32.Roure A, Lemaire P & Darras S An otx/nodal regulatory signature for posterior neural development in ascidians. PLoS Genet 10, e1004548 (2014). [DOI] [PMC free article] [PubMed] [Google Scholar]
- 33.Hozumi A et al. Enhancer activity sensitive to the orientation of the gene it regulates in the chordate genome. Dev. Biol 375, 79–91 (2013). [DOI] [PubMed] [Google Scholar]
- 34.Satou Y, Imai KS & Satoh N Action of morpholinos in Ciona embryos. Genesis 30, 103–106. (2001). [DOI] [PubMed] [Google Scholar]
- 35.Satou Y, Imai KS & Satoh N The ascidian Mesp gene specifies heart precursor cells. Development 131, 2533–2541. (2004). [DOI] [PubMed] [Google Scholar]
- 36.Horie T et al. Ependymal cells of chordate larvae are stem-like cells that form the adult nervous system. Nature 469, 525–528. (2011). [DOI] [PubMed] [Google Scholar]
- 37.Zheng GX et al. Massively parallel digital transcriptional profiling of single cells. Nature communications, 8, p.14049 (2017). [DOI] [PMC free article] [PubMed] [Google Scholar]
- 38.Satou Y et al. An integrated database of the ascidian, Ciona intestinalis: towards functional genomics. Zoolog. Sci 22, 837–843. (2005). [DOI] [PubMed] [Google Scholar]
Associated Data
This section collects any data citations, data availability statements, or supplementary materials included in this article.
Supplementary Materials
Reporting Summary
SI Guide
Sup Table 1