Bacteriophage trigger antiviral immunity and prevent clearance of bacterial infection (original) (raw)
. Author manuscript; available in PMC: 2019 Jul 25.
Published in final edited form as: Science. 2019 Mar 29;363(6434):eaat9691. doi: 10.1126/science.aat9691
Abstract
Bacteriophage are abundant at sites of bacterial infection, but their effects on mammalian hosts are unclear. We have identified pathogenic roles for filamentous Pf bacteriophage produced by Pseudomonas aeruginosa (Pa) in suppression of immunity against bacterial infection. Pf promote Pa wound infection in mice and are associated with chronic human Pa wound infections. Murine and human leukocytes endocytose Pf, and internalization of this single-stranded DNA virus results in phage RNA production. This triggers Toll-like receptor 3 (TLR3)- and TIR domain-containing adapter-inducing interferon-β (TRIF)-dependent type I interferon production, inhibition of tumor necrosis factor (TNF), and the suppression of phagocytosis. Conversely, immunization of mice against Pf prevents Pa wound infection. Thus, Pf triggers maladaptive innate viral pattern-recognition responses, which impair bacterial clearance. Vaccination against phage virions represents a potential strategy to prevent bacterial infection.
P_seudomonas aeruginosa (Pa)_ is a Gramnegative bacterium found in infections of wounds, pressure ulcers, and burns that is responsible for extensive morbidity and mortality (1–3). The World Health Organization recently categorized Pa as a “priority pathogen” with the greatest risk to human health (4). Pa clinical isolates are often antibiotic-resistant, and no approved vaccine against Pa is available. Alternative strategies to prevent Pa infections are desperately needed.
The clearance of Pa infections typically requires effective phagocytosis and production of tumor necrosis factor (TNF) (5–7). However, Pa exhibits multiple strategies that inhibit bacterial clearance (8), allowing opportunistic infections to be established (9).
At sites of infection, filamentous Pf bacteriophage (Pf phage) are produced in abundance by Pa (10–13). Unlike lytic bacteriophage, temperate phage such as Pf do not typically lyse their bacterial hosts. Instead, they integrate into the bacterial chromosome as a prophage that is passed on to daughter cells. When filamentous phage virions are produced, they are generally extruded without bacterial lysis (14,15). We recently reported that Pf phage act as structural elements in Pa biofilms (12,13) and that they contribute to reduced inflammation in acute murine lung infections through unclear mechanisms (13). Here, we investigated the possibility that Pf phage promote Pa infections through direct effects on mammalian immunity.
Pf phage are found in human wounds and promote bacterial wound colonization, morbidity, and mortality in mice
To determine whether Pf phage are found in chronic Pa infections, we sampled 111 patients with infected nonhealing wounds referred to the Infectious Disease Service at the Stanford Advanced Wound Care Center over a period of 20 months and identified 37 patients infected with Pa (table S1).
We first examined the incidence of Pf phage in this cohort. Using a quantitative polymerase chain reaction (PCR) assay to measure Pf prophage (12), we found that 68% (25 out of 37) of _Pa_-infected human wounds in our study harbor Pf prophage (Fig. 1,A to C). This is consistent with a previous report that 60% of 241 clinical Pa isolates were Pf prophage-positive (16). Thus, Pf is frequently present in human Pa infections, including wounds.
Fig. 1. Pf phage promote _P_a wound infection.
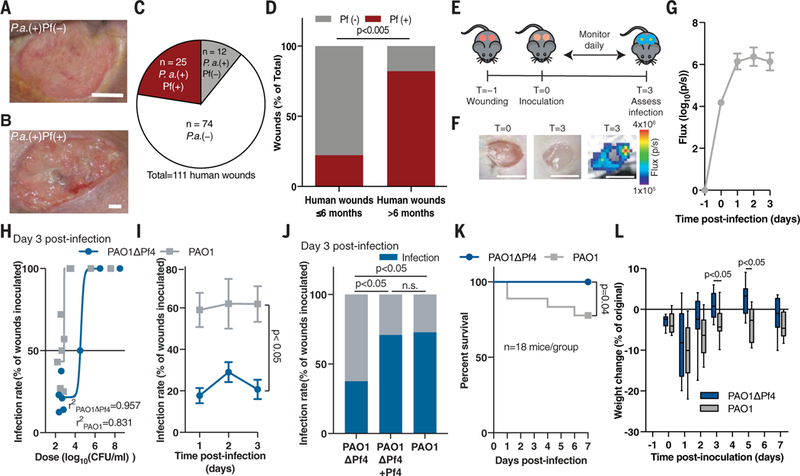
(A and B) Representative images of human _Pa_-infected wounds (A) negative and (B) positive for Pf. Scale bars: 5 mm. (C) Prevalence of Pf prophage in infected human wounds. (D) Prevalence of Pf phage in human wounds younger (n = 9) and older (n = 28) than 6 months of age; two-tailed Fisher’s exact test. (E) The full-thickness wound infection model. (F) Representative images of murine wounds before (left) and after infection (middle) showing luminescent bacterial signal (right). Scale bars: 5 mm. (G) Luminescent signal reflecting wound bacterial burden after inoculation with 7.5 ± 2.5 × 10² CFU/ml PAO1 (n = 14 wounds), the same dose used in (H) to (J). (H) Nonlinear regression analysis of wound infection rate 3 days after inoculation used to calculate the IC50 for PAO1 and PAO1ΔPf4. (I) Wound infection rate for PAO1 and PAO1ΔPf4 over time (n = 3 experiments, n >10 wounds each); two-way ANOVA. (J) Wound infection rate for PAO1ΔPf4, PAO1ΔPf4 supplemented with Pf4, or PAO1 at 3 days after inoculation. Summary of n = 2 experiments, n = 22 to 24 wounds/group; two-tailed Fisher’s exact test. (K) Survival (n = 18 mice/group, n = 2 experiments; log-rank Mantel-Cox test) and (L) weight loss (n = 12 mice/ group, representative of n = 2 experiments; two-tailed Student’s t test) after inoculation with 107 CFU/ml of PAO1ΔPf4 or PAO1.
We then examined the relationship between the presence of Pf and wound age in our cohort. Wounds infected with Pf-positive strains of Pa were significantly older than Pf-negative strains (2.1 years versus 0.5 years, respectively; p <0.0252) (table S1). Seventy-four percent (25 out of 34) of chronic wounds (defined as wounds older than 3 months) (17–19) were Pf prophage-positive, and 82% (23 out of 28) of chronic wounds older than 6 months (17–19) were Pf prophage-positive. By contrast, only 22% (2 out of 9) of wounds younger than 6 months were Pf-positive (Fig. 1D). In addition, patients infected with Pf-positive strains of Pa were younger than patients infected with Pf-negative strains (table S1). Thus, Pf is associated with chronic wounds in this cohort of human patients.
To experimentally assess the possibility that Pf phage promote Pa infections, we examined the ability of Pf-positive versus Pf-negative strains of Pa to establish wound infections in mice. To this end, we generated full-thickness, excisional wounds (20), allowed nascent wound eschars to form for 24 hours, and then inoculated these wounds with luminescent Pa strain PAO1, a bacterial wound isolate infected by Pf phage strain Pf4 (Fig. 1E and fig. S1A). In this model, we measured the presence or absence of bacterial infection 3 days after inoculation by quantifying luminescence relative to background signal (Fig. 1, F and G). On average, wounds infected with PAO1 contained ~109 copies of Pf4 phage per wound (fig. S1B). A strain of Pa lacking the Pf4 prophage, PAO1ΔPf4 (11), showed no differences in growth rate or luminescence emission compared to its isogenic parent PAO1 (fig. S1, C to E).
We then asked whether Pf4 phage contributes to bacterial pathogenesis. We examined the infection rate (the number of wounds with detectable and sustained Pa signal 72 hours after inoculation over the number of total wounds initially inoculated with Pa). Wounds deemed “infected” were those with luminescent bacterial signal above baseline. PAO1 and PAO1ΔPf4 differed significantly in their ability to establish wound infections in this model, with calculated IC50 values (bacterial dose at which 50% of wounds become colonized) of ~7.7 × 10² colony-forming units (CFU)/ml and ~3.8 × 10⁴ CFU/ml, respectively (Fig. 1H and fig. S2A). In subsequent experiments, mice received an inoculum of 7.5 ± 2.5 × 10² CFU/ml Pa, unless otherwise noted. Inoculation with PAO1 led to significantly higher infection rates than PAO1ΔPf4 (Fig. 1I and fig. S2A), whereas the reintroduction of Pf4 phage to PAO1ΔPf4 established infection rates and bacterial burdens comparable to those of infections caused by wild-type PAO1 (Fig. 1J and fig. S2B). The supplementation of additional Pf4 to PAO1 did not affect the infection rate or bacterial burden (fig. S2, C and D). Thus, Pf4 phage reduce the number of bacteria required to establish an infection.
We then explored the impact of Pf4 phage on morbidity and mortality. As inoculation with neither PAO1 nor PAO1ΔPf4 at a dose of 7.5 ± 2.5.× 102 CFU/ml resulted in any mortality, we increased our inoculation dose to 107 CFU/ml. This resulted in a 100% infection rate for both PAO1 and PAO1ΔPf4. In this setting, mortality was much higher in mice infected with PAO1 than in mice infected with PAO1ΔPf4 (Fig. 1K). Moreover, PAO1-infected mice that survived lost more weight than PAO1ΔPf4-infected mice (Fig. 1L). The bacterial burden over time was not statistically different at this higher inoculum (fig. S2, E and F). Thus, Pf4 phage promotes both the incidence and virulence of Pa wound infections in this model.
Stimulation with Pf4 phage triggers antiviral immunity and impaired bacterial clearance
Given the enhanced bacterial infection rate observed in the presence of Pf4 phage, we asked whether Pf4 phage might affect immune cell recruitment. However, analysis of wound leukocyte infiltrates by flow cytometry or histology showed no notable differences in either immune cell count or composition, granulation tissue, or epithelial gap (figs. S3, A to I, and S4, A to J).
We then considered whether Pf4 phage might improve bacterial infection rate through effects on phagocytosis and antibacterial cytokine secretion. To test this, we first measured the uptake of Pa by murine and human phagocytes in the presence or absence of Pf4. We found that the presence of Pf4 phage caused up to a 10× reduction in the number of bacteria internalized by murine bone marrow-derived dendritic cells (BMDCs) (Fig. 2A) and bone marrow-derived macrophages (BMDMs) (fig. S5A), as well as human U937 (Fig. 2B) and primary (fig. S5B) macrophages. The presence of Pf phage also reduced phagocytic clearance of clinical Pa isolates collected from human wounds (fig. S5C). Reintroduction of Pf4 phage to PAO1ΔPf4 was sufficient to inhibit phagocytic uptake (fig. S5D). Phagocytic killing was not affected by the presence of Pf4 (fig. S5E). Moreover, murine phagocytes stimulated with purified Pf4 likewise engulfed fewer fixed Escherichia coli particles than phagocytes stimulated with an equivalent volume of phosphate-buffered saline (PBS) carrier (Fig. 2,C and D, and fig. S5, F and G). Phagocytosis was not affected by increased adsorption of bacteria or bacterial particles to the exterior of phagocytes in the presence of Pf4 (fig. S5, H and I). Thus, Pf4 acts directly on phagocytes to inhibit bacterial engulfment.
Fig. 2. Pf phage inhibit phagocytosis and TNF production.
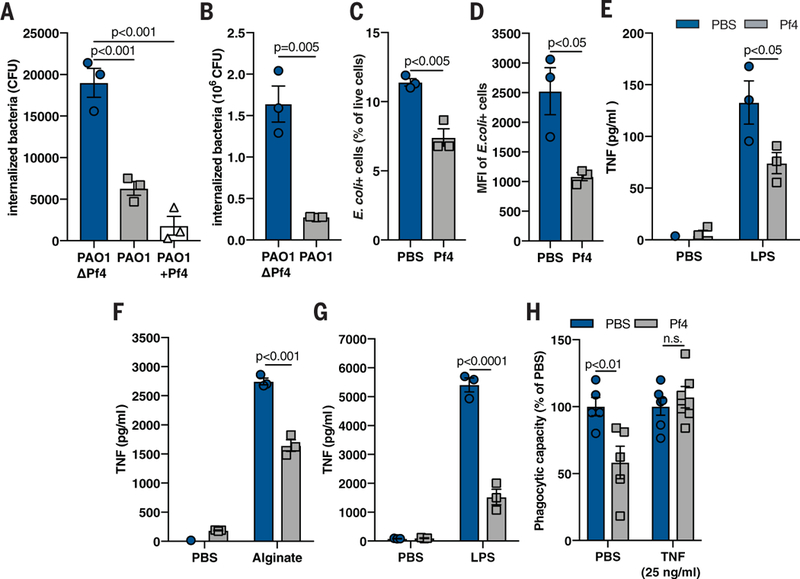
(A) Phagocytosis of live PAO1ΔPf4, PAO1, and PAO1 supplemented with exogenous Pf4 (PAO1+Pf4) by mouse BMDCs, as measured by a gentamicin protection assay. (B) Phagocytosis of live PAO1ΔPf4 and PAO1 by human U937 macrophages. (C) Phagocytosis by BMDCs of fixed E. coli particles labeled with a pH-sensitive dye (pHrodo) in the absence or presence of purified Pf4, as measured by flow cytometry. (D) Median fluorescence intensity (MFI) of E. coli pHrodo particle-positive cells from (C). (E and F) TNF production by murine BMDCs stimulated with Pf4 and (E) LPS or (F) alginate for 24 hours. (G) TNF production by human primary monocytes stimulated with Pf4 and LPS for 24 hours. (H) Phagocytosis of _E. coli_-pHrodo particles by BMDCs stimulated with exogenous TNF and Pf4. All graphs are representative of n ≥ 3 experiments and depict mean with SEM of n ≥ 3 replicates. Analysis: two-tailed Student’s t test.
Because the cytokine TNF is critical for phagocytosis and Pa clearance (5, 6), we next asked whether Pf4 affected TNF production. We stimlated murine phagocytes with lipopolysaccha-ride (LPS) or alginate—proinflammatory bacterial products known to induce TNF production (21)— and then added purified Pf4 or an equivalent volume of PBS carrier. Although both LPS and alginate induced robust TNF secretion, costimulation with Pf4 reduced TNF in murine phagocytes (Fig. 2,E and F, and fig. S6A) and human primary monocytes (Fig. 2G).
Because the Pf4-mediated inhibition of TNF occurred early after stimulation with bacterial products (fig. S6B), we hypothesized that the addition of exogenous TNF could overcome the inhibitory effects of Pf4 on phagocytosis. Pretreatment of phagocytes with TNF rescued phagocytic function in vitro despite the presence of Pf4 (Fig. 2H and fig. S6C) and reduced in vivo PAO1 wound infection (fig. S6D).
Notably, Pf4 did not affect phagocyte viability (fig. S7, A and B), and Pf4-mediated immune inhibition was not due to the presence of contaminating nucleic acids (fig. S7C), protein (fig. S7D), or endotoxin [fig. S7, E and F, detected levels <0.05 endotoxin units (EU)/ml] in our preparations. In addition, mock phage preparations generated from the PAO1ΔPf4 strain with the same protocol used to isolate Pf4 from PAO1 did not impair TNF secretion (fig. S7, G and H) or phagocytosis (fig. S7, I and J), indicating that Pf4 and not residual bacterial components conceivably present in our preparations were responsible for immune inhibition. Thus, TNF is implicated in the Pf4-mediated inhibition of phagocytic capacity.
Next, we wanted to define the mechanism of Pf4-mediated immune inhibition. BMDCs were stimulated with proinflammatory bacterial products such as alginate or LPS. We found that Pf4-mediated inhibition of TNF occurred in a concentration-dependent manner, which was maintained over time (Fig. 3, A and B). The Pf phage Pf1, but not the E. coli filamentous phage Fd1, also inhibited TNF production (Fig. 3, C and D) and phagocytosis (fig. S8, A and B). Thus, this effect was common among Pf phage but was not universal across all inoviruses. Both LPS and alginate still triggered the nuclear translocation of nuclear factor κB (NF-κB) (fig. S9, A to C), a key transcription factor associated with microbial-sensing pathways (22). Thus, phagocytes still sense these molecules in the presence of Pf4. Tnf mRNA expression levels likewise remained intact, despite the reduction in TNF protein (Fig. 3, E and F, and fig. S8, C and D). Notably, the inhibition of TNF in this system did not begin until 240 min after stimulation following a modest, transient increase in TNF (fig. S8C). This suggests that the inhibition of TNF was somewhat delayed relative to its induction. Thus, Pf4 inhibits TNF production otherwise induced in response to bacterial products. Furthermore, this inhibition occurs at the level of mRNA translation.
Fig. 3. Pf phage inhibits TNF in a type I IFN-dependent manner.
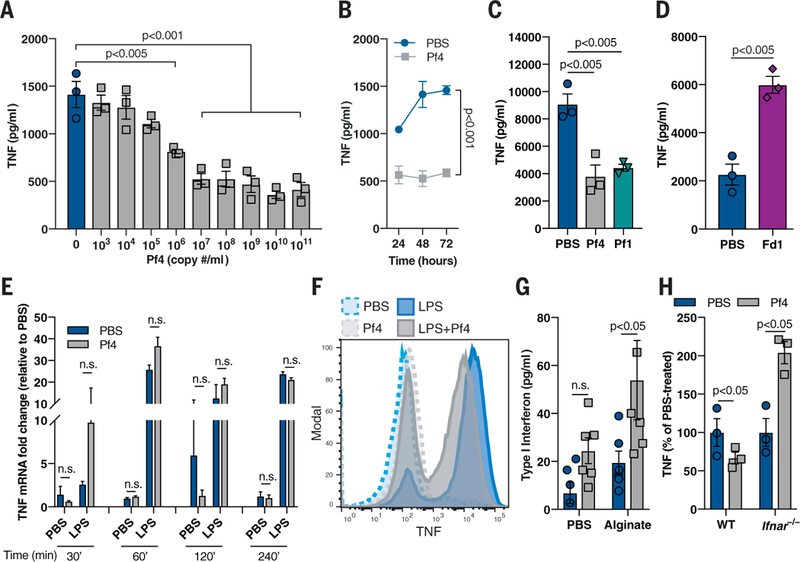
(A) TNF production by murine BMDCs stimulated with alginate and Pf4 for 48 hours. (B) TNF production over time by murine BMDCs stimulated with alginate and Pf4. (C) TNF production in BMDCs stimulated with alginate and either Pf4 or Pf1 phage for 72 hours. (D) TNF production in BMDCs stimulated with LPS and Fd1 phage for 24 hours. (E) TNF mRNA up-regulation in BMDCs stimulated with LPS and Pf4 for various time points. (F) Intracellular cytokine staining of TNF in BMDCs stimulated with Pf4 and then LPS. (G) Type I IFN production by BMDCs stimulated with alginate and Pf4 for 24 hours. (H) TNF production by WT or Ifnar −/− BMDCs stimulated with LPS and Pf4 phage for 24 hours. (A) to (H) are each representative of n ≥ 3 experiments and depict mean with SEM of n ≥ 3 replicates. Statistics: (E, G to H) two-tailed Student’s t test; (A, C to D) one-way ANOVA with Dunnett’s multiple comparison; (B) two-way ANOVA.
One factor that can suppress TNF production at the level of mRNA translation is type I interferon (IFN) (23,24). Indeed, Pf4 treatment in the setting of inflammatory bacterial stimuli promoted the production of type I IFN (Fig. 3G). Moreover, in phagocytes generated from mice lacking either the type I IFN receptor (Ifnar −/− mice) or both the type I and type II IFN receptors (Ifnr −/− mice), Pf4 treatment did not reduce TNF production (Fig. 3H and fig. S8F) or impair phagocytosis (fig. S8G) compared to wild-type controls. Thus, Pf4 reduces TNF production in a type I IFN-dependent manner.
Consequently, we hypothesized that Pf phage is recognized by antiviral pattern recognition receptors (PRRs) within the Toll-like receptor (TLR) family, which signal through the adapters TIR domain-containing adapter-inducing interferon-β (TRIF) or myeloid differentiation primary response 88 (MyD88) (25). Pf4-mediated suppression of TNF production (Fig. 4A) and phagocytosis (Fig. 4B) was abrogated in Trif −/− murine phagocytes but was maintained in Myd88 −/− cells (Fig. 4C), suggesting that Pf phage requires TRIF to interfere with TNF translation. This is consistent with recent reports that the simultaneous triggering of MyD88-NF-κB and TRIF pathways leads to type I IFN transcription (26) and that TRIF-mediated signaling pathways affect Tnf mRNA translation in other settings (27).
Fig. 4. Pf phage-mediated immune inhibition is TRIF- and TLR3-dependent and associated with production of phage RNA.
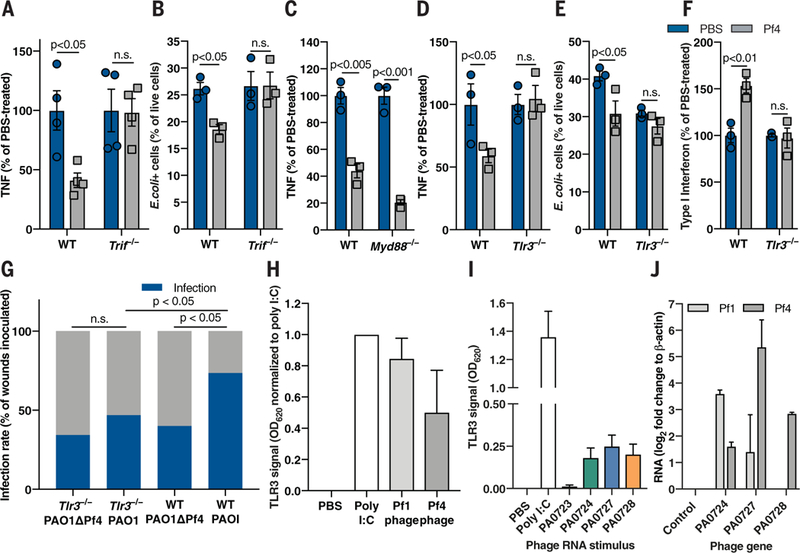
(A) TNF production by WT and Trif −/− BMDCs stimulated with alginate and Pf4 for 48 hours. (B) E. coli -pHrodo-positive cells in WT and Trif −/− Pf-stimulated BMDCs. (C) TNF production by WT and Myd88 −/− BMDCs stimulated with alginate and Pf4 for 48 hours. (D) TNF production by WT and T/r3 −/− BMDCs stimulated with alginate and Pf4 for 24 hours. (E) _E. coli_-pHrodo-positive cells in WT or Tlr3 −/− BMDMs stimulated with Pf4. (F) Type I IFN production by BMDCs stimulated with LPS and Pf4 for 24 hours. (A) to (F) are each representative of n ≥ 3 experiments and depict mean with SEM of n ≥ 3 replicates. Statistics: two-tailed Student’s t test. (G) Wound infection rate 3 days after infection in Tlr3 −/− and WT mice inoculated with 7.5 ± 2.5 × 10² CFU/ml PAO1 or PAOlΔPf4. Summary of n = 2 experiments, n = 30 to 34 wounds/group. Statistics: two-tailed Fisher’s exact test. (H and I) _Tlr3_-reporter signal in response to (H) whole Pfl and Pf4 phage; (I) RNA from Pf4 genes. (J) RNA detected in human monocytes stimulated with whole Pfl or Pf4 phage for 24 hours. Summary of n = 2 (I and J) or n ≥ 3 (H) experiments with n > 3 replicates; depicted are means and SEM.
To determine which specific antiviral PRR upstream of TRIF might mediate Pf-mediated immune inhibition, we generated bone marrow-derived phagocytes from mice deficient for either the antiviral sensors TLR3 and TLR9 or the antibacterial sensor TLR2 (as a control). We also generated phagocytes from mice lacking the single-stranded DNA (ssDNA) sensors cyclic GMP-AMP synthase (cGAS) or stimulator of interferon genes (STING) (28,29), as Pf phage have ssDNA genomes. We measured TNF production by these cells in response to bacterial inflammatory stimuli alginate or LPS in the absence or presence of Pf4. Pf4 did not diminish TNF production or phagocytic capacity in Tlr3 −/− phagocytes (Fig. 4, D and E, and fig. S10, A and B), nor did it up-regulate type I IFN production in Tlr3 −/− cells (Fig. 4F). TNF suppression was intact in Tlr9 −/− , Tlr2 −/− , Cgas −/−, and Sting −/− phagocytes (fig. S10, C to E). Finally, Pf4 phage did not promote wound infection in Tlr3 −/− mice (Fig. 4G). Thus, the canonical antiviral receptor TLR3 and the adapter TRIF are required for Pf4 to inhibit TNF production, which consequently promotes bacterial infection.
To ascertain which components of Pf4 trigger TLR3, we used a _Tlr3_-reporter cell line. There was robust Tlr3 signaling in response to whole Pf1 and Pf4 phage (Fig. 4H). As TLR3 detects double-stranded RNA (dsRNA) rather than ssDNA, we added purified RNA from Pf4 phage genes to the 7lr3-reporter cells and observed TLR3 activation in response to several of them (Fig. 4I). Thus, Pf4 RNA can trigger TLR3. Finally, we stimulated human monocytes with whole Pf1 or Pf4 phage and subsequently detected RNA derived from various phage genes (Fig. 4J). Considering that ribonuclease (RNAse) treatment of purified Pf4 did not abrogate TNF inhibition (fig. S7C), phage internalization appeared to result in RNA synthesis, which, in turn, triggered TLR3 responses. This hypothesis is consistent with a previous report that used a related filamentous phage modified to facilitate cell entry and to express a reporter gene (30). However, our data suggest that a natural bacteriophage can produce mRNA within human cells. We cannot exclude the possibility that a small amount of viral RNA may have been inadvertently packaged within some phage particles. Nonetheless, Pf phage and Pf phage RNA can trigger TLR3 signaling.
Given that TLR3 is present within endocytic vesicles (31), we next asked whether Pf4 is internalized by endocytosis. Fluorescently labeled Pf4 was internalized by murine phagocytes with minimal adsorption (Fig. 5, A and B; fig. S11A; and movie S1). Moreover, within these cells, Pf4 phage colocalized with TLR3 (Fig. 5C). Transmission electron microscopy imaging of Pf4 within BMDCs demonstrated the presence of Pf4 in endosomal or lysosomal vesicles and in the cytosol (Fig. 5, D and E, and fig. S11, B to E). Treatment with brefeldin A, a vesicular transport inhibitor, greatly reduced Pf4 uptake (fig. S11F). Inhibitors of receptor-mediated endocytosis and microtubule assembly— wortmannin and nocodazole, respectively—also reduced Pf4 uptake, as did chlorpromazine, an inhibitor of clathrin-mediated endocytosis, although to a lesser extent (Fig. 5F). Thus, Pf4 is internalized by mammalian cells, consistent with reports of uptake of other phages (32–34). Additionally, this internalization occurs by endocytosis, and Pf4 encounters TLR3 in endosomes and lysosomes.
Fig. 5. Pf phage is actively taken up by immune cells through endocytic pathways.
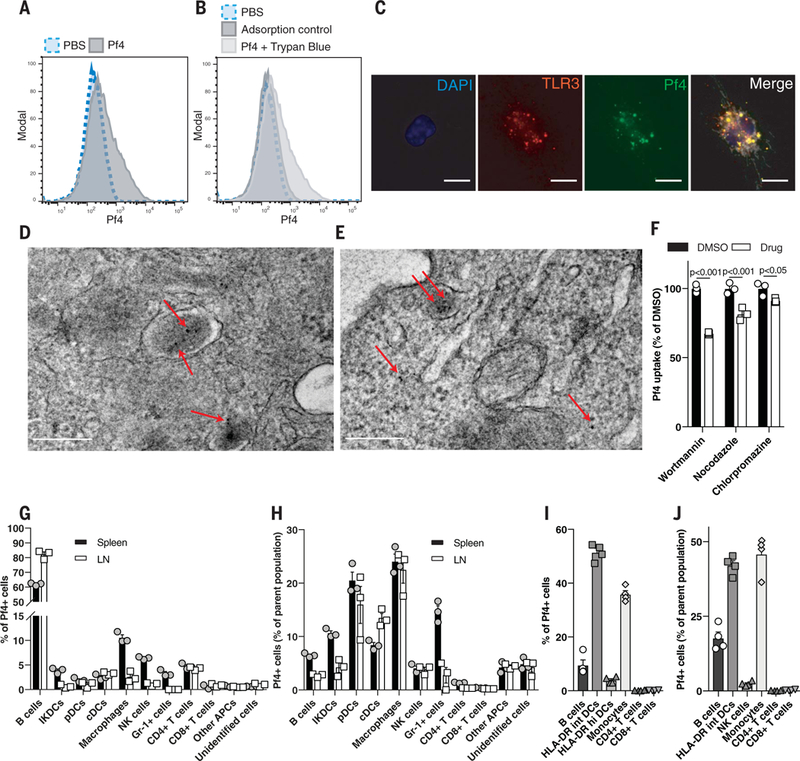
(A) Flow cytometric analysis of fluorescently labeled Pf4 uptake by BMDCs. (B) Flow cytometric analysis of BMDCs stimulated with fluorescently labeled Pf4 at 4°C (adsorption control) or with extracellular fluorescence quenched with trypan blue. (C) Immunofluorescence staining of TLR3 in BMDMs stimulated with fluorescently labeled Pf4. Scale bar: 10 μm. (D and E)Transmission electron microscopydepictinggold-abeled Pf4 present in intracellular lysosomes and the cytosol in BMDCs after 3 hours (D) and 24 hours (E) of Pf4 stimulation. Scale bars: 200 nm. (F) Pf4 uptake by BMDCs treated with various endocytosis inhibitors before Pf4 stimulation. Statistics: two-tailed Student’s t test. DMSO, dimethyl sulfoxide. (G) Composition by cell type of mouse leukocytes isolated from spleen or lymph node positive for fluorescently labeled Pf4. (H) Percentage of individual immune cell populations within mouse spleen and lymph nodes that took up Pf4. (I) Composition by cell type of human PBMCs that have taken up fluorescently labeled Pf4. (J) Percentage of individual immune cellpopulationswithin humanPBMCs that took up Pf. (A), (B), and (F) to (J) are each representative of n ≥ 3 experiments. Graphs depict mean with SEM of n ≥ 3 replicates.
We then asked which cell types internalize Pf4. Flow cytometric analysis revealed that most phagocytes that internalized Pf4 were positive for CD14 (fig. S11G), a receptor that enhances TLR3 signaling (35). Pf4 was taken up by diverse cell types within mouse splenocytes and lymphocytes and wound-infiltrating immune cells, including B cells and DCs (Fig. 5, G and H, and figs. S11H and S12). Finally, various human peripheral blood mononuclear cells (PBMCs), including monocytes, DCs, and B cells, also internalized Pf4 phage (Fig. 5, I and J, and fig. S13).
Thus, we propose a model in which Pf phage are endocytosed by leukocytes, whereupon the Pf particles or RNA trigger TLR3 and TRIF-dependent viral PRRs, driving type I IFN production, inhibiting TNF production, and limiting phagocytosis. These effects result in impaired bacterial clearance and more frequent infection (Fig. 6).
Fig. 6. A model of Pf4-mediated inhibition of TNF and phagocytosis.
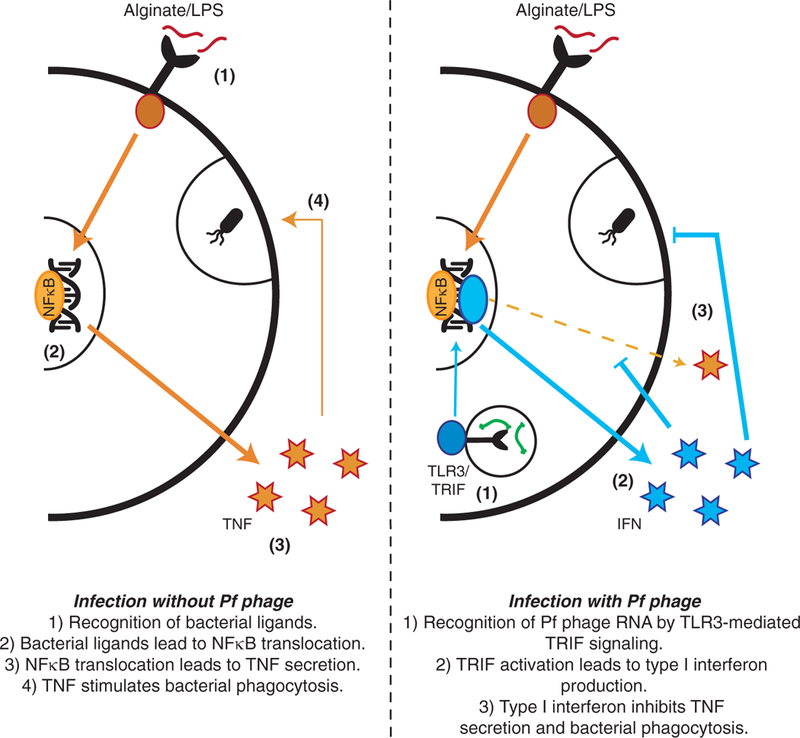
Bacterial ligands stimulate TNF production and phagocytosis in BMDCs. Pf4 gets taken up through endocytic pathways, where Pf RNA stimulates TLR3-mediated TRIF signaling, which induces IFN production. IFN inhibits TNF production and phagocytosis.
Antibodies directed against Pf4 prevent Pa colonization
We next asked whether targeting Pf4 therapeutically might prevent Pa wound colonization. To this end, we identified a region of CoaB, the major coat protein of Pf phages, that is broadly conserved across 669 isolates of Pa (Fig. 7A). We then immunized mice with a peptide version of this epitope conjugated to keyhole limpet hemocy-anin (KLH) (fig. S14A). This protocol successfully generated humoral immunity against Pf phage (fig. S14B).
Fig. 7. Antibodies against Pf phage protect against Pa colonization.
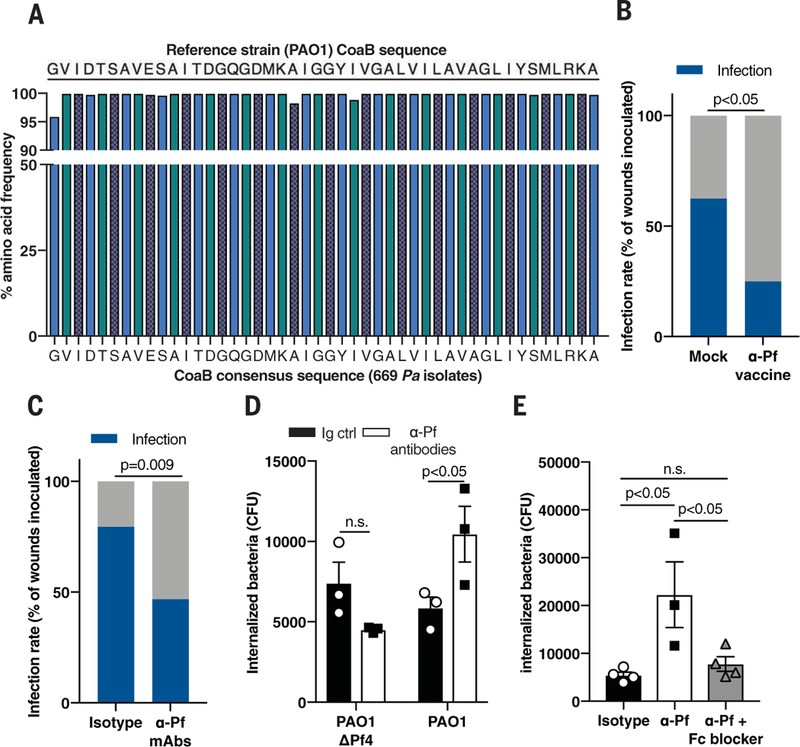
(A) Consensus sequence analysis of CoaB across 669 Pa isolates. (B) Infection rate in full-thickness wounds 3 days after inoculation with 7.5 ± 2.5 × 10² CFU/ml PAO1 in mice vaccinated against CoaB coat protein, compared to mock-vaccinated mice (n = 16 to 20 wounds/group); two-tailed Fisher's exact test. (C) Infection rate in full-thickness wounds 3 days after inoculation with 7.5 ± 2.5×10² CFU/ml CFU/ml PAO1 in mice topically treated with isotype control or mAbs directed against CoaB protein. Summary of two experiments with n = 30 to 34 wounds per experimental group; two-tailed Fisher’s exact test. (D) Phagocytosis of PAO1ΔPf4 and PAO1 by BMDCs treated with isotype control or mAbs directed against CoaB protein; two-tailed Studen’s t test. (E) Phagocytosis of PAO1 by BMDCs treated with mAbs directed against CoaB with or without Fc block; one-way ANOVA with Tukey multiple comparison. (D) and (E) are representative of n ≥ 3 experiments; depicted is mean with SEM of n ≥ 3 replicates.
Using our infection model, we next tested the impact of vaccination against Pf phage on the development of stable Pa infection. Compared to mock vaccination, vaccination against the CoaB epitope reduced the incidence of Pa wound infections by half (Fig. 7B).
Because immunization itself might influence the incidence of wound infections, we asked whether transfer of passive, humoral immunity against Pf phage was sufficient to prevent Pa infection. To this end, we administered monoclonal antibodies (mAbs) generated against the same CoaB peptide epitope incorporated into our vaccine to mice during bacterial inoculation (fig. S14, C and D). Transfer of these mAbs into wounded skin in the presence of Pa significantly reduced stable wound infection compared to treatment with isotype control antibodies (Fig. 7C). Thus, Pf phage is critically important during early wound infection, and humoral immunity against Pf is protective against Pa infection.
Given these pronounced effects, we then asked how antibodies directed against Pf are protective. Antibodies against Pf phage did not prevent Pf phage internalization by bone marrow-derived phagocytes (fig. S14E). Instead, mAbs directed against Pf promoted phagocytic engulfment of PAO1 but not PAO1ΔPf4 (Fig. 7D). This enhanced phagocytosis was abrogated upon addition of anti-CD16/CD32 Fc block (Fig. 7E and fig. S14F). Thus, antibody-mediated recognition of Pf phage facilitates Pa phagocytosis. Because Pf phage adhere to type IV pili on the surface of Pa (10), it is possible that antibodies to Pf promote opsonization of bacteria coated with Pf phage.
Discussion
These findings establish pathogenic roles for Pf bacteriophage in Pa infections. In particular, we find that internalized bacteriophage trigger maladaptive, antiviral responses that suppress bacterial clearance, resulting in the establishment of Pa wound infections. Consistent with this, 68% of human Pa wound infections in our cohort contained Pf, and the presence of this phage was associated with more chronic wounds. Our data reveal direct roles for phage virions in the pathogenesis of bacterial infection by suppressing anti-bacterial immunity.
These findings may have broad relevance beyond Pf phage and Pa wound infections. Pf phage are also abundant in _Pa_-associated respiratory infections (12)and arelikely tobepresent in other Pa infections. Other phage can be internalized by mammalian cells (30,32–34), and large numbers of phage are transcytosed by gut epithelial cells (36). We hypothesize that human cells may internalize phage produced by both commensal and pathogenic bacteria, and this direct interaction with immune cells could occur on a scale that substantially affects human health.
Consistent with a pathogenic role for Pf, both passive and active immunization against Pf phage protected against Pa infections. Because CoaB is highly conserved across Pf isolates, this strategy may have value in preventing infection with Pa. Other studies have reported that antibodies against bacteriophage clear phages and lead to a reduction of their antibacterial activity and worsening of infection (37). As other filamentous phage are implicated in bacterial colonization (38),immunization againstphage virions maybe a promising strategy to prevent other infectious diseases as well.
Our findings may complicate efforts to develop phage as a therapeutic option for antibiotic-resistant infections. However, to date, lytic phage have not been reported to suppress phagocytosis (39) or local inflammatory cytokine secretion (40). This suggests that temperate and lytic phage may differ in this regard. Lytic bacteriophages have previously been reported to play an important, synergic role in the immunological clearance of bacterial pathogens (41). Interactions between mammalian hosts and their phageomes are likely to be dynamic and complex (42) and a promising area for further investigation.
In conclusion, these studies establish the importance of internalized bacteriophage in a bacterial infection and suggest that bacteriophages may have profound and direct effects on human health and physiology.
Materials and Methods
Mice
Mice were bred and maintained under specific pathogen-free conditions, with free access to food and water, in the vivarium at Stanford University. Mice that underwent surgery received additional Supplical Pet Gel (Henry Schein Animal Health, Cat. No. 029908) and intraperitoneal injections of sterile saline (Hospira, Cat. No. 0409–4888-10). All mice used for in vivo infection experiments were littermates. Conventional C57BL/6J mice, as well as Ticam1 Lps2/J (Jrif −/−), Tlr2 tmlKir (Tlr2 −/−), Tlr 3tm1Flv /J (Tlr3 −/−), Tlr9 M7Btlr _/_Mmjax (_Tlr9_−/−) and Myd88 tm1.1Defr _/_J (Myd88 −/−) bred on the C57BL/6 background for ≥10 generations, were purchased from The Jackson Laboratory (Bar Harbor, ME). The Cgas −/− and Sting Gt/Gt (Sting −/−) mice, also on the C57BL/6 background, were gifts from the L. Li lab at Stanford University. The _Ifnar_−/− mice were a gift from the S. Einav lab at Stanford University, and _Ifnr_−/− mice, also on the C57BL/6J background, were created by the Stanford Veterinary Service Center by crossing Jackson Laboratory-derived Ifnar1 −/− and Ifngr −/− mice for ≥10 generations. All experiments and animal use procedures were approved by the Institutional Animal Care and Use Committee at the School of Medicine at Stanford University.
Chemicals, antibiotics, and reagents
The following chemicals, antibiotics and reagents were used: lipopolysaccharide from E. coli O111: B4 (Sigma, Cat. No L4391); alginic acid (Sigma, Cat. No. A0682); bovine serum albumin (BSA) (Fisher Bioreagents, Cat. No. BP1600); heat-inactivated fetal bovine serum (FBS) (RMBIO, Cat. No. FBS-BHT-5XM); RPMI (HyClone, Cat. No. SH30027.01); penicillin-streptomycin solution (Corning, Cat. No. MT30002CI), sodium pyruvate (HyClone, Cat. No. SH3023901); tryp-tone (Fluka Analytical, Cat. No. T7293); sodium chloride (Acros Organics, Cat. No. 7647–14-5); yeast extract (Boston BioProducts, Cat. No. P-950); agar (Fisher BioReagents, Cat. No. BP9744); gentamicin (Amresco, Cat. No. E737); carbenicillin (Gold Biotechnology, Cat. No. C-103–25); and kanamycin (Fisher BioReagents, Cat. No. BP906).
Antibodies
The commercial antibodies used in these studies are listed in table S3. The mouse anti-CoaB immunoglobulin G (IgG) clones 1, 2, 3 and the IgM clone 4 were generated by ImmunoPrecise (Victoria, Canada) on commission.
Bacterial strains and culture conditions
P. aeruginosa strain PAO1 was used for all experiments unless stated otherwise. Isogenic phage-free strain PAO1ΔPf4 is derived from strain PAO1, but PAO1ΔPf4 lacks the genomic copy of Pf4 entirely (11). This strain can still be reinfected by Pf4. For one experiment, two clinical strains of P. aeruginosa isolated from infected human Pf-positive (patient 5) and Pf-negative (patient 320) wounds were used. In general, bacteria were prepared as follows. Frozen glycerol stocks were streaked on Luria-Bertani (LB) agar containing selective antibiotics (PAO1 and clinical strains: none; PAO1ΔPf4:10 μg/ml of gentamicin; luminescent strains: 100 μg/ml of carbenicillin and 12.5 μg/ml of kanamycin) and grown overnight at 37°C. An isolated colony was picked and grown overnight at 37°C in LB medium, pH 7.4 (for luminescent strains, broth contained 100 μg/ml of carbenicillin) under shaking, aerobic conditions. If Pf phage supplementation was required, aliquots were grown until mid-exponential phase and split in two. One split received ~1 × 10⁹ Pf4/ml purified phage before overnight incubation. The next day, cultures were diluted to OD600 (optical density at 600 nm) = 0.05 in 75 ml of LB media and cultures were grown until the early exponential phase (OD600 ≈ 0.3). OD600 was measured and the required number of bacteria were calculated, washed, and readied for use in experiments.
Preparation of heat-killed bacteria
In brief, bacteria were prepared as follows. Frozen glycerol stocks were streaked on LB agar as described above. Individual colonies were grown in 5 ml of LB broth the next day for 2 hours to approximately 2 × 10⁸ CFU/ml. The bacterial cultures were centrifuged at 6000g for 5 min, and the pellet was washed in 1 ml of PBS three times. Finally, the pellet was resuspended in 1 ml of PBS and heated for 30 min at 90°C under shaking conditions. The preparation was checked for sterility by plating.
Generation of bioluminescent bacteria
Plasmid pUT-Tn5-EM7-lux-Km1 (43) was extracted from the E. coli Top10 strain using the QiaPrep Spin Miniprep Kit (Qiagen, Cat. No. 27104) according to the manufacturer’s instructions. The plasmid was used to transform CaCl2 competent PAO1 and its isogenic PAO1ΔPf4 strain (11) as described previously (44). Restriction enzymes were used according to the vendor’s directions (New England BioLabs). Screening for PAO1 transformants was performed on LB agar plates supplemented with 100 μg/ml of ampicillin (Sigma, Cat. No. A958) and 50 μg/ml of kanamycin.
Phage purification
Three phage strains—two from Pa (Pf1, Pf4), and one from E. coli (Fd1)—were studied. Pa strain K produced Pf1 and Pa strain PAO1 produced Pf4. All supernatants from PAO1ΔPf4 were prepared and diluted in sterile PBS in the same manner as other phage samples. Phage were harvested following treatment with 1 mg/ml of DNase I (Roche, Cat. No. 4716728001) and polyethylene glycol 8000 (PEG-8000)-precipitated as described previously (45). Additional details about phage PEG precipitation can be found in the supplementary methods. For some experiments, we performed an additional cesium chloride purification step after PEG precipitation as described previously (12).
Collection of wound swabs from human patients
From 06/2016 to 02/2018, human patients visiting the Stanford Advanced Wound Care Center in Redwood City, California with open wounds were swabbed in duplicate over a 2.2-cm2 area using Levine’s technique, using nylon-flocked wet swabs (Copan Diagnostics, Cat. No. 23–600-963). Swabs were collected in PBS and stored in −80°C before transport on dry ice. In the laboratory, the swabs in PBS were thawed and vor-texed vigorously for 15 s. The contents were then aliquoted for quantitation of Pa rplU gene and Pf prophage gene PAO717, as detailed below. Patients at the Wound Care Center were also swabbed for confirmation by diagnostic laboratory culture for the presence of P. aeruginosa. Patients were subsequently followed until wounds completely healed or until August 2018. Patients were considered _Pa_-positive if their swabs had detectable Pa rplU and their diagnostic cultures were positive. Patients were considered Pf-positive if both duplicate wound swabs had detectable levels of Pf genes. None of the _Pa_-negative patients had detectable Pf phage. Patients were enrolled and swabs were collected in compliance with the Stanford University Institutional Review Board for Human Research. Informed consent was obtained from each patient before swab collection.
Acquisition of patient demographic data
Patient data were collected from EMR chart records, including patient age, gender, comorbidities, tobacco use, wound age, and other variables. This included history and physicals, progress notes, and documents uploaded into the EMR, such as the AWCC patient intake questionnaire. Patient flowsheet review was accessed for precise wound measurements and laboratory results were accessed to assess renal function and gly-cemic control.
Quantification of Pf phage
As several factors can produce plaques on bacterial lawns (other species of phage, pyocins, host defensins, etc.), we quantitated Pf phage using a qPCR assay as previously described (12). Additional details about Pf phage quantification can be found in the supplementary methods. Fd1 phage level was determined spectrophotomet-rically by measuring absorption, using the wavelengths and extinction coefficients as previously described (46).
In vivo murine full-thickness wound infection model
Ten-to-twelve-week-old male mice were anesthetized, shaved, and received two dorsal excisional wounds as described previously (20). Mice were inoculated with 40 μl of luminescent bacteria per wound at the indicated doses 24 hours after wounding, and control mice were inoculated with sterile PBS. Mice were imaged daily for luminescent signal on the IVIS Spectrum (Perkin Elmer), the Ami HTX (Spectral Instruments Imaging), or the Lago-X (Spectral Instruments Imaging) at the Stanford Center for Innovation in In Vivo Imaging daily before takedown. Additional details on the surgical procedure and wound processing can be found in the supplementary methods.
Calculation of IC50 for bacterial wound colonization
Infection rates in percentage of total wounds inoculated were plotted on the _y_-axis, whereas inoculation doses were plotted on the x axis. Inoculation doses were transformed to log form and a nonlinear regression curve fit function was executed using the Graphpad Prism “log(agonist) versus normalized response-Variable slope” function. This function produces a calculated EC50 value, which is equivalent to IC50 in this setting. The function also provides a _r_2 that indicates goodness of fit of the nonlinear regression curve.
Histology
Wounds were harvested, bifurcated, fixed in 10% neutral buffered formalin, and embedded in paraffin. H&E staining and analysis of granulation tissue and epithelial gap was performed as previously described (47). CD45 staining was performed as previously described (48). Any sample that did not yield reliable counts due to sample quality was excluded from the analysis for that particular variable. All scoring was performed by an independent pathologist.
Mouse wound, spleen, and lymph node harvesting and immunophenotyping
Mouse wounds were excised with scissors, cut into pieces, and placed in RPMI containing 0.025 mg/ml Liberase TM Research Grade (Roche, Cat. No. 5401127001), 50 μmM 2-mercaptoethanol (Sigma, Cat. No. M3148), and 20 mM HEPES (Teknova, Cat. No. 101446–740). Tissue was digested at 37°C for 2 hours, homogenized through a sterile 1-ml syringe (BD Biosciences, Cat. No. 309659), and passed through a 70-μm cell strainer (Fisherbrand, Cat. No. 22363548). Cells were washed twice with PBS at 300g for 5 min and processed according to the flow cytometric protocol. Murine spleen and lymph node were harvested and treated as previously described (49). Cells were counted and used for assays as described.
Flow cytometry
For immunophenotyping, cells were lifted with cold PBS and processed according to our flow cytometric protocol using the antibodies found in table S3. Cells were processed and stained and flow cytometry was performed as previously described (49). Analysis for this project was done on LSR II (BD Biosciences) instruments in the Stanford Shared FACS Facility. Cells were divided into different leukocyte populations according to the gating schemes depicted in figs. S3, S12, and S13.
Generation of murine bone marrow-derived phagocytes
Femurs were isolated from male or female mice of >10 weeks of age and bone marrow was flushed out using a 27 G PrecisionGlide needle (BD Biosciences, Cat. No. 305109). Cells were plated at 1 × 10⁶ cells in 10 ml of media per Petri Dish (Fisherbrand, Cat. No. FB0875711). To generate bone marrow-derived dendritic cells (BMDCs), the media was supplemented with 10 ng/ml of recombinant mouse granulocyte-macrophage colony-stimulating factor (GM-CSF) (STEMCELL Technologies, Cat. No. 78206.1) and 2 ng/ml of recombinant mouse IL-4 (Invitrogen, Cat. No. 14–8041-62). To obtain bone marrow-derived macrophages (BMDMs), media was supplemented with 20 ng/ml of M-CSF (Invitrogen, Cat. No. 14–8983-62). An equivalent amount of fresh media containing cytokines was added three days after plating, and 50% of media was changed 5 and 7 days after plating. BMDCs were harvested for use between days 7 and 9 after plating, whereas BMDMs were used on day 6 after plating. Supernatant containing non-adherent cells was collected, and adherent cells were lifted by the addition of 10% Accumax in Accutase for 5 min. Both cell populations were pooled to obtain a mixture of mature and immature cells, washed in fresh media at 300g for 5 min, and prepared for experiments.
Isolation and preparation of human immune cells
Human PBMCs were isolated from an LRS chamber obtained from a healthy donor from the Stanford Blood Center using Ficoll-Paque PLUS (GE Healthcare, Cat. No. 17–1440-02) or lymphoprep (Stemcell technologies, Cat no. 07851) according to the manufacturer’s instructions. Monocytes were isolated using the EasySep Human Monocyte Enrichment Kit according to the manufacturer’s instructions (STEMCELL Technologies, Cat. No. 19058). If differentiation into macrophages was required, monocytes were seeded at a concentration of 6.6 × 10⁵ cells per ml and 25 ng/ml of recombinant GM-CSF (STEMCELL Technologies, Cat. No. 78206.1) was added to the cultures. Medium was supplemented every 2 to 3 days. After 7 to 9 days, macrophages were harvested by pipetting and the adherent cells were collected by subsequent treatment with 10% Accumax in Accutase. Cells were then centrifuged and resuspended in RPMI, to be used in assays as described. U937 cells (ATCC CRL-1593.2) were differentiated into macrophages by overnight stimulation with 100 ng/ml Phorbol 12-myristate 13-acetate (Sigma, Cat. No. P1585).
Immune-cell culture conditions
Mouse BMDCs and human PMBCs and other immune cells were cultured in RPMI with 10% FBS, 100IU of penicillin, 100 μg/ml of streptomycin, and 1 mM sodium pyruvate. Mouse BMDMs were cultured in RPMI with 10% FBS, 100 IU of penicillin, 100 μg/ml of streptomycin, and 20 ng/ml MCSF (Invitrogen, Cat. No. 14–8983-62). Mouse BMDCs and BMDMs were cultured on sterile plates not treated for tissue culture (Falcon), whereas all other cells were cultured on sterile tissue culture-treated plates treated for tissue culture (Falcon). Cells were cultured at 37°C, 5% CO2 in a 90% humidified atmosphere.
Phagocytosis assays
To determine phagocytic capacity with live bacteria, gentamicin protection assays and phagocytic killing assays were performed as described previously (50). BMDMs were inoculated with multitude of infection (MOI) of 50, whereas BMDCs and human phagocytes were inoculated with MOI = 10. For the assays with anti-CoaB mAbs, the seeded BMDCs were treated with 10 μg/ml of IgG mAb clones 1 to 3 and the IgM clone 4, or PBS, immediately before bacterial inoculation. For some assays, 5 μg/ml of TruStain FcX (anti-mouse CD16/32) Fc block (BioLegend, Cat. No. 101320) was added before addition of the anti-CoaB mAbs.
To assess phagocytosis using pHrodo-labeled particles, cells were seeded at a density of 5 × 10⁴ cells/well in a 96-well plate and stimulated with coated 1 × 10⁸ Pf phage/ml, unless noted otherwise, for 2 hours at 37°C. Next, cells were incubated with 10 μg/ml of pHrodo Red E. coli BioParticles (Invitrogen, Cat. No. P35361) for 1 hour at 37°C, 5% CO2 or for 1 hour at 4°C for adsorption controls. Cells were harvested by lifting with cold PBS and repeated pipetting, washed twice with flow cytometry buffer, and stained for live cells according to the general flow cytometric protocol before acquisition on a flow cytometer. For TNF rescue experiments, cells were stimulated with coated Pf phage and 25 ng/ml of TNF (Invitrogen, Cat. No. 34–8321-63) for 3 hours at 37°C before addition of the E. coli pHrodo particles.
Murine leukocyte stimulation with bacterial pathogen-associated molecular patterns (PAMPs) and bacteriophage
Cells were seeded at a density of 5 × 10⁴ cells/well in a 96-well plate and stimulated with various stimuli, including coated 100 μg/ml alginate, 1 × 10⁸ phage particles/ml purified Pf4 from the PAO1 strain, Pf1 from the PAK strain or Fd1 phage from E. coli, preparations from the PAO1ΔPf4 strain, soluble 1 μg/ml LPS, or equivalent volumes of PBS as control. Cells were incubated at 37°C, 5% CO2 for the indicated time points. Next, cells were centrifuged for 300g for 5 min, and supernatant was removed for protein analysis.
TNF enzyme-linked immunosorbent assay (ELISA)
To measure TNF protein levels in cell culture supernatants, we used an adapted version of the eBioscience protocol ELISA protocol using antibody pairs. The coating antibody was used at 2.5 μg/ml and the detection antibody was used at 1.25 μg/ml. Carrier-free recombinant mouse TNF (Invitrogen, Cat. No. 34–8321-63) was used for the standard. Absorbance was read on a Spark microplate reader (Tecan).
TNF detection in human immune cells in response to bacterial PAMPs and Pf phage
Isolated human monocytes were resuspended in RPMI supplemented with MEM non-essential amino acids (Hyclone, Cat. No. SH30238.01), sodium pyruvate, penicillin-streptomycin, 200 mM L-glutamine, 50 mM 2-mercaptoethanol, and 10% heat-inactivated FBS. Monocytes (5 × 10⁶ cells/ well) were seeded in a 96 well plate and stimulated for 15 hours with 109 phage particles. Subsequently, 1 μg/ml of LPS was added for 4 hours. Supernatants was collected and used for cytokine profiling through Luminex by The Human Immune Monitoring Center at Stanford University. TNF presence in human cell supernatant was confirmed by ELISA using a human TNF ELISA kit (Thermo Fisher Scientific, Cat. No. 88–7346-88) according to the manufacturer’s instructions.
SDS-polyacrylamide gel electrophoresis (PAGE) of Pf4 phage preparations
PEG-purified phage, crude supernatant from a PAO1 culture, and supernatant from a PEG precipitation were assessed via SDS-PAGE electrophoresis using previously described protocols (12).
Tnf mRNA quantitative PCR
To quantify Tnf mRNA levels, BMDCs were cultured in a 24-well plate at a density of 0.5 × 10⁶ cells/well and left unstimulated or stimulated with 100 μg/ml of alginate or 1 μg/ml of LPS and/ or 1 × 10⁸ Pf4/ml for the indicated time periods at 37°C, 5% CO2. Cells were lysed with TRI Reagent (Milipore Sigma, Cat. No. 93289) before RNA isolation as previously described (51). Eight hundred nanograms of RNA from all samples was converted into cDNA using High-Capacity cDNA Reverse Transcription Kit (Applied Biosystems, Cat. No. 4368814) per the manufacturer’s instructions. TNF mRNA levels were quantified in a qPCR reaction containing 1× PowerUp SybrGreen (Applied Bioystems, Cat. No. A25776), 0.2 mM primers, and 40 ng of cDNA. See table S2 for the primers used. Reactions were run on a StepOnePlus Real-Time PCR system (Applied Biosystems, Cat. No. 4376600) using a modified Standard Program (50°C for 2 min.; 95°C for 2 min.; 40 × (95°C for 10 s; 60°C for 25 s); melt curve). Relative fold expression was calculated using the ΔΔCt method with beta-actin (Actb) as the housekeeping gene.
NF-κB nuclear translocation immunoblot
BMDCs were seeded in 6-well plates at 1.5 × 10⁶cells/well and stimulated with coated 100 μg/ml alginate and 5 × 10⁸ Pf4/ml for 30 min. Immunoblotting was then performed as previously described (52).
NF-κB luciferase reporter assay
RAW264.7 cells stably transfected with a NF-κB-dependent luciferase reporter (53) were plated at 5 × 10⁴ cells/well in Dulbecco’s modified Eagle medium (DMEM) (HyClone, Cat. No. SH3024301) with 10% FBS, penicillin, and streptomycin in a 96-well tissue culture plate and incubated over-night at 37°C, 5% CO2 to adhere. Media was removed and fresh media containing 1 μg/ml of LPS, 100 μg/ml of alginate, or an equivalent volume of PBS was added, followed immediately by the addition of 1 × 10⁸ Pf4/ml of purified Pf4 or an equivalent dilution of a phage purification prep from the PAO1ΔPf4 strain. Cells were incubated for 9 hours at 37°C 5% CO before lysis with Bright-Glo Reagent (Promega, Cat. No. E2610) and detection of relative light units of luminescence using a Spark microplate reader (Tecan). Values were normalized to relative light units of unstimulated cells.
Intracellular TNF cytokine staining
BMDCs were seeded at 2 × 10⁵ cells/well in a 24-well plate coated with 1 × 10⁹ Pf4/ml purified Pf4 and cultured for 15 hours at 37°C. Cells received a stimulus of 1 μg/ml of LPS and 3.0 μg/ml of Brefeldin A (Invitrogen, Cat. No. 00–4506) for 4 hours at 37°C to stimulate TNF production. Cells were lifted by cold PBS and processed according to our flow cytometric protocol, with some additional steps. After washing in flow cytometry buffer (3% FBS and 1 mM EDTA), cells were fixed with IC fixation buffer (Invitrogen, Cat. No. 00–8222-49), permeabilized with Per-meabilization buffer (Invitrogen, Cat. No. 00–8333-56), and stained with 2 μg/ml of anti-mouse TNF antibody according to the manufacturer’s instructions. Cells were washed twice in flow cytometry buffer before acquisition.
Type I IFN protein reporter assay
ISRE-L929 cells (54) were seeded at a density of 1 × 10⁵ cells/well in a 96-well tissue culture plate in DMEM with 10% FBS, penicillin, and streptomycin, and cultured overnight at 37°C, 5% CO2 to allow them to adhere. Media was removed, and cells were incubated with supernatant from BMDCs or BMDMs stimulated with LPS or alginate and Pf4, as described elsewhere in the Methods section. To quantify type I IFN production, a twofold serially diluted standard curve of recombinant mouse IFN-β (BioLegend, Cat. No. 581309), starting at 1000 pg/ml, was used. ISRE-L929 cells were incubated with cells or protein standard for 9 hours at 37°C, 5% CO2. Cell supernatant was removed and Bright-Glo Reagent (Promega, Cat. No. E2610) was added to lyse cells for 2 min. Relative luminescent units were detected using a Spark microplate reader (Tecan).
HEK-Blue hTLR3 cells treated with whole Pf phage particle
HEK-Blue hTLR3 cells (Invivogen, Cat. No. hkb-htlr3), cells in which native Tlr3 is expressed in endosomes, were grown to a confluency of at least 85%, as described by the manufacturer. Subsequently, cells were harvested and diluted to a concentration of 5 × 10⁵ cells/ml in HEK-Blue growth medium (DMEM supplemented with 10% FBS, penicillin-streptomycin, 100 μg/ml of noromycin, 30 μg/ml of blasticidin (Fisher Scientific, Cat. No. MT30100RB), 100 μg/ml of zeocin (Invivogen, Cat. No. ant-zn-1), 10 μM HEPES, and 10 μM MG-132 (Selleck Chemicals, Cat. No. S2619)). Cells were seeded in a flat-bottom 96-well plate at a final concentration of 5 × 10⁴ cells/well, and 20 μl of stimulus was added (PBS or 109 phage/ml). Cells were incubated for 16 hours at 37°C with 5% CO2, after which the media was replaced with 100 μl of HEK-Blue growth media. After 8 hours incubation, 100 ml of HEK-Blue Detection media (Invivogen, Cat. No. hb-det2) was added. After a final 16-hour incubation, discoloration of the media was measured at 620 nm using a Spark microplate reader (Tecan).
Preparation of pure phage RNA from ssDNA
In order to prepare pure phage RNA, ssDNA from Pf1 (used because of higher purification yield) was extracted as previously described (55). Individual phage genes were amplified using specific primers (1 μM), to which a T7 promotor was added on the forward primer, using Econotaq (Lucigen, Cat no. 30035–1). See table S2 for the primer sequences. The PCR products were purified prior to RNA conversion using silicon column-based guanidine thiocyanate purification. More details on this procedure can be found in the supplementary methods for more details. RNA was transcribed according to the manufacturer instructions (HiScribe T7 High Yield RNA Synthesis kit, New England Biosciences, Cat No. E2040S). RNA products were purified as described for the PCR products. Subsequently, the purified RNA was used in a HEK-Blue hTLR3 assay. Briefly, 20 μl of each RNA product (10 ng/μl) was added to wells in triplicate in a 96-well plate. Subsequently, 5 × 10⁴ HEK-Blue hTLR3 cells were added to each well, as described by the manufacturer, in HEK-Blue detection medium. After 16 hours of stimulation, discoloration of the media was measured at 620 nm using a Spark microplate reader (Tecan).
Phage RNA production in a human monocyte cell line
The human monocyte cell line U937 was grown to a concentration of 2 × 10⁷ cells/ml in RPMI with penicillin and streptomycin. Subsequently, cells were transferred to RPMI with penicillin and streptomycin to a final concentration of 107 cells/ml. 106 cells/ml were stimulated with 108 phage. After 24 hours, the whole-cell suspension was transferred to 1 ml of TriReagent (Sigma) and stored overnight at −80°C. Total RNA was extracted using a RNeasy Minikit, as described by the manufacturer (Qiagen, Cat. No. 74106). Genomic DNA was removed from the total RNA using DNase I and incubating at 37°C for 15 min, followed by inactivation at 85°C for 15 min. Subsequently, cDNA was prepared using the RevertAid RT Reverse Transcription Kit (Thermo Fisher, Cat No. K1691). Additionally, as a negative control, the remaining RNA was diluted in the same ratio as for the cDNA synthesis. Both cDNA and RNA were used for qPCR, using SensiFast Sybr HiROX (Bioline, Cat no. BI0–92005), a 1-μl template, and forward and reverse primers (400 nM each). In total, 45 cycles were run (5 s at 95°C, 10 s at 60°C, 20 s at 72°C). See table S2 for primer sequences. Phage ssDNA was used as a positive control, and primers directed against an intergenic, non-coding region in the Pf phage genome were used as a negative control. AH samples were normalized against beta-actin and gene expression was determined through normalization of the treated samples to the untreated PBS samples.
Fluorescent labeling of Pf phage
Purified Pf4 preparations were labeled with Alexa Fluor 488-labeled TFP ester (Molecular Probes, Cat. No. A37570) following the manufacturer’s protocol. Following labeling, labeled Pf4 viral particles were separated from unincorporated dye using PD10 Sephadex G-25 desalting columns (GE Healthcare, Cat. No. 17085101) according to the manufacturer’s instructions. The conjugate was then quantitated for Pf concentration using qPCR and appropriately diluted in PBS.
Uptake assays of labeled Pf phage by murine leukocytes
BMDCs or BMDMs were seeded at a density of 5 × 10⁴ cells/well in a 96-well plate or 5 × 10⁵/well in a 24-well plate. Splenocytes and lymph node cells were seeded in 24-well plates at 1.5 × 10⁶ and 1 × 10⁶ cells/well, respectively. Cells were stimulated with coated or soluble 1 × 10⁹ labeled Pf4/ ml for 3 hours at 37°C for uptake analysis or 4°C for adsorption analysis. Cells were removed from the culture plate surface with cold PBS, washed in flow cytometry buffer twice, stained for live-dead discrimination, fixed according to our flow cytometric protocol, and acquired on a LSR II flow cytometer (BD Biosciences). As an additional adsorption control, extracellular fluorescent signal was quenched by addition of 0.1% of Trypan Blue (Sigma, Cat. No. T8154) right before acquisition. In some assays, cells were stained with 1 mg/ml of anti-mouse CD14 according to the general flow cytometric protocol. For the inhibition assays, cells were treated with 3.0 μg/ml of Brefeldin A (Invitrogen, Cat. No. 00–4506), 100 ng/ml of wortmannin (Sigma, Cat. No. W1628), 25 μg/ml of nocodazole (Acros Organics, Cat. No. AC358240100) or 5 μg/ml of chlorpromazine (Sigma, Cat. No. C8138) for 30 min at 37°C before addition of labeled Pf4. To see if antibodies against Pf phages affected Pf phage uptake, cells were treated with 5 μg/ml rat IgG (Clone eBRG1, Invitrogen, Cat. No. 16–4301-85) or 5 μg/ml of a mix of anti-Pf phage antibodies 1, 2, 3, and 4. The antibodies were mixed with 1 × 10¹⁰ Pf4/ml labeled Pf4 before being added to the cells.
Immunofluorescent and confocal microscopy
For microscopy analysis, cells were seeded on glass 12-mm #1.5H precision coverslips (Thorlabs, Cat. No. CG15CH) coated with poly-L-lysine (Sigma, Cat. No. P8920) or 0.2% poly-L-ornithine (Sigma, Cat. No. P3655) according to the manu-facturer’s instructions at a density of 1 × 10⁶ cells / well in a 6-well plate. Cells were either stimulated with coated 1 × 10⁹ Pf4/ml labeled Pf4 or soluble 1 × 10¹⁰ Pf4/ml labeled Pf4 for 3 hours. Cells were washed, fixed with 10% neutral buffered formalin and prepared for immunofluorescent microscopy according to the procedure outlined in the supplementary methods.
Transmission electron microscopy
5 × 10⁶ BMDCs were seeded in a Petri dish in 10 ml of media, and ~109 Alexa Fluor 488-labeled Pf4 were added for 3 or 24 hours. Controls with-out phage addition were used to control for staining. Cells were lifted with 10% Accumax in Accutase, washed in media, and fixed for 45 min at room temperature in EM fixative buffer (2% glutaraldehyde, 4% paraformaldehyde in 0.1M sodium cacodylate buffer, pH 7.4). Samples were processed in the Stanford Microscopy Facility and stained with 10 μg/ml of anti-Alexa Fluor 488 (Invitrogen, Cat. No. A11094) as the primary stain followed by a gold-labeled anti-rabbit IgG secondary stain. Samples were imaged at 15,000× or 25,000× magnification on a TEM JEOL JEM1400 microscope. For each image, true gold staining was confirmed using a beam blocker. For each sample, images were taken of at least three individual cells.
Human PMBC immunophenotyping and Pf phage uptake assays
Human PBMCs were seeded in a 96-well plate at 1 × 10⁵ cells/well and incubated with 1 × 10¹⁰ Pf4/ml of Alexa Fluor 488-labeled Pf4 for 6 hours at 37°C for uptake analysis or 4°C for adsorption analysis. Cells were then harvested from the plate by repeated pipetting and stained with Zombie Aqua Viability Dye, anti-CD3, -CD4, -CD14, -CD19, -CD45, -HLA-DR, and -CD56 according to the general flow cytometric protocol. Cells were divided into different CD45+ leukocyte populations according to the gating scheme in fig. S13. Each population was analyzed for Pf4+ cells.
CoaB consensus sequence analysis
To determine the CoaB consensus sequence, we performed a standard protein BLAST (NCBI) search of the PAO1 mature CoaB protein sequence GVIDTSAVESAITDGQGDMKAIGGYIVGALVILAVAGLIYSMLRKA against all P. aeruginosa genomes in the database. A multiple alignment file was created using Unipro UGENE software, which in turn was used to derive the consensus CoaB sequence through the UC Berkeley Weblogo software (http://weblogo.berkeley.edu/logo.cgi).
CoaB peptide immunization protocol
Eight-week-old C57BL/6J mice were intraperi-toneally injected with 10 μg of Pf phage CoaB peptide conjugated to carrier protein KLH, dissolved in Imject Alum adjuvant (ThermoFisher Scientific, Cat. No. 77161) and PBS. Mock-immunized mice received Imject Alum and PBS alone. The mice received a repeat booster immunization 9 days later. Two weeks after the booster shot, blood was collected via tail vein bleeds. All mice were wounded and infected with 7.5 ± 2.5 × 10² CFU/ml bacteria 4 weeks after the booster shot, according to the described protocols.
CoaB antibody ELISA
To detect mouse antibodies against Pf phage, EIA/RIA assay plates were coated with 1 × 10⁹Pf4/well purified Pf4 overnight at 4°C. Plates were blocked with 200 μl/well of 1% BSA + 0.1% goat serum in PBS for 1 hour at room temperature. Blocking buffer was removed, and 100 μl/well of immunized mouse serum samples were then added diluted 1:10 in blocking buffer. Samples were incubated overnight at 4°C or 2 hours at room temperature. Plates were then incubated with 100 μl/well 1:2000 secondary goat anti-mouse IgG conjugated to HRP (Jackson Laboratories, Cat. No. 115–035-174) for 1 hour at room temperature. After the addition of 100 μl/ well of 1-Step Ultra TMB ELISA Substrate and 50 μl/well of 2 N sulfuric acid stop solution, the signal was read at 450 nm on a Spark microplate reader (Tecan). Note that plates were washed three-to-four times with 300 μl/well of 0.05% Tween-20 in PBS between steps.
Anti-CoaB mAb purification
Hybridomas produced by immunizing mice with KLH-conjugated CoaB peptide and selecting monoclonal antibodies, were generated by ImmunoPrecise Antibodies LTD (Victoria, Canada) upon commission. Binding affinities of the resulting antibodies were confirmed by indirect ELISA using peptide-BSA, free BSA, or human transferrin as irrelevant antigen control. For hybridoma growth conditions, see the supplementary methods. After adaptation, cells were expanded, and culture supernatant was collected. Super-natants from each culture were centrifuged at 2000g for 15 min at 4°C to remove debris and insolubles. Medium was filtered through a 0.22-μm filter and loaded into a Protein A Resin FF Prepacked column (Genscript, Cat. No. L00680–51) according to the manufacturer’s instructions. Purified antibody clones were concentrated using a 100-kDa cut-off centrifugal filters (EMD Milipore, Cat. No. UFC910024) and resuspended in 0.01 M PBS (pH 7.2). The protein concentration of purified mAbs was determined by BCA assay (Pierce Thermo Scientific, Cat. No. PI23225) according to the manufacturer’s instructions.
Anti-CoaB mAb immunoblot
A preparation of purified Pf4 phage (~1 × 10¹² Pf4/ml) was mixed with Laemmli sample buffer containing 0.1 M DTT and heated 95°C for 10 min. Samples were loaded at 25 μl/well onto a 10%−20% Novex Tris Glycine protein gel (Invitrogen, Cat. No. XP10200B0X) and run at 100 mV for 60 min. Proteins were transferred to a nitrocellulose membrane using a semi-dry blotting apparatus (Continental Lab Products) and the membrane was cut into strips. Each strip was blocked with Sea Block blocking buffer and incubated with one of the anti-Pf phage antibody clones at a final concentration of 10 μg/ml for 16 hours at 4°C. Membranes were washed and incubated with a donkey anti-mouse fluorescently labeled secondary antibody labeled with IRDye 800CW (Licor, Cat. No. 926–32212) at 20 ng/ml in TBS with 0.01% SDS for 1 hour at room temperature. After washing, the membranes were imaged on the Odyssey (Li-Cor) and analyzed using Image Studio (Li-Cor).
Passive immunization with anti-CoaB mAbs
Ten-week-old male C57BL/6J mice received fullthickness wounds as described elsewhere in the Methods section. Immediately before inoculation, PA01 and anti-CoaB mAb IgG clones 1–3 and the IgM clone 4 were mixed to obtain 5 × 10² CFU/ml and 50 μg/ml of each mAb clone. Treatment mice received 40 μl/wound of this antibody-bacteria mix, whereas control mice received 40 μl/wound of the PBS-bacteria mix. The inoculation dose of both groups was verified by bacterial plating to confirm the anti-CoaB antibodies did not directly kill the bacteria. Mice were weighed and imaged daily for 3 days after infection.
Statistical analysis
Where n is not stated, graphs show a representative experiment of _n_≥2 assays, with _n_≥3 technical or biological replicates. The number of mice needed for the in vivo experiment was determined using power calculations. AH statistical analyses, linear and nonlinear regression analyses were performed using GraphPad Prism (GraphPad Software, Inc. La Jolla, CA). All unpaired Student’s t tests, Mann-Whitney tests, and Fisher’s exact tests were two-tailed. Depicted are means with SEM of the replicates unless otherwise stated. Statistical significance was considered p < 0.05. Nonsignificance was indicated by the letters n.s.
Supplementary Material
1
2
ACKNOWLEDGMENTS
We thank M. Butte, T. Wang, and C. Blish for their critical reading of the manuscript. We are grateful to S. Rice for sharing PA01DPf4 and its isogenic PA01 strain. Ifnar −/− and Ifnr −/− mice were gifts from S.-Y. Pu and S. Einav. Cgas −/− and Sting −/− mice were gifts from V. Boehnert and L. Li. RAW64.7 and L929 ISRE reporter cell lines were gifts from S. Brubaker. The pUT-Tn5-EM7-lux-Km1 luminescent construct vector was a gift from J. Hardy. Special thanks to T. Thauland, K. Yadava, and S. M. Ruppert for their technical expertise.
Funding: This work was supported by grants R21AI133370, R21AI133240, R01AI12492093, and grants from Stanford SPARK and by the Falk Medical Research Trust and the Cystic Fibrosis Foundation (CFF) to P.L.B. A Gabilan Stanford Graduate Fellowship for Science and Engineering and a Lubert Stryer Bio-X Stanford Interdisciplinary Graduate Fellowship supported J.M.S. P.R.S was supported by NIH grants K22AI125282, R01AI138981, and P20GM103546. G.K. was supported by the Stanford Diabetes Research Center (SDRC) under award no. P30DK116074. S.G.K. was supported by NIH grant R01GM111808. The use of the transmission electron microscope was supported, in part, by ARRA award no. 1S10RR026780-F Resources (NCRR).
Footnotes
Competing interests: P.L.B. and P.R.S are inventors on a patent application (15/219,073), Monoclonal antibody and vaccine targeting filamentous bacteriophage. The authors declare no other conflicts of interest.
Data and materials availability: All data are available in the main text or the supplementary materials.
REFERENCES AND NOTES
- 1.Azzopardi et ai EA., Gram negative wound infection in hospitalised adult burn patients-Systematic review and metanalysis-. PLOS ONE 9, e95042 (2014). doi: 10.1371/journal.pone.0095042; pmid: [DOI] [PMC free article] [PubMed] [Google Scholar]
- 2.Kirketerp-MØller K et al. , Distribution, organization, and ecology of bacteria in chronic wounds. J. Clin. Microbiol. 46, 2717–2722 (2008). doi: 10.1128/JCM.00501-08; pmid: [DOI] [PMC free article] [PubMed] [Google Scholar]
- 3.Sen CK et al. , Human skin wounds: A major and snowballing threat to public health and the economy. Wound Repair Regen. 17, 763–771 (2009). doi: 10.1111/j.1524-475X.2009.00543.x; pmid: [DOI] [PMC free article] [PubMed] [Google Scholar]
- 4.Shrivastava S, Shrivastava P, Ramasamy J, World Health Organization releases global priority list of antibiotic-resistant bacteria to guide research, discovery, and development of new antibiotics. J. Med. Soc. 32, 76–77 (2018). doi: 10.4103/jms.jms_25_17 [DOI] [Google Scholar]
- 5.Tsay T-B et al. , Blocking TNF-α enhances Pseudomonas aeruginosa-induced mortality in burn mice through induction of IL-1β. Cytokine 63, 58–66 (2013). doi: 10.1016/j.cyto.2013.04.002; pmid: [DOI] [PubMed] [Google Scholar]
- 6.Gosselin D et al. , Role of tumor necrosis factor alpha in innate resistance to mouse pulmonary infection with Pseudomonas aeruginosa. Infect. Immun. 63, 3272–3278 (1995). pmid: [DOI] [PMC free article] [PubMed] [Google Scholar]
- 7.Sadikot RT et al. , Targeted immunomodulation of the NF-kB pathway in airway epithelium impacts host defense against Pseudomonas aeruginosa. J. Immunol. 176, 4923–4930 (2006). doi: 10.4049/jimmunol.176.8.4923; pmid: [DOI] [PubMed] [Google Scholar]
- 8.Gellatly SL, Hancock REW, Pseudomonas aeruginosa: New insights into pathogenesis and host defenses. Pathog. Dis. 67, 159–173 (2013). doi: 10.1111/2049-632X.12033; pmid: [DOI] [PubMed] [Google Scholar]
- 9.Alhede M, Bjarnsholt T, Givskov M, Alhede M, Pseudomonas aeruginosa Biofilms: Mechanisms of Immune Evasion (Elsevier, ed. 1, 2014), vol. 86. [DOI] [PubMed] [Google Scholar]
- 10.Webb JS, Lau M, Kjelleberg S, Bacteriophage and phenotypic variation in Pseudomonas aeruginosa biofilm development. J. Bacteriol. 186, 8066–8073 (2004). doi: 10.1128/JB.186.23.8066-8073.2004; pmid: [DOI] [PMC free article] [PubMed] [Google Scholar]
- 11.Rice SA et al. , The biofilm life cycle and virulence of Pseudomonas aeruginosa are dependent on a filamentous prophage. ISME J. 3, 271–282 (2009). doi: 10.1038/ismej.2008.109; pmid: [DOI] [PMC free article] [PubMed] [Google Scholar]
- 12.Secor PR et al. , Filamentous Bacteriophage Promote Biofilm Assembly and Function. Cell Host Microbe 18, 549–559 (2015). doi: 10.1016/j.chom.2015.10.013; pmid: [DOI] [PMC free article] [PubMed] [Google Scholar]
- 13.Secor PR et al. , Filamentous Bacteriophage Produced by Pseudomonas aeruginosa Alters the Inflammatory Response and Promotes Noninvasive Infection In Vivo. Infect. Immun. 85, e00648–16 (2016). doi: 10.1128/IAI.00648-16; pmid: [DOI] [PMC free article] [PubMed] [Google Scholar]
- 14.Mai-Prochnow A et al. , ‘Big things in small packages: The genetics of filamentous phage and effects on fitness of their host. FEMS Microbiol. Rev. 39, 465–487 (2015). doi: 10.1093/femsre/fuu007; pmid: [DOI] [PubMed] [Google Scholar]
- 15.Martinez E, Campos-Gómez J, Pf Filamentous Phage Requires UvrD for Replication in Pseudomonas aeruginosa. MSphere 1, e00104 (2016). pmid: [DOI] [PMC free article] [PubMed] [Google Scholar]
- 16.Knezevic P, Voet M, Lavigne R, Prevalence of Pf1-like (pro) phage genetic elements among Pseudomonas aeruginosa isolates. Virology 483, 64–71 (2015). doi: 10.1016/j.virol.2015.04.008; pmid: [DOI] [PubMed] [Google Scholar]
- 17.Chaby G et al. , Refractory venous leg ulcers: A study of risk factors. Dermatol. Surg. 32, 512–519 (2006). pmid: [DOI] [PubMed] [Google Scholar]
- 18.Franks PJ et al. , Factors associated with healing leg ulceration with high compression. Age Ageing 24, 407–410 (1995). doi: 10.1093/ageing/24.5.407; pmid: [DOI] [PubMed] [Google Scholar]
- 19.Moffatt CJ et al. , Community clinics for leg ulcers and impact on healing. BMJ 305, 1389–1392 (1992). doi: 10.1136/bmj.305.6866.1389; pmid: [DOI] [PMC free article] [PubMed] [Google Scholar]
- 20.Chen JS, Longaker MT, Gurtner GC, in Methods in Molecular Biology (Humana Press, Totowa, NJ, 2013), vol. 1037 of Methods in Molecular Biology, pp. 265–274. [DOI] [PMC free article] [PubMed] [Google Scholar]
- 21.Park J, Babensee JE, Differential functional effects of biomaterials on dendritic cell maturation. Acta Biomater. 8, 3606–3617 (2012). doi: 10.1016/j.actbio.2012.06.006; pmid: [DOI] [PMC free article] [PubMed] [Google Scholar]
- 22.Yang D, Jones KS, Effect of alginate on innate immune activation of macrophages. J. Biomed. Mater. Res. A 90, 411–418 (2009). doi: 10.1002/jbm.a.32096; pmid: [DOI] [PubMed] [Google Scholar]
- 23.Cantaert T, Baeten D, Tak PP, van Baarsen LGM, Type I IFN and TNFa cross-regulation in immune-mediated inflammatory disease: Basic concepts and clinical relevance. Arthritis Res. Ther. 12, 219 (2010). doi: 10.1186/ar3150; pmid: [DOI] [PMC free article] [PubMed] [Google Scholar]
- 24.Sauer I et al. , Interferons limit inflammatory responses by induction of tristetraprolin. Blood 107, 4790–4797 (2006). doi: 10.1182/blood-2005-07-3058; pmid: [DOI] [PMC free article] [PubMed] [Google Scholar]
- 25.Kawasaki T, Kawai T, Toll-like receptor signaling pathways. Front. Immunol. 5, 461 (2014). doi: 10.3389/fimmu.2014.00461; pmid: [DOI] [PMC free article] [PubMed] [Google Scholar]
- 26.Tong A-J et al. , A Stringent Systems Approach Uncovers Gene-Specific Mechanisms Regulating Inflammation. Cell 165, 165–179 (2016). doi: 10.1016/j.cell.2016.01.020; pmid: [DOI] [PMC free article] [PubMed] [Google Scholar]
- 27.Wang L et al. , Regulation of lipopolysaccharide-induced translation of tumor necrosis factor-alpha by the toll-like receptor 4 adaptor protein TRAM. J. Innate Immun. 3, 437–446 (2011). doi: 10.1159/000324833; pmid: [DOI] [PMC free article] [PubMed] [Google Scholar]
- 28.Abe T et al. , STING recognition of cytoplasmic DNA instigates cellular defense. Mol. Cell 50, 5–15 (2013). doi: 10.1016/j.molcel.2013.01.039; pmid: [DOI] [PMC free article] [PubMed] [Google Scholar]
- 29.Gao D et al. , Activation of cyclic GMP-AMP synthase by self-DNA causes autoimmune diseases. Proc. Natl. Acad. Sci. U.S.A. 112, E5699–E5705 (2015). doi: 10.1073/pnas.1516465112; pmid: [DOI] [PMC free article] [PubMed] [Google Scholar]
- 30.Baird A, Gene transfer into mammalian cells using targeted filamentous bacteriophage. Cold Spring Harb. Protoc. 2011, 950–957 (2011). doi: 10.1101/pdb.prot5653; pmid: [DOI] [PMC free article] [PubMed] [Google Scholar]
- 31.Lester SN, Li K, Toll-like receptors in antiviral innate immunity. J. Mol. Biol. 426, 1246–1264 (2014). doi: 10.1016/j.jmb.2013.11.024; pmid: [DOI] [PMC free article] [PubMed] [Google Scholar]
- 32.Kazmierczak Z et al. , Molecular imaging of T4 phage in mammalian tissues and cells. Bacteriophage 4, e28364-e28366 (2014). doi: 10.4161/bact.28364; pmid: [DOI] [PMC free article] [PubMed] [Google Scholar]
- 33.Gaubin M et al. , Processing of filamentous bacteriophage virions in antigen-presenting cells targets both HLA class I and class II peptide loading compartments. DNA Cell Biol. 22, 11–18 (2003). doi: 10.1089/104454903321112451; pmid: [DOI] [PubMed] [Google Scholar]
- 34.Tian Y et al. , Probing the endocytic pathways of the filamentous bacteriophage in live cells using ratiometric pH fluorescent indicator. Adv. Healthc. Mater. 4, 413–419 (2015). doi: 10.1002/adhm.201400508; pmid: [DOI] [PubMed] [Google Scholar]
- 35.Lee H-K, Dunzendorfer S, Soldau K, Tobias PS, Double-stranded RNA-mediated TLR3 activation is enhanced by CD14. Immunity 24, 153–163 (2006). doi: 10.1016/j.immuni.2005.12.012; pmid: [DOI] [PubMed] [Google Scholar]
- 36.Nguyen S et al. , Bacteriophage Transcytosis Provides a Mechanism To Cross Epithelial Cell Layers. mBio 8, e01874 (2017). doi: 10.1128/mBio.01874-17; pmid: [DOI] [PMC free article] [PubMed] [Google Scholar]
- 37.Hodyra-Stefaniak K et al. , Mammalian Host-Versus-Phage immune response determines phage fate in vivo. Sci. Rep. 5, 14802 (2015). pmid: [DOI] [PMC free article] [PubMed] [Google Scholar]
- 38.Bille E et al. , A virulence-associated filamentous bacteriophage of Neisseria meningitidis increases host-cell colonisation. PLOS Pathog. 13, e1006495 (2017). doi: 10.1371/journal.ppat.1006495; pmid: [DOI] [PMC free article] [PubMed] [Google Scholar]
- 39.Jonczyk-Matysiak E et al. , The Effect of Bacteriophage Preparations on Intracellular Killing of Bacteria by Phagocytes. J. Immunol. Res. 2015, 482863 (2015). doi: 10.1155/2015/482863; pmid: [DOI] [PMC free article] [PubMed] [Google Scholar]
- 40.Van Belleghem JD, Clement F, Merabishvili M, Lavigne R, Vaneechoutte M, Pro- and anti-inflammatory responses of peripheral blood mononuclear cells induced by Staphylococcus aureus and Pseudomonas aeruginosa phages. Sci. Rep. 7, 8004 (2017). pmid: [DOI] [PMC free article] [PubMed] [Google Scholar]
- 41.Roach DR et al. , Synergy between the Host Immune System and Bacteriophage Is Essential for Successful Phage Therapy against an Acute Respiratory Pathogen. Cell Host Microbe 22, 38–47.e4 (2017). doi: 10.1016/j.chom.2017.06.018; pmid: [DOI] [PubMed] [Google Scholar]
- 42.De Smet J, Hendrix H, Blasdel BG, Danis-Wlodarczyk K, Lavigne R, Pseudomonas predators: Understanding and exploiting phage-host interactions. Nat. Rev. Microbiol. 15, 517–530 (2017). doi: 10.1038/nrmicro.2017.61; pmid: [DOI] [PubMed] [Google Scholar]
- 43.Burns-Guydish SM et al. , Monitoring age-related susceptibility of young mice to oral Salmonella enterica serovar Typhimurium infection using an in vivo murine model. Pediatr. Res. 58,153–158 (2005). doi: 10.1203/01.PDR.0000157725.44213.C4; pmid: [DOI] [PubMed] [Google Scholar]
- 44.Sambrook J, Fritsch EF, Maniatis T, Molecular Cloning. A Laboratory Manual (Cold Spring Harbor Laboratory Press, Cold Spring Harbor, NY, ed. 1, 1989). [Google Scholar]
- 45.Boulanger P, Purification of bacteriophages and SDS-PAGE analysis of phage structural proteins from ghost particles. Methods Mol. Biol. 502, 227–238 (2009). doi: 10.1007/978-1-60327-565-1_13; pmid: [DOI] [PubMed] [Google Scholar]
- 46.Zimmermann K, Hagedorn H, Heuck CC, Hinrichsen M, Ludwig H, The ionic properties of the filamentous bacteriophages Pf1 and fd. J. Biol. Chem. 261, 1653–1655 (1986). pmid: [PubMed] [Google Scholar]
- 47.Cho H et al. , Regulation of endothelial cell activation and angiogenesis by injectable peptide nanofibers. Acta Biomater. 8, 154–164 (2012). doi: 10.1016/j.actbio.2011.08.029; pmid: [DOI] [PMC free article] [PubMed] [Google Scholar]
- 48.Keswani SG et al. , Intraplacental gene therapy with Ad-IGF-1 corrects naturally occurring rabbit model of intrauterine growth restriction. Hum. Gene Then 26, 172–182 (2015). doi: 10.1089/hum.2014.065; pmid: [DOI] [PMC free article] [PubMed] [Google Scholar]
- 49.Kuipers HF et al. , Hyaluronan synthesis is necessary for autoreactive T-cell trafficking, activation, and Th1 polarization. Proc. Natl. Acad. Sci. U.S.A. 113, 1339–1344 (2016). doi: 10.1073/pnas.1525086113; pmid: 1 [DOI] [PMC free article] [PubMed] [Google Scholar]
- 50.Amiel E, Lovewell RR, O’Toole GA, Hogan DA, Berwin B, Pseudomonas aeruginosa evasion of phagocytosis is mediated by loss of swimming motility and is independent of flagellum expression. Infect. Immun. 78, 2937–2945 (2010). doi: 10.1128/IAI.00144-10; pmid: [DOI] [PMC free article] [PubMed] [Google Scholar]
- 51.Chomczynski P, Sacchi N, The single-step method of RNA isolation by acid guanidinium thiocyanate-phenol-chloroform extraction: Twenty-something years on. Nat. Protoc. 1, 581–585 (2006). doi: 10.1038/nprot.2006.83; pmid: [DOI] [PubMed] [Google Scholar]
- 52.Gebe JA et al. , Modified High-molecular-weight hyaluronan promotes allergen-specific immune tolerance. Am. J. Respir. CellMol. Biol. 56, 109–120 (2017). doi: 10.1165/rcmb.2016-01110C; pmid: [DOI] [PMC free article] [PubMed] [Google Scholar]
- 53.Horng T, Barton GM, Medzhitov R, TIRAP: An adapter molecule in the Toll signaling pathway. Nat. Immunol. 2, 835–841 (2001). doi: 10.1038/ni0901-835; pmid: [DOI] [PubMed] [Google Scholar]
- 54.Jiang Z et al. , CD14 is required for MyD88-independent LPS signaling. Nat. Immunol. 6, 565–570 (2005). doi: 10.1038/ni1207; pmid: [DOI] [PubMed] [Google Scholar]
- 55.Tomley FM, in Basic DNA and RNA Protocols, Harwood AJ, Ed. (Humana Press, Totowa, NJ, 1996), Basic DNA and RNA Protocols, pp. 359–362. [Google Scholar]
Associated Data
This section collects any data citations, data availability statements, or supplementary materials included in this article.
Supplementary Materials
1
2