Long-Term Potentiation of Intrinsic Excitability at the Mossy Fiber–Granule Cell Synapse of Rat Cerebellum (original) (raw)
Abstract
Synaptic activity can induce persistent modifications in the way a neuron reacts to subsequent inputs by changing either synaptic efficacy or intrinsic excitability. After high-frequency synaptic stimulation, long-term potentiation (LTP) of synaptic efficacy is commonly observed at hippocampal synapses (Bliss and Collingridge, 1993), and potentiation of intrinsic excitability has recently been reported in cerebellar deep nuclear neurons (Aizenmann and Linden, 2000). However, the potential coexistence of these two aspects of plasticity remained unclear. In this paper we have investigated the effect of high-frequency stimulation on synaptic transmission and intrinsic excitability at the mossy fiber–granule cell relay of the cerebellum. High-frequency stimulation, in addition to increasing synaptic conductance (D'Angelo et al., 1999), increased granule cell input resistance and decreased spike threshold. These changes depended on postsynaptic depolarization and NMDA receptor activation and were prevented by inhibitory synaptic activity. Potentiation of intrinsic excitability was induced by relatively weaker inputs than potentiation of synaptic efficacy, whereas with stronger inputs the two aspect of potentiation combined to enhance EPSPs and spike generation. Potentiation of intrinsic excitability may extend the computational capability of the cerebellar mossy fiber–granule cell relay.
Keywords: synaptic plasticity, LTP, NMDA receptors, cerebellum, granule cells, intrinsic excitability, E-S potentiation
In addition to causing transient modifications in neuronal potential, synaptic activity can induce changes in the way a neuron responds to subsequent inputs. This property, which is called synaptic plasticity, can entail persistent changes in both synaptic efficacy and intrinsic neuronal excitability. Although these two aspects of plasticity may concur to improve neuron and network computation (Fregnac, 1998), their potential coexistence remained unclear.
A well known model for synaptic plasticity is long-term potentiation (LTP), which is typically induced by high-frequency activation of NMDA receptors at glutamatergic synapses (Bliss and Collingridge, 1993; Bear and Malenka, 1994). Synaptic efficacy is enhanced during LTP. However, in hippocampal pyramidal cells the probability of action potential activation increases more than expected from potentiation of synaptic efficacy (E-S potentiation) (Bliss and Lömo, 1973; Andersen et al., 1980), suggesting that additional factors are involved. E-S potentiation was usually shown to depend on depression of synaptic inhibition (Abraham et al., 1987; Chavez-Noriega et al., 1990; Breakwell et al., 1996), although in some cases an intrinsic excitability change was suggested (Pugliese et al., 1994; Daoudal et al., 1999).
Activity-dependent changes in intrinsic excitability are common in the developing brain (Spitzer, 1991); their mechanisms have been investigated in cell culture (Turrigiano et al., 1994; Desai et al., 1999), and their computational implications have been predicted by using theoretical models (Stemmler and Koch, 1999). Recently, an NMDA receptor-dependent potentiation in intrinsic excitability has been observed in cerebellar deep nuclear neurons after high-frequency tetanic stimulation similar to that used to induce LTP, although in the absence of any synaptic efficacy changes (Aizenman and Linden, 2000).
We have investigated whether changes in intrinsic excitability could be induced by high-frequency stimulation of the mossy fiber–granule cell synapse of the cerebellum, at which NMDA receptor-dependent LTP has recently been demonstrated (D'Angelo et al., 1999). After pharmacological blockage of inhibitory synapses, high-frequency stimulation induced an NMDA receptor-dependent potentiation of intrinsic excitability. This depended on a rise in input resistance and a decrease in spike threshold, which enhanced EPSPs and spike firing. Together with potentiation of synaptic conductance, potentiation of intrinsic excitability may play an important role in regulating granule cell synaptic excitation and cerebellar network computation.
MATERIALS AND METHODS
Acute 250-μm-thick cerebellar slices were obtained from 19- to-22-d-old Wistar rats as reported previously (D'Angelo et al., 1999). The rats were anesthetized with halothane (Aldrich, Milwaukee, WI) before being killed by decapitation. Slices were cut in the sagittal plane from the cerebellar vermis in cold Krebs' solution and maintained at room temperature before being transferred to a 1.5 ml recording chamber mounted on the stage of an upright microscope (ZeissStandard-16). The preparations were superfused with Krebs' solution and maintained at 30°C with a feedback Peltier device (HCC-100A; Dagan Corporation, Minneapolis MN).
The Krebs' solution contained (in mm): NaCl 120, KCl 2, MgSO4 1.2, NaHCO3 26, KH2PO4 1.2, CaCl2 2, glucose 11, and was equilibrated with 95% O2 and 5% CO2, pH 7.4. The control and test solutions were applied locally through a multi-barrel pipette. Perfusion of the control solution was commenced before seal formation and was maintained until switching to the test solutions. Unless stated otherwise, the perfused solutions contained the GABA-A receptor blocker 10 μm bicuculline. Nystatin and bicuculline were obtained from Sigma (St. Louis, MO), and the glutamate receptor antagonists d-2-amino-5-phosphonovaleric acid (APV), 7-chlorokinurenic acid (7-Cl-kyn), and 6-cyano-7-nitroquinoxaline-2,3-dione (CNQX) were obtained from Tocris Cookson (Bristol, UK).
Whole-cell patch-clamp recordings were performed in granule cells using the perforated-patch technique, which prevents cytoplasmic washout (Horn and Marty, 1988; Edwards et al., 1989). The pipette solution contained (in mm): K2SO4 80, NaCl 10, glucose 15, HEPES 5 (pH adjusted to 7.2 with KOH), and nystatin 100 μg/ml. Membrane potential was measured relative to an Ag-AgCl reference electrode (Clark Instruments, Pangbourne, UK) and was not corrected for the Donnan potential developing across the patch (−5 mV inside the cell). Electrical activity was recorded with an Axopatch 200-B amplifier, sampled with a Digidata 1200B interface (500 μsec/point), and analyzed off-line with P-Clamp software (Axon Instruments). The mossy fibers were stimulated with a bipolar tungsten electrode via a stimulus isolation unit.
In a typical experiment, mossy fibers were activated at a frequency of 0.1 Hz, and step current pulses were applied every 5 min from the membrane potential of −80 mV. High-frequency pulses were delivered 10 min after establishing the whole-cell recording configuration (time = 0) either as a theta-burst stimulation (TBS; four 100 msec, 100 Hz bursts of impulses repeated every 250 msec) or continuous stimulation (CS; one 1000 msec, 100 Hz burst of impulses) from potentials between −60 and −90 mV.
Membrane potential during step current injection was estimated as the average value between 500 and 800 msec. Membrane potential during TBS was estimated as the mean of average values measured in the central 70 msec of each burst (tracings were filtered at 100 Hz). The action potentials consisted of two components, the prepotential and the upstroke (D'Angelo et al., 1998). The threshold of spike prepotential (_Th_1) was measured at the flexus in the interspike trajectory, whereas that of the upstroke (_Th_2) was measured at the sharp transition from prepotential to upstroke (see Fig. 5,inset). _Th_1 coincided with the minimum depolarization necessary to activate an action potential, whereas _Th_2 approached the depolarization reached by those prepotentials that did not initiate the ballistic phase of the action potential (examples are shown in Figs.3B, 4A,B, and7A). In some cases, threshold identification was aided by taking the first time derivative of the signal (data not shown). Data are reported as mean ± SD, and statistical comparisons were performed using Student's t test.
Fig. 5.

Decreased spike threshold during LTP. The inset shows where the thresholds of spike prepotential (_Th_1) and spike upstroke (_Th_2) were measured. A, B, Spikes in control recordings (A) and in recordings in which LTP was induced (B). Tracings were taken 8 and 25 min after beginning recordings from the same cells shown in Figure 3. C, Time course of threshold changes in control recordings (n = 5;dotted line; the SD was between 4 and 6 mV) and in recordings in which LTP was induced (n = 10).D, Greater decrease in _Th_1than _Th_2 caused an enlargement of spike prepotential during LTP (●; n = 10; control recordings 35; n = 5).
Fig. 3.
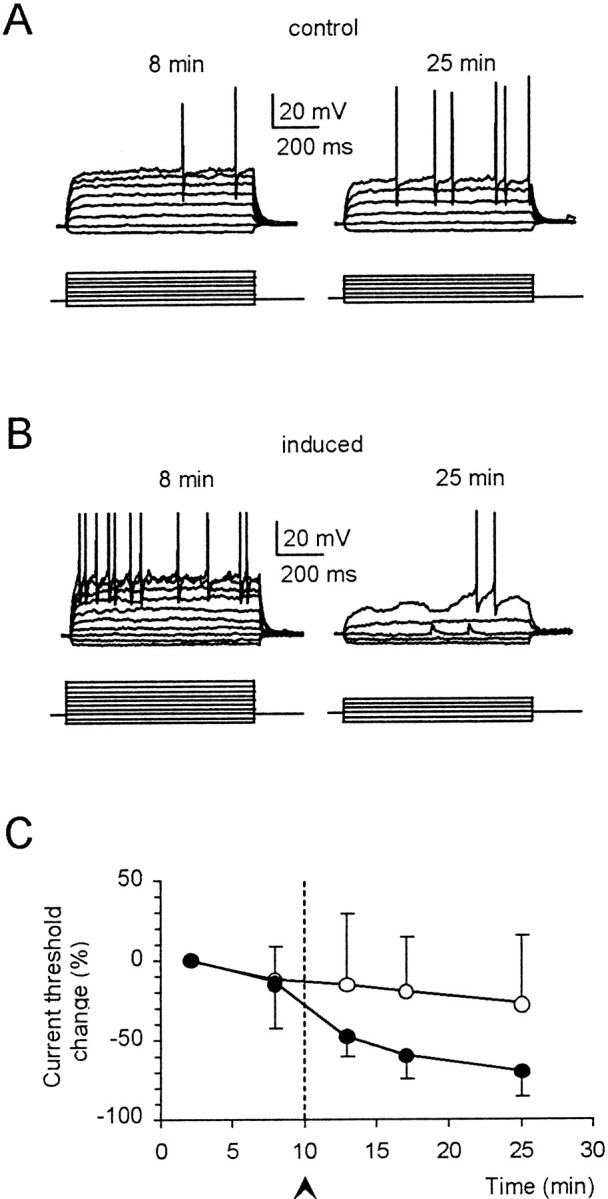
Enhanced action potential generation during LTP. Granule cell responses to current injection (bottom tracings, 2 pA/step) from −80 mV are compared in (A) control recordings and in (B) recordings in which LTP was induced (this cell was one of those included in Fig.2A1). Tracings were taken 8 and 25 min after the beginning of recordings. C, Time course of the current needed to fire action potentials (current threshold) in control recordings (○; n = 5) and in recordings in which LTP was induced (●; n = 10). Note the marked decrease in current threshold during LTP.
Fig. 4.

Increased input resistance during LTP.A, B, Voltage–current plots have been constructed by measuring steady-state depolarization in the tracings of Figure 3, A and B, respectively (○ 8 min and ● 25 min after beginning of recordings). C, Time course of _R_in in control recordings (dotted line, n = 5; SD was between 0.5 and 0.7 GΩ) and in recordings in which LTP was induced (solid line; n = 7). Note that after LTP induction, _R_in increased at potentials higher (54) but not lower (55) than −80 mV. In control recordings_R_in remained stable in both potential ranges.
Fig. 7.

Synaptic inhibition prevents LTP. Effect of TBS during perfusion of a bicuculline-free solution. A, B, Tracings in A [EPSPs (top row) and responses to 4 and 8 pA current steps (bottom row); ➤ indicates application of TBS] and B (membrane depolarization during TBS) illustrate one of two experiments in which recordings lasted long enough to allow a second TBS to be applied during subsequent 10 μm bicuculline perfusion. LTP, comprising EPSP and intrinsic excitability potentiation, could be elicited in the presence but not in the absence of bicuculline.C, Average EPSP changes in six cells after TBS in bicuculline-free solution. _D, R_inchanges (both above and below −80 mV) and changes in_Th_1 and Th_2corrected for time-dependent changes in control recordings. All data were recorded 15 min after TBS (same cells as in_C).
Just after obtaining the cell-attached configuration, electrode capacitance was carefully cancelled to allow for electronic compensation of pipette charging during subsequent current-clamp recordings (D'Angelo et al., 1995). The cerebellar granule cell is electrotonically compact and can be treated as a simple RC system, in which relevant parameters can be extracted by analyzing passive current relaxation induced by step voltage changes (D'Angelo et al., 1995, 1999; Silver et al., 1996). Monoexponential fitting to current transients elicited by 10 mV hyperpolarizing voltage steps from the holding potential of −80 mV yielded the voltage-clamp time constant, τVC. The input capacitance (_C_in) was measured from the capacitive charge (the area underlying current transients), and series resistance (_R_s) was calculated as_R_s = τVC/_C_in. Input resistance _R_in was computed from the steady current flowing after termination of the transient. When the patch perforation had stabilized, typical granule cell values were obtained [_C_in = 3.1 ± 0.7 pF,_R_in = 2.3 ± 0.5 GΩ, and_R_s = 34.3 ± 17.2 MΩ (n = 18 for all measurements)].
Current-clamp recordings were performed in the “fast” operating mode to optimize the reaction rate of the amplifier (D'Angelo et al., 1998; Magistretti et al., 1998). The effect of_R_s in current-clamp recordings is inversely proportional to _R_in. Because_R_s was approximately two orders of magnitude smaller than _R_in, the effect of _R_s on voltage recordings was negligible (∼1%). For this reason, (1) perforated-patch recordings were at no disadvantage to ruptured-patch recordings despite_R_s being nearly 50% higher; (2) bridge balancing was unnecessary, and (3) recording stability was ensured despite changes in _R_s that might occur during prolonged recordings. Recording stability was attested by _R_in measurements, as shown in Figure 4.
Although perforated-patch recordings prevent cytoplasmic constituents from being washed out, EPSP size and spike threshold showed a slow time-dependent decrease (see Figs. 2C, 3C,4C). This may reflect long-term modifications induced by spike discharge (Pockett et al., 1990; Christofi et al., 1993;Aizenmann and Linden, 2000) generated by step current pulses used to monitor granule cell intrinsic excitability.
Fig. 2.

LTP of excitatory transmission.A1, A2, Effect of TBS delivered from −70 mV in a solution containing 10 μm bicuculline. Control EPSPs activated from −80 mV measured 9.1 ± 3.2 mV in A1 and 21.2 ± 4.3 mV in A2. LTP was manifest as an EPSP increase, which was larger in A2 than_A1_. In A2, EPSP growth led to spike generation 7 min after TBS. B1 and_B2_, Membrane depolarization during TBS corresponding to recordings in A1,A2. Note stronger depolarization and spike generation in B2 than_B1_. C, Average EPSP potentiation in five cells as in A1 (●) and in five cells as in A2 (○; the point series is interrupted because of spike generation). Results are compared with control EPSP recordings in which no TBS was applied (Δ;n = 5). D, Potentiation of the probability of firing during LTP in cells showing spikes during the control period (n = 8). In this and the following figures, an arrowhead (➤) and a_vertical dotted line_ indicate TBS. Data points are reported as mean ± SD, and time is relative to beginning of recordings.
RESULTS
The effect of high-frequency mossy fiber stimulation on synaptic efficacy and intrinsic granule cell excitability was investigated in rat cerebellar slices at P19–P22, when granule cells show mature synaptic and excitable properties (D'Angelo et al., 1998), using whole-cell perforated-patch recordings (Horn and Marty, 1988).
Preliminary observations
Granule cells are excited by glutamatergic mossy fiber synapses and inhibited by GABAergic Golgi cell synapses (Fig.1A). EPSPs recorded with 10 μm bicuculline in the bath to block GABA-A receptors (Fig. 1B) measured between 8 and 22 mV in different experiments (compare Fig.2). Considering that cerebellar granule cells receive four mossy fiber inputs on average (Eccles et al., 1967), each causing an 8–12 mV depolarization (D'Angelo et al., 1995; Silver et al., 1996), one to three mossy fiber synapses should have been activated. Golgi cells can be activated directly by mossy fibers in the glomeruli, as well as by granule cell axons, the parallel fibers (Eccles et al., 1967). Mossy fiber stimulation in bicuculline-free solution (i.e., with unblocked GABA-A receptors) caused strong granule cell inhibition, curtailing EPSPs and preventing spike generation (cf. tracings obtained before and after bicuculline application in Fig.1B). Because parallel fibers are severed in sagittal slices, Golgi cells should be preferentially activated through their mossy fiber input rather than through the granule cell–parallel fiber recurrent loop. Consistently, inhibition arose quickly (3–5 msec), whereas longer delays would be expected for feedback inhibition (Vos et al., 1999). IPSPs were evident at potentials positive to −64.2 ± 3.3 mV (n = 5) (Fig. 1C), above the chloride equilibrium potential (−66 mV) (see Materials and Methods) and the granule cell resting potential (−63.6 ± 8.9 mV;n = 10). Because GABAergic responses have a depolarizing action below the chloride equilibrium potential, the marked EPSP reduction observed in this membrane potential range indicates that GABA receptors act through a shunting mechanism to decrease granule cell input resistance. GABA-A receptors may also operate through a tonic inhibition mechanism (Brickley et al., 1996), because granule cell input resistance was 28% lower before bicuculline perfusion than after it (1.8 ± 0.7 GΩ vs 2.5 ± 1.7 GΩ;n = 7).
Fig. 1.

Synaptic excitation and inhibition of cerebellar granule cells. A, Schematic drawing of the cerebellar network. GrC, Granule cell;GoC, Golgi cell; PC, Purkinje cell;mf, mossy fiber; pf, parallel fiber.B, Granule cell synaptic responses elicited from two different membrane potentials before and after 10 μmbicuculline application. Bicuculline enhanced EPSPs and spike generation. C, Granule cell synaptic responses elicited from different membrane potentials in bicuculline-free solution. The hyperpolarizing component of the response was present only above the Cl− equilibrium potential (−66 mV). Amplitudes of the depolarizing (○) and hyperpolarizing (●) components of the response are plotted to the right(symbols over tracings indicate where measurements were taken).
Mossy fibers convey complex patterns of high-frequency spike bursts during movement (Kase et al., 1980) and can entrain the granular layer to discharge at theta frequency (Pellerin and Lamarre, 1997; Hartmann and Bower, 1998). In preliminary experiments we observed that LTP was similar when it was induced by high-frequency stimulation organized either in repeated bursts (TBS) or in a single continuous burst (CS) (Table 1). TBS was thus preferred because it allowed a closer comparison with previous voltage-clamp experiments (D'Angelo et al., 1999).
Table 1.
Effect of TBS and CS on synaptic efficacy and intrinsic excitability
| Bicuculline 10 μm | Bicuculline free | ||||
|---|---|---|---|---|---|
| TBS | CS | TBS | CS | ||
| EPSC amplitude | (% change) | 32 ± 13 (10)1-a | 25 ± 15 (5)1-b | ||
| EPSP amplitude | (% change) | 84 ± 16 (5) | 75 ± 19 (4) | −2.3 ± 4.5 (6) | −7.2 ± 9.6 (5) |
| _R_in | (% change) | 37 ± 33 (10) | 41 ± 23 (5) | −0.06 ± 0.5 (6) | −10 ± 14.3 (5) |
| _Th_1 | (mV) | −7.9 ± 3.5 (10) | −9.1 ± 3.8 (5) | 1.8 ± 1.9 (6) | 1.6 ± 2.4 (5) |
EPSP potentiation
In an initial set of experiments, LTP was investigated during GABA-A receptor blockage by 10 μm bicuculline. LTP recordings were grouped depending on membrane depolarization efficiency during TBS, which in turn depended on the initial EPSP size (Fig. 2, Table 2).
Table 2.
Effect of TBS strength on EPSP potentiation
| n | EPSP (mV) | TBS | LTP (% EPSP change) | ||
|---|---|---|---|---|---|
| m.b.d. (mV) | s.f. (Hz) | ||||
| Weak TBS | 5 | 9.2 ± 1 | −56 ± 6.5 | 13 ± 15 | 23 ± 14 |
| Strong TBS | 5 | 14.6 ± 4.8 | −38 ± 4.9 | 71 ± 14 | 84 ± 16 |
In the first group, TBS had a weak depolarizing action (n = 5) (Fig.2A1,B1). A few spikes could be elicited in the first TBS burst in three of five cells, and depolarization tended to decrease in subsequent bursts (Fig. 2). After TBS, EPSP amplitude increased over control values by 23 ± 14% (n = 5; p < 0.01) in 15 min (Fig. 2A1,C).
In a second group, TBS caused a strong granule cell excitation (n = 5) (Fig.2A2,B2). Robust action potential discharge was generated in all TBS bursts (Fig.2). After TBS, EPSPs increased by 84 ± 16% (p < 0.01; n = 5) over control values in ∼7 min, and most of them then elicited action potentials (Fig. 2A2,C). In a different set of cells showing strong TBS (n = 8), action potentials were occasionally generated by control EPSPs (19.7%) and became more frequent after LTP, precluding EPSP changes from being measured. In these recordings, after TBS, the probability of action potential generation increased by 120 ± 85% over control values in 15 min (p < 0.01; n = 8) (Fig. 2D), and in many cases spikes occurred in doublets or triplets (data not shown).
Thus, although EPSP potentiation was observed in all cases, it was of different magnitude depending on the initial EPSP size and the excitatory action of TBS (see also below). It should be noted that control EPSPs tended to decrease slightly with time (−17.2 ± 11.4% after 20 min recordings; n = 5) (Fig.2C), probably reflecting simultaneous synaptic depression (Pockett et al., 1990; Christofi et al., 1993).
Potentiation of intrinsic membrane excitability
Cerebellar granule cells injected with step depolarizing currents showed inward rectification in the subthreshold membrane potential region and, once the threshold was reached, generated a repetitive spike discharge (D'Angelo et al., 1995, 1998) (Fig.3A). After TBS, action potential generation was enhanced, and enhanced depolarization associated with membrane potential oscillations could often be observed in the threshold region (Figs. 3B, 5B,7A). The current needed to generate spikes (current threshold) decreased (Fig. 3A,B), becoming significantly smaller than in control recordings (−70 ± 16% 15 min after TBS; n = 10; p < 0.03) (Fig. 3C). Because GABA-A receptors were blocked, the reduction in current threshold reflected a potentiation of intrinsic granule cell excitability. The mechanism of excitability potentiation was further investigated by measuring changes of apparent granule cell input resistance (_R_in) and of action potential threshold in the experiments of Figure 2C (those in Fig. 2D had a similar behavior; data not shown).
_R_in was measured from membrane potential changes caused by current steps in the 10 mV potential range either below or above −80 mV (Fig.4A,B). After TBS, _R_in rapidly increased above −80 mV, whereas _R_in remained unchanged below −80 mV (Fig. 4C). The_R_in increase reached 37 ± 33% 15 min after TBS (n = 10; p < 0.03).
Action potential threshold was measured both at the beginning of spike prepotential (_Th_1) and at the beginning of upstroke (_Th_2) (Fig.5, inset) (D'Angelo et al., 1998). After TBS, both thresholds decreased, becoming significantly lower than in control recordings (n = 10;p < 0.05) (Fig. 5A_–_C). Because_Th_1 decreased more than_Th_2 (Fig. 5C), the spike prepotential was enhanced (4.1 ± 3.2 mV 15 min after TBS;n = 10; p < 0.03) (Fig.5D).
These results indicated that an increase in_R_in and a decrease in spike threshold combined to reduce the current needed to fire action potentials during LTP (similar results could be obtained using CS rather than TBS) (Table1).
Relationship between potentiation of EPSPs and intrinsic excitability
The relationship between _R_in and EPSP potentiation is shown in the plot in Figure6A, in which the diagonal represents an equal increase in EPSP and_R_in. The presence of points either above or below the diagonal indicated that the_R_in increase could be associated with an increase or decrease in synaptic conductance, respectively. Moreover, points falling on the _y_-axis reflected a pure synaptic conductance increase. It should be noted that points falling above the diagonal were more frequently observed after strong (Fig.6A, ●) rather than weak (Fig. 6A, ○) TBS bursts. Strong TBS should therefore be needed to obtain a reliable synaptic conductance potentiation (also see Fig. 9).
Fig. 6.
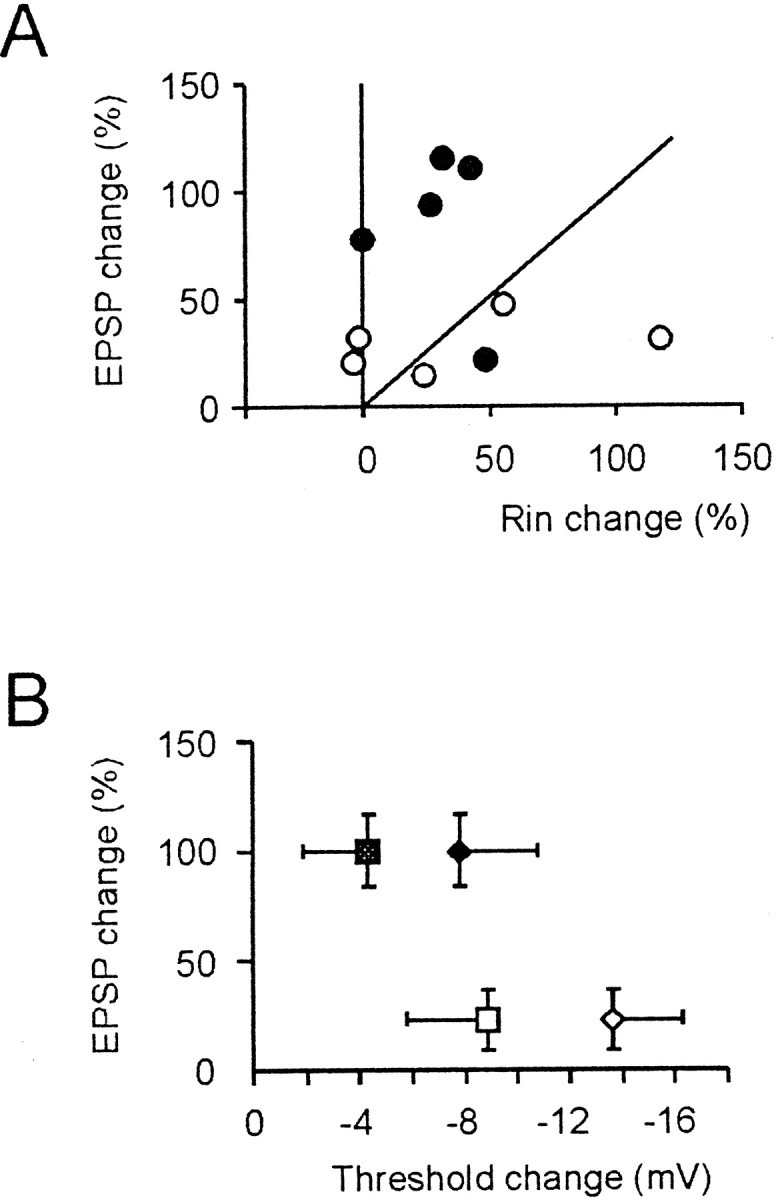
Relationship between EPSP and intrinsic excitability potentiation. A, Plot of EPSP versus_R_in changes at potentials higher than −80 mV. The diagonal is the place where EPSP equals_R_in changes, ○ corresponds to weak TBS (same experiments as in Fig.2A1,B1), and ● corresponds to strong TBS (same experiments as in Fig.2A2,B2). B, Plot of EPSP versus _Th_1 (▩, strong TBS,n = 5; ■, weak TBS, n = 5) and _Th_2 (⧫, strong TBS,n = 5; ◊, weak TBS, n = 5) changes. _Th_1 and_Th_2, which were measured in the same cells included in Figure 2C and Table 2, were corrected for time-dependent changes in control recordings. Note that changes in_R_in,_Th_1, and_Th_2 were already appreciable, with relatively small EPSP changes. All data in this figure were recorded 15 min after TBS.
Fig. 9.

LTP dependence on voltage and spike frequency. A1, Magnitude of EPSP amplitude changes as a function of depolarization (A1) or spike frequency (A2) during TBS. ▵, Strong TBS in 10 μm bicuculline (as in Fig.2A2); ○, weak TBS in 10 μmbicuculline (as in Fig. 2A1); ◊, TBS in bicuculline-free solution (as in Fig. 7); ■, TBS from −90 mV in 10 μm bicuculline (as in Fig. 8). In_A1_, synaptic current changes in voltage-clamp recordings with pairing at −60 or −40 mV are shown for comparison (▴) (data from D'Angelo et al., 1999). B1,B2, Normalized changes in EPSP (solid line), Rin (dashed line), and spike threshold (Th1; dotted line) as a function of depolarization (B1) or spike frequency (B2) during TBS. EPSP and_Th_1 data have been adjusted for time-dependent changes in control recordings. Note that changes in_R_in and _Th_1 occur earlier than those in EPSPs. All data in this figure were recorded 15 min after TBS.
The relationship between the spike threshold and EPSP potentiation (Fig. 6B) showed that the spike threshold was significantly reduced after either weak or strong TBS (Fig.6B). Thus, as with the_R_in increase, the decrease in spike threshold occurred at a lower threshold than potentiation of synaptic transmission.
Effect of synaptic inhibition on LTP
An important role in LTP regulation is played by inhibitory synapses. In the hippocampus, synaptic inhibition has the dual role of preventing LTP induction (Davies et al., 1991) and enhancing postsynaptic responsiveness through its own depression during LTP (Abraham et al., 1987; Chavez-Noriega et al., 1990; Breakwell et al., 1995). In the cerebellum, LTP properties may be regulated by inhibitory Golgi synapses (compare Fig. 1).
Figure 7A shows recordings from a granule cell in which TBS was delivered in bicuculline-free solution to allow synaptic inhibition of the granule cell. In this condition, TBS caused very weak depolarization, and no LTP was induced. After 10 μm bicuculline perfusion, TBS caused robust action potential discharge, inducing normal LTP. Average results obtained in five recordings in bicuculline-free solution are shown in Figure 7B,C. Burst membrane potential during TBS settled at −2.1 ± 9.2 mV (_n_= 5), close to the Cl− reversal potential. EPSP, _R_in, and spike threshold showed no significant potentiation. GABA-A receptor-mediated synaptic inhibition therefore exerted strong preventative action on mossy fiber–granule cell LTP (similar results were obtained using CS rather than TBS) (Table 1).
The role of membrane depolarization
Membrane depolarization is a fundamental factor in the induction of synaptic plasticity (Kelso et al., 1986). Indeed, the results reported in Figures 2 and 7 suggest that membrane depolarization during TBS plays an important role in the subsequent potentiation of EPSPs and intrinsic excitability. The effect of membrane depolarization was further investigated by delivering TBS from a hyperpolarized membrane potential (−90 mV) (Fig.8A). During TBS (Fig.8B), burst membrane potential settled at −71.1 ± 3.2 mV (n = 6). After TBS, EPSPs tended to decrease (Fig. 8C,D), although the change was not statistically significant (p > 0.3).
Fig. 8.

Membrane hyperpolarization prevents LTP. Effect of TBS delivered from −90 mV (10 μm bicuculline in the bath). A, EPSPs recorded before and after TBS.B, Membrane depolarization during TBS. Note that TBS does not reach spike threshold. C, Average EPSP changes in five cells after TBS. The control dotted lines are replotted from Figure 2C. D,_R_in changes (both above and below −80 mV) and changes in _Th_1 and_Th_2 corrected for time-dependent changes in control recordings. All data were recorded 15 min after TBS (same cells as in C).
When the effect of membrane depolarization in different experimental conditions was considered (Fig.9A1), a direct relationship between mean TBS burst depolarization and the magnitude of EPSP potentiation was observed. Potentiation of intrinsic excitability (Fig. 9B1) showed a lower threshold than potentiation of EPSP or synaptic conductance, as also suggested by the plot in Figure 6A. As well as membrane depolarization, the spikes may themselves enhance the induction of synaptic plasticity (Thomas et al., 1998; Linden, 1999). Optimal EPSP potentiation was associated with high spike frequency (Fig.9A2,B2), whereas intrinsic excitability was already potentiated to the maximum at low spike frequency. The implications of membrane depolarization and spike discharge for mossy fiber–granule cell plasticity are considered in Discussion.
The role of NMDA receptors
Voltage-dependent NMDA receptor activation is the principal factor responsible for LTP induction (Bliss and Collingridge, 1993). It was therefore interesting to investigate whether potentiation of both EPSP and intrinsic granule cells excitability depended on NMDA receptor activation. Application of the NMDA receptor blockers, 100 μm APV and 50 μm 7-Cl-kyn (Fig.10), depressed EPSP temporal summation (Fig. 10B1) (D'Angelo et al., 1995). During TBS applied from −70 mV, spike threshold was reached in three of six cells. In the remaining three cells, mean burst depolarization was −57.5 ± 6.5 mV (n = 3). None of these cells showed any potentiation of EPSPs or intrinsic excitability (compare Fig. 9). In an additional four experiments (Fig.10A2), membrane depolarization was reinforced by associating TBS with depolarizing current pulses (Fig.10B2). In these experiments neither EPSP nor intrinsic excitability potentiation were induced. The cumulative results of the experiments in Figure 10, A and_B_, are shown in Figure 10, C and D. These results indicate that although NMDA receptors reinforce membrane depolarization during repetitive stimulation, they are needed to induce potentiation of EPSPs and postsynaptic responsiveness through a mechanism that differs from their direct depolarizing action and presumably involves an increase in Ca2+influx and the consequent activation of Ca2+-dependent processes.
Fig. 10.

NMDA receptor block prevents LTP. Effect of TBS delivered from −70 mV in the presence of 100 μm APV and 50 μm 7-Cl-ky to block NMDA receptors (10 μm bicuculline in the bath). A1,A2, EPSPs recorded before and after TBS shown in_B1_ and B2. Although a normal TBS was applied in_B1_, TBS was reinforced in_B_2 by a 10 pA pulse during synaptic activation. C, Average EPSP changes after TBS in six cells as in A 1 and_B1_ and in four cells as in_A2_ and_B_2. D,_R_in changes (both above and below −80 mV) and changes in _Th_1 and_Th_2 adjusted for time-dependent changes in control recordings. All data were recorded 15 min after TBS (same cells as in C).
DISCUSSION
This paper demonstrates the potentiation of intrinsic excitability in cerebellar granule cells after high-frequency mossy fiber stimulation. The apparent input resistance (_R_in) increased and spike threshold decreased, enhancing granule cell synaptic excitation. Potentiation of intrinsic excitability could coexist with potentiation of synaptic efficacy, and both depended on NMDA receptor activation.
Potentiation of granule cell intrinsic excitability was induced between −60 and −40 mV. In this potential range, granule cell NMDA receptors activate sizeable conductance (D'Angelo et al., 1995), probably because the NR2C subunit confers low sensitivity to Mg2+ block (Monyer et al., 1994). The main action of NMDA receptors could be that of gating Ca2+ influx (in fact, in whole-cell recordings performed with pipettes containing 10 mm BAPTA, any excitability change was prevented; n = 5) (E. D'Angelo and P. Rossi, unpublished observation). In addition, NMDA receptors enhanced membrane depolarization (Fig. 10).
Synaptic conductance needed stronger depolarization (approximately −40 mV) than intrinsic excitability to be potentiated [see also D'Angelo et al. (1999)]. A discriminating factor between these two aspects of potentiation may be the intensity of the NMDA current, which rises steeply between −60 and −40 mV. Another discriminating factor may be spikes (Thomas et al., 1998; Linden, 1999). Spikes were frequent when LTP included synaptic conductance potentiation, whereas they were rare or absent when potentiation of intrinsic excitability was prominent. Spikes may favor the induction of plasticity through a Na+-dependent enhancement of the NMDA current (Yu and Salter, 1998) and by activating voltage-dependent Ca2+ channels (Magee and Johnston, 1997;Markram et al., 1997; Aizenmann et al., 1998; Aizenmann and Linden, 2000). It should be noted that spikes alone were not sufficient to induce synaptic plasticity, as demonstrated by recordings in which NMDA receptors were blocked.
The control of granule cell synaptic excitation proved critical in allowing a voltage- and NMDA receptor-dependent regulation of plasticity. On the one hand, granule cell excitation was finely modulated by the intensity [and frequency; see D'Angelo et al., 1995) of repetitive mossy fiber discharge. The physiological significance of this mechanism is suggested by the observation that repetitive mossy fiber discharge changes in relation to specific behavioral states_in vivo_ (Kase et al., 1980; Pellerin and Lamarre, 1997;Hartmann and Bower, 1998). On the other hand, granule cell excitation was reduced through both tonic and phasic mechanisms of synaptic inhibition mediated by Golgi cells (Fig. 1) (Brickley et al., 1996). Although Golgi cell inhibition prevented mossy fiber–granule cell plasticity, the efficiency of this process _in vivo_remains speculative. Golgi cell activity reflects excitation in a large population of mossy and parallel fibers (Eccles et al., 1967; van Kan et al., 1993; Vos et al., 1999), the discharge of which is probably less synchronous than in our experiments (in which the whole afferent fiber bundle was excited). Thus Golgi cells should dynamically modulate mossy fiber–granule cell plasticity rather than exert an all-or-none preventative action. Moreover, local depression of GABA release by high-frequency mossy fiber discharge (Mitchell and Silver, 2000) may favor LTP induction at specific synapses by contrasting background granule cell inhibition (Davies et al., 1991). A closer understanding of Golgi cell functions seems crucial to clarify the physiological induction mechanism of mossy fiber–granule cell plasticity.
The increase in granule cell input resistance and spike prepotential occurred in a limited membrane potential region, suggesting that voltage-dependent conductances involved in spike generation were changed. Although at present there is no direct evidence to implicate any specific membrane conductance, it should be noted that an increased Na+ current and a decreased K+ current may account for a reduced firing threshold, as demonstrated recently in cell culture (Desai et al., 1999). A Ca2+ current-dependent effect, which might occur in hippocampal pyramidal neurons (Wathey et al., 1992) or in cerebellar deep nuclear cells (Aizenmann and Linden, 2000), seems less likely to occur in cerebellar granule cells because their Ca2+ currents activate once the spike has already been generated (D'Angelo et al., 1998). It should be noted that persistent depression of synaptic inhibition (as reported in hippocampal E-S potentiation) (Abraham et al., 1987; Chavez-Noriega e al., 1990; Breakwell et al., 1995) did not significantly contribute to enhance granule cell excitation.
Potentiation of intrinsic excitability and synaptic conductance cooperated to strengthen EPSP–spike coupling and to increase the reliability of spike generation during synaptic transmission (Daoudal et al., 1999). However, the functional significance of intrinsic excitability potentiation may differ partly from that of synaptic conductance potentiation. First, because potentiation of intrinsic excitability could be achieved at a relatively low threshold, it may have a compensatory effect by restoring granule cell readiness in conditions of weak synaptic excitation (Fregnac, 1998). An increased excitability in turn may facilitate the subsequent induction of synaptic conductance potentiation. Second, because the granule cell has a compact electrotonic structure and a marginal potential loss is expected from dendritic endings to soma (Gabbiani et al., 1994;D'Angelo et al., 1995; Silver et al., 1996), potentiated excitability should affect neuronal responsiveness as a whole. Conversely, synaptic conductance changes are thought to be synapse specific (Bliss and Collingridge, 1993).
By allowing learning and storage of activity patterns at specific synapses while maintaining neuronal firing within an appropriate operating window, the combination of changes in synaptic conductance and intrinsic excitation may optimize information transfer and network computation (Stemmler and Koch, 1999). Although plasticity at the mossy fiber–granule cell synapse was not included in Marr's (1969) original model of the cerebellum, it may have important implications for cerebellar control of motor coordination (Arbib et al., 1998;Schweighofer et al., 1998; N. Schweighofer, personal communication).
Footnotes
This work was supported by European Community Grants PL97 0182 and PL97 6060, and by INFM. We acknowledge Arianna Maffei and Elisabetta Sola for assistance with experiments.
Correspondence should be addressed to Dr. Egidio D'Angelo, Department of Cellular/Molecular Physiology and Pharmacology, Via Forlanini 6, I-27100 Pavia, Italy. E-mail: dangelo@unipv.it.
REFERENCES
- 1.Abraham WC, Gustafsson B, Wigström H. Long-term potentiation involves enhanced synaptic excitation relative to synaptic inhibition in guinea-pig hippocampus. J Physiol (Lond) 1987;394:367–380. doi: 10.1113/jphysiol.1987.sp016875. [DOI] [PMC free article] [PubMed] [Google Scholar]
- 2.Aizenmann C, Linden DJ. Rapid, synaptically driven increases in the intrinsic excitability of cerebellar nuclear neurons. Nat Neurosci. 2000;3:109–111. doi: 10.1038/72049. [DOI] [PubMed] [Google Scholar]
- 3.Aizenmann C, Manis PB, Linden DJ. Polarity of long-term synaptic changes is related to postsynaptic spike firing at a cerebellar inhibitory synapse. Neuron. 1998;21:827–835. doi: 10.1016/s0896-6273(00)80598-x. [DOI] [PubMed] [Google Scholar]
- 4.Andersen P, Sundberg SH, Sveen O, Swann JW, Wigström H. Possible mechanisms for long-lasting potentiation of synaptic transmission in hippocampal slices from guinea-pigs. J Physiol (Lond) 1980;301:463–482. doi: 10.1113/jphysiol.1980.sp013256. [DOI] [PMC free article] [PubMed] [Google Scholar]
- 5.Arbib MA, Erdi P, Szentagothai J. Neural organization: structure, function, and dynamics. MIT; London: 1998. Cerebellum. pp. 261–302. [Google Scholar]
- 6.Bear MF, Malenka RC. Synaptic plasticity: LTP and LTD. Curr Opin Neurobiol. 1994;4:389–399. doi: 10.1016/0959-4388(94)90101-5. [DOI] [PubMed] [Google Scholar]
- 7.Bliss TVP, Collingridge GL. A synaptic model of memory: long-term potentiation in the hippocampus. Nature. 1993;361:31–39. doi: 10.1038/361031a0. [DOI] [PubMed] [Google Scholar]
- 8.Bliss TVP, Lömo T. Long-lasting potentiation of synaptic transmission in the dentate area of the anaesthetised rabbit following stimulation of the perforant path. J Physiol (Lond) 1973;232:331–356. doi: 10.1113/jphysiol.1973.sp010273. [DOI] [PMC free article] [PubMed] [Google Scholar]
- 9.Breakwell NA, Rowan MJ, Anwyl R. Metabotropic glutamate receptor dependent EPSP and EPSP-spike potentiation in area CA1 of the submerged rat hippocampal slice. J Neurophysiol. 1996;76:3126–3135. doi: 10.1152/jn.1996.76.5.3126. [DOI] [PubMed] [Google Scholar]
- 10.Brickley SG, Cull-Candy SG, Farrant M. Development of a tonic form of synaptic inhibition in rat cerebellar granule cells resulting from persistent activation of GABAA receptors. J Physiol (Lond) 1996;497:753–759. doi: 10.1113/jphysiol.1996.sp021806. [DOI] [PMC free article] [PubMed] [Google Scholar]
- 11.Chavez-Noriega LE, Halliwell JV, Bliss TVP. A decreased firing threshold observed after induction of the EPSP-spike (E-S) component of long-term potentiation in rat hippocampal slices. Exp Brain Res. 1990;79:633–641. doi: 10.1007/BF00229331. [DOI] [PubMed] [Google Scholar]
- 12.Christofi G, Nowicky AV, Bolsover SR, Bindman LJ. The postsynaptic induction of non-associative long-term depression of excitatory transmission in rat hippocampal slices. J Neurophysiol. 1993;69:219–229. doi: 10.1152/jn.1993.69.1.219. [DOI] [PubMed] [Google Scholar]
- 13.D'Angelo E, De Filippi G, Rossi P, Taglietti V. Synaptic excitation of individual rat cerebellar granule cells in situ: evidence for the role of NMDA receptors. J Physiol (Lond) 1995;484:397–413. doi: 10.1113/jphysiol.1995.sp020673. [DOI] [PMC free article] [PubMed] [Google Scholar]
- 14.D'Angelo E, De Filippi G, Rossi P, Taglietti V. Ionic mechanism of electroresponsiveness in cerebellar granule cells implicates the action of a persistent sodium current. J Neurophysiol. 1998;80:493–503. doi: 10.1152/jn.1998.80.2.493. [DOI] [PubMed] [Google Scholar]
- 15.D'Angelo E, Rossi P, Armano S, Taglietti V. Evidence for NMDA and mGlu receptor-dependent long-term potentiation of mossy fiber–granule cell transmission in rat cerebellum. J Neurophysiol. 1999;81:277–287. doi: 10.1152/jn.1999.81.1.277. [DOI] [PubMed] [Google Scholar]
- 16.Daoudal G, Handa Y, Ferrand N, Debanne D. Synergy between bi-directional changes in excitability and synaptic plasticity in the area CA1 of the rat hippocampus in vitro. Soc Neurosci Abstr. 1999;25:182.1. [Google Scholar]
- 17.Davies CH, Starkey SJ, Pozza MF, Collingridge GL. GABA autoreceptors regulate the induction of LTP. Nature. 1991;349:609–611. doi: 10.1038/349609a0. [DOI] [PubMed] [Google Scholar]
- 18.Desai NS, Rutherford LC, Turrigiano GG. Plasticity in the intrinsic excitability of cortical pyramidal neurons. Nat Neurosci. 1999;2:515–520. doi: 10.1038/9165. [DOI] [PubMed] [Google Scholar]
- 19.Eccles JC, Ito M, Szentagothai J. The cerebellum as a neuronal machine. Springer; Berlin: 1967. [Google Scholar]
- 20.Edwards FA, Konnerth A, Sackmann B, Takahashi TA. A thin slice preparation for patch-clamp recordings from neurones of the mammalian central nervous system. Pflügers Arch. 1989;414:600–612. doi: 10.1007/BF00580998. [DOI] [PubMed] [Google Scholar]
- 21.Fregnac Y. Homeostasis or synaptic plasticity? Nature. 1998;391:845–846. doi: 10.1038/35996. [DOI] [PubMed] [Google Scholar]
- 22.Gabbiani F, Midtgaard J, Knoepfel T. Synaptic integration in a model of cerebellar granule cells. J Neurophysiol. 1994;72:999–1009. doi: 10.1152/jn.1994.72.2.999. [DOI] [PubMed] [Google Scholar]
- 23.Hartmann MJ, Bower JM. Oscillatory activity in cerebellar hemispheres on unrestrained rats. J Neurophysiol. 1998;80:1598–1604. doi: 10.1152/jn.1998.80.3.1598. [DOI] [PubMed] [Google Scholar]
- 24.Horn D, Marty A. Muscarinic activation of ionic currents measured by a new whole-cell recording method. J Gen Physiol. 1988;92:145–159. doi: 10.1085/jgp.92.2.145. [DOI] [PMC free article] [PubMed] [Google Scholar]
- 25.Kase M, Miller DC, Noda H. Discharges of Purkinje cells and mossy fibers in the cerebellar vermis of the monkey during saccadic eye movements. J Physiol (Lond) 1980;300:539–555. doi: 10.1113/jphysiol.1980.sp013178. [DOI] [PMC free article] [PubMed] [Google Scholar]
- 26.Kelso SR, Ganong AH, Brown TH. Hebbian synapses in the hippocampus. Proc Natl Acad Sci USA. 1986;83:5326–5330. doi: 10.1073/pnas.83.14.5326. [DOI] [PMC free article] [PubMed] [Google Scholar]
- 27.Linden DJ. The return of the spike: postsynaptic action potentials and the induction of LTP and LTD. Neuron. 1999;22:661–666. doi: 10.1016/s0896-6273(00)80726-6. [DOI] [PubMed] [Google Scholar]
- 28.Magistretti J, Mantegazza M, de Curtis M, Wanke E. Modalities of distortion of physiological voltage signals by patch-clamp amplifiers: a modelling study. Biophys J. 1998;74:831–842. doi: 10.1016/S0006-3495(98)74007-X. [DOI] [PMC free article] [PubMed] [Google Scholar]
- 29.Magee JC, Johnston D. A synaptically controlled, associative signal for Hebbian plasticity in hippocampal neurons. Science. 1997;275:209–213. doi: 10.1126/science.275.5297.209. [DOI] [PubMed] [Google Scholar]
- 30.Markram H, Lubke J, Frotscher M, Sackmann B. Regulation of synaptic efficacy by coincidence of postsynaptic APs and EPSPs. Science. 1997;275:213–215. doi: 10.1126/science.275.5297.213. [DOI] [PubMed] [Google Scholar]
- 31.Marr D. A theory of cerebellar cortex. J Physiol (Lond) 1969;202:437–470. doi: 10.1113/jphysiol.1969.sp008820. [DOI] [PMC free article] [PubMed] [Google Scholar]
- 32.Mitchell SJ, Silver RA. Glutamate spillover suppresses inhibition by activating presynaptic mGluRs. Nature. 2000;404:498–502. doi: 10.1038/35006649. [DOI] [PubMed] [Google Scholar]
- 33.Monyer H, Burnashev N, Laurie DJ, Sakmann B, Seeburg PH. Developmental and regional expression in the rat brain and functional properties of four NMDA receptors. Neuron. 1994;12:529–540. doi: 10.1016/0896-6273(94)90210-0. [DOI] [PubMed] [Google Scholar]
- 34.Pellerin P-P, Lamarre Y. Local field potential oscillations in primate cerebellar cortex during voluntary movement. J Neurophysiol. 1997;78:3502–3507. doi: 10.1152/jn.1997.78.6.3502. [DOI] [PubMed] [Google Scholar]
- 35.Pockett S, Brookes NH, Bindman NJ. Long-term depression at synapses in slices of rat hippocampus can be induced by bursts of postsynaptic activity. Exp Brain Res. 1990;80:196–200. doi: 10.1007/BF00228861. [DOI] [PubMed] [Google Scholar]
- 36.Pugliese AM, Ballerini L, Passani MB, Corradetti R. EPSP-spike potentiation during primed burst-induced long-term potentiation in the CA1 region of rat hippocampal slices. Neuroscience. 1994;62:1021–1032. doi: 10.1016/0306-4522(94)90340-9. [DOI] [PubMed] [Google Scholar]
- 37.Schweighofer N, Spoelstra J, Arbib M, Kawato M. Role of cerebellum in reaching movements in humans. I. A neural model of the intermediate cerebellum. Eur J Neurosci. 1998;10:95–105. doi: 10.1046/j.1460-9568.1998.00007.x. [DOI] [PubMed] [Google Scholar]
- 38.Silver RA, Cull-Candy SG, Takahashi T. Non-NMDA glutamate receptor occupancy and open probability at a rat cerebellar synapse with single and multiple release sites. J Physiol (Lond) 1996;494:231–250. doi: 10.1113/jphysiol.1996.sp021487. [DOI] [PMC free article] [PubMed] [Google Scholar]
- 39.Spitzer NC. A developmental handshake: neuronal control of ionic currents and their control of neuronal differentiation. J Neurobiol. 1991;22:659–673. doi: 10.1002/neu.480220702. [DOI] [PubMed] [Google Scholar]
- 40.Stemmler M, Koch C. How voltage-dependent conductances can adapt to maximize the information encoded by neuronal firing rate. Nat Neurosci. 1999;2:521–527. doi: 10.1038/9173. [DOI] [PubMed] [Google Scholar]
- 41.Thomas MJ, Watabe AM, Moody TD, Makhinson M, O'Dell TJ. Postsynaptic complex spike bursting enables the induction of LTP by theta frequency synaptic stimulation. J Neurosci. 1998;18:7118–7216. doi: 10.1523/JNEUROSCI.18-18-07118.1998. [DOI] [PMC free article] [PubMed] [Google Scholar]
- 42.Turrigiano G, Abbott LF, Marder E. Activity-dependent changes in the intrinsic properties of cultured neurons. Science. 1994;264:974–977. doi: 10.1126/science.8178157. [DOI] [PubMed] [Google Scholar]
- 43.van Kan PL, Gibson AR, Houk JC. Movement-related inputs in intermediate cerebellum of monkeys. J Neurophysiol. 1993;69:74–94. doi: 10.1152/jn.1993.69.1.74. [DOI] [PubMed] [Google Scholar]
- 44.Vos BP, Volny-Luraghi A, De Schutter E. Cerebellar Golgi cells in the rat: receptive fields and timing of responses to facial stimulation. Eur J Neurosci. 1999;11:2621–2634. doi: 10.1046/j.1460-9568.1999.00678.x. [DOI] [PubMed] [Google Scholar]
- 45.Wathey JC, Lytton WW, Jester JM, Sejinowski TJ. Computer simulation of EPSP-spike (E-S) potentiation in hippocampal CA1 pyramidal cells. J Neurosci. 1992;12:607–618. doi: 10.1523/JNEUROSCI.12-02-00607.1992. [DOI] [PMC free article] [PubMed] [Google Scholar]
- 46.Yu X-M, Salter MW. Gain control of NMDA-receptor currents by intracellular sodium. Nature. 1998;375:469–474. doi: 10.1038/24877. [DOI] [PubMed] [Google Scholar]