Ferritin Mutants of Escherichia coli Are Iron Deficient and Growth Impaired, and fur Mutants are Iron Deficient (original) (raw)
Abstract
Escherichia coli contains at least two iron storage proteins, a ferritin (FtnA) and a bacterioferritin (Bfr). To investigate their specific functions, the corresponding genes (ftnA and bfr) were inactivated by replacing the chromosomal ftnA and bfr genes with disrupted derivatives containing antibiotic resistance cassettes in place of internal segments of the corresponding coding regions. Single mutants (ftnA::spc and bfr::kan) and a double mutant (ftnA::spc bfr::kan) were generated and confirmed by Western and Southern blot analyses. The iron contents of the parental strain (W3110) and the bfr mutant increased by 1.5- to 2-fold during the transition from logarithmic to stationary phase in iron-rich media, whereas the iron contents of the ftnA and ftnA bfr mutants remained unchanged. The ftnA and ftnA bfr mutants were growth impaired in iron-deficient media, but this was apparent only after the mutant and parental strains had been precultured in iron-rich media. Surprisingly, ferric iron uptake regulation (fur) mutants also had very low iron contents (2.5-fold less iron than Fur+ strains) despite constitutive expression of the iron acquisition systems. The iron deficiencies of the ftnA and fur mutants were confirmed by Mössbauer spectroscopy, which further showed that the low iron contents of ftnA mutants are due to a lack of magnetically ordered ferric iron clusters likely to correspond to FtnA iron cores. In combination with the fur mutation, ftnA and bfr mutations produced an enhanced sensitivity to hydroperoxides, presumably due to an increase in production of “reactive ferrous iron.” It is concluded that FtnA acts as an iron store accommodating up to 50% of the cellular iron during postexponential growth in iron-rich media and providing a source of iron that partially compensates for iron deficiency during iron-restricted growth. In addition to repressing the iron acquisition systems, Fur appears to regulate the demand for iron, probably by controlling the expression of iron-containing proteins. The role of Bfr remains unclear.
Iron is an essential nutrient for nearly all forms of life, but its insolubility and reactivity lead to problems of poor availability and toxicity, respectively. One mechanism used to cope with the need to provide sufficient quantities of iron while maintaining it in a nontoxic state involves the use of iron storage proteins, known generically as ferritins (1, 18). Ferritins have been found in all three domains of life, where they are thought to play a housekeeping role in cellular iron homeostasis (29, 55). The ferritins are perceived to store iron in a readily available and soluble form to provide a reserve of iron for metabolism. It has also been suggested that ferritins may alleviate the harmful effects of iron by storing it in a form that is unlikely to participate in free-radical-generating reactions (6, 11, 14).
Two types of iron storage protein have been recognized: the ferritins, which are present in animals, plants, fungi, archaea, and bacteria; and the bacterioferritins, which have so far been observed only in bacteria (and possibly fungi [12]). Ferritins and bacterioferritins are distantly related in evolution but have very similar structural and functional properties (1, 29, 30). They are each composed of 24 subunits which form a spherical protein shell (_M_r∼500,000) having a central cavity that can accommodate up to 4,500 iron atoms (55). However, bacterioferritins differ from ferritins in containing up to 12 heme groups per 24 subunits (1). The function of the heme groups is unknown, but evidence suggests that they may mediate iron release from bacterioferritin (3). Iron storage proteins are widely distributed among prokaryotes, having been found in archaea, high- and low-G+C gram-positive bacteria, cyanobacteria, Bacteroides, Thermotogales, and all four subdivisions of the Proteobacteria, suggesting that the facility to store iron is an important general requirement of prokaryotes (1).
Escherichia coli contains at least four genes that may play roles in iron storage: bfd (previously gen-64), encoding the 64-residue [2Fe-2S]-containing bacterioferritin-associated ferredoxin (Bfd), and bfr, encoding bacterioferritin (Bfr or BFR), both at 75 min; and ftnA (ftn, gen-165, or rsgA), encoding a ferritin (FtnA or FTN), and ftnB (or yecI), encoding a ferritin-like protein (FtnB), both at 43 min. The bfd and bfr genes are copolar and are separated by only 71 bp (2). The ftnB and ftnA genes are also copolar but are 1.4 kb apart (10). Only Bfd, FtnA, and Bfr have been characterized. Whether FtnB functions as an iron storage protein is uncertain because its primary structure suggests that it lacks an active ferroxidase center. Furthermore, the residues involved in subunit interaction in FtnA are poorly conserved in FtnB, indicating that FtnB would not coassemble with FtnA (1). It is speculated that Bfd may interact with Bfr (or other iron complexes) in mediating iron release or delivery (23, 46).
The X-ray structures of FtnA and Bfr have revealed that they are structurally analogous to mammalian ferritins (21, 32). In vitro, FtnA and Bfr behave as typical iron storage proteins in their ability to take up iron (4, 33). Overproduction of FtnA or Bfr, to 14 or 18% of total cellular protein (respectively), increases the cellular iron content 2.5- to 2.6-fold, consistent with an iron-sequestering role in vivo (4, 33). FtnA takes up iron ∼threefold more rapidly than does Bfr in vitro, but Bfr appears to accumulate more iron per molecule than FtnA in vivo (4, 33). Thus, it has been speculated that FtnA and Bfr play roles in short- and long-term iron storage, respectively, like the mammalian H- and L-subunit-rich ferritins (4). It has also been suggested that Bfr serves as an electron carrier for pyruvate oxidase (15), as an electron storage protein (53), or as an accessory protein in lactose transport (60). Studies with a ferritin mutant of Campylobacter jejuni have shown that ferritin increases resistance to redox stress and enhances growth under iron-restricted conditions (59). Inactivation of the Brucella melitensis bacterioferritin gene had no effect on survival and growth in human macrophages (16). In E. coli, the iron-induced redox stress of ferric uptake regulation (fur) mutants is alleviated by multiple copies of the ftnA gene but not of the bfr gene (56). This suggests that overproduced FtnA (but not Bfr) can sequester the excess free iron that apparently accumulates in the cytosol of fur mutants and that FtnA may therefore play a role in iron detoxification. In a fur+ background, both FtnA and Bfr seem able to sequester free cytosolic iron, because overexpression of either bfr or ftnA induces the _fur_-regulated fhuF gene (54).
The reason why E. coli has multiple iron storage proteins is unknown. However, other bacteria such as Mycobacterium tuberculosis, Clostridium acetobutylicum, and Vibrio cholerae (1) also possess both ferritin and bacterioferritin genes, suggesting that the combined presence of ferritins and bacterioferritins may be common in bacteria and that the elucidation of their respective roles would be of general relevance. In this study, the relative roles of FtnA and Bfr in E. coli have been investigated by inactivating the corresponding genes, singly and in combination. The results indicate that FtnA is involved in the storage of iron during stationary phase and in subsequently enhancing growth under iron starvation conditions. The role of Bfr remains uncertain. Neither FtnA nor Bfr would appear to have an iron detoxification function in fur+ backgrounds.
MATERIALS AND METHODS
Bacterial strains, plasmids, bacteriophages, and growth conditions.
The genotypes and sources of E. coli K-12 strains and plasmids are listed in Table 1. The source plasmids used for insertionally inactivating the ftnA and bfr genes were pUC18A2 (34) and pGS280 (2). M13mp18 and M13mp19 were used for subcloning, preparing templates for site-directed deletion mutagenesis, and DNA sequencing. Transduction with P1_kc_ was performed by the method of Miller (40). Bacteriophage and plasmid DNA were isolated and manipulated by the method of Sambrook et al. (50). Restriction endonucleases and DNA-modifying enzymes were from Northumbria Biologicals Ltd. or Promega.
TABLE 1.
Strains of E. coli K-12 and plasmids used in this study
| Strain or plasmid | Genotype | Source or reference |
|---|---|---|
| Strains | ||
| H1673 | W3110 fur-31 zbf::Tn_10_ | Klaus Hantke, Tübingen |
| H1941 | MC4100 Δ_fur_ | Klaus Hantke, Tübingen |
| JM101 | Δ(lac-proAB) thi supE F′[traD36 proAB+_lacI_q_lacZ_ΔM15] | 39 |
| JRG2712 | MC4100 ftnA::spc | This work |
| JRG2157 | JM101 bfr::kan, F− | This work |
| JRG2844 | MC4100 ftnA::spc | This work |
| JRG2846 | MC4100 bfr::kan | This work |
| JRG2847 | JRG2846 ftnA::spc | This work |
| JRG2951 | W3110 bfr::kan | This work |
| JRG2952 | W3110 ftnA::spc | This work |
| JRG2953 | JRG2951 ftnA::spc | This work |
| JRG3236 | H1941 bfr::kan | This work |
| JRG3238 | JRG3236 ftnA::spc | This work |
| JRG3240 | H1941 ftnA::spc | This work |
| MC4100 | Δ_ara_, Δ(argF-lac) rpsL relA1 deoC1 ptsF25 | 52 |
| W3110 | Prototroph | |
| Plasmids | ||
| pGS280 | bfr amp | 2 |
| pGS327 | amp | This work |
| pGS357 | kan amp | This work |
| pGS358 | bfr::kan cml rep(Ts) | This work |
| pGS635 | spc amp | This work |
| pGS636 | ftnA::spc amp | This work |
| pGS637 | ftnA::spc cml rep(Ts) | This work |
| pMAK705 | rep(Ts) lacZ cml | 27 |
| pMTL24 | amp | 13 |
| pUC18A2 | ftnA amp | 34 |
| pUX-Ω | spc | 44 |
The medium used for routine subculture was Luria broth (L broth) or L agar supplemented with ampicillin (200 μg/ml), kanamycin (25 μg/ml), spectinomycin (25 μg/ml), or chloramphenicol (25 μg/ml) as required. For growth tests, bacteria were grown in 250-ml conical flasks containing 50 ml of medium with shaking at 250 rpm and 37°C in an Infors AG HT water bath. M9 minimal medium (50) was supplemented with 0.4% glucose or 40 mM succinate. The iron content of the minimal medium was lowered by passing 100 ml of 10-fold-concentrated M9 salts and 50-fold-concentrated glucose solutions through 50-ml Chelex-100 columns, and before use, all glassware was rinsed in concentrated HCl followed by Milli-Q water. Minimal medium was supplemented with iron in the form of iron citrate. A stock solution of iron citrate (iron-to-citrate ratio, 1:100) was made by dissolving ferrous sulfate (final concentration, 4 mM) in sodium citrate (final concentration, 400 mM) and adjusting the pH to 7 with NaOH. Sodium citrate was prepared in an identical way, but the ferrous sulfate was omitted. The iron concentration of L broth was reduced by extraction with 8-hydroxyquinoline by the method of Pugsley and Reeves (45). Anaerobic fermentative growth was performed in 15-ml optically matched glass tubes filled to the top with L broth plus 0.5% glucose, sealed with Subaseal caps, and incubated at 37°C in a water bath without shaking. Anaerobic respiratory conditions were identical, except that either 40 mM sodium fumarate or 40 mM sodium nitrate was added to the medium.
Site-directed deletion mutagenesis.
Site-directed mutagenesis of uracil-containing M13 template DNA was performed by the single-primer method (36). The target for mutagenesis was a single-stranded M13mp18 derivative containing the 4.9-kb _Eco_RI-_Hin_dIII bfr fragment from pGS280 (2). Single-stranded DNA was prepared (51) from BW313 with uridine (0.25 μg/ml) in the growth medium. The phosphorylated mutagenic oligonucleotide primer was annealed to the template before use in the primer extension ligation reaction and transfection into JM101 (ung+). Progeny phages were screened by single-channel tracking and nucleotide sequence analysis with the Klenow fragment of DNA polymerase by the method of Sanger et al. (51). The mutagenic primer S221 (CAACAAACTGTTGGGGATCCGCGAAGAAGG; coordinates 543 to 557 and 969 to 983) (2) was designed to direct the deletion of nucleotides 558 to 968 at the center of the cloned bfr gene, simultaneously creating a unique _Bam_HI restriction site (boldface type in the above sequence) at the point of deletion. The complete bfr sequence of a mutant (M13-_bfr_Δ1) was validated with specific primers; S123 (TCATGAATGCATTGATGA; 645 to 662), S276 (CGTAAGCCGTTCTACTC; 463 to 480), S277 (TTTCTGGAATGTCTTCCAA; 700 to 718), S271 (GGGAAATGCGCTTGTCGC; 555 to 572), and S275 (CAGGACCTGCAGAAACTGAAC; 724 to 744), and the corresponding 1.2-kb _Eco_RI-_Pst_I fragment of replicative-form M13-_bfr_Δ1 was cloned in pUC119, generating pGS327.
Gene replacement.
Two plasmids, pGS358 (bfr::kan) and pGS637 (ftnA::spc), containing disrupted bfr and ftnA genes, respectively (Fig. 1), were constructed for use in gene replacement (27). Plasmid pGS358 was made by cloning the _Bam_HI-treated 1.3-kb kan (kanamycin resistance) GenBlock fragment (Pharmacia) in pGS327 to produce pGS357. The 2.1-kb _Eco_RI-_Sph_I bfr::kan fragment of pGS357 was then cloned into the thermosensitive Cmr replicon, pMAK705, to give pGS358 (Fig. 1A). Similarly, pGS637 was generated by subcloning the 2-kb _Hin_dIII spc (spectinomycin resistance) cassette of pUX-Ω (44) into pMTL24 (13) to generate pGS635 and provide the spc cassette with flanking _Acc_I sites. The 0.3-kb _Asu_II-_Cla_I segment of pUC18A2 (34), containing most of the ftnA gene, was then replaced by the 2.0-kb _Acc_I spc cassette from pGS635 to give pGS636, and the 2.4-kb _Kpn_I-_Xba_I ftnA::spc fragment of pGS636 was cloned into the corresponding sites of pMAK705 (27) to give pGS637 (Fig. 1B). Cointegrants were isolated from pGS637 and pGS358 transformants of E. coli MC4100 and JM101, respectively, by selecting Spr Cmr or Kmr Cmr colonies at 42°C (nonpermissive temperature for plasmid replication). Resolution products were obtained by culturing pools of cointegrant colonies in L broth for three to six growth cycles (30 to 60 generations) at 30°C (the permissive temperature) and then screening colonies that were Spr or Kmr at 42°C for Cms phenotypes, consistent with chromosomal gene replacement and loss of plasmid. A total of 3 of 240 Spr colonies and 7 of 140 Kmr colonies had the desired Cms phenotype. From these, only one ftnA::spc derivative of MC4100 but six bfr::kan derivatives of JM101 were confirmed by Western blotting with FtnA- and Bfr-specific polyclonal antisera.
FIG. 1.

Restriction maps of the ftnA (A) and bfr (B) regions of the E. coli chromosome and derived plasmids. The locations and polarities of the ftnA (clockwise) and bfr (anticlockwise) genes are shown in the E. coli physical map (8). Lightly shaded bars represent chromosomal DNA; thin horizontal lines represent plasmid DNA; solid bars represent antibiotic resistance cassettes (kan, kanamycin; spc, spectinomycin), and open bars represent the ftnA or bfr gene. Relevant restriction sites are shown: Ac, _Acc_I; As, _Asu_II; B, _Bam_HI; Bg, _Bgl_I; C, _Cla_I; D, _Dra_I; H, _Hin_dIII; K, _Kpn_I; Ps, _Pst_I; Pv, _Pvu_I; Xb, _Xba_I; Xh, _Xho_II. Ac/C and As/Ac denote hybrid restriction sites no longer recognized by the corresponding restriction enzymes, and B* denotes an engineered _Bam_HI site flanking a site-directed internal deletion in the bfr gene.
Chromosomal DNA isolation and Southern blotting.
Representative strains, JRG2712 (MC4100 ftnA::spc) and JRG2157 (JM101 bfr::kan), were tested for disruption of the corresponding parental gene and acquisition of the resistance cassette by Southern blot analysis. The 760-bp _Hin_dIII-_Eco_RI fragment of pUC18A2 was used as an ftnA probe (Fig. 1A), the 0.36-kb _Dra_I-_Xho_II and 1.2-kb _Eco_RI-_Pst_I fragments of pGS280 were used as bfr probes (Fig. 1B), and the spc and kan cassettes served as probes for the corresponding resistance genes. The sizes of the fragments hybridizing with the ftnA, bfr, spc, and kan probes were very close to the predicted values. Those hybridizing with the ftnA probe in _Hin_dIII, _Eco_RI, _Bgl_I, _Kpn_I, _Pst_I, and _Pvu_II digests of MC4100 chromosomal DNA, in kilobases, were as follows for observed (predicted) values: 16.0 (17.5), 3.0 (3.3), 1.0 + 1.7 (1.0 + 1.8), 5.4 (5.8), 20.0 (20.0), and 5.0 (5.5). For JRG2712 (ftnA::spc), they were 5.6 + 6.7 (7.8 + 7.5), 4.6 (4.9), 1.0 + 1.5 (1.1 + 1.8), 7.2 (7.4), 10.7 + 5.8 (12.5 + 7.5), and 6.6 (7.2). Those hybridizing with the bfr probe in _Bam_HI and _Hin_dIII digests of JM101 DNA were 24 (25.1) and 11.2 (10.5) with the _Eco_RI-_Pst_I probe and 24.5 (25.1) and 11.5 (10.5) with the _Dra_I-_Xho_II probe. With JRG2157 (bfr::kan), the hybridizing fragments were 7.7 (8.0) and 7.0 (7.2) with the _Eco_RI-_Pst_I probe but, as expected, no hybridization was observed with the _Dra_I-_Xho_II probe. Hybridizations with the spc and kan probes further confirmed that the resistance cassettes had been inserted at the desired sites in the corresponding strains. Thus, the hybridization patterns of the mutants and parental strains (MC4100 and JM101) matched those predicted from the physical maps of the 42.9- and 74.6-min regions (Fig. 1), assuming that the desired replacements had been effected.
Southern blotting was performed by the method of Sambrook et al. (50) with restriction fragments of E. coli chromosomal DNA (37). Hybridization probes for detecting insertional inactivation of ftnA or bfr were prepared by random primed DNA polymerase I (Klenow)-dependent incorporation of digoxigenin-11–dUTP into freshly denatured single-stranded template DNA prepared from the ftnA gene (the 760-bp _Hin_dIII-_Eco_RI fragment of pUC18A2) and the spc cassette (the 2.0-kb _Hin_dIII fragment of pUX-Ω) and from the bfr gene (the 1.2-kb _Eco_RI-_Pst_I and the 0.36-kb _Dra_I-_Xho_II fragments of pGS28) and the kan cassette (the 1.3-kb _Eco_RI fragment of pGS328). The prehybridization, hybridization (68°C), and washing conditions were those of Sambrook et al. (50), and immunodetection was performed as specified by the manufacturer (Boehringer Mannheim Biochemicals). Molecular weight markers were prepared from _Hin_dIII and _Hin_dIII-_Eco_RI digests of λDNA labeled with digoxigenin-11–dUTP by T4 DNA polymerase-dependent replacement synthesis (50).
Mössbauer spectroscopy of whole cells.
57Fe Mössbauer absorption spectra of bacterial strains prepared by the method of Hudson et al. (33) were obtained with a constant-acceleration spectrometer, using a triangular velocity waveform. The spectrum at 20°C of metallic iron (National Bureau of Standards, 1971, iron foil Mössbauer Standard 1541) was used to calibrate the spectrometer, and spectra were stored in a 1,024-channel analyzer operating in the time mode. A 25-mCi 57CoRh Mössbauer source was used, and the center shifts quoted are relative to α-iron.
Other methods.
Sodium dodecyl sulfate (SDS)-polyacrylamide gel electrophoresis and Western blotting were performed as previously described (33). The iron contents of E. coli cells were assayed in triplicate by the method of Drysdale and Munro (17) with 1% ferrozine instead of 2,2′-bipyridine. An atomic absorption spectrometer (Perkin-Elmer M2100) was also used to assay the iron contents of growth media (directly) and bacteria (after extraction with 30% nitric acid at 80°C for 6 h). These two methods gave very similar results.
RESULTS
Inactivation of the chromosomal ftnA and bfr genes.
The plasmid-contained ftnA and bfr genes were inactivated by replacing central segments of their coding regions with spc and kan cassettes, respectively (see Materials and Methods) (Fig. 1). The disrupted genes were then subcloned into the thermosensitive replicon, pMAK705, generating plasmids pGS358 and pGS637, which were used to replace the chromosomal genes with the disrupted genes by homologous recombination (see Materials and Methods) (Fig. 1). Potential ftnA and bfr mutants were selected by virtue of their Spr Cms and Knr Cms phenotypes and were screened for the absence of FtnA or Bfr protein by Western blot analysis (results not shown). In this way, one FtnA− mutant and six Bfr− mutants were obtained. The FtnA− mutant, JRG2712 (MC4100 ftnA::spc), and one Bfr− mutant, JRG2157 (JM101 bfr::kan), were confirmed by Southern blot analysis (see Materials and Methods). The two confirmed mutant strains served as donors for transferring the disrupted genes to W3110 (wild type) by single and sequential phage P1-mediated transductions to produce both single and double mutants: JRG2951 (bfr::kan), JRG2952 (ftnA::spc), and JRG2953 (ftnA::spc bfr::kan) (Table 1). Inactivation of the ftnA and bfr genes in the W3110 derivatives was confirmed by Western blotting (Fig. 2).
FIG. 2.

Western blots confirming the absence of FtnA and Bfr in the corresponding E. coli mutants. Bacteria were grown aerobically to stationary phase in L broth before being harvested. Whole-cell E. coli proteins (approximately 50 μg per lane) were electrophoresed in SDS-containing 15% polyacrylamide gels, electroblotted, and immunostained with anti-FtnA (A) or anti-Bfr (B) polyclonal serum. Lanes: 1, W3110 (wild type); 2, JRG2951 (bfr::kan); 3, JRG2952 (ftnA::spc); 4, JRG2953 (ftnA::spc bfr::kan). The positions of the immunoreactive polypeptides corresponding to FtnA and Bfr are indicated.
Growth characteristics and morphology.
Phase-contrast microscopy revealed no differences in either the shape or size of the mutants compared to the wild type. The growth rates and growth yields of the mutant and parental strains were identical for batch cultures grown aerobically in L broth and M9 salts medium (with 8 μM iron and either glucose or succinate as the carbon source) and also for cultures grown under anaerobic fermentative and respiratory conditions (results not shown). To determine whether high concentrations of iron might be toxic for the iron storage mutants, the wild type and mutants were grown in glucose (0.4%) minimal medium supplemented with 1 mM iron citrate (throughout the work described here, the iron-to-citrate ratio was 1:100). However, all strains grew identically, indicating that the mutants and wild type are equally tolerant to high concentrations of iron (results not shown).
Whole-cell iron contents.
Any effects that the mutations might have on the iron storage capacity of E. coli were investigated by measuring the iron contents of the wild-type and mutant strains grown aerobically in L broth (17 μM iron). The iron contents of all four strains (∼0.014% [dry weight]) were similar in mid-logarithmic phase (Fig. 3A), but the iron contents of the ftnA+ strains, W3110 and JRG2951 (bfr), were twofold higher (∼0.027%) in the stationary phase than in the log phase whereas those of the ftnA mutants, JRG2952 (ftnA) and JRG2953 (ftnA bfr), were approximately the same (0.013%) in the stationary phase as in the log phase (Fig. 3A). This indicates that E. coli doubles its iron content during the transition from exponential to stationary phase in rich medium and that FtnA is responsible for this postexponential accumulation of iron, amounting to ∼50% of stationary-phase cellular iron. Lack of Bfr seems not to affect the iron content of E. coli, even when FtnA is also absent, suggesting that Bfr plays no significant role in iron storage. The cellular iron contents reported above are consistent with results of previous studies showing that after growth under iron-sufficient conditions, the iron content of stationary-phase E. coli is typically ∼0.02% of the dry weight (31, 33, 49). Western blot and lacZ fusion studies have shown that ftnA and bfr are highly expressed in the postexponential phase of growth under iron-rich conditions (9, 24). Therefore, the failure of the bfr mutation to affect cellular iron content is not due to weak bfr expression.
FIG. 3.

Iron contents of wild-type and mutant strains of E. coli after aerobic growth. The iron contents (percentage of dry weight) are for E. coli in logarithmic phase (_A_650 = 0.3 to 0.6: open bars in panels A to C) or stationary phase (_A_650 = 1.5 to 3.0: solid bars in panels A to C and E; open and solid bars in panel D). Error bars denote standard deviations. The growth media were L broth (17 μM iron) (A), 8-hydroxyquinoline-extracted L broth (3 μM iron) (B), glucose (0.4%) M9-salts medium (1.8 μM iron) supplemented with either 400 μM sodium citrate (cit) or increasing concentrations of iron citrate (0 to 128 μM) (C), glucose (0.4%) M9-salts medium (1.8 μM iron) with no added iron (open bars) or with 16 μM added iron citrate (solid bars) (D), and L broth (17 μM iron) (E).
The influence of iron availability on the iron contents of wild-type and mutant strains was examined by lowering the iron concentration in the growth medium from 17 to 3 μM by extraction with 8-hydroxyquinoline. Although growth was not affected (data not shown), the cellular iron contents were lowered 1.5- to 3.4-fold to almost the same levels in both logarithmic- and stationary-phase cultures (Fig. 3B). This shows that the cellular iron content depends on iron availability and suggests that the ftnA+ strains accumulate more iron than ftnA mutants only when the iron concentration in the medium is high enough to permit the deposition of intracellular iron stores.
The effects of iron availability on growth yield and bacterial iron content were further investigated by measuring aerobic growth in 0.4% glucose M9-salts medium containing up to 128 μM iron citrate. The growth yields for all four strains (data not shown) were increased ∼twofold by the addition of ≥2 μM iron citrate, and since no increase was observed with 400 μM sodium citrate, this indicates that the iron concentration (1.8 μM) of glucose M9-salts medium is growth limiting. The stationary-phase iron contents (0.002 to 0.02% of dry weight) were directly related to the concentration of added iron citrate up to 8 μM but were not increased further by raising the concentration to 16 μM or higher (Fig. 3C). In the logarithmic phase, cellular iron contents reached a maximum (0.015% of dry weight) with only 2 μM iron citrate (Fig. 3C). This is presumably because 2 μM iron citrate is sufficient to support high cellular iron contents at the low cell densities achieved in the logarithmic phase but not at the higher cell densities achieved in the stationary phase. Adding sodium citrate (400 μM) had no effect on the cellular iron content. These results confirm that the cellular iron content depends on the iron concentration of the medium, as previously suggested by Hartmann and Braun (31). The results also indicate that cellular iron uptake is tightly regulated, presumably to ensure that E. coli does not sequester excessive quantities of iron. The cellular iron content was lower after growth in minimal medium than in L broth (0.020 and 0.027%, respectively). The reason for this is not known, but it may reflect metabolic and/or gene expression differences in rich and minimal media.
As shown in Fig. 3D, the stationary-phase iron contents of the ftnA mutants (0.012%) were lower than those of the ftnA+ strains (0.018%) after growth in glucose M9-salts medium supplemented with 16 μM iron citrate. These observations resemble those made with L-broth cultures (Fig. 3A). The effects were likewise dependent on the iron concentration of the medium, because in iron-deficient (1.8 μM iron) M9-salts medium the cellular iron contents (∼0.002%) were six- to ninefold lower than in the iron-supplemented medium (Fig. 3D), and the differences between the ftnA+ and ftnA strains were abolished, as observed in Fig. 3B with iron-depleted L-broth cultures. This confirms that the iron storage defect of ftnA mutants is apparent only when the iron concentration of the medium is sufficient to provide opportunities for iron storage, i.e., ≥8 μM.
The whole-cell iron contents of stationary-phase cultures grown in L broth (17 μM iron) plus glucose under fermentative conditions or after anaerobic growth with nitrate or fumarate as the electron acceptor did not reveal any major differences between the wild-type and mutant strains (results not shown). Thus, it appears that neither FtnA nor Bfr is involved in the accumulation of significant quantities of cellular iron during fermentative or anaerobic respiratory growth.
Whole-cell Mössbauer spectroscopy.
Although the ftnA mutants are clearly iron deficient in the stationary phase, the nature of the “missing iron” was not revealed. Therefore, the forms of cellular iron present in the mutant and parental strains were examined by Mössbauer spectroscopy. The strains were grown to stationary phase (∼18 h) in glucose (0.4%) M9-salts medium containing 8 μM 57Fe citrate. The cells were washed, cooled rapidly to −196°C, and analyzed by Mössbauer spectroscopy at 60 K (Fig. 4A). By using a computerized least-squares approach, good fits to the data were achieved with three quadrupole doublet components: species A, corresponding to high-spin hexacoordinate Fe(III) components; and species B and C, representing discrete Fe(II) high-spin hexacoordinate components, as observed previously (33). The relative iron contents of the four strains estimated by Mössbauer spectroscopy reflect the chemically defined iron contents (Table 2) and confirm that the ftnA mutants have ∼50% less iron than do ftnA+ strains in stationary phase. The data also indicate that the lower iron contents of the ftnA mutants are due to a 2.0- to 2.5-fold reduction in the amounts of ferric iron (component A), the amounts of total ferrous iron being approximately the same in all four strains (Table 2 and Fig. 4A). The ferric species exhibited a higher quadrupole splitting in the ftnA mutants (0.97 mm/s). This probably reflects the presence of smaller iron clusters, which in turn may be related to the lack of FtnA and ferric iron deficiency.
FIG. 4.

Mössbauer spectra of E. coli. Wild-type and mutant E. coli were grown in minimal medium containing 0.4% glucose and 8 μM 57Fe citrate. Fits are superimposed on the experimental data. (A) Mössbauer spectra recorded at 60 K. Component A represents ferric iron, whereas B and C correspond to ferrous iron. (B) Mössbauer spectra recorded at 1.7 K. Component A′ represents nonmagnetic ferric iron, component B′ represents total ferrous iron, and component M (shaded) corresponds to magnetic ferric iron cores. The parameters for components A, A′, B, B′, C, and M are listed in Tables 2 and 3. (C) Mössbauer spectra recorded at 267 K.
TABLE 2.
Mössbauer parameters derived from the spectra shown in Fig. 4Aa
| Strain | Spectral parameter for: | Iron contentb (%) | K | Iron contentc (% of dry wt) | Fe(II) (% of dry wt) | Fe(III) (% of dry wt) | |||||||||||
|---|---|---|---|---|---|---|---|---|---|---|---|---|---|---|---|---|---|
| Component A, Fe(III) | Component B, Fe(II) | Component C, Fe(II) | |||||||||||||||
| CS (mm/s) | QS (mm/s) | W (mm/s) | % | CS (mm/s) | QS (mm/s) | W (mm/s) | % | CS (mm/s) | QS (mm/s) | W (mm/s) | % | ||||||
| W3110 | 0.51 | 0.78 | 0.54 | 74 | 1.28 | 3.06 | 0.4 | 21 | 1.14 | 2.65 | 0.4 | 5 | 100 | 60 | 0.028 | 0.0073 | 0.021 |
| JRG2951 (bfr) | 0.51 | 0.78 | 0.54 | 73 | 1.28 | 3.06 | 0.4 | 21 | 1.14 | 2.65 | 0.4 | 6 | 98 | 60 | 0.024 | 0.0065 | 0.018 |
| JRG2952 (ftnA) | 0.48 | 0.97 | 0.54 | 56 | 1.28 | 3.06 | 0.4 | 28 | 1.14 | 2.65 | 0.4 | 16 | 58 | 60 | 0.015 | 0.0066 | 0.0084 |
| JRG2953 (ftnA bfr) | 0.48 | 0.97 | 0.54 | 55 | 1.28 | 3.06 | 0.4 | 35 | 1.14 | 2.65 | 0.4 | 10 | 55 | 60 | 0.016 | 0.0072 | 0.0088 |
Low-temperature Mössbauer spectra of the same samples were recorded at 1.7 K to investigate the presence of magnetically ordered iron clusters (Fig. 4B). The measured ratios of ferrous to ferric iron were higher at 1.7 K than at 60 K due to an increase in the recoiless fraction at the lower temperature resulting in an improved efficiency of ferrous iron detection. Three components were required to obtain satisfactory fits to the data: A′, representing nonmagnetic ferric iron; B′, representing total ferrous iron; and M, corresponding to magnetic ferric cores. The spectra clearly show that the magnetic component (M), which is present in the wild type and the bfr mutant, is absent from the ftnA and ftnA bfr mutants (Table 3 and Fig. 4B). Furthermore, because the ferrous-to-ferric iron ratios of the non-magnetically ordered iron are approximately the same in all four strains, the lower levels of iron in the ftnA mutants are due to lack of magnetically ordered ferric iron clusters, likely to correspond to ferritin iron cores.
TABLE 3.
Mössbauer parameters derived from the spectra shown in Fig. 4Ba
| Strain | Spectral parameter for: | K | |||||||||||
|---|---|---|---|---|---|---|---|---|---|---|---|---|---|
| Component A′, Fe(III) | Component B′, Fe(II) | Component M, magnetic | |||||||||||
| CS (mm/s) | QS (mm/s) | W (mm/s) | % | CS (mm/s) | QS (mm/s) | W (mm/s) | % | CS (mm/s) | W (mm/s) | Field (Tesla) | % | ||
| W3110 | 0.43 | 1.19 | 0.53 | 22 | 1.30 | 2.94 | 0.70 | 42 | 0.80 | 2.3 | 43.6 | 36 | 1.7 |
| JRG2951 (bfr) | 0.42 | 1.21 | 0.52 | 26 | 1.32 | 2.94 | 0.66 | 43 | 0.83 | 1.8 | 42.2 | 31 | 1.7 |
| JRG2952 (ftnA) | 0.42 | 1.20 | 0.50 | 40 | 1.30 | 2.87 | 0.70 | 60 | 1.7 | ||||
| JRG2953 (ftnA bfr) | 0.45 | 1.20 | 0.51 | 40 | 1.31 | 2.86 | 0.69 | 60 | 1.7 |
High-temperature (267 K) whole-cell Mössbauer spectra revealed an absorbing “recoilless fraction” species present in ftnA+ strains but absent from the ftnA mutants (Fig. 4C). The recoilless fraction is likely to correspond to ferric iron clusters within FtnA molecules. The Mössbauer studies therefore support the view that the lower iron contents of ftnA mutants are due to the absence of FtnA iron cores.
Growth in the presence of iron chelators.
The wild-type and mutant strains grew identically in iron-sufficient M9-salts medium (data not shown). However, in iron-deficient M9-salts medium (1.8 μM iron), growth of the ftnA and bfr ftnA mutants was slightly impaired (∼5%) relative to that of W3110 and the bfr mutant (Fig. 5A). Addition of the iron chelator diethylenetriaminepentaacetic acid (DTPA; 5 μM) impaired the growth of all strains, but, significantly, this effect was far greater for the ftnA and bfr ftnA mutants, which gave ∼threefold lower growth yields relative to those obtained for the ftnA+ strains (Fig. 6A). The growth-inhibitory effects of DTPA were reversed by adding equimolar or greater amounts of iron citrate to the DTPA-containing medium (M9-DTPA), and the growth differences between the ftnA+ and ftnA strains were abolished (Fig. 6B). The addition of sodium citrate had no effect (results not shown). These results strongly suggest that the DTPA-mediated growth inhibition is due to iron chelation and therefore that the ftnA mutants are much more sensitive to iron starvation than are the ftnA+ strains. The ftnA mutation also resulted in increased sensitivity to other chelators: 2,2′-bipyridyl (200 μM), ferrozine (0.05 to 5 mM), desferroxamine (50 to 800 μM), EGTA (50 to 200 μM), EDTA (200 μM), _ortho_-phenanthroline (10 μM), and nitrilotriacetic acid (50 to 200 μM) (data not shown). The increased sensitivity of ftnA mutants to DTPA was also observed in other types of media: minimal-morpholinepropanesulfonic acid (MOPS) medium with and without amino acids (41), minimal medium E (58), and minimal medium containing other carbon sources (0.4% maltose, 0.4% mannose, 0.4% fructose, or 0.4% xylose). However, the enhanced DTPA sensitivity of ftnA mutants was not observed during anaerobic growth in M9-salts medium containing 0.4% glucose with and without 40 mM fumarate or 40 mM nitrate or during aerobic or anaerobic growth in L broth, nor was it apparent during aerobic growth with succinate, fumarate, malate, or acetate (all at 40 mM) as the sole carbon source. These observations may reflect greater iron availability under anaerobic conditions (due to the presence of ferrous iron), high concentrations of iron complexes in L broth, and the possibility that carboxylic acids serve as weak iron chelators in minimal medium. E. coli precultured in M9-DTPA did not subsequently grow when inoculated into fresh M9-DTPA unless iron citrate (5 μM) had been added. This indicates that growth in M9-DTPA exhausts the cellular iron reserves to such an extent that subsequent growth is possible only when supplementary iron is provided.
FIG. 5.

Effects of iron deficiency on the aerobic growth of E. coli wild type and iron storage mutants. The growth medium was 0.4% glucose M9-salts minimal medium (1.8 μM iron). Precultures were grown with 16 μM iron citrate (A) or 1.6 mM sodium citrate (B) and were washed with saline before inoculation at dilutions of 1/100. Error bars represent standard deviations of three cultures: ▵, W3110; ○, JRG2951 (bfr); ◊, JRG2952 (ftnA); □, JRG2953 (ftnA bfr).
FIG. 6.

Effects of the iron chelator DTPA on the aerobic growth of E. coli wild-type and iron-storage mutants. Details are as for Fig. 5A except where stated. (A) Effects of DTPA (5 μM). (B) Reversal of the effects of 5 μM DTPA by iron citrate. W3110 is indicated by solid symbols, and JRG2953 (ftnA bfr) is indicated by open symbols, with iron citrate concentrations as follows: ◊ and ⧫, 0.5 μM; ▵ and ▴, 1.5 μM; □ and ■, 5 μM; and ○ and ●, 16 μM. (C) Effect of low-iron preculture on subsequent growth in 5 μM DTPA: precultures were grown with 1.6 mM sodium citrate instead of 16 μM iron citrate, as in Fig. 5B. (D) Comparison of log-phase (open symbols) and stationary-phase (solid symbols) preculture on subsequent growth in 5 μM DTPA: ▴ and ▵, W3110; ■ and □, JRG2953 (ftnA bfr).
The possibility that the growth impairment of the ftnA mutants in M9-DTPA is due to the lack of iron stores in the inoculated bacteria was tested by preculturing the ftnA+ and ftnA strains in iron-rich (16 μM iron citrate) and iron-poor (no additions) M9-salts medium. The use of iron-deficient inocula (0.002% iron, compared with 0.012 or 0.018% for iron-rich inocula) dramatically reduced subsequent growth in M9-DTPA to equivalently low levels for both the ftnA+ and ftnA strains (Fig. 6C). A similar but less dramatic effect was seen in the absence of DTPA (Fig. 5B). Therefore, the high iron contents of iron-rich inocula enhance subsequent growth under iron deficiency and iron-deficient growth is further improved by iron stores predeposited in FtnA. This indicates that the increased growth of the ftnA+ strains during iron deprivation is a direct consequence of their FtnA-associated iron stores.
Because iron stores appear to be deposited postexponentially (Fig. 3A and D), it was anticipated that FtnA would confer an iron-deficient-growth advantage upon cultures inoculated with stationary-phase bacteria but not on those inoculated with logarithmic-phase bacteria. To test this prediction, the growth of M9-DTPA cultures was monitored after inoculation with precultures grown to log and stationary phase in iron-rich M9-salts medium (Fig. 6D). The growth differences between the wild-type and bfr ftnA strains were much greater with stationary-phase inocula (∼3-fold) than with log-phase inocula (∼1.3-fold). This further supports the conclusion that FtnA accumulates iron stores mainly in the stationary phase rather than in the log phase.
Iron storage and ferric uptake regulation mutants.
The Fur protein, encoded by fur, is an iron-sensing, global transcription regulator of E. coli and many other proteobacteria. Fur uses ferrous iron as a corepressor in repressing the iron acquisition apparatus and other genes under iron-sufficient conditions (18). The combined effects of the fur mutation (leading to derepression of the iron transporters and other Fur-repressed genes) and the iron storage lesions were studied by transferring the ftnA and/or bfr mutations to a fur deletion strain (H1941) and to the corresponding fur+ strain (MC4100) by P1-mediated transduction. The resulting isogenic strains were grown to stationary phase in L broth, together with W3110, H1673 (W3110 fur), and JRG2953 (W3110 bfr ftnA), and their iron contents were measured (Fig. 3E). The growth of the fur mutants was impaired relative to that of the fur+ strains but was not further impaired by the bfr and/or ftnA mutations (results not shown). The iron content of MC4100 (0.022%) was somewhat lower than that of W3110 (0.027%). The reason for this is unknown. The ftnA mutation lowered the stationary-phase iron content of MC4100 to nearly half (Fig. 3E), which is consistent with the effect of the ftnA mutation on W3110 (Fig. 3A). Surprisingly, the fur mutation lowered the cellular iron content (0.008 to 0.009%) to a greater extent than did the ftnA mutation, and the iron content was not lowered any further by combining the ftnA and/or bfr mutations with the fur mutation (Fig. 3E). It is likely that the low iron contents of the fur mutants are partly due to reduced ftnA expression (Fig. 7). Mössbauer spectroscopic analysis of 57Fe-labeled cells grown in L broth (plus 40 μM 57Fe citrate) confirmed that the fur mutants are iron deficient and revealed that ferric and ferrous iron contents are equally lowered (results not shown). In M9-DTPA, MC4100 and its bfr derivative had higher growth rates and reached a higher optical density (_A_650 = 0.25 at 8 h) than did the corresponding ftnA and ftnA bfr derivatives (_A_650 = 0.19 at 8 h) in M9-DTPA. However, when combined with the fur deletion of H1941, growth in the presence of DTPA, although poorer than that of MC4100, was not further impaired by the iron storage defects (results not shown).
FIG. 7.
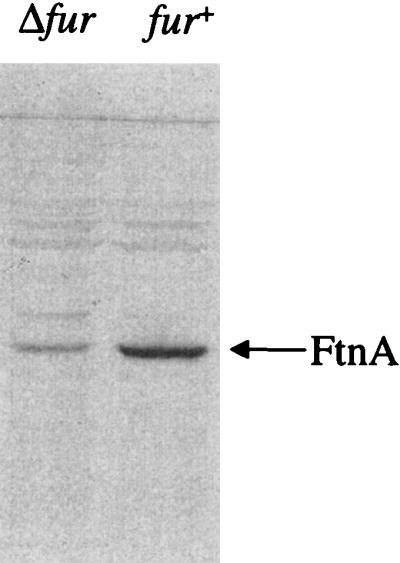
Western blot analysis of FtnA in MC4100 (fur+) and H1941 (Δ_fur_). Strains were grown aerobically to stationary phase in L broth before being harvested. Whole-cell E. coli proteins (approximately 50 μg per lane) were electrophoresed in SDS-containing 15% polyacrylamide gels, electroblotted, and immunostained with anti-FtnA polyclonal serum.
Growth under stress conditions.
Since intracellular iron is thought to contribute to redox stress, it is conceivable that iron storage mutants might exhibit an enhanced sensitivity to redox stress due to an increase in free intracellular iron arising from the storage deficiency. To test whether the intracellular iron content affects sensitivity to oxidative stress, L broth ± 250 μM H2O2 was inoculated with bacteria having low and high iron contents (Fig. 8A). The presence of H2O2 extended the lag phase by up to 3 h with inocula having high iron contents (0.018%) compared to only 1 h with inocula having low iron contents (0.002%). This shows that E. coli is less sensitive to H2O2 toxicity when the intracellular iron content is low, and it is consistent with a previous study showing that the amount of H2O2 required to kill Staphylococcus aureus increases 1,000-fold when the bacteria are precultured in iron-poor medium (48). It is not known whether the high intracellular iron content is directly responsible for the enhanced H2O2 toxicity or whether it is due to some physiological or regulatory consequence of high cellular iron concentrations. In marked contrast, studies on the effects of extracellular iron on H2O2 toxicity in media containing either high (16 μM iron citrate) or low (1.8 μM) iron concentrations but identical citrate concentrations showed that the H2O2 toxicity was lower when the extracellular iron concentration was high (Fig. 8B). The protection afforded by iron citrate is probably due to direct extracellular decomposition of H2O2 by iron citrate (26, 61).
FIG. 8.

Effects of intracellular and extracellular iron on hydrogen peroxide toxicity. (A) Washed suspensions of W3110 grown to stationary phase in 0.4% glucose M9-salts medium with 1.6 mM sodium citrate or 16 μM iron citrate, to produce inocula with low (0.002%) or high (0.018%) intracellular iron contents, respectively, were diluted 100-fold in L broth containing 250 μM H2O2 (solid lines) or no H2O2 (broken lines): low-iron inocula (□); high-iron inocula (▴). (B) Low-iron inocula (as above) of W3110 were diluted 100-fold in fresh sodium citrate-containing glucose M9-salts medium with 50 μM H2O2 (solid lines) or no H2O2 (broken lines) and 16 μM iron citrate (▴) or no iron citrate (□).
The above studies suggest that intracellular iron enhances redox stress sensitivity, indicating that factors, such as iron storage proteins, that influence cellular iron could affect susceptibility to oxidative stress. Growth of the iron storage mutants (JRG2951 to JRG2953) in L broth containing hydroperoxides (H2O2 at 1 to 8 mM, _tert_-butyl hydroperoxide at 0.25 to 2 mM, or cumen hydroperoxide at 2.5 to 40 μM), superoxide generators (paraquat at 1 to 2.5 mM, menadione at 0.25 to 1.5 mM, or plumbagin at 0.025 to 0.15 mM), or NO-generating agents (_S_-nitrosoglutathione at 0.01 to 1.5 mM or sodium nitroprusside at 0.5 to 5 mM) revealed that the mutants are as sensitive to redox stress as is the parental strain, W3110 (results not shown). Sensitivity to H2O2 was also studied by measuring the decline in viability after exposing log- and stationary-phase cultures to various concentrations of H2O2 (0.25 to 16 mM). Again, no significant differences between the iron storage mutants and wild type were detected (data not shown). Similarly, no differences in H2O2 resistance were observed in filter disc diffusion assays in which zones of growth inhibition around H2O2-soaked (2 to 10 μmol) filter discs were measured on L-agar plates seeded with 5 × 10⁷ bacteria. However, growth studies did show that a fur mutant (H1941) was more sensitive to the NO and superoxide generators, although this sensitivity was not further enhanced by ftnA and/or bfr mutations (results not shown). Thus, it appears that Fur plays a role in protection against O2− and NO, presumably through the iron-dependent regulation of either cellular iron or redox protective factors (e.g., superoxide dismutase). Significantly, when the fur mutation was combined with the ftnA and/or bfr mutations, the resulting strains were more sensitive to hydroperoxides (Fig. 9). This increased sensitivity was exhibited after 2 to 3 h of growth, suggesting that the toxic effect takes several hours to be expressed (as seen for paraquat [40a]) and that it may be growth phase dependent. In contrast, the combination of the fur and iron storage mutations did not further increase the sensitivity to NO or O2− generators (results not shown). Thus, when Fur is absent, FtnA and Bfr seem to contribute to protection against hydroperoxides, presumably by sequestration of the increased quantities of “redox-active iron” that arise in fur mutants (35). This finding is consistent with the ability of overproduced FtnA to counteract the increased toxicity of intracellular iron in fur mutants (56).
FIG. 9.

Effects of hydroperoxides on the growth of ferric uptake regulation and iron storage mutants. Stationary-phase inocula grown in L broth were diluted 20-fold into microtiter plates containing 200 μl of L broth with 5 mM H2O2 (A), 2 mM _tert_-butyl hydroperoxide (B), 30 μM cumen hydroperoxide (C), or no additions (D). Aerobic growth at 37°C and 400 rpm was monitored with an iEMS microtiter plate reader. Strains: ▴, H1941 (fur); ●, JRG3236 (fur bfr); ◊, JRG3238 (fur ftnA); and □, JRG3240 (fur ftnA bfr).
DISCUSSION
The physiological roles of the E. coli iron storage proteins, FtnA and Bfr, were investigated by insertionally inactivating the chromosomal ftnA and bfr genes and generating isogenic sets of ftnA, bfr, and ftnA bfr mutants. The iron contents of the ftnA and ftnA bfr strains grown to stationary phase in rich media were half those of the wild-type and bfr strains. However, no such difference was observed in log-phase cells or in E. coli grown in media with low iron concentrations. Whole-cell Mössbauer spectroscopy revealed that the low stationary-phase iron contents of the ftnA and ftnA bfr strains are due to a 2- to 2.5-fold reduction in the amounts of cellular ferric iron. Subsequently, low- and high-temperature studies showed that the lower ferric iron contents of ftnA mutants correlate with a deficiency in magnetically ordered iron clusters. These results show that FtnA is responsible for the postexponential accumulation and storage of up to 50% of the cellular iron during iron sufficient growth. This correlates with the ∼10-fold induction of ftnA expression in the postexponential growth phase under iron-rich conditions (9). In contrast, Bfr would seem to be uninvolved in, or dispensable for, iron accumulation and storage. This is supported by the finding that less than 1% of total cellular iron can be attributed to Bfr (7).
The ftnA and ftnA bfr mutants exhibited a major growth defect when cultured in iron-deficient minimal medium, but only when the mutant and parental strains had been precultured to stationary phase in iron-rich medium, giving precultures the opportunity to deposit iron stores. It would thus appear that iron stored in FtnA during iron sufficiency can subsequently be used to enhance iron-limited growth. FtnA therefore fulfils the classical role assigned to ferritins, as an iron-storing protein that releases iron upon demand. This capacity should be important in E. coli and other bacteria that occupy environments where iron availability is variable, because FtnA facilitates growth under iron-limited conditions and would thus be expected to confer a selective advantage.
The iron content of wild-type E. coli grown to stationary phase in L broth was 0.027% of dry weight. Under iron-limiting conditions, the iron content was up to 14-fold lower (∼0.002% of dry weight), indicating that E. coli considerably lowers its need for cellular iron during iron-deficient growth. The total iron content (as a percentage of dry weight) of W3110, grown to stationary phase in rich broth, can be allocated as follows: iron stored in FtnA (∼0.013%); iron associated with Fur-regulated factors, excluding FtnA (∼0.006%); “residual iron” (∼0.006%) (the difference between the iron contents of fur mutants [∼0.008%] and iron-starved E. coli [∼0.002%]); and “essential iron” (∼0.002%). The essential iron is likely to reside in highly important proteins such as ribonucleotide reductase, tricarboxylic acid cycle enzymes such as aconitase, and respiratory-chain components. The residual iron at least partly corresponds to the redox-active iron that is enhanced in fur mutants (35).
The damage inflicted during redox stress depends to a large extent on the collaboration of intracellular iron (38, 48), as confirmed here by the dependence of H2O2 toxicity on the intracellular iron content. Iron chelators such as dipyridyl and desferrioxamine can protect cells from oxidants (22), and this implies that the sequestration of endogenous iron is a vital antioxidant strategy. Furthermore, previous studies have suggested that the iron-sequestering function of iron storage proteins is important for limiting the prooxidant hazard posed by iron (14, 56, 59). It was therefore surprising to find that sensitivity to NO, O2−, and H2O2 is not increased by a lack of FtnA and/or Bfr. However, this is consistent with previous work with ftnA and bfr mutants showing that neither FtnA nor and Bfr influences the quantity of redox-active iron in E. coli or sensitivity to H2O2 (35). It is also consistent with the finding that levels of ferrous iron are not significantly influenced by the iron storage defects (Tables 2 and 3). Apparently FtnA and Bfr do not protect against the redox stress-inducing effects of iron in vivo in fur+ backgrounds, nor do the lower iron contents of ftnA mutants affect resistance to redox stress. The latter observation implies that iron present in the iron cores of FtnA does not contribute to oxidative stress, supporting previous reports that the iron core provides a “safe” means of handling iron (6, 11, 14). However, in a fur background, ftnA and bfr mutations increase sensitivity to hydroperoxides but not to superoxide (or NO). Hydroperoxides elicit iron-dependent cytotoxicity through the Fenton reaction, in which ferrous iron is oxidized and the highly reactive hydroxyl radical is generated (H2O2 + Fe2+ → OH + OH− + Fe3+). In contrast, the iron-dependent toxicity of superoxide is mediated by reduction of ferric to ferrous iron (O2− + Fe3+ → O2 + Fe2+). The resulting ferrous iron may then participate in the Fenton reaction. Thus, the enhanced sensitivity to hydroperoxides is probably due to the presence of increased levels of “reactive” ferrous iron in the strains lacking both Fur and iron storage proteins. Therefore, in the absence of Fur, the FtnA and Bfr proteins apparently lower the levels of reactive ferrous iron. This is consistent with the ferrous iron-oxidizing activity of FtnA and Bfr.
As observed with the E. coli ftnA mutant, the growth of the ferritin mutant (cft) of Campylobacter jejuni was impaired by the presence of an iron chelator, but in marked contrast to the ftnA mutant of E. coli, the C. jejuni cft mutant exhibited an enhanced sensitivity to redox stress (59). The reason for this difference is unknown, but it could be related to the microaerophilicity of C. jejuni, differences in the levels of reactive intracellular ferrous iron, the presence of the ftnB gene in E. coli, or differences in the functional properties of the corresponding ferritins (they are only 46% identical in amino acid sequence). Whether the cft mutation lowers the iron content of C. jejuni was not reported, although this would be expected.
Previous studies have shown that the enhanced sensitivity of fur mutants to redox stress can be reversed by multiple copies of ftnA (but not bfr), by iron chelators, or by inactivation of the iron transport apparatus (56). This strongly suggests that the redox sensitivity of fur mutants is due to an increase in redox-active (i.e., free or labile) iron. However, this seems to be contradicted by the present studies showing that the iron contents of fur mutants are 2.5-fold lower than those of fur+ strains. Nevertheless, because fur mutants have low levels of iron storage proteins (9, 24) and other iron-containing proteins such as fumarases A and B, aconitase A, and superoxide dismutase B (25, 42, 43, 57), as well as having a high capacity for iron transport, it is possible that the amount of redox-active iron is higher in fur mutants (despite their low overall contents of cellular iron), as indicated by Keyer and Imlay (35).
The weakly bound ferrous species (component B) revealed by Mössbauer spectroscopy may represent a discrete iron pool, such as free cellular iron or the redox-active iron implicated in enhancing redox stress. The concentration of the weakly bound ferrous species in the cytosol can be estimated as ∼200 μM from the distribution of iron in different components (Tables 2 and 3). However, this value is 20-fold higher than previous estimates of redox-active or free iron in E. coli, based on electron paramagnetic resonance analysis of desferrioxamine-bound iron (35) or on the binding affinity (∼10 μM) of Fur for iron (5), although it is similar to the value (300 to 500 μM) determined by assaying the total-acid-soluble nonheme iron (35). Moreover, the amounts of weakly bound ferrous iron were 2.5-fold lower in fur mutants, yet such strains are reported to contain increased quantities of redox-active iron (35). Therefore, it is unlikely that the weakly bound ferrous species corresponds to the redox-active iron observed by Keyer and Imlay (35), and so it presumably represents another, more abundant cellular iron pool.
The 2.5-fold-lower iron content of the fur mutants is surprising in view of the enhanced rates of iron transport reported for fur mutants (28) and highlights a novel role for Fur in regulating cellular demand for iron. Several genes expressing iron-containing proteins, e.g., fumarases (FumA and FumB), aconitase A, and superoxide dismutase (SodB), are known to be repressed under iron-deficient conditions (25, 42, 43, 57) in a Fur-dependent manner, and the abundances of at least nine unidentified proteins are reduced in a fur mutant of Salmonella typhimurium (20). This suggests that the low iron contents of fur mutants may be due to weak expression of iron-requiring proteins (Fig. 10). It would therefore appear that E. coli compensates for iron starvation in two ways (Fig. 10): by inducing iron transport systems, and by reducing the cellular demand for iron, which in turn can be achieved by repressing iron-requiring systems and derepressing alternative systems, such as replacing SodB by the Mn-containing SodA and FumA by the iron-free FumC and possibly by replacing ferredoxin by flavodoxin as observed for cyanobacteria (19, 42, 43, 47).
FIG. 10.

Schematic representation of iron metabolism in E. coli under iron-sufficient and -deficient conditions. The regulatory role of Fur is indicated by the thin arrows and by the +ve (activation) and −ve (repression) signs. Iron flux is indicated by the thick arrows. The abundances of ferritin, Fur, intracellular Fe(II), and iron-containing proteins are indicated schematically. Three intracellular sources of iron are shown: free iron, FtnA iron, and iron released from intracellular iron proteins.
The studies reported here establish that the physiological function of FtnA in E. coli is to store iron under postexponential iron-sufficient conditions in order to provide a source of iron for subsequent use under iron-limited conditions. This probably reflects the general role of ferritins in other bacteria as well as in more complex organisms, including plants and animals. The other characterized iron storage protein of E. coli, Bfr, appears to have no important role in these processes, and its function remains obscure. The role of FtnB is being investigated. It has an unusual complement of amino acid residues at the ferroxidase center that suggests that the protein does not function as a typical ferritin (1). Fur mutants were found to be iron deficient, and this reveals a new and important role for Fur in the conservation of cellular iron resources.
ACKNOWLEDGMENTS
This study was supported by a Wellcome Trust project grant (to J.R.G. and P.M.H.), a Nuffield Foundation Student Bursary (to A.R.T.), an Engineering and Physical Sciences Research Council project grant (to J.M.W., S.C.A., P.M.H., and J.R.G.), an Iranian Studentship (to H.A.T.), and an Advanced Fellowship (to S.C.A.) and Research Studentship (to A.J.H.) from the Biotechnology and Biological Sciences Research Council.
We thank K. Hantke for providing strains, J. A. Imlay and K. Keyer for communicating unpublished observations, A. W. Fairburn for atomic absorption analysis, and R. E. Roberts for technical assistance.
REFERENCES
- 1.Andrews S C. Iron storage in bacteria. Adv Microb Physiol. 1998;40:281–351. doi: 10.1016/s0065-2911(08)60134-4. [DOI] [PubMed] [Google Scholar]
- 2.Andrews S C, Harrison P M, Guest J R. Cloning, sequencing, and mapping of the bacterioferritin gene (bfr) of Escherichia coli K-12. J Bacteriol. 1989;171:3940–3947. doi: 10.1128/jb.171.7.3940-3947.1989. [DOI] [PMC free article] [PubMed] [Google Scholar]
- 3.Andrews S C, Le Brun N E, Barynin V, Thomson A J, Moore G R, Guest J R, Harrison P M. Site-directed replacement of the coaxial heme ligands of bacterioferritin generates heme-free variants. J Biol Chem. 1995;270:23268–23274. doi: 10.1074/jbc.270.40.23268. [DOI] [PubMed] [Google Scholar]
- 4.Andrews S C, Smith J M A, Hawkins C, Williams J M, Harrison P M, Guest J R. Overproduction, purification and characterization of the bacterioferritin of Escherichia coli and a C-terminally extended variant. Eur J Biochem. 1993;213:329–338. doi: 10.1111/j.1432-1033.1993.tb17766.x. [DOI] [PubMed] [Google Scholar]
- 5.Bagg A, Neilands J B. Ferric uptake regulation protein acts as a repressor, employing iron(II) as co-factor to bind the operator of an iron transport operon in Escherichia coli. Biochemistry. 1987;26:5471–5477. doi: 10.1021/bi00391a039. [DOI] [PubMed] [Google Scholar]
- 6.Balla G, Jacob H S, Balla J, Rosenberg M, Nath K, Apple F, Eaton J W, Vercellotti G M. Ferritin—a cytoprotective antioxidant strategem of endothelium. J Biol Chem. 1992;267:18148–18153. [PubMed] [Google Scholar]
- 7.Bauminger E R, Cohen S G, Dickson D P E, Levy A, Ofer S, Yariv J. Mössbauer spectroscopy of Escherichia coli and its iron-storage protein. Biochim Biophys Acta. 1980;163:237–242. doi: 10.1016/0005-2795(80)90252-4. [DOI] [PubMed] [Google Scholar]
- 8.Berlyn M B, Low K B, Rudd K E. Linkage map of Escherichia coli K-12, edition 9. In: Neidhardt F C, Curtiss III R, Ingraham J L, Lin E C C, Low K B, Magasarik B, Reznikoff W S, Riley M, Schaechter M, Umbarger H G, editors. Escherichia coli and Salmonella: cellular and molecular biology. 2nd ed. Washington, D.C: ASM Press; 1996. pp. 1715–1902. [Google Scholar]
- 9.Bishop R. Iron metabolism in Escherichia coli. M. Phil. thesis. Sheffield, United Kingdom: University of Sheffield; 1997. [Google Scholar]
- 10.Blattner F R, Plunkett G, Bloch C A, Perna N T, Burland V, Riley M, Collado Vides J, Glasner J D, Rode C K, Mayhew G F, Gregor J, Davis N W, Kirkpatrick H A, Goeden M A, Rose D J, Mau B, Shao Y. The complete genome sequence of Escherichia coli K-12. Science. 1997;277:1453–1462. doi: 10.1126/science.277.5331.1453. [DOI] [PubMed] [Google Scholar]
- 11.Bolann B J, Ulvik R J. On the limited ability of superoxide to release iron from ferritin. Eur J Biochem. 1990;193:899–904. doi: 10.1111/j.1432-1033.1990.tb19415.x. [DOI] [PubMed] [Google Scholar]
- 12.Carrano C J, Bohnke R, Matzanke B. The ferritin from mycelia of Absidia spinosa is a bacterioferritin. FEBS Lett. 1996;390:261–264. doi: 10.1016/0014-5793(96)00667-9. [DOI] [PubMed] [Google Scholar]
- 13.Chambers S P, Prior S E, Barstow D A, Minton N P. The MTL nic− cloning vectors. I. Improved pUC polylinker regions to facilitate the use of sonicated DNA for nucleotide sequencing. Gene. 1988;68:139–149. doi: 10.1016/0378-1119(88)90606-3. [DOI] [PubMed] [Google Scholar]
- 14.Cozzi A, Santambrogio P, Levi S, Arosio P. Iron detoxification activity of ferritin. Effects of H and L human apoferritins on lipid peroxidation in vitro. FEBS Lett. 1990;227:119–122. doi: 10.1016/0014-5793(90)80823-2. [DOI] [PubMed] [Google Scholar]
- 15.Deeb S S, Hager L P. Crystalline cytochrome b1 from Escherichia coli. J Biol Chem. 1964;239:1024–1031. [PubMed] [Google Scholar]
- 16.Denoel P A, Crawford R M, Zygmunt M S, Tibor A, Weynants V E, Godfroid F, Hoover D L, Letesson J-J. Survival of a bacterioferritin deletion mutant of Brucella melitensis 16M in human monocyte-derived macrophages. Infect Immun. 1997;65:4337–4340. doi: 10.1128/iai.65.10.4337-4340.1997. [DOI] [PMC free article] [PubMed] [Google Scholar]
- 17.Drysdale J W, Munro H N. Small-scale isolation of ferritin for the assay of the incorporation of 14C-labelled amino acids. J Bacteriol. 1965;95:851–857. doi: 10.1042/bj0950851. [DOI] [PMC free article] [PubMed] [Google Scholar]
- 18.Earhart C F. Uptake and metabolism of iron and molybdenum. In: Neidhardt F C, Curtiss III R, Ingraham J L, Lin E C C, Low K B, Magasarik B, Reznikoff W S, Riley M, Schaechter M, Umbarger H E, editors. Escherichia coli and Salmonella: cellular and molecular biology. 2nd ed. Washington, D.C: ASM Press; 1996. pp. 1075–1090. [Google Scholar]
- 19.Ferreira F, Straus N A. Iron deprivation in cyanobacteria. J Appl Phycol. 1994;6:199–210. [Google Scholar]
- 20.Foster J W, Hall H K. Effect of Salmonella typhimurium ferric uptake regulator (fur) mutations on iron- and pH-regulated protein synthesis. J Bacteriol. 1992;174:4317–4323. doi: 10.1128/jb.174.13.4317-4323.1992. [DOI] [PMC free article] [PubMed] [Google Scholar]
- 21.Frolow F, Kalb A J, Yariv J. Structure of a unique twofold symetric haem-binding site. Nat Stuct Biol. 1994;7:453–460. doi: 10.1038/nsb0794-453. [DOI] [PubMed] [Google Scholar]
- 22.Gannon D E, Varani J, Phan S H, Ward J H, Kaplan J, Till G O, Simon R H, Ryan U S, Ward P A. Source of iron in neutrophil-mediated killing of endothelial cells. Lab Investig. 1987;57:37–44. [PubMed] [Google Scholar]
- 23.Garg R P, Vargo C J, Cui X Y, Kurtz D M., Jr A [2Fe-2S] protein encoded by an open reading frame upstream of the Escherichia coli bacterioferritin gene. Biochemistry. 1996;35:6297–6301. doi: 10.1021/bi9600862. [DOI] [PubMed] [Google Scholar]
- 24.Grogan J M. Regulation and function of the genes encoding bacterioferritin (Bfr) and Bfr-associated ferredoxin (Bfd) of E. coli. Ph.D. thesis. Sheffield, United Kingdom: University of Sheffield; 1997. [Google Scholar]
- 25.Gruer M J, Guest J R. Two genetically-distinct and differentially regulated aconitases (acnA and acnB) in Escherichia coli. Microbiology. 1994;140:2531–2541. doi: 10.1099/00221287-140-10-2531. [DOI] [PubMed] [Google Scholar]
- 26.Halliwell B, Gutteridge J M C. Oxygen free radicals and iron in relation to biology and medicine: some problems and concepts. Arch Biochem Biophys. 1986;246:501–514. doi: 10.1016/0003-9861(86)90305-x. [DOI] [PubMed] [Google Scholar]
- 27.Hamilton C M, Aldea M, Washburn B K, Babitzke P, Kushner S R. New method for generating deletions and gene replacements in Escherichia coli. J Bacteriol. 1989;171:4617–4622. doi: 10.1128/jb.171.9.4617-4622.1989. [DOI] [PMC free article] [PubMed] [Google Scholar]
- 28.Hantke K. Regulation of ferric iron transport in Escherichia coli K12: isolation of a constitutive mutant. Mol Gen Genet. 1981;182:288–292. doi: 10.1007/BF00269672. [DOI] [PubMed] [Google Scholar]
- 29.Harrison P M, Arosio P. The ferritins: molecular properties, iron storage function and cellular regulation. Biochim Biophys Acta. 1996;1275:161–203. doi: 10.1016/0005-2728(96)00022-9. [DOI] [PubMed] [Google Scholar]
- 30.Harrison P M, Hempstead P D, Artymiuk P J, Andrews S C. Structure-function relationships in the ferritins. Metal Ions Biol Syst. 1998;35:435–477. [PubMed] [Google Scholar]
- 31.Hartmann A, Braun V. Iron uptake and iron limited growth of Escherichia coli K-12. Arch Microbiol. 1981;130:353–356. doi: 10.1007/BF00414599. [DOI] [PubMed] [Google Scholar]
- 32.Hempstead P D, Hudson A J, Artymiuk P J, Andrews S C, Banfield M J, Guest J R, Harrison P M. First direct observation of the iron-binding sites in ferritin. FEBS Lett. 1994;350:258–262. doi: 10.1016/0014-5793(94)00781-0. [DOI] [PubMed] [Google Scholar]
- 33.Hudson A J, Andrews S C, Hawkins C, Williams J M, Izuhara M, Meldrum F C, Mann S, Harrison P M, Guest J R. Overexpression, purification and characterization of the Escherichia coli ferritin. Eur J Biochem. 1993;218:985–995. doi: 10.1111/j.1432-1033.1993.tb18457.x. [DOI] [PubMed] [Google Scholar]
- 34.Izuhara M, Takamune K, Takata R. Cloning and sequencing of an Escherichia coli K12 gene which encodes a polypeptide having similarity to the human ferritin H subunit. Mol Gen Genet. 1991;225:510–513. doi: 10.1007/BF00261694. [DOI] [PubMed] [Google Scholar]
- 35.Keyer K, Imlay J A. Superoxide accelerates DNA-damage by elevating free-iron levels. Proc Natl Acad Sci USA. 1996;193:13635–13640. doi: 10.1073/pnas.93.24.13635. [DOI] [PMC free article] [PubMed] [Google Scholar]
- 36.Kunkel T A. Rapid and efficient site-specific mutagenesis without phenotypic selection. Proc Natl Acad Sci USA. 1985;82:488–492. doi: 10.1073/pnas.82.2.488. [DOI] [PMC free article] [PubMed] [Google Scholar]
- 37.Marmur J. A procedure for the isolation of deoxyribonucleic acid from microorganisms. Methods Enzymol. 1964;6:726–739. [Google Scholar]
- 38.Mello Fihlo A C, Hoffman M E, Meneghini R. Cell killing and DNA damage by hydrogen peroxide are mediated by intracellular iron. Biochem J. 1984;218:273–275. doi: 10.1042/bj2180273. [DOI] [PMC free article] [PubMed] [Google Scholar]
- 39.Messing J. New M13 vectors for cloning. Methods Enzymol. 1983;101:20–78. doi: 10.1016/0076-6879(83)01005-8. [DOI] [PubMed] [Google Scholar]
- 40.Miller J H. Experiments in molecular genetics. Cold Spring Harbor, N.Y: Cold Spring Harbor Laboratory Press; 1972. [Google Scholar]
- 40a.Minakami H, Kitzler J W, Fridovich I. Effects of pH, glucose, and chelating agents on lethality of paraquat to Escherichia coli. J Bacteriol. 1990;172:691–695. doi: 10.1128/jb.172.2.691-695.1990. [DOI] [PMC free article] [PubMed] [Google Scholar]
- 41.Neidhardt F C, Bloch P L, Smith D F. Culture medium for enterobacteria. J Bacteriol. 1974;119:736–747. doi: 10.1128/jb.119.3.736-747.1974. [DOI] [PMC free article] [PubMed] [Google Scholar]
- 42.Niederhoffer E C, Naranjo C M, Bradley K L, Fee J A. Control of Escherichia coli superoxide sidmuatase (sodA and sodB) genes by the ferric iron uptake regulation (fur) locus. J Bacteriol. 1990;172:1930–1938. doi: 10.1128/jb.172.4.1930-1938.1990. [DOI] [PMC free article] [PubMed] [Google Scholar]
- 43.Park S J, Gunsalus R P. Oxygen, iron, carbon, and superoxide control of the fumarase fumA and fumC genes of Escherichia coli—role of the arcA, fnr, and soxR gene products. J Bacteriol. 1995;177:6255–6262. doi: 10.1128/jb.177.21.6255-6262.1995. [DOI] [PMC free article] [PubMed] [Google Scholar]
- 44.Prentki P, Krisch H M. In vitro insertional mutagenesis with a selectable DNA fragment. Gene. 1984;29:303–313. doi: 10.1016/0378-1119(84)90059-3. [DOI] [PubMed] [Google Scholar]
- 45.Pugsley A P, Reeves P. Characterization of group B colicin-resistant mutants of Escherichia coli K-12: colicin resistance and the role of enterochelin. J Bacteriol. 1976;127:218–228. doi: 10.1128/jb.127.1.218-228.1976. [DOI] [PMC free article] [PubMed] [Google Scholar]
- 46.Quail M A, Jordan P, Grogan J M, Butt J N, Lutz M, Thomson A J, Andrews S C, Guest J R. Spectroscopic and voltammetric characterisation of the bacterioferritin-associated ferredoxin of Escherichia coli. Biochem Biophys Res Commun. 1996;229:635–642. doi: 10.1006/bbrc.1996.1856. [DOI] [PubMed] [Google Scholar]
- 47.Razquin P, Schmitz S, Fillat M F, Peleato M L, Bohme H. Transcriptional and translational analysis of ferredoxin and flavodoxin under iron and nitrogen stress in Anabaena sp strain PCC 7120. J Bacteriol. 1994;176:7409–7411. doi: 10.1128/jb.176.23.7409-7411.1994. [DOI] [PMC free article] [PubMed] [Google Scholar]
- 48.Repine J E, Fox R B, Berger E M. Hydrogen peroxide kills Staphylococcus aureus by reacting with Staphylococcal iron to form hydroxyl radicals. J Biol Chem. 1981;256:7094–7096. [PubMed] [Google Scholar]
- 49.Rouf M A. Spectrochemical analysis of inorganic elements in bacteria. J Bacteriol. 1964;88:1545–1549. doi: 10.1128/jb.88.6.1545-1549.1964. [DOI] [PMC free article] [PubMed] [Google Scholar]
- 50.Sambrook J, Fritsch E F, Maniatis T. Molecular cloning: a laboratory manual. 2nd ed. Cold Spring Harbor, N.Y: Cold Spring Harbor Laboratory Press; 1989. [Google Scholar]
- 51.Sanger F, Coulson A R, Barrell B G, Smith A J H, Roc B A. Cloning in single-stranded bacteriophage as an aid to rapid DNA sequencing. J Mol Biol. 1980;143:161–178. doi: 10.1016/0022-2836(80)90196-5. [DOI] [PubMed] [Google Scholar]
- 52.Silhavy T J, Berman M L, Enquist L W. Experiments with gene fusions. Cold Spring Harbor, N.Y: Cold Spring Harbor Laboratory Press; 1984. [Google Scholar]
- 53.Stiefel E I, Watt G D. Azotobacter cytochrome b557.5 is a bacterioferritin. Nature. 1979;279:81–83. doi: 10.1038/279081a0. [DOI] [PubMed] [Google Scholar]
- 54.Stojiljkovic I, Bäumler A J, Hantke K. Fur regulon in gram-negative bacteria. Identification and characterization of new iron-regulated Escherichia coli genes by a Fur titration assay. J Mol Biol. 1994;236:531–545. doi: 10.1006/jmbi.1994.1163. [DOI] [PubMed] [Google Scholar]
- 55.Theil E C. Ferritin: structure, gene regulation, and cellular function in animals, plants, and microorganisms. Annu Rev Biochem. 1987;56:289–315. doi: 10.1146/annurev.bi.56.070187.001445. [DOI] [PubMed] [Google Scholar]
- 56.Touati D, Jacques M, Tardat B, Bouchard L, Despied S. Lethal oxidative damage and mutagenesis are generated by iron in delta-fur mutants of Escherichia coli—protective role of superoxide dismutase. J Bacteriol. 1995;177:2305–2314. doi: 10.1128/jb.177.9.2305-2314.1995. [DOI] [PMC free article] [PubMed] [Google Scholar]
- 57.Tseng C-P. Regulation of fumarase (fumB) gene expression in Escherichia coli in response to oxygen, iron and heme availability: role of the arcA, fur, and hemA gene products. FEMS Microbiol Lett. 1997;157:67–72. doi: 10.1111/j.1574-6968.1997.tb12754.x. [DOI] [PubMed] [Google Scholar]
- 58.Vogel H J, Bonner D M. Acetylornithinase of Escherichia coli: partial purification and some properties. J Biol Chem. 1955;218:97–106. [PubMed] [Google Scholar]
- 59.Wai S N, Nakayama K, Umene K, Moriya T, Amako K. Construction of a ferritin-deficient mutant of Campylobacter jejuni—contribution of ferritin to iron storage and protection against oxidative stress. Mol Microbiol. 1996;20:1127–1134. doi: 10.1111/j.1365-2958.1996.tb02633.x. [DOI] [PubMed] [Google Scholar]
- 60.Yariv J. Circumstantial evidence for cytochrome b1 involvement in the functioning of lac-permease in respiring Escherichia coli. J Theor Biol. 1996;182:459–462. doi: 10.1006/jtbi.1996.0187. [DOI] [PubMed] [Google Scholar]
- 61.Zigler J S, Jernigan H M, Garland D, Reddy V N. The effects of oxygen radicals generated in the medium on lenses in organ culture—inhibition of damage by chelated iron. Arch Biochem Biophys. 1985;241:163–172. doi: 10.1016/0003-9861(85)90372-8. [DOI] [PubMed] [Google Scholar]