HugeIndex: a database with visualization tools for high-density oligonucleotide array data from normal human tissues (original) (raw)
Abstract
High-density oligonucleotide arrays are a powerful tool for uncovering changes in global gene expression in various disease states. To this end, it is essential to first characterize the variations of gene expression in normal physiological processes. We established the Human Gene Expression (HuGE) Index database (www.HugeIndex.org) to serve as a public repository for gene expression data on normal human tissues using high-density oligonucleotide arrays. This resource currently contains the results of 59 gene expression experiments on 19 human tissues. We provide interactive tools for researchers to query and visualize our data over the Internet. To facilitate data analysis, we cross-reference each gene on the array with its annotation in the LocusLink database at NCBI.
INTRODUCTION
Genome projects are producing DNA sequence information at an unprecedented rate. Among the most creative and powerful technologies for exploiting sequence information are high-density arrays of oligonucleotides or complementary DNAs (cDNAs). Labeled DNA or RNA molecules in solution are hybridized to an array of DNA molecules attached at specific locations on a surface. Thus, the abundance of hundreds of thousands of genes can be monitored simultaneously (1). One of the most important applications for arrays is discovering differences in gene expression between healthy and diseased states (2–6). Before determining the significance of a gene’s expression level in a disease state, one must first characterize the variation of its expression levels in healthy biological processes.
High-density oligonucleotides arrays (HDAs) incorporate more design principles than cDNA arrays to reduce cross hybridization and improve sensitivity (7). However, HDAs are far more costly than cDNA arrays and few HDA results are publicly available. We established the Human Gene Expression Index (HugeIndex) compendium as a public repository of HDA expression data on normal human tissues. Its goal is to serve as a reference of expression profiles in various tissues from multiple healthy individuals, which can be compared to data from human diseases. This resource may also be used to study the gene expression of normal physiology, such as the impacts of sex, age and different genetic backgrounds.
DATA SOURCE
Our initial release of the HugeIndex database provides the results of 59 microarray experiments conducted using tissue from 19 different human organs from 49 different individuals. All of these experiments were performed using oligonucleotide microarrays (Affymetrix GeneChip® Hu6800), which probe for mRNA from approximately 7000 genes. Each tissue sample was identified as histologically normal. Tissue samples were obtained from both surgical biopsies and autopsies. Images of sections of selected samples are available at the database web site, as is demographic information about the donors. More detailed information about the tissue sample preparation and gene expression measurement is given elsewhere (8).
GeneChip® Software (Affymetrix Microarray Suite 4.0®) was used to generate gene expression levels, defined as the ‘average difference’ between the hybridization intensities of the perfect match (PM) probe sets and the mismatch (MM) probe sets. These raw expression levels were then multiplied by a scaling factor to make the mean expression level on the entire microarray equal to 100. This scaling is automatically performed by the Affymetrix software to normalize the gene expression levels to allow comparison between any two samples.
DATABASE SCHEMA AND DATA LOADING
HugeIndex is currently implemented using an object relational model and the PostgreSQL 7.1 relational database management system. The current schema (Fig. 1) consists of four tables that hold data regarding (i) experiments, (ii) experimental protocols, (iii) expression levels, and (iv) genes. Experiment data includes such items as the source and type of the tissue sample being studied. The protocol table contains data about standard protocols used for stored experiments. The expression levels table contains the processed values for the expression level of each gene studied in each experiment as well as values that describe the quality of each expression level measurement. Gene data is organized in rows corresponding to each probe-set on each type of chip used in one of our experiments as well as data regarding the identity of the transcript targeted by each probe-set. Although simple, the schema incorporates all of the key features of HDA data.
Figure 1.

Database schema for the HugeIndex.
In order to facilitate the inclusion of data from other laboratories, we have created programs to upload data from multiple text file formats, including Affymetrix output files and data summarized in text-based spreadsheets. We plan to make these programs publicly available through our web site as soon as the minimum information about a microarray experiment (MIAME; www.mged.org) standards are finalized. These standards will allow us to know what data to request from submitters.
VISUALIZATION AND QUERYING
The data in the HugeIndex can be accessed in multiple ways. The database can be queried through web forms. The returned data can be visualized directly using a number of interactive graphing and display tools at our web site or it can be downloaded in text form for further analysis. The entire database will soon be available for direct download via FTP. The online analysis enables the user to visualize our data in three ways:
Single gene queries
This query system allows a user to interactively plot the expression of one gene in multiple tissues. To facilitate interpretation, results from multiple experiments using the same tissue are initially averaged. The resulting graphs then lead the user to easy retrieval of expression data and experimental conditions for individual experiments. In the few cases where Affymetrix provides multiple probe-sets for a gene (e.g. 111/6939 for the Hu6800 chip), we present data from each probe-set separately. This is done because the multiple probe-sets do not always agree and any method for combining these data could be misleading.
Cross tissue comparison using boolean operators
In line with our aim of providing ‘a reference for defining basic organ systems biology’ (8), HugeIndex offers a query system that can compare global expression patterns among tissues. Using the qualitative measure of expression provided by Affymetrix (i.e. present, marginal, absent), this system can discover sets of genes that either are or are not expressed in two different tissues of interest. The system allows a user to group tissues together when making comparisons in order to ask questions such as: ‘which genes are expressed only in lung tissue?’ or ‘which genes are expressed in endometrium and myometrium, but not in skeletal muscle?’
Comparisons of tissues or experiments using interactive scatter plots
The scatter plot function allows a user to make global comparisons between tissues or individual experiments. The scatter plot query system allows the user to select two sets of data for comparison, either of which can be an individual experiment or the average expression values for all experiments of one tissue type. For example, the user might choose to compare the average expression of all genes in brain tissue with the respective expression levels in muscle tissue. The interactive scatter plots are generated using Java classes provided in the NetCharts 3.7® package from Visual Mining Inc. These classes allow a user to investigate a region of the plot more closely or obtain detailed information on the identities and expression levels of specific genes.
THE FUTURE OF THE HugeIndex
We are in the process of making a number of changes that will increase the value of this database as a community resource. The rather simple schema we have currently implemented has been sufficient for our purposes, but in keeping with the original collaboratory aim of our project we will be porting our database to a community standard schema, such as the one being developed by the Microarray Gene Expression Database group (www.mged.org). Currently, we offer standard tab-delimited output for those who would like to download our data and perform independent analyses. We will be converting this service to the community standard XML format when one is chosen. We will collect additional high-density oligonucleotide microarray measurements of gene expression in normal human tissues from the community to expand the utility of our service.
Figure 2.

Scatter plot of the expression measurements for brain experiment 7 (pons/medulla tissue) versus the average of 10 other brain tissue experiments.
Figure 3.
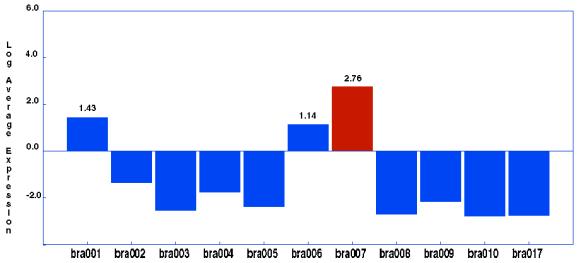
Chart of the expression of the Mac-2 binding protein in 11 histologically normal brain tissue samples. The negative values are a result of showing expression as the difference in the fluorescence measured at two different points (perfect match and mismatch probes). The log was taken on the absolute value of the expression measure. Bar colors indicate absolute expression levels: red, present; blue, absent.
Acknowledgments
ACKNOWLEDGEMENTS
P.M.H. and Z.W. are supported by NSF grant DBI0078194.
REFERENCES
- 1.Lockhart D.J. and Winzeler,E.A. (2000) Genomics, gene expression and DNA arrays. Nature, 405, 827–836. [DOI] [PubMed] [Google Scholar]
- 2.DeRisi J., Penland,L., Brown,P.O., Bittner,M.L., Meltzer,P.S., Ray,M., Chen,Y., Su,Y.A. and Trent,J.M. (1996) Use of a cDNA microarray to analyse gene expression patterns in human cancer. Nature Genet., 14, 457–460. [DOI] [PubMed] [Google Scholar]
- 3.Golub T.R., Slonim,D.K., Tamayo,P., Huard,C., Gaasenbeek,M., Mesirov,J.P., Coller,H., Loh,M.L., Downing,J.R., Caligiuri,M.A. et al. (1999) Molecular classification of cancer: class discovery and class prediction by gene expression monitoring. Science, 286, 531–537. [DOI] [PubMed] [Google Scholar]
- 4.Alizadeh A.A., Eisen,M.B., Davis,R.E., Ma,C., Lossos,I.S., Rosenwald,A., Boldrick,J.C., Sabet,H., Tran,T., Yu,X. et al. (2000) Distinct types of diffuse large B-cell lymphoma identified by gene expression profiling. Nature, 403, 503–511. [DOI] [PubMed] [Google Scholar]
- 5.Alon U., Barkai,N., Notterman,D.A., Gish,K., Ybarra,S., Mack,D. and Levine,A.J. (1999) Broad patterns of gene expression revealed by clustering analysis of tumor and normal colon tissues probed by oligonucleotide arrays. Proc. Natl Acad. Sci. USA, 96, 6745–6750. [DOI] [PMC free article] [PubMed] [Google Scholar]
- 6.Svaren J., Ehrig,T., Abdulkadir,S.A., Ehrengruber,M.U., Watson,M.A. and Milbrandt,J. (2000) EGR1 Target genes in prostate carcinoma cells identified by microarray analysis. J. Biol. Chem., 275, 38524–38531. [DOI] [PubMed] [Google Scholar]
- 7.Lockhart D.J., Dong,H., Byrne,M.C., Follettie,M.T., Gallo,M.V., Chee,M.S., Mittmann,M., Wang,C., Kobayashi,M., Horton,H. et al. (1996) Expression monitoring by hybridization to high-density oligonucleotide arrays. Nat. Biotechnol., 14, 1675–1680. [DOI] [PubMed] [Google Scholar]
- 8.Hsiao L., Yoshida,T., Hong,R., Jensen,R., Dangond,F., Misra,J., Haverty,P., Weng,Z., Mutter,G., Milford,E.L. et al. (2001) A Compendium of gene expression in normal human tissues reveals tissue-selective genes and distinct expression patterns of housekeeping genes. Physiol. Genomics, in press. [DOI] [PubMed] [Google Scholar]
- 9.Pruitt K.D. and Maglott,D.R. (2001) RefSeq and LocusLink: NCBI gene-centered resources. Nucleic Acids Res., 29, 137–140. [DOI] [PMC free article] [PubMed] [Google Scholar]