Control of cell cycle progression by c-Jun is p53 dependent - PubMed (original) (raw)
Control of cell cycle progression by c-Jun is p53 dependent
M Schreiber et al. Genes Dev. 1999.
Abstract
The c-jun proto-oncogene encodes a component of the mitogen-inducible immediate-early transcription factor AP-1 and has been implicated as a positive regulator of cell proliferation and G1-to-S-phase progression. Here we report that fibroblasts derived from c-jun-/- mouse fetuses exhibit a severe proliferation defect and undergo a prolonged crisis before spontaneous immortalization. The cyclin D1- and cyclin E-dependent kinases (CDKs) and transcription factor E2F are poorly activated, resulting in inefficient G1-to-S-phase progression. Furthermore, the absence of c-Jun results in elevated expression of the tumor suppressor gene p53 and its target gene, the CDK inhibitor p21, whereas overexpression of c-Jun represses p53 and p21 expression and accelerates cell proliferation. Surprisingly, protein stabilization, the common mechanism of p53 regulation, is not involved in up-regulation of p53 in c-jun-/- fibroblasts. Rather, c-Jun regulates transcription of p53 negatively by direct binding to a variant AP-1 site in the p53 promoter. Importantly, deletion of p53 abrogates all defects of cells lacking c-Jun in cell cycle progression, proliferation, immortalization, and activation of G1 CDKs and E2F. These results demonstrate that an essential, rate-limiting function of c-Jun in fibroblast proliferation is negative regulation of p53 expression, and establish a mechanistic link between c-Jun-dependent mitogenic signaling and cell-cycle regulation.
Figures
Figure 1
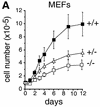
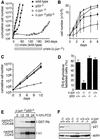
Growth properties of primary and immortalized fibroblasts lacking c-Jun. (A) Proliferation curves of wild-type (+/+), c-jun+/−, and c-_jun_−/− primary fibroblasts (MEFs; passage 1). The average ±
s.d.
numbers of cells isolated from three individual embryos of each genotype are shown, each determined in triplicate. (B) Proliferation curves of five independently established 3T3 fibroblast lines lacking c-Jun (−/−) and three corresponding wild-type 3T3 fibroblast lines (+/+). Cells were counted and passaged at 3-day intervals and cumulative cell numbers determined. (█) Standard NIH-3T3 fibroblasts obtained from ATCC. (C) Saturation densities of wild-type (+/+) and mutant (−/−) 3T3 fibroblasts as a function of serum concentration. Cells were counted after 13 days of culture in the presence of the indicated concentrations of fetal calf serum. Each point represents the average ±
s.d.
of two wild-type and three c-_jun_−/− cell lines, respectively. (D) Determination of the duration of the cell cycle of wild-type (+/+) and c-_jun_−/− 3T3 fibroblasts (−/−). [3H]thymidine was added to exponentially growing, asynchronous cultures, and cells were fixed and analyzed at various times after continuous thymidine incorporation (cumulative labeling). Each point represents the average ±
s.d.
of two independent cell lines of each genotype. (E, F) Parallel quantitative analysis of G1-to-S-phase progression (E) and cell growth (F) in wild-type (+/+) and c-_jun_−/− 3T3 fibroblasts (−/−) at the indicated times after serum stimulation of G0-synchronized cells (see Materials and Methods). Percentage of cells exiting G1 (i.e., the percentage of cells in S, G2, or M) was quantified by propidium iodide staining and FACS analysis. Cell volumes and cell numbers were determined in parallel with a CASY1 cell counter. The average of two independent cell lines of each genotype is shown.
Figure 2
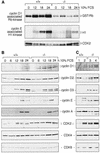
Defective activation of G1 CDKs in fibroblasts lacking c-Jun. (A) Induction of cyclin D1 associated pRb kinase activity and cyclin E-associated histone H1 kinase activity in 3T3 fibroblasts. Quiescent wild-type (+/+) and c-_jun_−/− 3T3 fibroblasts (−/−) were stimulated to reenter the cell cycle (see Materials and Methods). At the indicated time points after serum stimulation, whole-cell extracts were prepared, anti-cyclin D1 and anti-cyclin E immunoprecipitates were isolated, and their GST–Rb and histone H1 phosphorylating activities were determined. The levels of coimmunoprecipitated CDK2 in the cyclin E/CDK2 immune complexes were determined by Western blotting. (B) Serum induction of expression of the indicated G1 cyclins and CDKs in G0 synchronized and restimulated wild-type (+/+) and c-_jun_−/− 3T3 fibroblasts (−/−) was determined by Western blotting. (C) Expression levels of G1 cyclins and CDKs in two independent wild-type (+/+, lanes 1,2) and two independent c-_jun_−/− (−/−, lanes 3,4) exponentially growing 3T3 fibroblast lines. Only the 33-kD splice variant of CDK2 is shown in B and C.
Figure 3
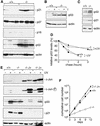
Increased expression of p21 and p53 in fibroblasts lacking c-Jun. (A) Western blot analysis of p21, p27, p16, p53, and actin (loading control) in three independent, exponentially growing wild-type (+/+) and c-_jun_−/− 3T3 fibroblast lines (−/−). The levels of p16 were very low in all wild-type and mutant 3T3 lines compared to primary fibroblasts (not shown). (B) Western blot analysis of p53 expression in wild-type (+/+) and c-_jun_−/− 3T3 fibroblasts (−/−) after γ-irradiation (20 Gy, 2 hr) or mock treatment (−). (C) Western blot analysis of p53, p21, and actin (loading control) in exponentially growing wild-type (+/+) and c-_jun_−/− (−/−) primary embryonic fibroblasts (MEFs, passage 1). (D) Turnover of p53 in wild-type (+/+) and c-_jun_−/− 3T3 fibroblasts, before and after UVC irradiation (+UV, 40 J/m2), was determined by pulse/chase experiments. The amount of labeled p53 protein at each time point was quantified with a PhosphorImager and normalized to the amount of labeled p53 detected after 0 min of chase. (E) Western blot analysis of c-Jun, phosphorylated c-Jun (c-Jun-P), p53, and p21 in wild-type (+/+), c-_jun_−/− (−/−), and c-Jun overexpressing 3T3 fibroblasts (−/− J+). Two independent derivatives of c-_jun_−/− 3T3 fibroblasts stably cotransfected with a human c-Jun expression vector and RSV–hygro (−/− J+), the parental c-_jun_−/− line (−/−), and one wild-type line (+/+) were irradiated (+) or not (−) with UVC (40 J/m2), and extracts were prepared 30 min later for the analysis of c-Jun, or after 24 hr for the analysis of p53 and p21. (Actin) Loading control for the p53 and p21 Western blot. (F) Reintroduction of functional c-Jun into c-_jun_−/− 3T3 fibroblasts rescues their proliferation defect. Proliferation rates of two independent stable lines expressing human c-Jun (−/− J+) were compared to the parental c-_jun_−/− and one wild-type (+/+) 3T3 fibroblast line.
Figure 4
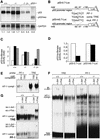
c-Jun binds to and represses the p53 promoter. (A) Northern blot analysis of p53 mRNA in two wild-type (+/+), two c-_jun_−/− (−/−), two c-Jun-overexpressing (−/− J+), and one _p53_−/− 3T3 fibroblast lines. Poly(A)+ RNA from untreated cells was separated on an agarose gel, transferred to Hybond N+ (Amersham) membrane, and probed with p53 and GAPDH cDNA probes. The intensities of bands were quantified with a PhosphorImager, and relative levels of p53 mRNA, normalized to GAPDH, are indicated at the bottom of each lane. (B) Schematic representation of the p53 promoter–luciferase reporter constructs used. p53-0.7–Luc contains a 700-bp fragment of the mouse p53 promoter region, which contains the PF-1 element (Ginsberg et al. 1990). p53-m0.7–Luc contains a mutated version of PF-1 (mut. PF-1). The consensus AP-1-binding site (cons. TRE) is shown for comparison. (C) p53-0.7–Luc (open bars), p53-m0.7–Luc (solid bars), or pGL2–Luc (shaded bars) (an unrelated control luciferase construct) was transfected into wild-type (+/+), c-jun null (−/−), and c-Jun-overexpressing (−/− J+) 3T3 fibroblasts, and luciferase activity was measured. (D) p53-0.7–Luc or p53-m0.7–Luc was cotransfected into wild-type 3T3 fibroblasts together with a c-Jun expression vector (solid bars) or empty expression vector (open bars), and luciferase activity was measured. Relative luciferase activities from one representative experiment performed in quadruplicate are shown in C and D. (E–G) Protein–DNA complexes formed with the consensus AP-1-binding site (TRE of the collagenase promoter) and the PF-1 element of the p53 promoter. Nuclear extracts were prepared from exponentially growing (E,F) or TPA treated (2 hr; 100 ng/ml; G) wild-type (+/+) and c-_jun_−/− (−/−) fibroblasts. Nuclear extracts were incubated with the labeled probes indicated on the top and complexes were resolved by PAGE. The positions of the DNA-bound AP-1 complexes are indicated on the left. For cross-competition analysis (E) an 80-fold molar excess of non-labeled competitor DNA (indicated at top) was used. For supershift analysis (F,G), extracts were preincubated with specific antiserum (indicated at top) for c-Jun (ss c-Jun) and c-Fos (ss c-Fos), and the positions of the resulting supershifts are indicated at left. Note that in F and G the time of exposure of the PF-1 analysis was sevenfold longer compared to the result obtained with the TRE.
Figure 5
Loss of p53 suppresses the cell cycle and immortalization defects of fibroblasts lacking c-Jun. (A) Immortalization of 3T3 fibroblast lines lacking functional c-Jun, p53, or both proteins. Primary fibroblasts isolated from embryonic day 11.5 (E11.5) mouse fetuses with the indicated genotypes were immortalized according to the standard 3T3 protocol (Todaro and Green 1963). An ‘immortalization curve’ of cumulative cell numbers for one representative example of each genotype is shown (day 0 in graph = passage 3). Wild-type (█) and c-_jun_−/− (□) primary fibroblasts were immortalized after ∼40 and 200 days in culture, respectively, whereas _p53_−/− (●) and c-_jun_−/−_p53_−/− (○) cells became immortalized without undergoing any detectable crisis. (B) Proliferation curves of primary fibroblasts (passage 1) lacking c-Jun, p53, or both proteins. Average ±
s.d.
numbers of cells isolated from two individual embryos of each genotype, determined in triplicates, is shown. (C) Proliferation curves of one wild-type, one c-_jun_−/−, two _p53_−/−, and two c-_jun_−/−_p53_−/− 3T3 fibroblast lines, each separately immortalized from primary cells isolated from individual E11.5 embryos. (D) Fraction of S-phase cells in asynchronous populations of 3T3 fibroblasts of the indicated genotypes, determined by 1-hr pulse-labeling with [3H]thymidine of exponentially growing cultures. Averages ±
s.d.
for two independent cell lines per genotype are shown. (E) Induction of cyclin D1-associated Rb kinase activity and cyclin E-associated histone H1 kinase activity in c-_jun_−/−_p53_−/− 3T3 fibroblasts. A representative experiment with immune complexes prepared at the indicated times after serum stimulation of G0 synchronized cells is shown (see Materials and Methods). (F) Western blot analysis of p21 in one c-_jun_−/−, one wild-type, two c-_jun_−/−_p53_−/−, and two _p53_−/− 3T3 fibroblast lines. The blot was reprobed for actin as a loading control.
Figure 6
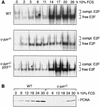
Deletion of c-jun leads to poor activation of E2F, which can be rescued by simultaneous deletion of p53. (A) DNA-bound E2F complexes in synchronized wild-type (WT), c-_jun_−/−, and c-_jun_−/−_p53_−/− 3T3 fibroblasts were analyzed by electrophoretic mobility-shift assays (EMSA) using an oligonucleotide containing the consensus E2F-binding site. Whole-cell extracts were prepared at the indicated times after restimulation of quiescent cells. All complexes detected are specific as they were competed by an excess of unlabeled wild-type competitor but not by an oligonucleotide in which the E2F site was mutated (not shown). The amounts of extract used per lane were normalized by measuring protein concentrations and by quantitation of retarded bands formed with an SP-1 probe. The positions of free (active) E2F and of E2F complexed to pRb family proteins (compl. E2F) are indicated. (B) Western blot analysis of the E2F target gene PCNA in G0 synchronized wild-type and c-_jun_−/− 3T3 fibroblasts after serum stimulation for the indicated times.
Figure 7
Model for the dual functions of c-Jun in connecting mitogenic signaling to the cell cycle clock. Stimulation of cells by growth factors leads to increased expression of c-Jun, cyclin D1, p53, and p21. Cyclin D1 positively and p21 negatively influences activation of CDK4/CDK6, the first cyclin-dependent kinase to be activated as cells progress through G1. Once CDK4/CDK6 is activated and phosphorylates pRb and its related proteins, cells are committed to complete progression through the entire cell cycle in the absence of further mitogen stimulation (Harper and Elledge 1996; Sherr 1996). c-Jun contributes to mitogen-dependent activation of cyclin D1–CDK4/CDK6 in two ways. (1) It transduces mitogenic signals to induce cyclin D1 expression, although cyclin D1 can still be induced by mitogens in the absence of c-Jun (indicated by dashed arrow); (2) it attenuates accumulation of p21 through repression of p53 expression. In cells lacking p53, low levels of p21 allow efficient activation of cyclin D1–CDK4/CDK6, cyclin E–CDK2, E2F, and G1-to-S-phase progression whether or not c-Jun is present.
Similar articles
- Regulated ectopic expression of cyclin D1 induces transcriptional activation of the cdk inhibitor p21 gene without altering cell cycle progression.
Hiyama H, Iavarone A, LaBaer J, Reeves SA. Hiyama H, et al. Oncogene. 1997 May 29;14(21):2533-42. doi: 10.1038/sj.onc.1201080. Oncogene. 1997. PMID: 9191053 - Downregulation of c-Jun expression and cell cycle regulatory molecules in acute myeloid leukemia cells upon CD44 ligation.
Zada AA, Singh SM, Reddy VA, Elsässer A, Meisel A, Haferlach T, Tenen DG, Hiddemann W, Behre G. Zada AA, et al. Oncogene. 2003 Apr 17;22(15):2296-308. doi: 10.1038/sj.onc.1206393. Oncogene. 2003. PMID: 12700665 - PKCeta enhances cell cycle progression, the expression of G1 cyclins and p21 in MCF-7 cells.
Fima E, Shtutman M, Libros P, Missel A, Shahaf G, Kahana G, Livneh E. Fima E, et al. Oncogene. 2001 Oct 11;20(46):6794-804. doi: 10.1038/sj.onc.1204885. Oncogene. 2001. PMID: 11709714 - Regulation of cell cycle entry and G1 progression by CSF-1.
Roussel MF. Roussel MF. Mol Reprod Dev. 1997 Jan;46(1):11-8. doi: 10.1002/(SICI)1098-2795(199701)46:1<11::AID-MRD3>3.0.CO;2-U. Mol Reprod Dev. 1997. PMID: 8981358 Review. - Cell cycle regulators in the keratinocyte (cyclin-cdk).
Inohara S, Kitano Y, Kitagawa K. Inohara S, et al. Exp Dermatol. 1995 Feb;4(1):1-8. doi: 10.1111/j.1600-0625.1995.tb00215.x. Exp Dermatol. 1995. PMID: 7757327 Review.
Cited by
- The potential for chemical mixtures from the environment to enable the cancer hallmark of sustained proliferative signalling.
Engström W, Darbre P, Eriksson S, Gulliver L, Hultman T, Karamouzis MV, Klaunig JE, Mehta R, Moorwood K, Sanderson T, Sone H, Vadgama P, Wagemaker G, Ward A, Singh N, Al-Mulla F, Al-Temaimi R, Amedei A, Colacci AM, Vaccari M, Mondello C, Scovassi AI, Raju J, Hamid RA, Memeo L, Forte S, Roy R, Woodrick J, Salem HK, Ryan EP, Brown DG, Bisson WH. Engström W, et al. Carcinogenesis. 2015 Jun;36 Suppl 1(Suppl 1):S38-60. doi: 10.1093/carcin/bgv030. Carcinogenesis. 2015. PMID: 26106143 Free PMC article. Review. - Overexpression of MAPK15 in gastric cancer is associated with copy number gain and contributes to the stability of c-Jun.
Jin DH, Lee J, Kim KM, Kim S, Kim DH, Park J. Jin DH, et al. Oncotarget. 2015 Aug 21;6(24):20190-203. doi: 10.18632/oncotarget.4171. Oncotarget. 2015. PMID: 26035356 Free PMC article. - JNK3 as Therapeutic Target and Biomarker in Neurodegenerative and Neurodevelopmental Brain Diseases.
Musi CA, Agrò G, Santarella F, Iervasi E, Borsello T. Musi CA, et al. Cells. 2020 Sep 28;9(10):2190. doi: 10.3390/cells9102190. Cells. 2020. PMID: 32998477 Free PMC article. Review. - INMAP, a novel truncated version of POLR3B, represses AP-1 and p53 transcriptional activity.
Yunlei Z, Zhe C, Yan L, Pengcheng W, Yanbo Z, Le S, Qianjin L. Yunlei Z, et al. Mol Cell Biochem. 2013 Feb;374(1-2):81-9. doi: 10.1007/s11010-012-1507-4. Epub 2012 Nov 4. Mol Cell Biochem. 2013. PMID: 23124897 - Molecular mechanisms underlying the time-dependent autophagy and apoptosis induced by nutrient depletion in multiple myeloma: a pilot study.
Liu Y, Chen Y, Wen L, Cui G. Liu Y, et al. J Huazhong Univ Sci Technolog Med Sci. 2012 Feb;32(1):1-8. doi: 10.1007/s11596-012-0001-2. Epub 2012 Jan 27. J Huazhong Univ Sci Technolog Med Sci. 2012. PMID: 22282237
References
- Angel P, Karin M. The role of Jun, Fos and the AP-1 complex in cell-proliferation and transformation. Biochim Biophys Acta. 1991;1072:129–157. - PubMed
- Angel P, Imagawa M, Chiu R, Stein B, Imbra RJ, Rahmsdorf HJ, Jonat C, Herrlich P, Karin M. Phorbol ester-inducible genes contain a common cis element recognized by a TPA-modulated trans-acting factor. Cell. 1987;49:729–739. - PubMed
- Bates S, Vousden KH. p53 in signaling checkpoint arrest or apoptosis. Curr Opin Genet Dev. 1996;6:12–19. - PubMed
- Beijersbergen RL, Carlee L, Kerkhoven RM, Bernards R. Regulation of the retinoblastoma protein-related p107 by G1 cyclin complexes. Genes & Dev. 1995;9:1340–1353. - PubMed
Publication types
MeSH terms
Substances
LinkOut - more resources
Full Text Sources
Other Literature Sources
Research Materials
Miscellaneous
