Expression profiling of renal epithelial neoplasms: a method for tumor classification and discovery of diagnostic molecular markers - PubMed (original) (raw)
Expression profiling of renal epithelial neoplasms: a method for tumor classification and discovery of diagnostic molecular markers
A N Young et al. Am J Pathol. 2001 May.
Erratum in
- Am J Pathol 2002 Jun;160(6):2311
Abstract
The expression patterns of 7075 genes were analyzed in four conventional (clear cell) renal cell carcinomas (RCC), one chromophobe RCC, and two oncocytomas using cDNA microarrays. Expression profiles were compared among tumors using various clustering algorithms, thereby separating the tumors into two categories consistent with corresponding histopathological diagnoses. Specifically, conventional RCCs were distinguished from chromophobe RCC/oncocytomas based on large-scale gene expression patterns. Chromophobe RCC/oncocytomas displayed similar expression profiles, including genes involved with oxidative phosphorylation and genes expressed normally by distal nephron, consistent with the mitochondrion-rich morphology of these tumors and the theory that both lesions are related histogenetically to distal nephron epithelium. Conventional RCCs underexpressed mitochondrial and distal nephron genes, and were further distinguished from chromophobe RCC/oncocytomas by overexpression of vimentin and class II major histocompatibility complex-related molecules. Novel, tumor-specific expression of four genes-vimentin, class II major histocompatibility complex-associated invariant chain (CD74), parvalbumin, and galectin-3-was confirmed in an independent tumor series by immunohistochemistry. Vimentin was a sensitive, specific marker for conventional RCCs, and parvalbumin was detected primarily in chromophobe RCC/oncocytomas. In conclusion, histopathological subtypes of renal epithelial neoplasia were characterized by distinct patterns of gene expression. Expression patterns were useful for identifying novel molecular markers with potential diagnostic utility.
Figures
Figure 1.
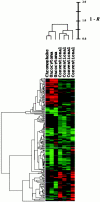
Hierarchical average linkage clustering of the seven renal tumors, based on expression patterns of the 189 differentially expressed genes. Expression patterns were analyzed using Cluster and TreeView software. In the color-coded grid, individual tumors and genes have been listed in the _x_- and _y_-axis, respectively. Each grid block shows the differential expression value determined by microarray for a specific gene in a particular tumor (relative to the tumor’s matched non-neoplastic kidney), with red indicating relative overexpression, green indicating relative underexpression, and black indicating similar expression levels in the tumor and non-neoplastic kidney. The brightness of red or green correlates with the degree of differential expression. The average linkage clustering algorithm grouped the tumors and genes by similarity of expression patterns and displayed the results in a dendrogram format. Items with similar expression profiles were placed into adjacent dendrogram nodes, connected by branches proportional in length to 1 minus the corresponding Pearson correlation coefficients (R). In the tumor dendrogram (x axis), the conventional RCCs and chromophobe RCC/oncocytomas were separated into two clusters represented by the two major dendrogram branches.
Figure 2.
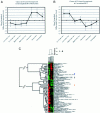
Quality Threshold (QT) clustering of the seven renal tumors and 189 differentially expressed genes in two dimensions. In the first dimension, the tumors were analyzed with a QT of 0.4, producing two clusters corresponding to conventional RCCs and chromophobe RCC/oncocytomas (data not shown). In the second dimension, the genes were analyzed with a QT of 0.6, producing 19 clusters of genes with similar expression patterns in the renal tumors. The two largest gene clusters were used for the data in this figure. A: The largest QT cluster contained 43 genes, which were characterized by overexpression in the chromophobe RCC/oncocytomas and underexpression in the conventional RCCs. The graph shows the means of the normalized, log2-transformed, differential expression levels for these 43 genes in each of the seven tumors, with standard deviations indicated by the error bars. As seen from this graph, the 43 genes showed highly correlated expression patterns in the series of renal tumors. B: The second largest QT cluster contained 22 genes, which tended to be overexpressed in the conventional RCCs and underexpressed in the chromophobe RCC/oncocytomas. The graph shows the means of the normalized, log2-transformed, differential expression levels for these 22 genes in each of the seven tumors, with standard deviations indicated by the error bars. The mean overexpression of these 22 genes was greater in the two low-grade conventional RCCs (Fuhrman grade II) than in the two high-grade tumors (Fuhrman grades III and IV). C: Hierarchical average linkage clustering of the seven renal tumors, based on expression patterns of the 65 genes in the two largest QT clusters. In the color-coded grid, the low-grade conventional RCCs are represented in the fourth and fifth columns and the high-grade conventional RCCs are represented in the sixth and seventh columns. Class II MHC-related genes (blue bar), genes encoding interferon-induced transmembrane proteins (black bar) and genes encoding homologous chloride channels (orange bar) were grouped into functionally related clusters (_y_-axis).
Figure 3.
Immunoperoxidase staining of renal tumor subtypes for vimentin (A–C) and CD74 (D–F). Reactions were visualized with the brown peroxidase substrate diaminobenzidine and counterstained with hematoxylin. A and D: Conventional RCC. B and E: Chromophobe RCC. C and F: Oncocytoma. Positive cytoplasmic staining for vimentin distinguished conventional RCC from chromophobe RCC/oncocytoma. CD74 staining was seen in conventional and chromophobe RCC but not oncocytoma. For both antigens, cytoplasmic staining was observed in tumors cells as well as tumor-associated stromal and endothelial cells. Original magnifications, ×200.
Figure 4.
Immunoperoxidase staining of renal tumor subtypes for parvalbumin (A–C) and galectin-3 (D–F). Reactions were visualized with the brown peroxidase substrate diaminobenzidine and counterstained with hematoxylin. A and D: Conventional RCC. B and E: Chromophobe RCC. C and F: Oncocytoma. Positive cytoplasmic staining for parvalbumin distinguished chromophobe RCC/oncocytoma from conventional RCC. Cytoplasmic galectin-3 staining was seen in low-grade conventional RCC, chromophobe RCC, and oncocytoma. Original magnifications, ×200.
Similar articles
- C-kit expression in renal oncocytomas and chromophobe renal cell carcinomas.
Huo L, Sugimura J, Tretiakova MS, Patton KT, Gupta R, Popov B, Laskin WB, Yeldandi A, Teh BT, Yang XJ. Huo L, et al. Hum Pathol. 2005 Mar;36(3):262-8. doi: 10.1016/j.humpath.2005.01.011. Hum Pathol. 2005. PMID: 15791570 - Molecular subclassification of kidney tumors and the discovery of new diagnostic markers.
Takahashi M, Yang XJ, Sugimura J, Backdahl J, Tretiakova M, Qian CN, Gray SG, Knapp R, Anema J, Kahnoski R, Nicol D, Vogelzang NJ, Furge KA, Kanayama H, Kagawa S, Teh BT. Takahashi M, et al. Oncogene. 2003 Oct 2;22(43):6810-8. doi: 10.1038/sj.onc.1206869. Oncogene. 2003. PMID: 14555994 - [Identification of prognostic parameters for renal cell carcinoma by cDNA arrays and cell chips].
Moch H, Schraml P, Bubendorf L, Mirlacher M, Kononen J, Gasser T, Mihatsch MJ, Kallioniemi OP, Sauter G. Moch H, et al. Verh Dtsch Ges Pathol. 1999;83:225-32. Verh Dtsch Ges Pathol. 1999. PMID: 10714215 German. - Molecular pathology of chromophobe renal cell carcinoma: a review.
Yusenko MV. Yusenko MV. Int J Urol. 2010 Jul;17(7):592-600. doi: 10.1111/j.1442-2042.2010.02558.x. Int J Urol. 2010. PMID: 20590942 Review. - Differentiation of oncocytoma from chromophobe renal cell carcinoma (RCC): can novel molecular biomarkers help solve an old problem?
Ng KL, Rajandram R, Morais C, Yap NY, Samaratunga H, Gobe GC, Wood ST. Ng KL, et al. J Clin Pathol. 2014 Feb;67(2):97-104. doi: 10.1136/jclinpath-2013-201895. Epub 2013 Oct 29. J Clin Pathol. 2014. PMID: 24170213 Review.
Cited by
- Accurate molecular classification of renal tumors using microRNA expression.
Fridman E, Dotan Z, Barshack I, David MB, Dov A, Tabak S, Zion O, Benjamin S, Benjamin H, Kuker H, Avivi C, Rosenblatt K, Polak-Charcon S, Ramon J, Rosenfeld N, Spector Y. Fridman E, et al. J Mol Diagn. 2010 Sep;12(5):687-96. doi: 10.2353/jmoldx.2010.090187. Epub 2010 Jul 1. J Mol Diagn. 2010. PMID: 20595629 Free PMC article. - [Galectin expression in urological cancer. Diagnostic, prognostic and therapeutic potential].
Waalkes S, Merseburger AS, Simon A, Serth J, Kuczyk MA. Waalkes S, et al. Urologe A. 2010 Mar;49(3):387-91. doi: 10.1007/s00120-009-2175-1. Urologe A. 2010. PMID: 20238481 German. - What can molecular pathology contribute to the management of renal cell carcinoma?
Stewart GD, O'Mahony FC, Powles T, Riddick AC, Harrison DJ, Faratian D. Stewart GD, et al. Nat Rev Urol. 2011 May;8(5):255-65. doi: 10.1038/nrurol.2011.43. Epub 2011 Apr 12. Nat Rev Urol. 2011. PMID: 21487387 Review. - Human copper-dependent amine oxidases.
Finney J, Moon HJ, Ronnebaum T, Lantz M, Mure M. Finney J, et al. Arch Biochem Biophys. 2014 Mar 15;546:19-32. doi: 10.1016/j.abb.2013.12.022. Epub 2014 Jan 6. Arch Biochem Biophys. 2014. PMID: 24407025 Free PMC article. Review. - Aberrant epithelial morphology and persistent epidermal growth factor receptor signaling in a mouse model of renal carcinoma.
Morris ZS, McClatchey AI. Morris ZS, et al. Proc Natl Acad Sci U S A. 2009 Jun 16;106(24):9767-72. doi: 10.1073/pnas.0902031106. Epub 2009 Jun 1. Proc Natl Acad Sci U S A. 2009. PMID: 19487675 Free PMC article.
References
- Landis SH, Murray T, Bolden S, Wingo PA: Cancer statistics, 1999. CA Cancer J Clin 1999, 49:8-31 - PubMed
- Zambrano NR, Lubensky IA, Merino MJ, Linehan WM, Walther MM: Histopathology and molecular genetics of renal tumors toward unification of a classification system. J Urol 1999, 162:1246-1258 - PubMed
- Wallace AC, Nairn RC: Renal tubular antigens in kidney tumors. Cancer 1972, 29:977-981 - PubMed
- Poston CD, Jaffe GS, Lubensky IA, Solomon D, Zbar B, Linehan WM, Walther MM: Characterization of the renal pathology of a familial form of renal cell carcinoma associated with von Hippel-Lindau disease: clinical and molecular genetic implications. J Urol 1995, 153:22-26 - PubMed
- Gnarra JR, Tory K, Weng Y, Schmidt L, Wei MH, Li H, Latif F, Liu S, Chen F, Duh FM: Mutations of the VHL tumour suppressor gene in renal carcinoma. Nat Genet 1994, 7:85-90 - PubMed
Publication types
MeSH terms
Substances
LinkOut - more resources
Full Text Sources
Other Literature Sources
Medical


