Advanced glycation end products cause epithelial-myofibroblast transdifferentiation via the receptor for advanced glycation end products (RAGE) - PubMed (original) (raw)
Advanced glycation end products cause epithelial-myofibroblast transdifferentiation via the receptor for advanced glycation end products (RAGE)
M D Oldfield et al. J Clin Invest. 2001 Dec.
Abstract
Tubulointerstitial disease, a prominent phenomenon in diabetic nephropathy, correlates with decline in renal function. The underlying pathogenic link between chronic hyperglycemia and the development of tubulointerstitial injury has not been fully elucidated, but myofibroblast formation represents a key step in the development of tubulointerstitial fibrosis. RAGE, the receptor for advanced glycation end products (AGEs), induces the expression of TGF-beta and other cytokines that are proposed to mediate the transdifferentiation of epithelial cells to form myofibroblasts. Here we report specific binding of (125)I-AGE-BSA to cell membranes prepared from a rat proximal tubule cell line and show that the binding site was RAGE. AGE exposure induced dose-dependent epithelial-myofibroblast transdifferentiation determined by morphological changes, de novo alpha smooth-muscle actin expression, and loss of epithelial E-cadherin staining. These effects could be blocked with neutralizing Ab's to RAGE or to TGF-beta. Transdifferentiation was also apparent in the proximal tubules of diabetic rats and in a renal biopsy from a patient with type 1 diabetes. The AGE cross-link breaker, phenyl-4,5-dimethylthiazolium bromide (ALT 711) reduced transdifferentiation in diabetic rats in association with reduced tubular AGE and TGF-beta expression. This study provides a novel mechanism to explain the development of tubulointerstitial disease in diabetic nephropathy and provides a new treatment target.
Figures
Figure 1
Binding of AGEs to NRK 52E cell membranes. Unlabeled AGE-BSA (filled squares) competed with 125I AGE-BSA for membrane binding; unglycated BSA (filled triangles) did not. Shown is one representative of five independent experiments. Maximal binding was defined as binding in the absence of competition and was 4.27 ± 0.4% of applied radioactivity. Nonspecific binding was defined as binding in the presence of maximal competition (10–4 M AGE-BSA) and was 7.7 ± 0.6% of maximal binding. B/Bo(%), % specific binding.
Figure 2
Ligand and Western blot analysis of NRK 52E membrane proteins. (a) Ligand blot analysis of membrane preparations, SDS-12% PAGE, using 125I AGE-BSA revealed major binding sites sized 35 kDa and 21 kDa. (b) Competitive incubations of radioligand with AGE-proteins (AB, AGE-BSA; AR_,_ AGE-RNase) and unglycated proteins (B, BSA; R, RNase), all 100 μg/ml, demonstrating AGE binding specificity. Western blotting of cell membrane proteins using anti-human RAGE Ab (c), and anti-human lysozyme (d and e). Lysozyme (10 μg) was used as positive control (e). The migration of molecular-weight markers run simultaneously is indicated in kilodaltons.
Figure 3
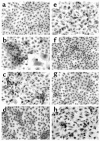
Exposure to AGEs causes a dose-dependent change in phenotype and antigen expression. After 6 days under experimental conditions, cultured cells were stained for α-SMA. (a) NRK 52E cells in media alone. (b) AGE-BSA (20 μM). Insert shows positive α-SMA staining in longitudinal microfilaments. (c) AGE-BSA (40 μm). (d) Unglycated BSA. (e) AGE-RNAse (100 μM). (f) AGE-BSA (40 μM) and Ab’s to the RAGE receptor, (g) TGF-β, and (h) control Ab’s. Original magnification, ×200; except insert in b, ×400.
Figure 4
Time- and dose-dependent α-SMA expression by NRK 52E cells. (a) Cells cultured in the presence of increasing concentrations of AGE-BSA or unglycated BSA, in the presence or absence of Ab’s to RAGE, TGF-β, or control Ab’s, were counted in three or more separate experiments. Represented are α-SMA +ve cells counted in ten or more high-power fields (×200) expressed as a percentage of total cell number (mean ± SEM). **P < 0.01, ***P < 0.001 compared with untreated cells. The observed increase in α-SMA staining with AGE-BSA (40 μM) was prevented by Ab’s to either RAGE (R) or to TGF-β (T), but not by control Ab’s (C). ##P < 0.01, ###P < 0.001 compared with AGE-BSA (40 μM). (b) Effects of exposure of NRK cells to AGE-BSA (40 μM) over time. Cells were examined at 2, 4, and 6 days in three or more separate experiments; **P < 0.01, ***P < 0.001 compared with 0 days. (c) Effects of exposure of NRK cells to CML-modified BSA. Variously, CML-modified BSA was prepared by incubating BSA with sodium cyanoborohydride, in the presence or absence of glyoxylic acid. Incubation of NRK cells in the presence of CML-BSA (200 μM) caused a modification-dependent increase in α-SMA staining. Shown are results of three or more independent experiments; degree of lysine modification versus SMA positive cells as percentage of total cell number (mean ± SEM). *P < 0.05, **P < 0.01.
Figure 5
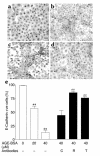
E-cadherin expression is lost in cells cultured with AGE-BSA. After 6 days under experimental conditions, cells were stained for E-cadherin. (a) NRK 52E cells grown in media alone. (b) Culture with AGE-BSA (20 μM), (c) AGE-BSA (40 μM). (d) Cells cultured with AGE-BSA (40 μM) and neutralizing Ab to RAGE. Original magnification, ×200. (e) E-cadherin quantitation. Cells expressing E-cadherin were counted in six or more high-power fields (×400) and expressed as a percentage of total cell number (mean ± SEM). Coincubation in the presence of Ab’s to RAGE (R) or TGF-β (T) abrogated the expected E-cadherin loss, whereas control Ab’s (C) did not. **P < 0.01 compared with untreated cells; ##P < 0.01 compared with AGE-BSA (40 μM) by ANOVA.
Figure 6
Effect of AGE-BSA exposure on total TGF-β production. Total TGF-β levels were measured by ELISA (mean ± SEM). AGE-BSA, but not BSA, exposure caused a dose-dependent increase in TGF-β protein levels at 3 days that was abrogated by the presence of either Ab’s to RAGE (R) or TGF-β (T), but not by control Ab’s (C). *P < 0.05, **P < 0.01 vs. AGE-BSA (0 μM); #P < 0.05, ##P < 0.01 vs. AGE-BSA (40 μM) by ANOVA.
Figure 7
In vivo α-SMA staining in the tubules of chronically diabetic rats. Kidney sections from WKY rats (control, 16- and 24-week diabetic) were stained for α-SMA with a PAS counterstain. (a) In control animals α-SMA staining was limited to vascular smooth muscle cells (arrow). Diabetes was associated with an increase in tubular α-SMA expression at all time points: (b) 16 weeks and (c) 24 weeks of diabetes, α-SMA +ve cell with a fibroblast phenotype within a disrupted proximal tubule (arrows). Original magnification, ×1,000. Distal tubular staining was seen rarely (d) (arrows). (e) Proximal tubules were counted in control and diabetic WKY rat kidney sections (masked for identity, 20 high-power fields, ×400; n ≥ 4 per group). The number of tubules containing α-SMA–positive cells is shown as a percentage of total tubule number (mean ± SEM). ***P < 0.001 compared with age-matched control using unpaired t test.
Figure 8
AGE and RAGE immunostaining in WKY rats. Kidney sections from 24-week WKY control and diabetic rats were stained for the presence of AGEs (a and b) and RAGE (c and d).
Figure 9
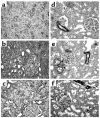
In vivo AGE and α-SMA staining in the tubules of chronically diabetic rats. Kidney sections from SD rats, control, 32-week diabetic, and 32-week diabetic that received the AGE–cross-link breaker, ALT 711 (n = 5 each group), were stained for AGE and separately for α-SMA. Representative pictures of AGE staining in (a) control, (b) diabetic, and (c) diabetic animals that received ALT 711. (d and e) α-SMA staining. In control animals α-SMA staining was limited to vascular smooth muscle cells (d). Diabetes was associated with an increase in tubular α-SMA staining (e) (arrowheads) that was ameliorated in diabetic animals receiving ALT 711 (f). P < 0.05, magnification for all ×400.
Figure 10
Quantitation of in vivo α-SMA and TGF-β staining. Kidney sections from SD rats, control, 32-week diabetic, and 32-week diabetic + ALT 711 (n = 5 each) were examined. (a) The number of α-SMA +ve tubules counted in 20 or more high-power fields (×200; ≥ 600 tubules) is expressed as a percentage of total tubule number. ***P < 0.001 compared with control, #P < 0.05 compared with diabetic, using unpaired t test. (b) In addition, the number of individual tubular cells that stained for α-SMA in affected tubules were counted and are expressed as a percentage of total tubular cell number, ##P < 0.01 compared with diabetic. (c) TGF-β immunostaining. Diabetes was associated with a significant increase in TGF-β immunostaining that was ameliorated, but not normalized by ALT 711 treatment. The tubular TGF-β staining was quantitated by a computer-based imaging system. Results are expressed as a proportion of total area; n = 5 animals per group.
Figure 11
TGF-β immunostaining in the SD rats. Diabetes was associated with a marked increase in TGF-β immunostaining (b) when compared with controls (a). This increase was ameliorated by treatment with ALT 711 (c). Representative pictures are shown at magnification ×400.
Figure 12
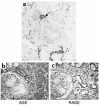
Evidence of transdifferentiation in a case of human diabetic nephropathy. A patient with type 1 diabetes of 15 years’ duration was diagnosed with nodular diabetic glomerulosclerosis and moderate interstitial fibrosis and tubular atrophy upon biopsy. (a) Clear cytoplasmic immunostaining for α-SMA is apparent in a single epithelial cell (arrow) within an intact tubule. (b and c) AGE and RAGE immunostaining. A postmortem kidney section from a patient with diabetic nephropathy and Kimmelstiel-Wilson nodules was stained for AGE (b) and RAGE (c).Original magnification for all ×400.
Similar articles
- Myofibroblast transdifferentiation of mesothelial cells is mediated by RAGE and contributes to peritoneal fibrosis in uraemia.
De Vriese AS, Tilton RG, Mortier S, Lameire NH. De Vriese AS, et al. Nephrol Dial Transplant. 2006 Sep;21(9):2549-55. doi: 10.1093/ndt/gfl271. Epub 2006 Jun 6. Nephrol Dial Transplant. 2006. PMID: 16757496 - Advanced glycation end products induce tubular epithelial-myofibroblast transition through the RAGE-ERK1/2 MAP kinase signaling pathway.
Li JH, Wang W, Huang XR, Oldfield M, Schmidt AM, Cooper ME, Lan HY. Li JH, et al. Am J Pathol. 2004 Apr;164(4):1389-97. doi: 10.1016/S0002-9440(10)63225-7. Am J Pathol. 2004. PMID: 15039226 Free PMC article. - Tubular epithelial-myofibroblast transdifferentiation mechanisms in proximal tubule cells.
Lan HY. Lan HY. Curr Opin Nephrol Hypertens. 2003 Jan;12(1):25-9. doi: 10.1097/00041552-200301000-00005. Curr Opin Nephrol Hypertens. 2003. PMID: 12496662 Review. - AGE-RAGE and AGE Cross-link interaction: important players in the pathogenesis of diabetic kidney disease.
Jensen LJ, Østergaard J, Flyvbjerg A. Jensen LJ, et al. Horm Metab Res. 2005 Apr;37 Suppl 1:26-34. doi: 10.1055/s-2005-861360. Horm Metab Res. 2005. PMID: 15918107 Review.
Cited by
- Advanced glycation end products and oxidative stress in type 2 diabetes mellitus.
Nowotny K, Jung T, Höhn A, Weber D, Grune T. Nowotny K, et al. Biomolecules. 2015 Mar 16;5(1):194-222. doi: 10.3390/biom5010194. Biomolecules. 2015. PMID: 25786107 Free PMC article. Review. - TGFbeta1 induces epithelial-mesenchymal transition, but not myofibroblast transdifferentiation of human kidney tubular epithelial cells in primary culture.
Forino M, Torregrossa R, Ceol M, Murer L, Della Vella M, Del Prete D, D'Angelo A, Anglani F. Forino M, et al. Int J Exp Pathol. 2006 Jun;87(3):197-208. doi: 10.1111/j.1365-2613.2006.00479.x. Int J Exp Pathol. 2006. PMID: 16709228 Free PMC article. - A glimpse of matrix metalloproteinases in diabetic nephropathy.
Xu X, Xiao L, Xiao P, Yang S, Chen G, Liu F, Kanwar YS, Sun L. Xu X, et al. Curr Med Chem. 2014;21(28):3244-60. doi: 10.2174/0929867321666140716092052. Curr Med Chem. 2014. PMID: 25039784 Free PMC article. Review. - Renal fibrosis.
Cho MH. Cho MH. Korean J Pediatr. 2010 Jul;53(7):735-40. doi: 10.3345/kjp.2010.53.7.735. Epub 2010 Jul 31. Korean J Pediatr. 2010. PMID: 21189948 Free PMC article. - Increased AGE-RAGE ratio in idiopathic pulmonary fibrosis.
Machahua C, Montes-Worboys A, Llatjos R, Escobar I, Dorca J, Molina-Molina M, Vicens-Zygmunt V. Machahua C, et al. Respir Res. 2016 Nov 5;17(1):144. doi: 10.1186/s12931-016-0460-2. Respir Res. 2016. PMID: 27816054 Free PMC article.
References
- Brownlee M, Vlassara H, Cerami A. Nonenzymatic glycosylation and the pathogenesis of diabetic complications. Ann Intern Med. 1984;101:527–537. - PubMed
- Soulis-Liparota T, Cooper M, Papazoglou D, Clarke B, Jerums G. Retardation by aminoguanidine of development of albuminuria, mesangial expansion, and tissue fluorescence in streptozocin-induced diabetic rat. Diabetes. 1991;40:1328–1334. - PubMed
- Neeper M, et al. Cloning and expression of a cell surface receptor for advanced glycosylation end products of proteins. J Biol Chem. 1992;267:14998–15004. - PubMed
MeSH terms
Substances
LinkOut - more resources
Full Text Sources
Other Literature Sources
Medical


